Theoretical and experimental investigation of electricity generation through footstep tiles
-
Muhammad Asif

 ,
Faisal Iqbal
,
Faisal Iqbal

Abstract
The current study aims to utilize population expansion by introducing a specially designed footsteps tiles mechanism capable of converting kinetic energy from footsteps into electricity. A rack and pinion mechanism was implemented due to its straightforward installation process and relatively high-power generation. However, addressing user comfort was crucial, as the mechanism caused significant deflections. As a result, a footstep tile mechanism was devised, manufactured, and thoroughly examined through both experimental and simulation methods. The CAD design of the mechanism was developed in SOLIDWORKS, dynamic models were created, and the system characteristics were analyzed using the simulation tool SIMULINK MATLAB®. Based on the optimal design obtained through dynamic simulations, the mechanism was fabricated, tested, and analyzed. The testing phase demonstrated an average of 9 V generated per footstep, yielding an estimated mechanical output power of 8.5 W per footstep, with a mechanical-to-electrical conversion efficiency of 15.6 %. The proposed setup presents a promising roadmap for large-scale electricity generation in densely populated areas such as institutes, hospitals, railway stations, and similar locations.
1 Introduction
In the era of globalization, the global population is steadily increasing, leading to a significant rise in electricity demand. However, relying solely on non-renewable energy sources is no longer viable due to their unsustainable nature and negative environmental impact (EnergySage). Human locomotion, often overlooked as an energy source, offers a promising solution to the worldwide electricity shortage. Each footstep holds untapped energy, ranging from 2 to 20 W, depending on the walking style (Dalabeih, Haws, and Muhtaseb 2018; Hwang et al. 2015). By harnessing and utilizing this energy, numerous benefits can be unlocked (Jintanawan et al. 2020). Despite its seemingly small value, it can effectively meet various power requirements, especially with the advancement of low-power consumption electronic devices. Densely populated areas have the potential to generate substantial amounts of power. In perfect alignment with our objective, this method of energy extraction presents an environmentally friendly solution to power generation (Li and Strezov 2014).
Extensive research has been conducted worldwide on the extraction of energy from human footsteps. Sarala et al. (2020) explored a solution utilizing piezoelectric technology to harness energy from pedestrians’ footsteps. The generated electricity would be stored in a battery and automatically used to power streetlights at night, employing Light Dependent Resistors (LDRs). However, the power generated from this method was found to be only a few milliwatts. In another study by Nia, Zawawi, and Singh (2017), various energy extraction methods from pedestrians were compared, including on-body and on-pavement approaches. The output power generated by piezoelectric transducers was minimal. The study concluded that on-pavement harvesters were superior, with electromagnetic transduction harvesters producing more power, despite being more complex than piezoelectric ones. Furthermore, Kim et al. (2018) presented a self-powered floor tile using an optimized composite piezoelectric material system. Stepping on the tile generated 42 V peak output voltage and 11 μA current, remaining stable for 30 days. Yet, it had limited responsiveness to the weight of an average person (50–80 kg). The harvested energy from stepping on the tile was utilized to wirelessly transmit information to nearby electrical appliances. Moreover, Li and Strezov (2014) proposed a model for a potential application of piezoelectric energy harvesters, covering 3.1 % of the area with the highest pedestrian mobility using piezoelectric tiles. The modeling results indicate an approximate total energy harvest of 1.1 MWh/year from the optimized tile pavement. With possible improvements, it could potentially be elevated to 9.9 MWh/year. Implementing this model could meet nearly 0.5 % of the building’s annual energy needs. Similarly, Panthongsy et al. (2018) detailed the creation and assessment of an energy-harvesting floor tile that utilized PZT piezoelectric cantilevers. This system effectively con verted kinetic energy from human footsteps into useful work. The results showed that each footstep produced an average power of 1.24 mW and a total output energy of 3.49 mJ with an optimal load resistance of 74.44 kΩ. The achieved energy efficiency was 17.2 %. Additionally, Liu et al. (2018) developed an innovative energy-harvesting paver designed to capture energy from human footsteps. Through their experiments, they observed an average electrical power output of 3.6 W, peaking at 12 W during walking. Impressively, the paver harvested an average of 1.8 J of energy per step. Furthermore, the study explored potential applications in diverse areas. In a study by Bhatia et al. (2016) developed a paver utilizing rack and pinions, which achieved an average power output of 0.36 W. The top panel of this device demonstrated a displacement range of 13–38 mm. On the other hand, a company named “Waydip”, introduced their own energy-harvesting paver called “Waynergy,” which can harvest 0.3–0.6 J of energy per step (Panthongsy et al. 2018). Moreover, Birari et al. (2022) and Bhosale et al. (2017) explored mechanical approaches using rack and pinion setups coupled with a permanent magnet DC generator to harness the force of footsteps for energy generation. Ismail, Al-Muhsen, and Linganathan (2020) demonstrated a rack and pinion mechanism generating 34 W per footstep for a 75 kg person. Asad et al. (2019), Ang et al. (2019), and Kumar et al. (2018) also presented their unique designs for footsteps energy harvesters, incorporating various setups such as chain drives, alternators, and batteries. Additionally, Kharche et al. (2019) proposed power generation through a rack and pinion mechanism integrated into a speed breaker.
Based on the literature review conducted on the generation of electricity through footstep tiles, most of the research has focused on utilizing piezoelectric or hybrid combinations involving electromagnetic induction. However, most of these systems exhibit an overall efficiency of less than 20 % (Liu et al. 2018; Sharma et al. 2022), indicating a need for further improvement and a focus on critical factors to enhance system performance. Moreover, there is a scarcity of studies in the existing literature that offer a comprehensive analysis, both theoretical and experimental, of mechanical energy harvesting based on the rack and pinion mechanism (Gholikhani et al. 2020). Therefore, this present study introduces an innovative design for the rack and pinion mechanism, aiming to effectively harness energy from footstep tiles. The design underwent thorough theoretical and experimental examination. System performance was evaluated by varying the weight of individuals and the stiffness of the spring, measuring both the voltage generated under no-load conditions and the system efficiency.
2 Model description
2.1 Rack and pinion mechanism
The main objective of the footstep tile is to capture and convert the kinetic energy generated by footsteps into electrical energy using an electromagnetic generator. Figure 1 illustrates the fundamental working principle of the footstep tile. When an external force is applied to the tile, a mechanism is employed to transform its linear motion into the rotational motion of the electromagnetic generator, resulting in voltage generation. Figure 2 shows the final assembly of the fabricated model.
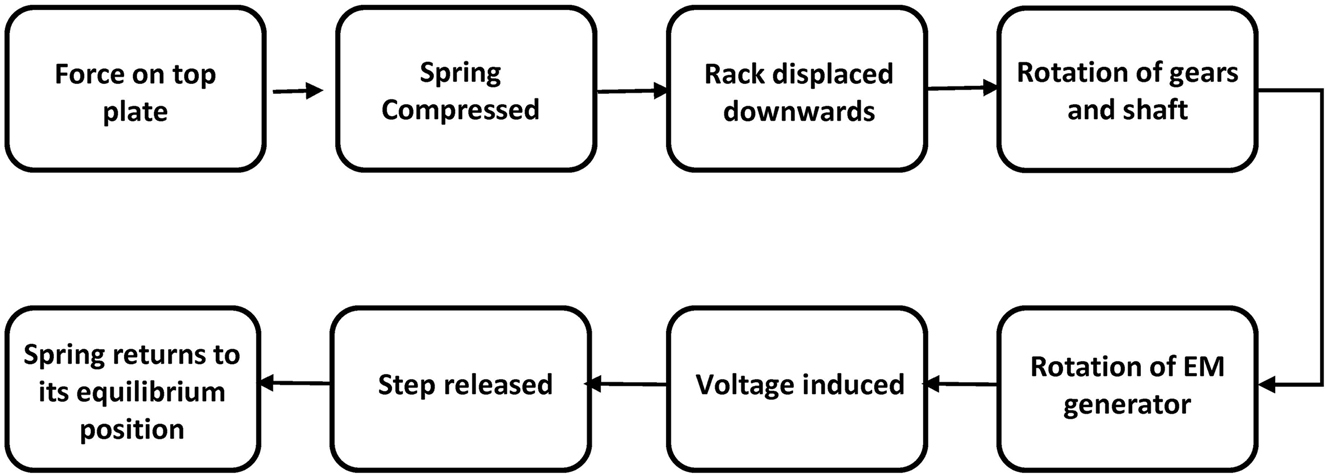
Working principle of footstep tiles.
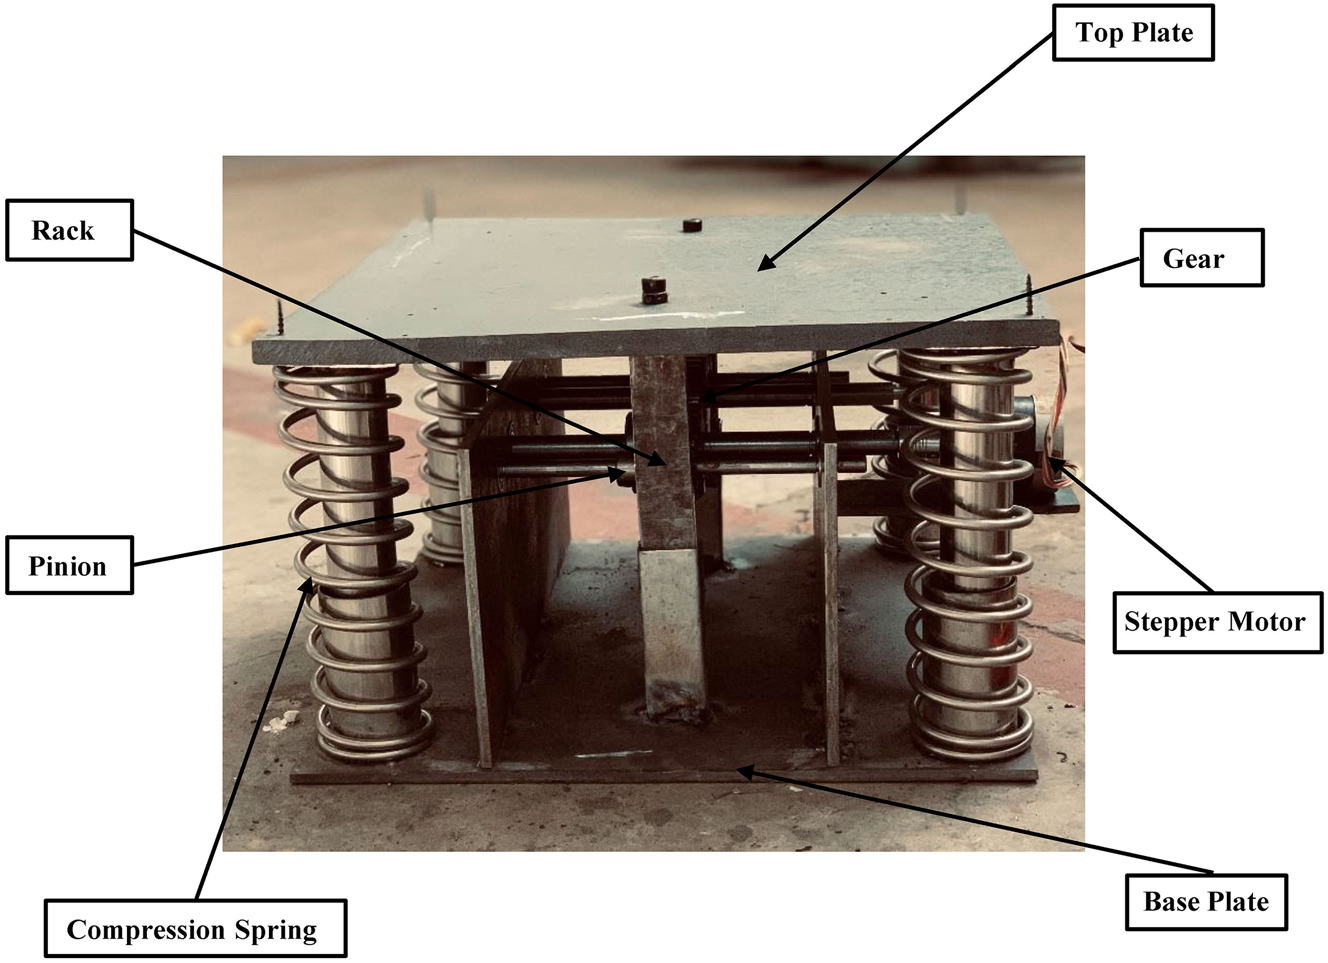
Exploded view of the assembly’s CAD model.
Our design incorporates a rack and pinion mechanism to accomplish this conversion. The rack and pinion system effectively translates the vertical displacement into the rotational motion of the shaft, subsequently driving the electromagnetic generator and inducing a voltage. Additionally, four springs connected to the corners of the footstep tile help restore the top plate to its equilibrium position as the force on the footstep diminishes gradually.
2.2 Governing equations
The modeling for an energy-harvesting footstep tile system using a single rack and pinion mechanism is as follows:
Newton’s Second Law is applied on the system based on the free body diagram as depicted in Figure 3:
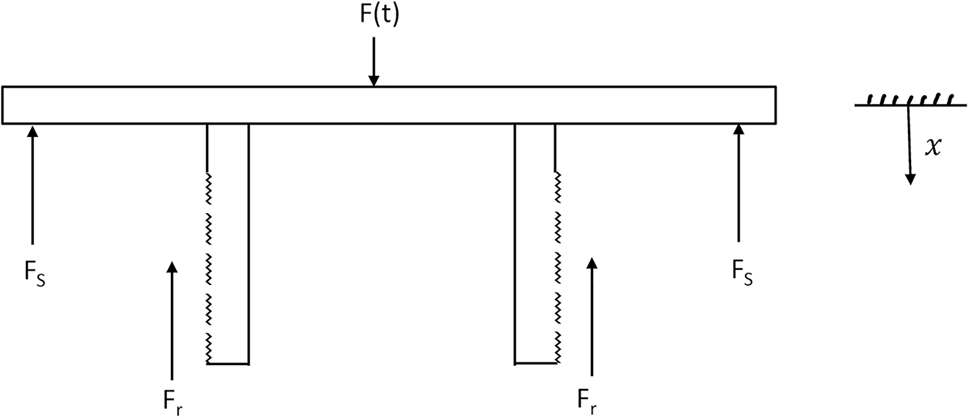
Free body diagram of optimized design.
The total mass of the system as well as all the forces acting on it are included in the model:
There are four springs within the system, resulting in the cumulative force exerted by the springs is as follows:
By implementing the substitutions, the following results are obtained:
An approach was implemented to modify and optimize the power output while staying within the set constraints. A model using two rack and pinion mechanisms as shown in Figure 2 , with an additional gear in the gear train was adopted instead of only single gear to increase output shaft power while using the same parameters. The modelling of the modified system is as follows:
Making similar substitutions as earlier, to convert translational parameters to linear ones, the following model is achieved:
The total output power from both shafts in the modified model is given by:
The design equations used for the analysis of the gear train are adopted from the reference (Budynas and Nisbett 2014). The gearing ratio used in the gear train m G is set to be 2.
The smallest spur pinion that will operate with a rack without interference is:
The smallest number of teeth on the pinion without interference is given by:
The following equation is used to evaluate the design parameters for the spring:
We can calculate the RPM of pinion by converting the pitch line velocity of the pinion in revolutions per minutes as follows:
with the help of gear ratio and torque applied on gear, we can calculate torque applied on pinion with the help of following relation:
The power transmitted by the pinion can be calculated as follows:
Using the transmitted torque T G , we can find the transmitted load as follows:
Now the tangential and radial loads on gear can be calculated using the following equations:
Using the following equation, we find the bending stress on the pinion:
Similarly, using the same equation to find the bending stress on the gear as follows:
Using the following equation to calculate pitting stress for the gear:
Where the radii of curvature of the tooth profiles at the pitch point are calculated to be as follows:
To calculate the value of Elastic Coefficient (C P ) we have used the following equation:
The catalogue load rating of bearing can be calculated as follows:
The effectiveness of the model can be determined by evaluating the system’s efficiency. This can be done by evaluating the total power input to the system and the total power output of the system.
The total power exerted by a footstep force can be evaluated as follows:
The total power output of the system can be evaluated by calculating the electrical power output.
The maximum power transferred from the source can be obtained by applying the maximum power transfer theorem (Sezer and Koç 2021):
The obtained power output values can be used to evaluate the mechanical, electrical and overall efficiency of the system.
The efficiency of the mechanical system can be approximated as follows:
The total system efficiency can be evaluated as follows:
2.3 Geometric modeling and design
The CAD model of the footstep energy harvester was prepared in SOLIDWORKS 2021. Figure 4 shows the exploded views of the final assembly of the mechanical components in the system. The major individual components include the top and bottom plates, guide rods, shafts, springs, bearings, gear train, and generator.
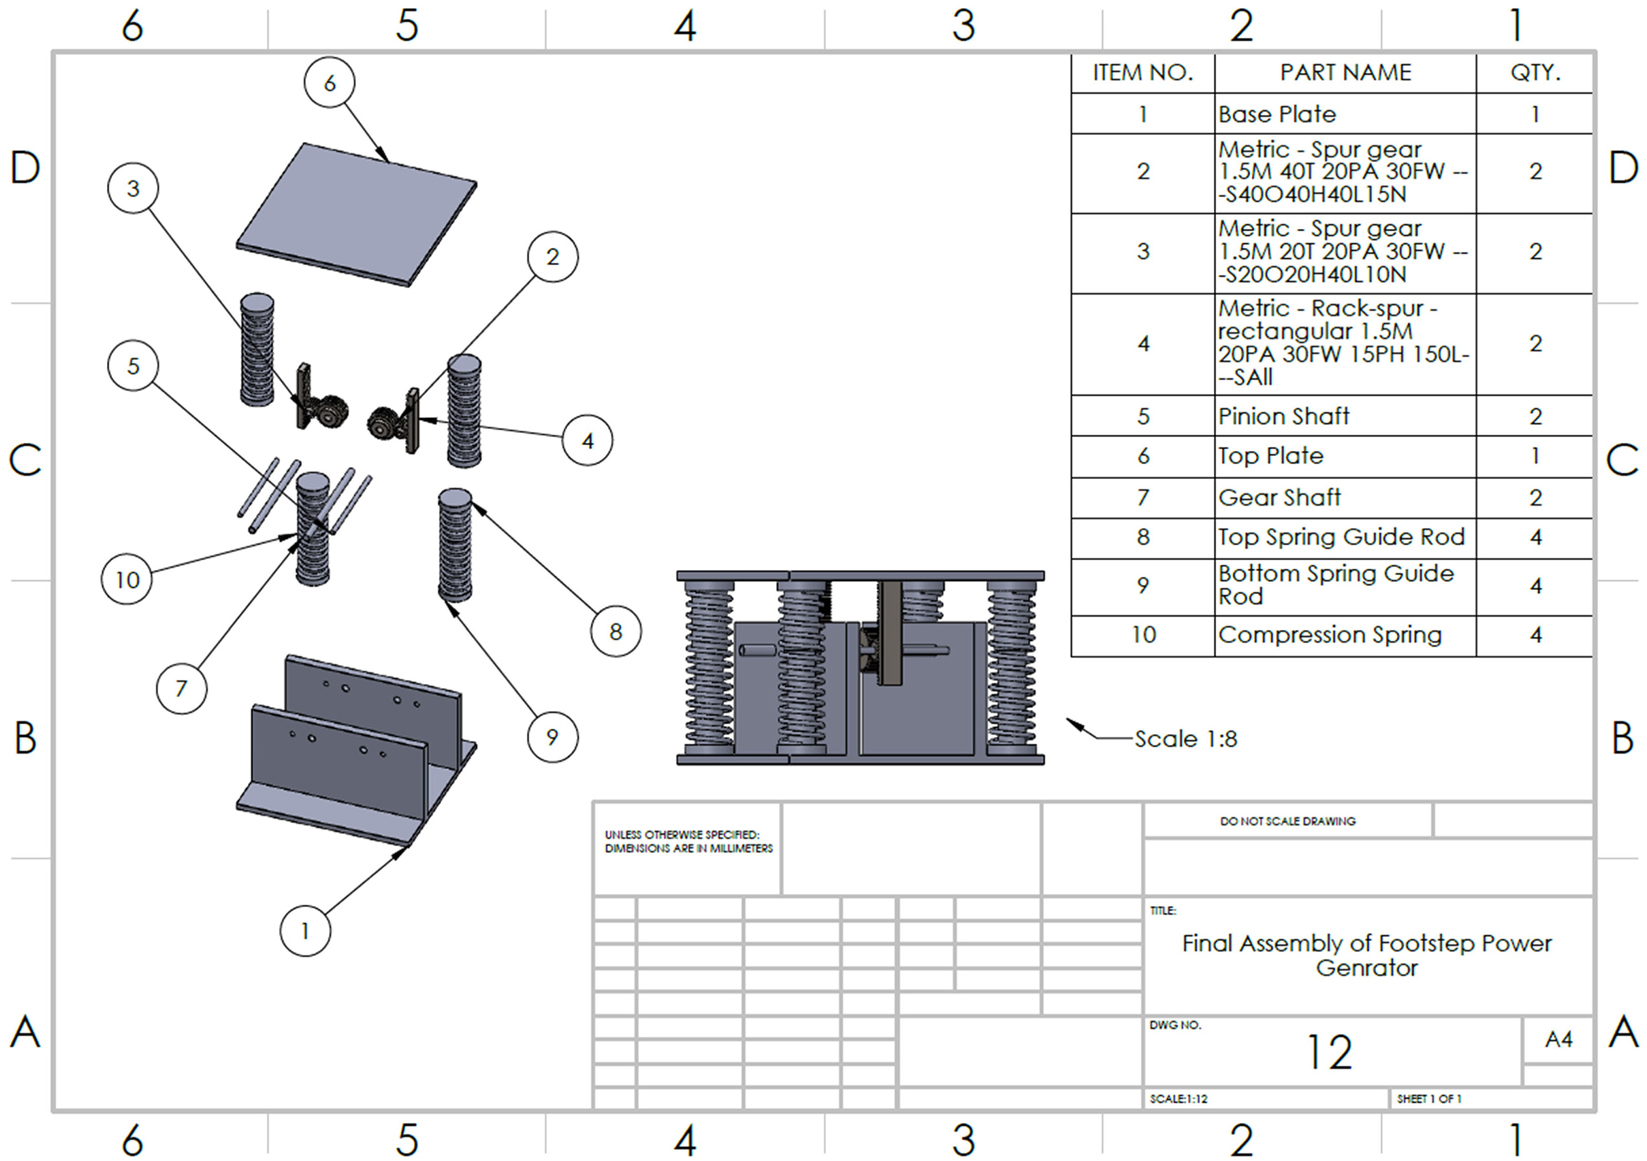
Exploded view of the assembly’s CAD model.
3 Results and discussion
The SIMULINK model presented in Figure 5 was utilized to assess the differential equations of the model. By utilizing the developed SIMULINK model, the mechanical power output was evaluated concerning displacement, pinion, and gear masses. The subsystem input function incorporates piecewise equations that generate the splines used to represent the input force. Due to the absence of damping in this model and its assumed highly underdamped nature with a damping coefficient of zero, the model’s graphs exhibit oscillatory responses.
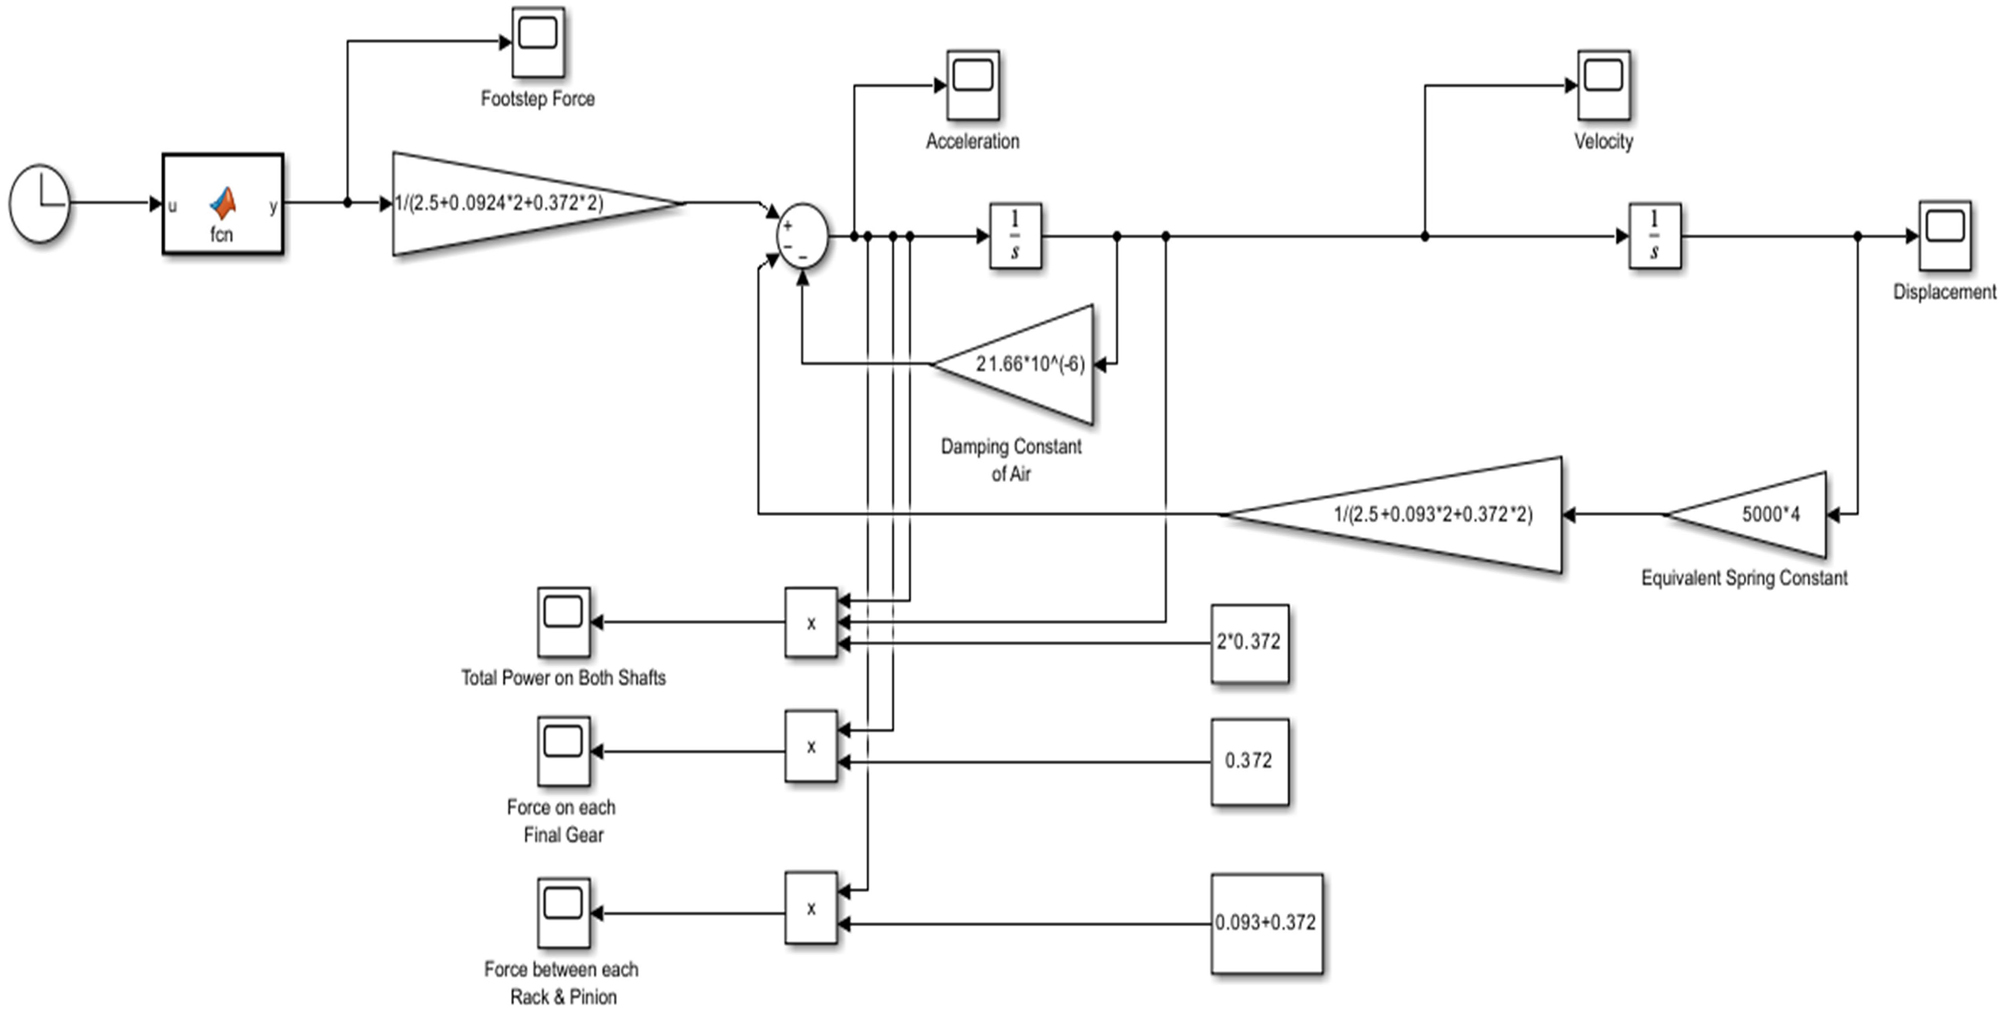
Block diagram of the developed mathematical model for footstep tiles setup in MATLAB Simulink.
3.1 Kinematic of footstep tile
In Figure 6, it can be observed that the velocity attains its highest peak at 0.7 m/s, followed by slight oscillations throughout the duration of the footstep. Figure 7 presents the vertical displacement of the tile upon the footstep being placed and subsequently removed. The greatest displacement occurs when the tile is subjected to the maximum force exerted by the footstep. As depicted in Figure 7, a maximum displacement of approximately 0.042 m (4.2 cm) is achieved, which falls comfortably within the designated design limits.
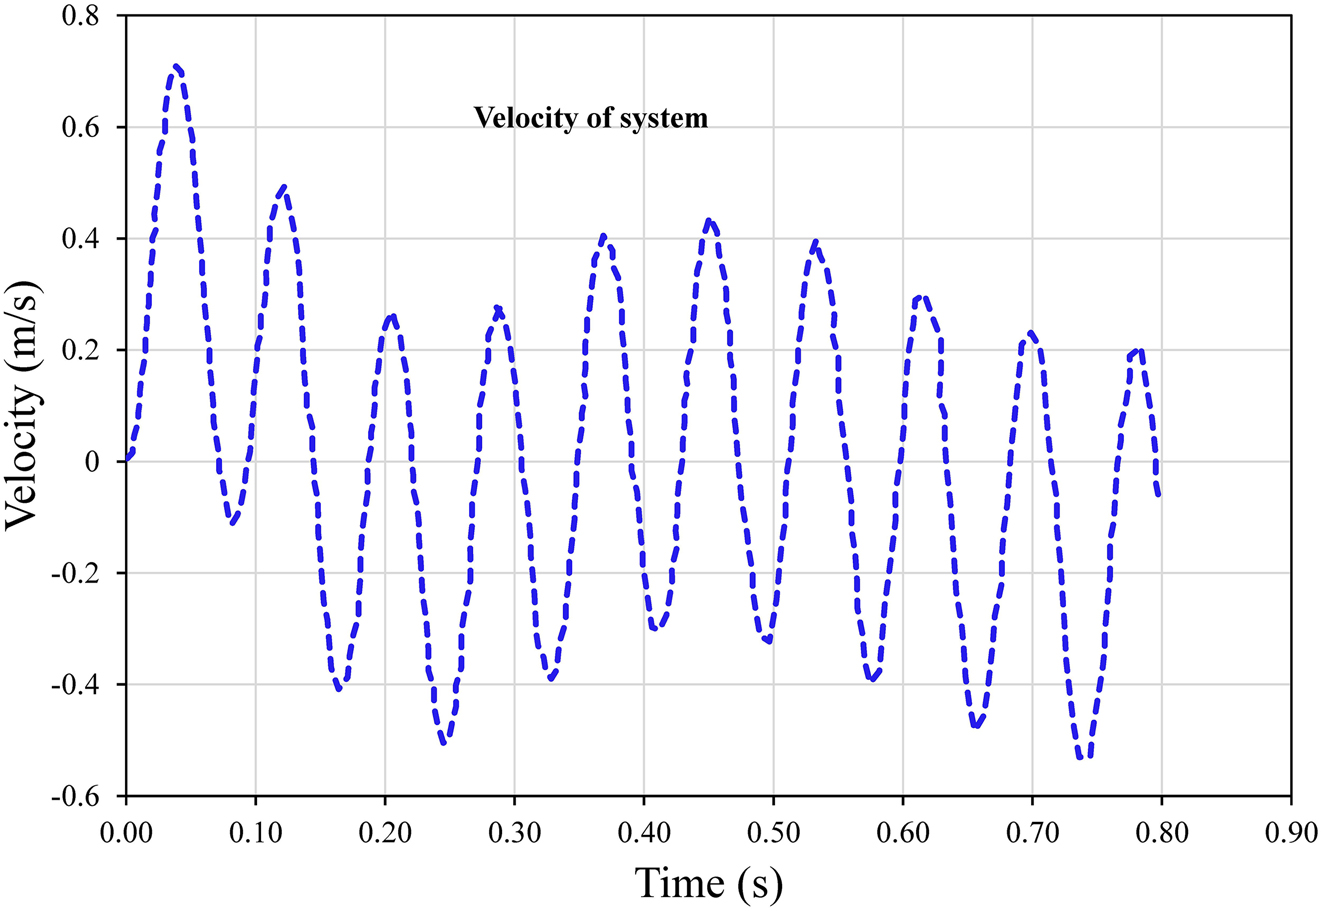
Time-dependent velocity analysis of the system using MATLAB Simulink for a 70 kg individual with a spring constant of 5000 N/m.
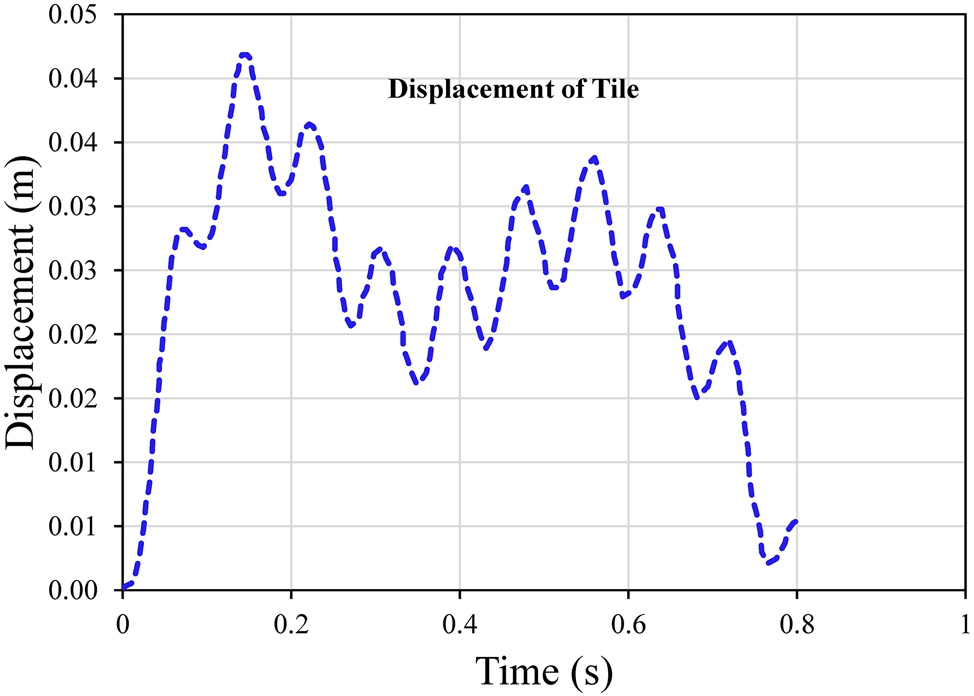
Time-dependent vertical displacement of tile simulated using MATLAB Simulink with an individual mass of 70 kg and a spring constant of 5000 N/m.
3.2 Kinetics of footstep tile
Spline functions, as depicted in Figure 8, were utilized to model the input force. In the beginning, the force applied to the footstep experiences a swift escalation upon the placement of the heel, gradually decreasing to align with the individual’s body weight. As the footstep is lifted, the force exerted by the toe gradually diminishes until it eventually dwindles down to zero.
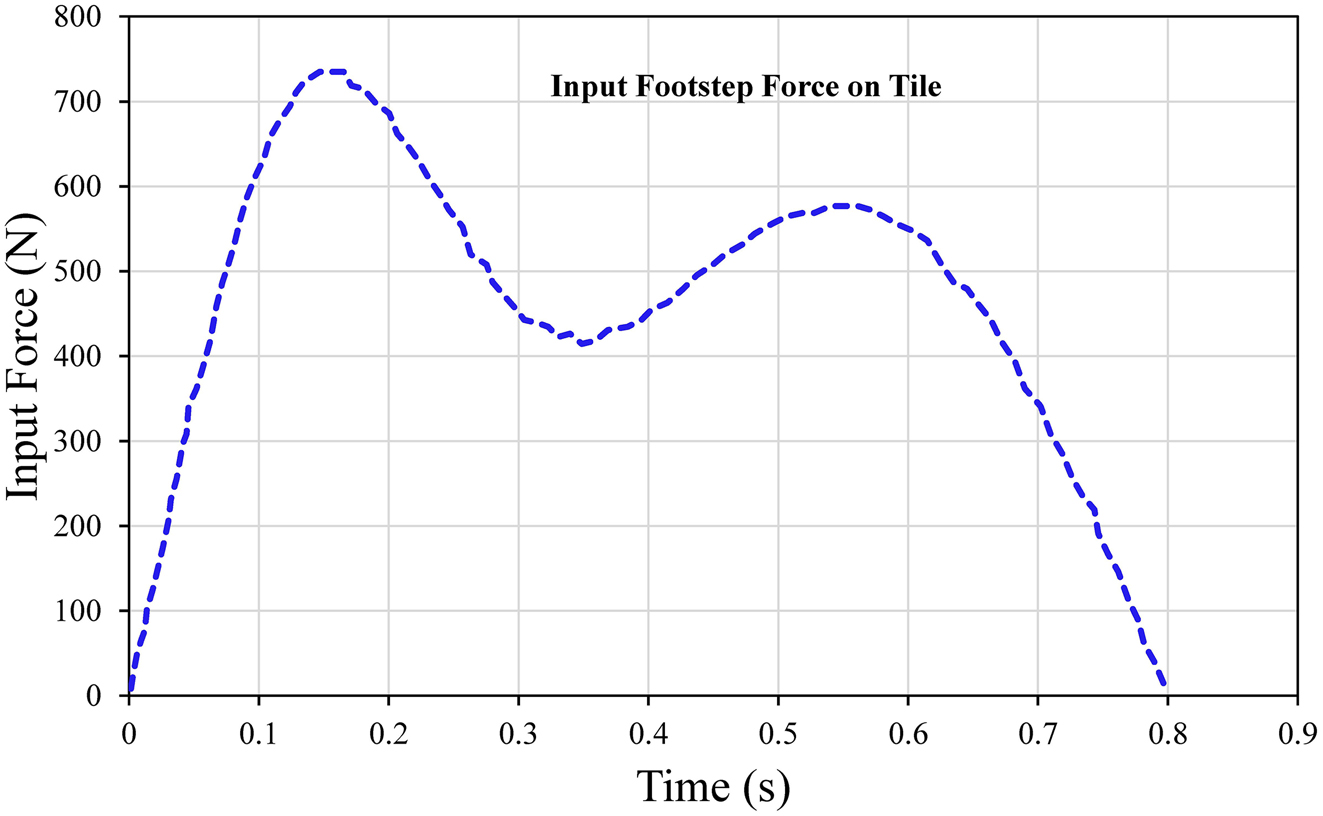
Simulation of footstep force over time using MATLAB Simulink with individual mass of 70 kg and spring constant of 5000 N/m.
Figure 9 displays the overall power output per footstep of the entire system when considering both output shafts together. It is worth noting that the power does not diminish since damping is not taken into account in this particular model, as previously mentioned. According to the design model, the combined maximum power output from both shafts is approximately 10 W, which translates to an estimated 4.5–5 W per shaft. Figures 10 and 11 illustrate the transmitted force between the pinion and final gear, and between the rack and pinion, respectively. The maximum transmitted force onto the final gear is approximately 10.5 N, while from the rack to the pinion, it is approximately 12.5 N. These values serve as essential components in all subsequent analyses and calculations. It is important to note that the transmitted force is significantly lower in comparison to the input footstep.
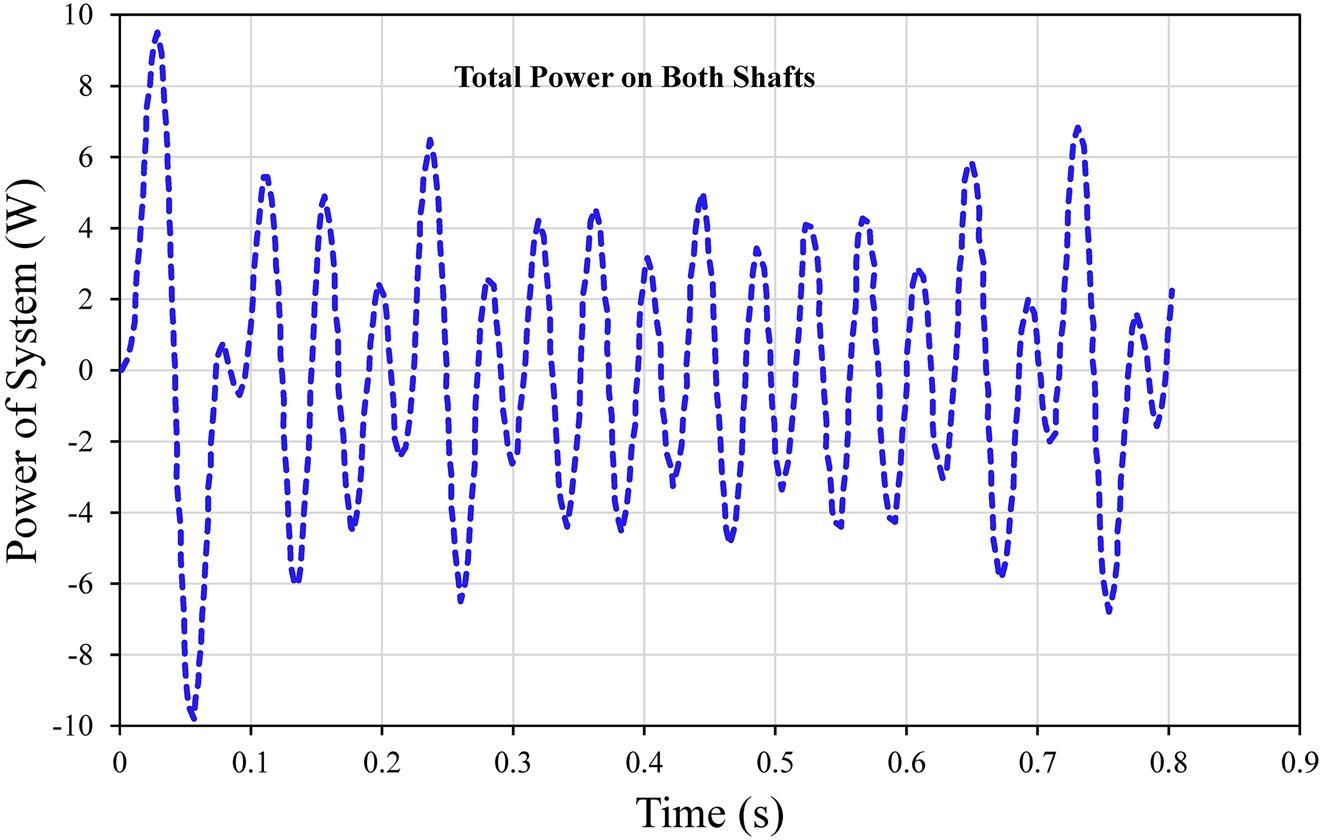
Power output of the system over time using MATLAB Simulink for a 70 kg individual with a spring constant of 5000 N/m.
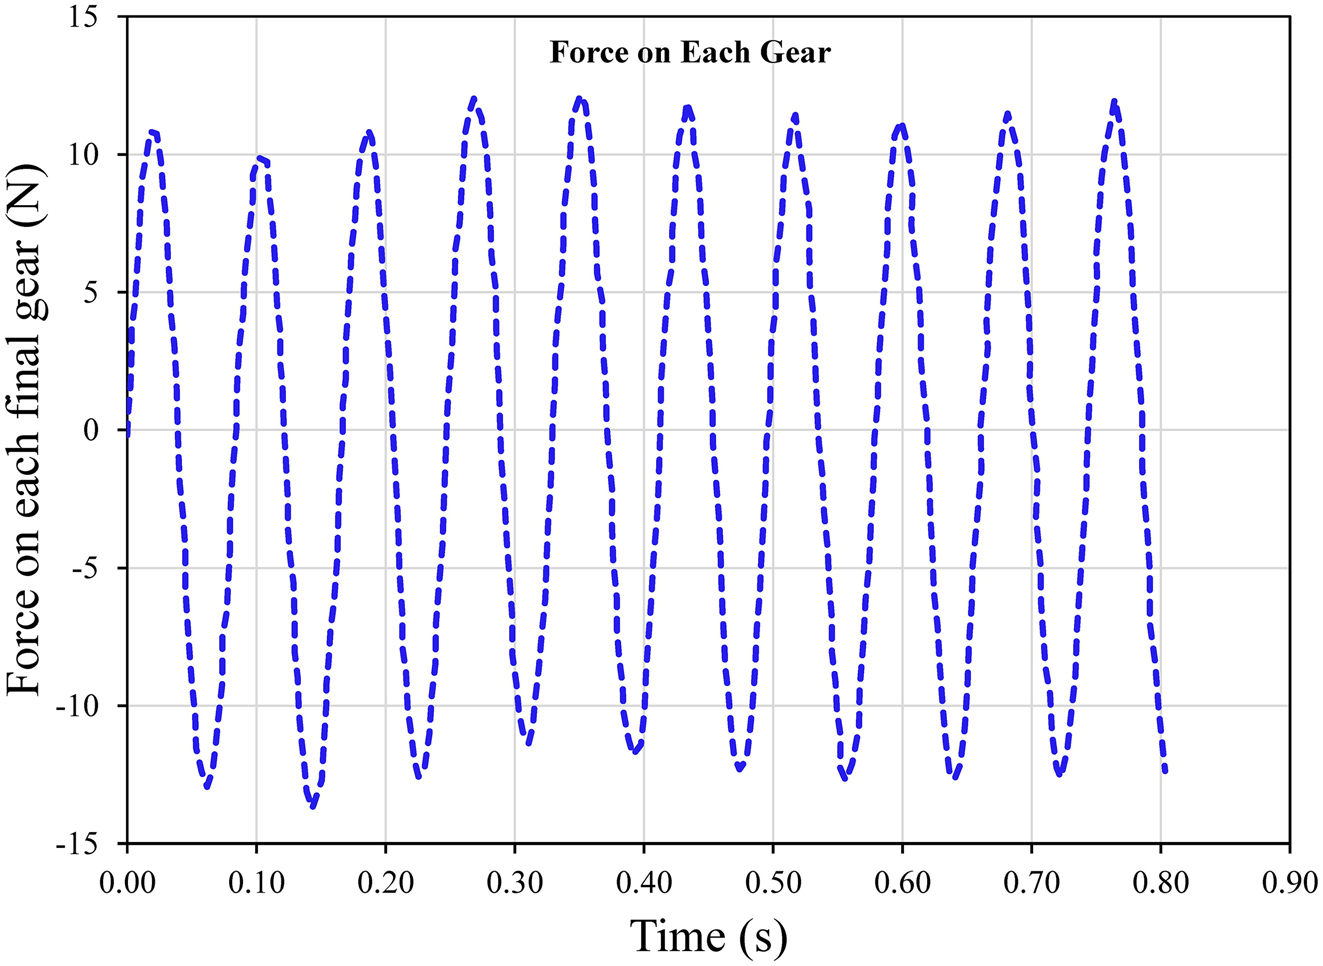
Illustrates the transmitted force between the pinion and final gear using MATLAB Simulink for a 70 kg individual with a spring constant of 5000 N/m.
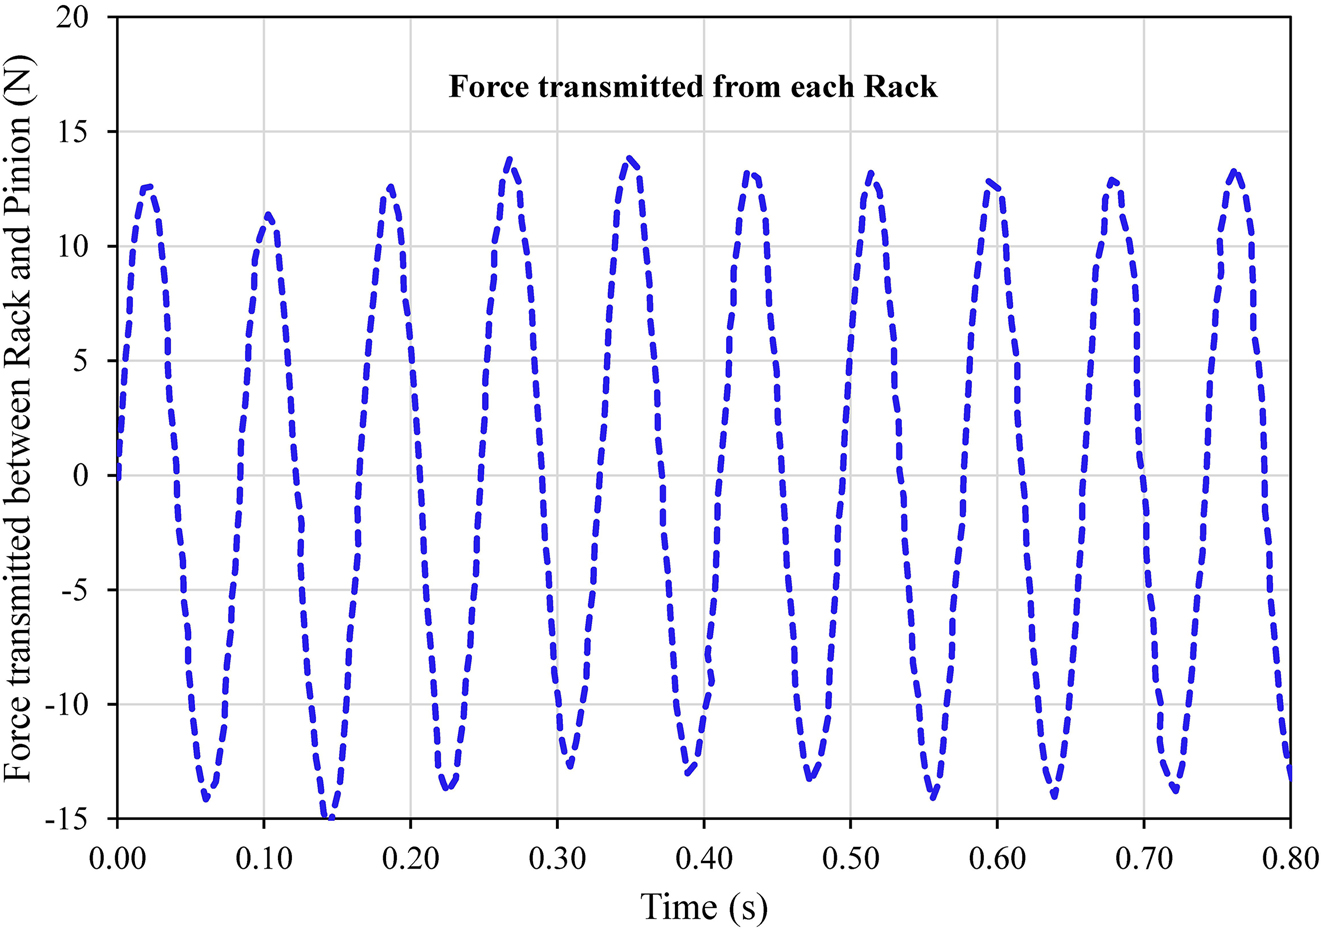
Illustrating transmitted force between rack and pinion using MATLAB Simulink for a 70 kg individual with a spring constant of 5000 N/m.
3.3 Impact of spring stiffness
The crucial factor to consider is the power generated by a single footstep. We have examined how the power is influenced by variations in the spring stiffness constant and the maximum allowable extension. Our analysis revolves around the assumption that the average mass of a person is 70 kg, and they take a step on this particular tile. Figure 12 demonstrates that altering the spring stiffness from 1000 N/m to 20,000 N/m results in a decrease in the total power generated by the footstep tile, from 100 W to 1.2 W. Similarly, as the stiffness value increases, the maximum allowable extension decreases from 21.5 cm to 1.07 cm. As shown, the power output has a direct relation with the displacement, however, very large displacements cannot be used as users’ stability will be a concern.
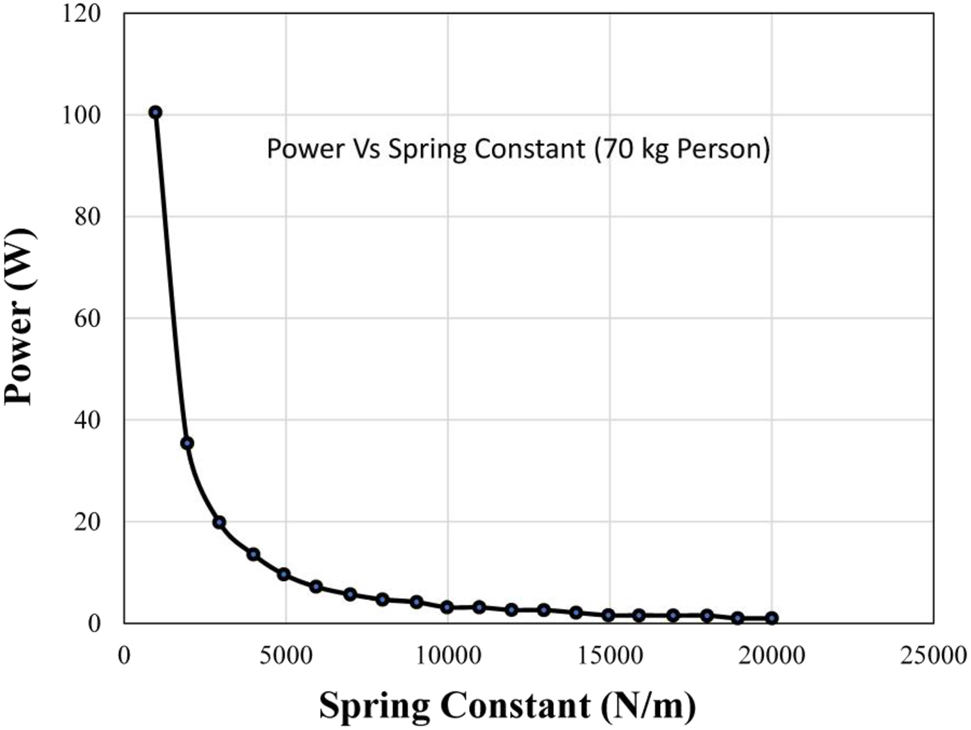
Power output plotted against spring constant for a 70 kg individual with a spring constant of 5000 N/m.
Figure 13 illustrates the direct relationship between the power generated and the maximum allowable extension. The choice of the spring stiffness constant was made based on optimizing power generation, stability, and user comfort when stepping on this tile. The selected value for the spring constant was 5000 N/m, which provided a maximum allowable extension of 4.3 cm and a total theoretical power of 10 W.
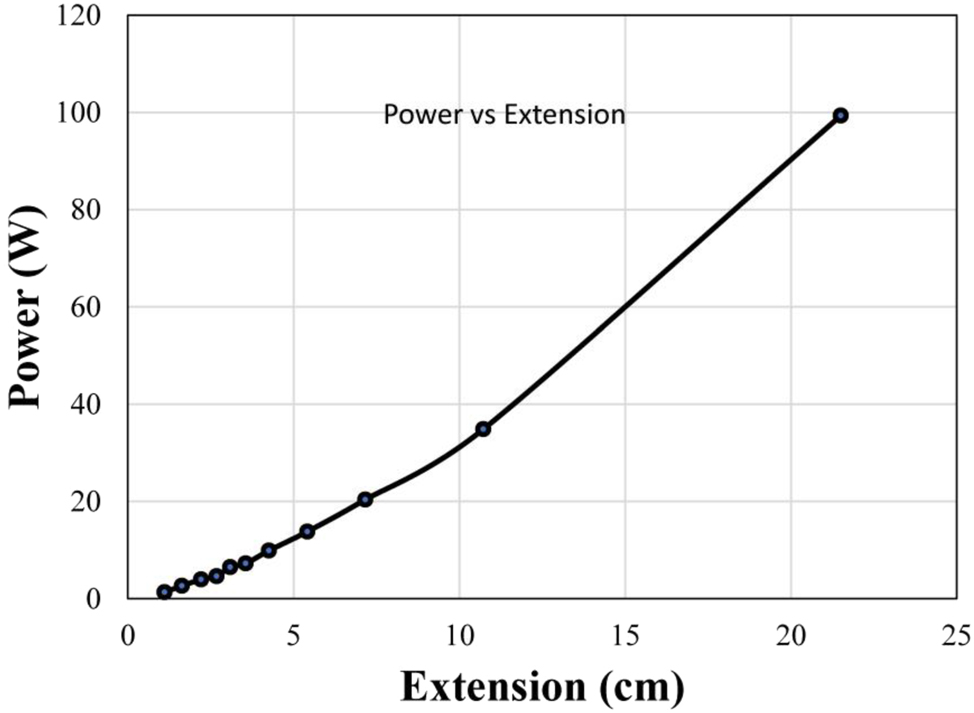
Power output plotted against extension for a 70 kg individual with a spring constant of 5000 N/m.
3.4 Impact of gear masses
Different equivalent masses
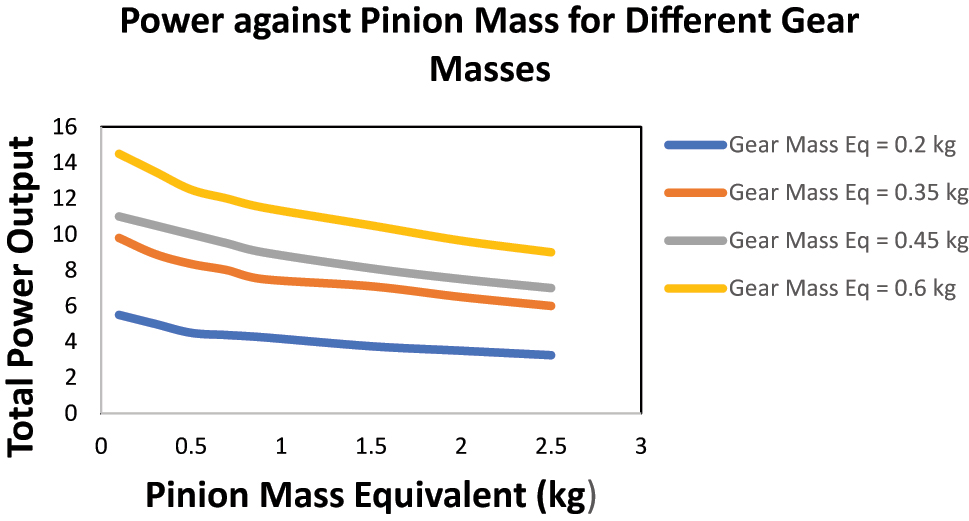
Power versus pinion mass for various gear masses with a spring constant of 5000 N/m.
Table 1 shows the specifications of each of the mechanical components to be used in the design. The dimensions of each component were derived from the SIMULINK results and the optimized system parameters.
Specifications of components and Simulink Results.
| Parameter | Symbol | Value |
|---|---|---|
| Radius of gear | r G | 3 cm |
| Radius of pinion | r P | 1.5 cm |
| Gear shaft diameter | d G | 15 mm |
| Gear shaft length | L G | 250 mm |
| Pinion shaft length | L P | 200 mm |
| Pinion shaft diameter | d P | 10 mm |
| Outer diameter of pinion bearing | OD | 30 mm |
| Bore diameter pinion bearing | D | 10 mm |
| Outer diameter of gear bearing | OD | 35 mm |
| Bore diameter gear bearing | D | 15 mm |
| Rotational inertia of gear | J G | 3.348 × 10⁻⁴ kg m2 |
| Rotational inertia of pinion | J P | 2.092 × 10⁻⁵ kg m2 |
| Radius of gear | r G | 3 cm |
| Radius of pinion | r P | 1.5 cm |
| Mass of rack | m r | 0.5 kg |
| Mass of top plate | m p | 2 kg |
| Spring constant | k | 5000 N/m |
| Damping constant of air | c | 21.66 × 10⁻⁶ kg/s |
The stepper motor being used as generator had its AC output connected to a full wave bridge rectifier circuit as shown in Figure 15 to produce a DC output voltage.

Two full wave bridge rectifiers connected in series for a 2-phase stepper motor.
The full bridge rectifier circuits were assembled on a breadboard to minimize the wiring in our final design. Two such breadboards were used to connect the two output phases for each of the two stepper motors. Once the two phases of each of the stepper motors were connected to the full wave bridge rectifier circuit, the DC output of these four bridges was connected in series using a breadboard to maximize the voltage output. This voltage output was recorded using a multimeter. After the complete connection of generators output was established, voltage readings were recorded for different weighing individuals using a digital multimeter (DMM). The following protocol was implemented during the test to record accurate and consistent readings:
The generator was mounted on a fixed/stable surface, to allow the generator shaft to rotate efficiently.
The generator was tightly locked in place using a zip-tie lock to minimize its vibration.
Load was applied such that all four springs deflected equally. This was done by ensuring that the foot was placed exactly in the middle of the tile.
Each test subject was weighed before recording their readings.
Each test subject started their walk at six footsteps from the tile while maintaining a normal walking speed.
The output readings for each subject were taken for 10 different trails and averaged to remove outlier results and increase precision.
After accounting for the necessary precautions, the tests were conducted. The voltage was measured across the output received from the rectifying circuits and the value noted was the peak voltage which was steadily maintained for a while due to the capacitors.
3.5 Peak no-load voltage
Figure 16 depicts the graphical representation of the acquired patterns and trends, aiming to provide a visual understanding of the obtained results. As anticipated, individuals with a higher body weight generated a greater peak output voltage. This outcome can be attributed to the fact that heavier individuals induce a relatively higher deflection of the tile and exert a greater force on the rotating gears.
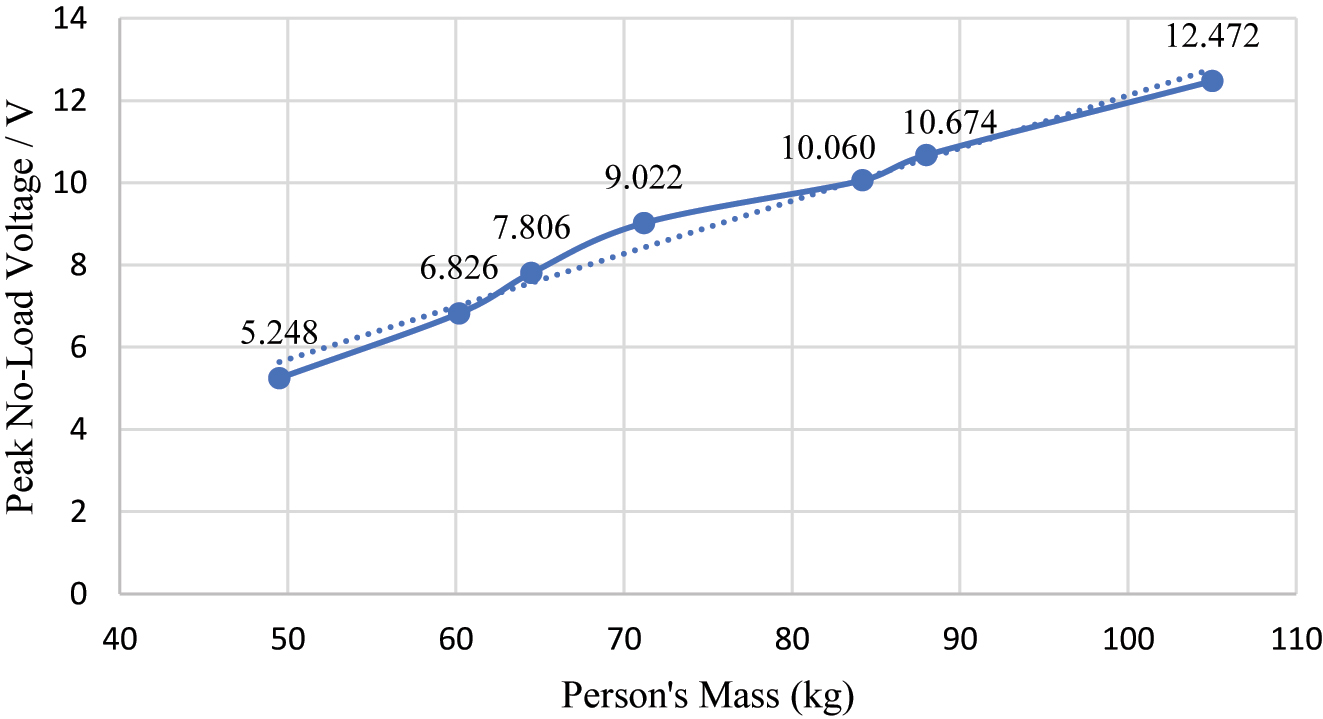
Peak no-load output voltage plotted against an individual’s mass for a 70 kg individual with a spring constant of 5000 N/m.
Consequently, a larger number of jerks occur, resulting in the development of increased torque over a slightly extended period. Additionally, the energy generated is stored in the capacitors within the circuit, rather than being instantly discharged. The measured electrical output, as determined by a voltmeter, is directly reflected in these experimental findings.
It is important to note that these results cannot be directly compared to the previous findings, which focused on the mechanical output of the system in terms of shaft rotation speed and produced torque. The simulations conducted did not account for the losses incurred during the conversion of mechanical power to electrical power.
The output power generated in the circuit with the LED showed a potential drop of 2.5 V and a current of 28 mA leading to a power drop of 0.07 W for this circuit. Furthermore, it was noted that by repeated footsteps on the tile, simulating a busy public place, the voltages were constantly generated and stored in the capacitor. This generated power does not need to be instantly used by applying an appliance to it but can also be stored in a battery or higher rated capacitor for later use. The results of our conducted experiment show that a high output voltage value is obtained which changes moderately with the weight of different individuals. Therefore, these results prove that the footstep tile model is reliable to be used on a large scale.
3.6 Performance of the footstep module
In Figure 17, it can be observed that mechanical efficiency gradually diminishes as the mass of an individual increases. This phenomenon occurs due to the concurrent rise in resistive forces, such as friction and contact forces between the components, as the applied force intensifies. As the resistive forces augment with weight, the restoring force of the springs also escalates. Consequently, when the foot is released and removed, the springs ascend with a greater force. As a result, higher torques are generated in the shafts, leading to amplified electrical outputs and thereby enhancing electrical efficiencies.
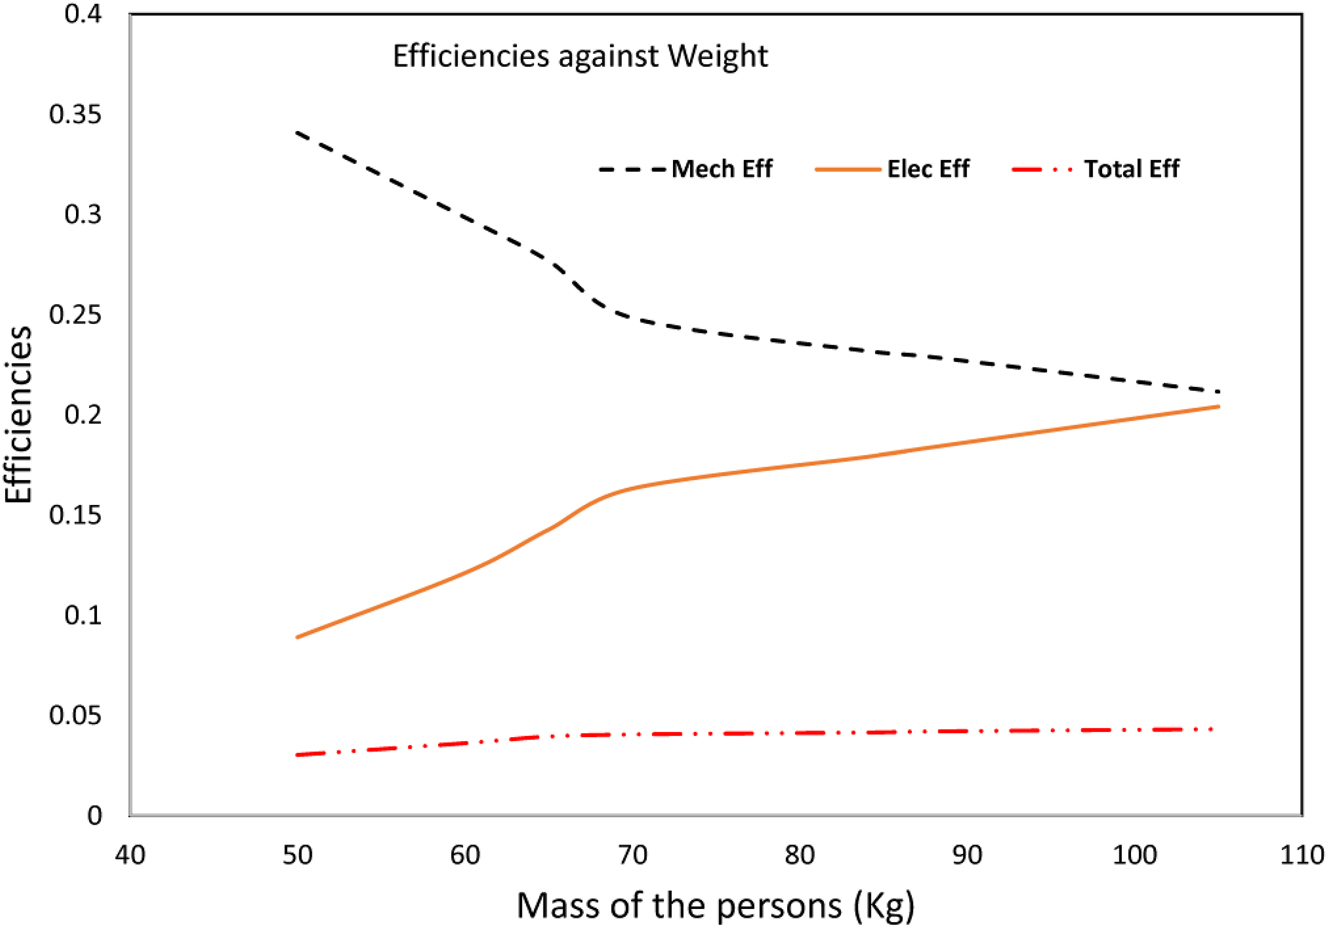
Footstep module’s effectiveness at varying individual masses with a spring constant of 5000 N/m.
Moreover, the increase in electrical efficiency outweighs the decrease in mechanical efficiency, leading to a slight overall improvement in the system’s efficiency. To address this issue and enhance electrical efficiency further, it is advisable to substitute the stepper motor with a suitable DC generator. This substitution not only reduces losses within the stepper motor but also eliminates the necessity for a full wave bridge rectifier circuit, thereby minimizing voltage drops across the diodes. Additionally, to enhance the precision of the results obtained, it is essential to employ an oscilloscope instead of a digital multimeter (DMM) for more accurate capture of the peak output value.
4 Conclusions
The objective of this study was to develop, construct, and analyse a method for harnessing renewable energy from tiles using human foot traffic. The vertical displacement resulting from applied weights on the tiles was transformed into rotational motion through a rack and pinion mechanism. This rotational energy was then employed to drive a generator and produce electricity. The main goal was to refine the model for economic feasibility while ensuring utmost stability.
The initial phase involved the design of the model using DS SOLIDWORKS 2021. Subsequently, the system’s equations of motion were formulated and simulated using MATLAB SIMULINK. A sensitivity analysis was performed to optimize the design and determine the most suitable parameters. To assess the model, the generator’s output was rectified through an integrated circuit with capacitors and measured using a voltmeter. The results demonstrated an average voltage output of around 8–9 V per footstep, with the potential for direct utilization or storage for future needs.
Increased foot traffic on the tiles would result in a greater number of footsteps, leading to higher and more practical voltage outputs over extended periods. Regarding future research and design improvements, several recommendations are proposed. Firstly, exploring alternative materials that are lightweight yet sturdy or scaling down the design’s specifications and dimensions could significantly reduce the model’s overall weight. Additionally, adjusting gearing ratios and implementing a more intricate system of gear trains could further optimize the rotational motion of the output shaft. The introduction of an actual DC generator connected to the output shaft as the primary driver would enhance efficiency and generate a more consistent power output.
-
Research ethics: Not applicable.
-
Author contributions: Muhammad Asif (Provided the novel idea of the topic and supervised the work). Faisal Iqbal (participated in writeup and review preparation of the article and). Hamas Esbahani, and Mirza Ahmad (designed components and carried out experiments). Muhammad Uneeb Saqib participated modeling of the system and carried out simulation on Simulink.
-
Competing interests: The author(s) state(s) no conflict of interest.
-
Research funding: None declared.
-
Data availability: The raw data can be obtained on request from the corresponding author.
Nomenclature
- F(t)
-
force applied on system (by footstep)
- F s
-
spring force
- F r
-
force exerted by rack
- f p
-
force exerted by pinion
- m p
-
mass of top plate
- m r
-
mass of rack
-
-
acceleration of the system
-
-
velocity of the system
- x
-
vertical displacement of the system
- k
-
spring constant
-
-
linear velocity of pinion
-
-
linear velocity of gear
- r P
-
radius of gear
- r G
-
radius of gear
- J G
-
rotational inertia of gear
- J P
-
rotational inertia of pinion
- P
-
power produced by the system
- d p
-
circular pitch diameter of pinion
- d G
-
circular pitch diameter of gear
- P exerted
-
total power exerted by a footstep force
- P elec,output
-
electrical or total power output of the system
- P mech,output
-
mechanical power output of the system
- F exerted
-
footstep force exerted
- V peak,source
-
peak output voltage value of the source
- R source
-
resistance of source
- R coil
-
resistance of coil
- η mech
-
efficiency of the mechanical system
- η elec
-
efficiency of the electrical system
- η system
-
total system efficiency
References
Ang, C. K., A. A. Al-Talib, S. Meng Tai, and W. H. Lim. 2019. “Development of a Footstep Power Generator in Converting Kinetic Energy to Electricity.” E3S Web of Conferences 80: 1–14, https://doi.org/10.1051/e3sconf/20198002001.Search in Google Scholar
Asad, M., S. Trainee, N. Zaffar, H. Breeze, M. Muhammad, and H. Tahir. 2019. “Design of Footstep Power Generation System Using Rack and Pinion Gears Mechanism.” International Journal of Engineering Applied Sciences and Technology 4: 48–52.10.33564/IJEAST.2019.v04i02.008Search in Google Scholar
Bhatia, A., V. Sanghwan, T. Kaistha, V. Varshney, and S. Dalal. 2016. “Energy Harvesting Through Footsteps.” International Journal of Advanced Engineering Research and Applications 1: 405–12.Search in Google Scholar
Bhosale, A., M. Harshal Shinde, M. R. Tahade, M. Meet Valani, and M. Rohan 2017. “Design of Foot Step Power Energy Generation Machine” [Online]. http://www.ijritcc.org (accessed July 28, 2023).Search in Google Scholar
Birari, S., S. Choukhande, V. Daund, A. Shinde, and R. Munje. 2022. “Design and Development of Power Generating Tiles and Demonstration.” Journal of Research and Advancement in Electrical Engineering 5 (1): 1–7.Search in Google Scholar
Budynas, R., and K. Nisbett. 2014. Shigley’s Mechanical Engineering Design, 10th ed. New York: McGraw-Hill.Search in Google Scholar
Dalabeih, D., B. Haws, and S. Muhtaseb. 2018. “Harvesting Kinetic Energy of Footsteps on Specially Designed Floor Tiles,” In 2018 9th International Renewable Energy Congress, IREC 2018, pp. 1–4, https://doi.org/10.1109/IREC.2018.8362566.Search in Google Scholar
Gholikhani, M., H. Roshani, S. Dessouky, and A. T. Papagiannakis. 2020. “A Critical Review of Roadway Energy Harvesting Technologies.” Applied Energy 261: 114388. https://doi.org/10.1016/J.APENERGY.2019.114388.Search in Google Scholar
Hwang, S. J., H. J. Jung, J. H. Kim, J. H. Ahn, D. Song, Y. Song, H. L. Lee, S. P. Moon, H. Park, and T. H. Sung. 2015. “Designing and Manufacturing a Piezoelectric Tile for Harvesting Energy from Footsteps.” Current Applied Physics 15 (6): 669–74, https://doi.org/10.1016/J.CAP.2015.02.009.Search in Google Scholar
Ismail, F. B., N. F. O. Al-Muhsen, and L. S. Linganathan. 2020. “Design and Fabrication of Mechanical Power Generation Systems Using Footsteps.” International Journal of Electrical and Electronic Engineering & Telecommunications 9 (3): 183–8, https://doi.org/10.18178/ijeetc.9.3.183-188.Search in Google Scholar
Jintanawan, T., G. Phanomchoeng, S. Suwankawin, P. Kreepoke, P. Chetchatree, and C. U. Viengchai. 2020. “Design of Kinetic-Energy Harvesting Floors,” Energies 13 (20): 5419, https://doi.org/10.3390/EN13205419.Search in Google Scholar
Kharche, L., K. Jadhav, P. Gawas, and C. Gharat. 2019. “Speed Breaker Power Generation.” International Research Journal of Engineering and Technology 6 (2): 2973–9.Search in Google Scholar
Kim, K. B., J. Y. Cho, H. Jabbar, J. H. Ahn, S. D. Hong, S. B. Woo, and T. H. Sung. 2018. “Optimized Composite Piezoelectric Energy Harvesting Floor Tile for Smart Home Energy Management.” Energy Conversion and Management 171: 31–7, https://doi.org/10.1016/J.ENCONMAN.2018.05.031.Search in Google Scholar
Kumar, A. K., A. V. Kumar, D. J. Arockiaraj, G. U. Prasad, and U. Students. 2018. “Energy Harvesting Using Rack and Pinion Mechanism.” IOSR Journal of Mechanical and Civil Engineering (IOSR-JMCE) e-ISSN 15 (1): 75–80. https://doi.org/10.9790/1684-1501047580.Search in Google Scholar
Li, X., and V. Strezov. 2014. “Modelling Piezoelectric Energy Harvesting Potential in an Educational Building.” Energy Conversion and Management 85: 435–42. https://doi.org/10.1016/J.ENCONMAN.2014.05.096.Search in Google Scholar
Liu, M., R. Lin, S. Zhou, Y. Yu, A. Ishida, M. McGrath, B. Kennedy, M. Hajj, and L. Zuo. 2018. “Design, Simulation and Experiment of a Novel High Efficiency Energy Harvesting Paver.” Applied Energy 212: 966–75, https://doi.org/10.1016/J.APENERGY.2017.12.123.Search in Google Scholar
Nia, E. M., N. A. W. A. Zawawi, and B. S. M. Singh. 2017. “A Review of Walking Energy Harvesting Using Piezoelectric Materials.” IOP Conference Series: Materials Science and Engineering 291 (1): 012026. https://doi.org/10.1088/1757-899X/291/1/012026.Search in Google Scholar
Panthongsy, P., D. Isarakorn, P. Janphuang, and K. Hamamoto. 2018. “Fabrication and Evaluation of Energy Harvesting Floor Using Piezoelectric Frequency Up-Converting Mechanism.” Sensors and Actuators A: Physical 279: 321–30. https://doi.org/10.1016/J.SNA.2018.06.035.Search in Google Scholar
Sarala, T., Shivashankar, M. Poornima, and H. D. Lekhana. 2020. “Generation and Utilization of Electricity Using Footsteps as a Source of Energy.” In Proceedings – 5th IEEE International Conference on Recent Trends in Electronics, Information and Communication Technology, RTEICT 2020, 378–82.10.1109/RTEICT49044.2020.9315633Search in Google Scholar
Sharma, S., R. Kiran, P. Azad, and R. Vaish. 2022. “A Review of Piezoelectric Energy Harvesting Tiles: Available Designs and Future Perspective.” Energy Conversion and Management 254: 115272. https://doi.org/10.1016/J.ENCONMAN.2022.115272.Search in Google Scholar
Sezer, N., and M. Koç. 2021. “A Comprehensive Review on the State-of-the-Art of Piezoelectric Energy Harvesting.” Nano Energy 80: 105567. https://doi.org/10.1016/J.NANOEN.2020.105567.Search in Google Scholar
“The Advantages and Disadvantages of Renewable Energy | EnergySage.” https://news.energysage.com/advantages-and-disadvantages-of-renewable-energy/ (accessed July 27, 2023).Search in Google Scholar
© 2024 the author(s), published by De Gruyter, Berlin/Boston
This work is licensed under the Creative Commons Attribution 4.0 International License.
Articles in the same Issue
- Solar photovoltaic-integrated energy storage system with a power electronic interface for operating a brushless DC drive-coupled agricultural load
- Analysis of 1-year energy data of a 5 kW and a 122 kW rooftop photovoltaic installation in Dhaka
- Reviews
- Real yields and PVSYST simulations: comparative analysis based on four photovoltaic installations at Ibn Tofail University
- A comprehensive approach of evolving electric vehicles (EVs) to attribute “green self-generation” – a review
- Exploring the piezoelectric porous polymers for energy harvesting: a review
- A strategic review: the role of commercially available tools for planning, modelling, optimization, and performance measurement of photovoltaic systems
- Comparative assessment of high gain boost converters for renewable energy sources and electrical vehicle applications
- A review of green hydrogen production based on solar energy; techniques and methods
- A review of green hydrogen production by renewable resources
- A review of hydrogen production from bio-energy, technologies and assessments
- A systematic review of recent developments in IoT-based demand side management for PV power generation
- Research Articles
- Hybrid optimization strategy for water cooling system: enhancement of photovoltaic panels performance
- Solar energy harvesting-based built-in backpack charger
- A power source for E-devices based on green energy
- Theoretical and experimental investigation of electricity generation through footstep tiles
- Experimental investigations on heat transfer enhancement in a double pipe heat exchanger using hybrid nanofluids
- Comparative energy and exergy analysis of a CPV/T system based on linear Fresnel reflectors
- Investigating the effect of green composite back sheet materials on solar panel output voltage harvesting for better sustainable energy performance
- Electrical and thermal modeling of battery cell grouping for analyzing battery pack efficiency and temperature
- Intelligent techno-economical optimization with demand side management in microgrid using improved sandpiper optimization algorithm
- Investigation of KAPTON–PDMS triboelectric nanogenerator considering the edge-effect capacitor
- Design of a novel hybrid soft computing model for passive components selection in multiple load Zeta converter topologies of solar PV energy system
- A novel mechatronic absorber of vibration energy in the chimney
- An IoT-based intelligent smart energy monitoring system for solar PV power generation
- Large-scale green hydrogen production using alkaline water electrolysis based on seasonal solar radiation
- Evaluation of performances in DI Diesel engine with different split injection timings
- Optimized power flow management based on Harris Hawks optimization for an islanded DC microgrid
- Experimental investigation of heat transfer characteristics for a shell and tube heat exchanger
- Fuzzy induced controller for optimal power quality improvement with PVA connected UPQC
- Impact of using a predictive neural network of multi-term zenith angle function on energy management of solar-harvesting sensor nodes
- An analytical study of wireless power transmission system with metamaterials
- Hydrogen energy horizon: balancing opportunities and challenges
- Development of renewable energy-based power system for the irrigation support: case studies
- Maximum power point tracking techniques using improved incremental conductance and particle swarm optimizer for solar power generation systems
- Experimental and numerical study on energy harvesting performance thermoelectric generator applied to a screw compressor
- Study on the effectiveness of a solar cell with a holographic concentrator
- Non-transient optimum design of nonlinear electromagnetic vibration-based energy harvester using homotopy perturbation method
- Industrial gas turbine performance prediction and improvement – a case study
- An electric-field high energy harvester from medium or high voltage power line with parallel line
- FPGA based telecommand system for balloon-borne scientific payloads
- Improved design of advanced controller for a step up converter used in photovoltaic system
- Techno-economic assessment of battery storage with photovoltaics for maximum self-consumption
- Analysis of 1-year energy data of a 5 kW and a 122 kW rooftop photovoltaic installation in Dhaka
- Shading impact on the electricity generated by a photovoltaic installation using “Solar Shadow-Mask”
- Investigations on the performance of bottle blade overshot water wheel in very low head resources for pico hydropower
- Solar photovoltaic-integrated energy storage system with a power electronic interface for operating a brushless DC drive-coupled agricultural load
- Numerical investigation of smart material-based structures for vibration energy-harvesting applications
- A system-level study of indoor light energy harvesting integrating commercially available power management circuitry
- Enhancing the wireless power transfer system performance and output voltage of electric scooters
- Harvesting energy from a soldier's gait using the piezoelectric effect
- Study of technical means for heat generation, its application, flow control, and conversion of other types of energy into thermal energy
- Theoretical analysis of piezoceramic ultrasonic energy harvester applicable in biomedical implanted devices
- Corrigendum
- Corrigendum to: A numerical investigation of optimum angles for solar energy receivers in the eastern part of Algeria
- Special Issue: Recent Trends in Renewable Energy Conversion and Storage Materials for Hybrid Transportation Systems
- Typical fault prediction method for wind turbines based on an improved stacked autoencoder network
- Power data integrity verification method based on chameleon authentication tree algorithm and missing tendency value
- Fault diagnosis of automobile drive based on a novel deep neural network
- Research on the development and intelligent application of power environmental protection platform based on big data
- Diffusion induced thermal effect and stress in layered Li(Ni0.6Mn0.2Co0.2)O2 cathode materials for button lithium-ion battery electrode plates
- Improving power plant technology to increase energy efficiency of autonomous consumers using geothermal sources
- Energy-saving analysis of desalination equipment based on a machine-learning sequence modeling