Experimental investigation of heat transfer characteristics for a shell and tube heat exchanger
-
Ravi Gugulothu
 and
Narsimhulu Sanke
and
Narsimhulu Sanke

Abstract
In the present work, numerical investigations are conducted with 22 % cut segmental baffle heat exchanger (SB), 20°, 30°, and 40° helical baffles shell and tube heat exchangers (STHX) to estimate the overall heat transfer coefficient (OHTC), pressure drop (PD) and friction factor. Among the studied heat exchangers (HE), 40° helical baffles STHX provided the highest OHTC with minimum pressure drop. Hence, further investigations are conducted experimentally with 40° helical baffles STHX. OHTC increased by 2.65 % for 20° helical baffles, 5.37 % for 30° helical baffles, 9.78 % for 40° helical baffles when compared with 22 % cut segmental baffle heat exchanger. The deviation between experimental and numerical OHTC is 2.64 % 40° helical baffles.
1 Introduction
Heat exchangers and heat transfer fluids plays an important role in industries such as automobiles, power sectors, and oil industries. In last few years, development in heat exchangers are achieved in terms of thermal performance and fluid flow characteristics. The shell and tube heat exchangers with helical baffles are more preferable than the segmental baffles shell and tube heat exchangers. Due to the reduction in vibration, less pressure drop, and smooth fluid flow in helical baffle shell and tube heat exchangers.
Gugulothu et al. (2021) numerically evaluated local hydrodynamic parameters of a 3D geometry, STHX using segmental baffles; and noticed that 27.91, 26.10, 24.72, 18.52 and 11.85 % increment in pressure drop. Wang et al. (2016) experimentally studied the performance of circumferential overlap trisection HB-HE with different helix angle (12°, 16°, 20°, 24°, and 28°) and compared them with segmental baffle heat exchangers. The author observed that the shell side HTC and PD are increases, reduction in comprehensive index with the increase of mass flow rate. Smaller helical angled (12°) demonstrated better performance, in terms of 66.4 % shell side HTC, and 59.6 % comprehensive index were compared with segmental baffles STHX.
Shinde and Chavan (2018a) experimentally and numerically studied shell side HT and fluid flow in continuous HB STHX of different helix angles (10°, 19°, 21°, 25°, 30°, 38°, and 50°) were baffles made with Fiber Reinforced Plastic and noticed that greater helix angles adds to lower HT and PD, smaller helix angles gives higher heat transfer and pressure drop. Lei et al. (2008) numerically carried out impacts of various helix angles (15°, 30°, 40°, and 50°) of HB on HT, and fluid flow characteristics in a HE with helical baffles, author noticed that the Nu increases with an increase of baffle inclination angles up to 30° then decreases beyond it. In their studies higher heat transfers produced by continual helical baffle were compared to segmental baffle, 45° inclination angles are optimum for helical baffle with STHX. Wang et al. (2016) experimentally studied the performance of trisection helical baffle (12°, 16°, 20°, 24°, and 28°) STHX, they noticed that the shell side HTC, pressure drop both increases, and comprehensive index (h s /Δp s ) decreases with the increase of mass flow rates.
Chen, Dong, and Wu (2013) numerically studied the HT, and fluid flow performance of different baffle shapes (two trisection helical baffles of 20°, end-to-end helical baffles of 20°, and mid overlapped helical baffles with 36.2° helix angle). 20° TCO, and 18.4° CH schemes rank first, and second in shell side heat transfer coefficient, and comprehensive indexes (h s /Δp s ) among the studied geometries. Naqvi et al. (2018) numerically studied the STHX with SB, and HB with cylindrical tubes with clamping anti-vibration baffles and square twisted tubes, they found that the former one produced more heat transfer coefficient than the lateral one. Chen et al. (2008) numerically studied the combined multiple shell pass with continuous HB of 25°. The author found a 13 % higher overall heat transfer rate were compared with helical baffles with segmental baffles. Xiao et al. (2013a) numerically studied for HB-HE with different Pr of fluids and compared with different helical baffles tilt angles (10°, 25°, 40°, and 50°). The author found the 40° helical baffles STHX are optimum to achieve the best HT performance.
Gugulothu et al. (2016) reviewed pioneers research work and concluded 40° helical angles is optimum among the helical baffle (8°, 10°, 12°, 16°, 20°, 24°, 28°, 30°, 40°, and 50°) STHX and SB-STHX. Gugulothu, Sanke, and Gupta (2019), numerically studied the fluid flow, HT, and PD characteristics of helically baffle STHX with 40° HB, noticed that HTC is increasing with the increase of mass flow rate. Zhang et al. (2013) experimentally studied the performance of STHX with overlapped HB, and compared them with SB for oil coolers due to lower operating, maintenance costs, shell side PD, and fouling resistance. The author noticed that helical baffles with oil coolers get lower shell side PD and higher HTC per unit PD were compared with SB oil coolers for same volume flow rates. Vijaya Kumar Reddy et al. (2017) numerically studied the helical coil tube HE, and found 0.24 % reduction in frictional factor, 10 % OHTC increased by addition of semi-circular baffles in helical tube coiled HE.
Zhang et al. (2009a) experimentally studied different STHX (20°, 30°, 40°, and 50°) were compared with segmental baffle STHX, they noticed that the lower HTC and PD for helical baffles were compared with SB under same shell-side flow rates. 30° HB better than the 20° HB, 40° helical baffle is better than the 50° helical baffle and 40° helical baffles proved the best performance among the studied HB-STHX. Zhang et al. (2009b) a conducted numerical study on 3Dimenssional STHX for different helix angles (30°, 40°, and 50°) using a FLUENT tool and found that the average HTC per unit PD is larger for 40° HB STHX were compared with 30° and 50° helical baffles. Taher et al. (2012) numerically evaluated the non-continuous HB STHX of 40° helixchanger, and five heat exchangers by varying baffle spaces (P = 15 mm, P/16, P/8, 3P/16, and P/4) using a FLUENT tool. The author concluded that the HT per unit area decreases with the increase of baffle spaces under the same mass flow rates, higher heat transfer noticed for most extended baffle spaces under the same pressure drop and noticed that along with the increase of baffles space, pressure gradient decreases.
Xiao et al. (2013b) numerically studied for STHX with HB for different Pr, and compared with different helical tilt angles (10° to 50°), the author found that the HTC increases per unit length, and PD increases with an increase of HB tilt angles, among the studied heat exchangers 40° HB tilt angle is optimum. The author concluded that the smaller baffles tilt angle is optimum for a larger Prandtl number. Shinde and Chavan (2018b) conducted experimental and numerical investigations on shell side fluid flow and HT characteristics of STHX with continuous HB with different helix angles (10°, 19°, 21°, 25°, 30°, 38°, and 50°). Gugulothu and Sanke (2022a) numerically designed and investigated with 22 % cut SB STHX based on Tubular Exchanger Manufacturing Association (TEMA) using pure water as well as Al2O3, CuO, and SiO2 nanofluids at 1, 3, and 5 % volume concentrations. They found 10.41, 12.27, and 9.56 % overall enhancement in the presence of 5 % volume concentrations of Al2O3, CuO, and SiO2 nanofluids.
Gugulothu and Sanke (2022b) further numerically studied 22 % baffle cut, 20°, 30°, 40° helical angle STHX, and found 40° HB is optimum among the studied HE. They extended the same work using Al2O3, CuO, and SiO2 nanofluids at different volume concentrations as 1, 3, and 5 %. They noticed that the HTC increases with the increase of nanofluids volume concentrations, among the studied nanofluids 10.33 % to 8.24 % heat transfer enhancement obtained at 5 % volume concentrations with Al2O3 nanofluids. Kaleru, Venkatesh, and Kumar (2022a) carried work using 22 % cut segmental baffle STHX geometry and compared Colburn factor with Kern’s equation and found good agreement, for further analysis Al2O3, Graphene Oxide, TiO2, Single Wall Carbon Nanotubes, and MXene nanofluids in cold fluid. Further, Kaleru, Venkatesh, and Kumar (2022b) numerically studied with segmental and helical baffles STHX and found 40° helical baffles STHX is optimum to investigate further studies on STHX. Kanti et al. (2020) experimentally studied the fly ash/water nanofluids at different volume concentrations (0.1 % to 0.5 %) and temperatures (30 to 60 °C). They noticed that the viscosity and the thermal conductivity are increased, and specific heat decreased with increase of volume concentrations.
Kanti et al. (2022) experimentally investigated the stability, pH, electrical conductivity and thermophysical properties at different temperature ranges from 30° to 60 °C, at different concentrations ranging from 0.05 to 0.5 wt%. They found that the density, electrical, and thermal conductivity of nanofluid improved with concentrations in wt%, 4.9 %, and 27.6 % of thermal conductivity enhanced at 30 °C, and 60 °C respectively. In previous research work, the author design 22 % cut segmental baffle shell and tube heat exchanger based on TEMA standards, and work is carried out using numerical methods. The same is carried out in this research work, and compared with numerical and experimental results of 40° helical baffle shell and tube heat exchangers by considering and validating with objectives are Nusselt number, friction factor, j factor, and overall heat transfer coefficient.
2 Experimental setup
Figure 1 shows the experimental setup of 40° helical baffles STHX. This STHX has four tubes each of length 832 mm. Figure 2 shows the line diagram of the same STHX, Figure 3 shows the cross sectional view of the 40° helical baffles. Hot fluid flows in the shell with cold fluid flowing through the tubes in counter flow. These fluid properties are calculated based on equations (8)–(11). In this experimental work, there are total 16 (sixteen) thermocouples (PT-100) among which four are at the shell side fluid inlet, four thermocouples at shell fluid outlet. Similarly, four thermocouples are located at cold fluid inlet and the remaining four thermocouples at the cold fluid outlet. Pressure gauges measure shell side and tube side pressure drops. In this experiment hot fluid which is flowing in shell side is considered at 343.15 K and cold fluid which flowing in tube side is taken at 301.15 K respectively in counter-flow direction at a single pass, mass flow rate is taken from literature of Gugulothu and Sanke (2022b).

40° helical baffle STHX.

Line diagram of experimental setup.

Cross sectional view of 40° helical baffle.
3 Boundary condition and grid independent test
Meshing and grid independent test are done in previous studies of Gugulothu and Sanke (2022a, 2022b) same work is carried out for the all STHX (22 % cut segmental baffle, 20°, 30° and 40°) used in this research work.
4 Experimental uncertainty
The experimental uncertainties were analyzed by the methods provided by Kline et al. and Moffat et al. The experimental uncertainty is calculated as following:
where R = f (x 1, x 2, x 3, x 4, … …. , x n ) and x n is the independent variable that influences the outcome of R; Wx n is the contribution to the uncertainty resulted from x n .
Thus the HT rate uncertainty W Q is given as:
The OHTC uncertainty W k is equal to
The shell side HTC uncertainty
In the present test, the uncertainties of the HT rate, OHTC, and shell side HTC are lower than 0.83 %, 0.11 % and 1.68 % respectively. Which is agreeing with the experimental uncertainty in literature study of Yimin Xuan and Qiang Li (Kucuk, Unverdi, and Yilmaz 2019), Bin Gao (Vajjha, Das, and Kulkarni 2010).
5 Fluid properties
Physical properties for pure water based on temperature were calculated as the following equations and compared with the literature model.
Specific heat capacity for present work is
Thermal conductivity for present work is
Dynamic viscosity of present work is
Density difference between present equation and literature (Zhang et al. 2009a) is 0.44 %, specific heat is 0.61 %, thermal conductivity is 6.69 % and 2.25 % deviation in dynamic viscosity for shell-side fluid as well as 0.01 %, 0.17 %, 2.38 % and 6.39 % in tube fluid.
6 Model validation
Figure 4 shows the tube side Nusselt number obtained from various methods by varying shell side mass flow rate ranging from 0.23 to 0.43 kg/s. Nu increases with the increase of mass flow rate. Initially, experiments are conducted with pure water, which forms the basis for the comparison of theoretical results (Base fluid) with Dittus Boelter, Gnielinski equations, and experimental results. The author found 1.87 % for the Dittus Boelter equation (33), 11.167 % for the Gnielinski equation (34), and 10.24 % for experimental results. Figure 4 shows the good agreements for all the above models along with experimental results.

Nusselt number.
7 Data reduction
Overall heat transfer coefficient (Gugulothu and Sanke 2022a)
LMTD (Gugulothu and Sanke 2022a)
Average heat transfer rate (Gugulothu and Sanke 2022a)
where, Q shell and Q tube are heat transfer at shell and tube side respectively. A 0 is heat exchanger area based on outer diameter of the tube, which is calculated as following:
Area of heat exchanger is (Gugulothu and Sanke 2022a)
where, L is the length of the tube, N t is number of tubes, d 0 is outer diameter of the tube.
Number of tubes (Gugulothu and Sanke 2022b)
where, d 0 is tube outer diameter, D s is inner diameter of shell, K 1 and n 1 are the constants, which are determined from the flow arrangement and number of passes (Table 1).
Values of constants.
| No. of passes | Triangular pitch | Square and rotated square pitch | ||
|---|---|---|---|---|
| K 1 | n 1 | K 1 | n 1 | |
| 1 | 0.319 | 2.142 | 0.215 | 2.207 |
| 2 | 0.249 | 2.207 | 0.156 | 2.291 |
| 4 | 0.175 | 2.285 | 0.158 | 2.263 |
| 6 | 0.0743 | 2.499 | 0.0402 | 2.617 |
| 8 | 0.0365 | 2.675 | 0.0331 | 2.643 |
Shell side friction (Gugulothu, Sanke, and Gupta 2019)
where, N
t
= number of tubes, B is baffle space, V
s
is velocity of shell fluid, ΔP
s
is the shell side pressure drop,
Shell side Pressure drop (Nitturi et al. 2023)
Tube side pressure drop (Gugulothu and Sanke 2022b)
where, f t is the tube side friction factor, V t is the tube fluid velocity, D i is the inner diameter of the tube, G is a constant, several values for which have been reported by pioneer’s as Kern used 4, while Sinnot et al. used 2.5, and 1.5 is taken by Benoit Allen and Louis Gosselin.
Tube side pressure drop (Nitturi et al. 2023)
The tube side friction factor is calculated based on the tube side Reynolds number, by using following equations, which are developed by pioneers based on their research works are given below from equations (21)–(27).
The friction factor is calculated by Kim et al. (2012)
The friction factor is calculated by Allen and Gosselin (2008)
The friction factor is calculated by Said et al. (2014) and Somanchi et al. (2014)
The friction factor is calculated by Yang et al. (2014)
The friction factor is calculated by Said et al. (2014)
The heat transfer factor j is determined as follows.
j factor for heat transfer (Cao et al. 2020)
The correlations between Colburn factor and Reynolds number for different heat exchanger geometries are:
For segmental baffles (Zhang et al. 2009a):
For 20° helical baffles (Zhang et al. 2009a):
For 30° helical baffles (Zhang et al. 2009a):
For 400 helical baffles Zhang et al. 2009a:
For 500 helical baffles Zhang et al. 2009a:
Kucuk, Unverdi, and Yilmaz et al. (2019)
Dittus-Boelter correlation (Gugulothu et al. 2023; Kanti et al. 2020; Vajjha, Das, Kulkarni 2010)
Gnielinski correlation Kaleru, Venkadesh, and Kumar (2022a)
8 Results and discussions
STHX geometries are designed in CATIA V5 tool and simulation work is carried out using Ansys FLUENT tool to evaluate the HTC, and PD.
Figure 5 shows the OHTC of numerical study and experimental study. This OHTC is calculated by using equation (12). In Figure 5 Overall heat transfer coefficient increases with the increase of shell side mass flow rate ranging from 0.23 kg/s to 0.43 kg/s. Figure 5 indicates the discrepancy is 2.65 % for 20°, 5.37 % for 30°, 9.78 % for 40° helical baffles were compared with 22 % cut SB, and 2.64 % between 40° helical baffles of numerical values and experimental data. The difference stays in an acceptable range, and the variation trends are also consistent, which shows the reliability of the numerical simulation with experimental works.
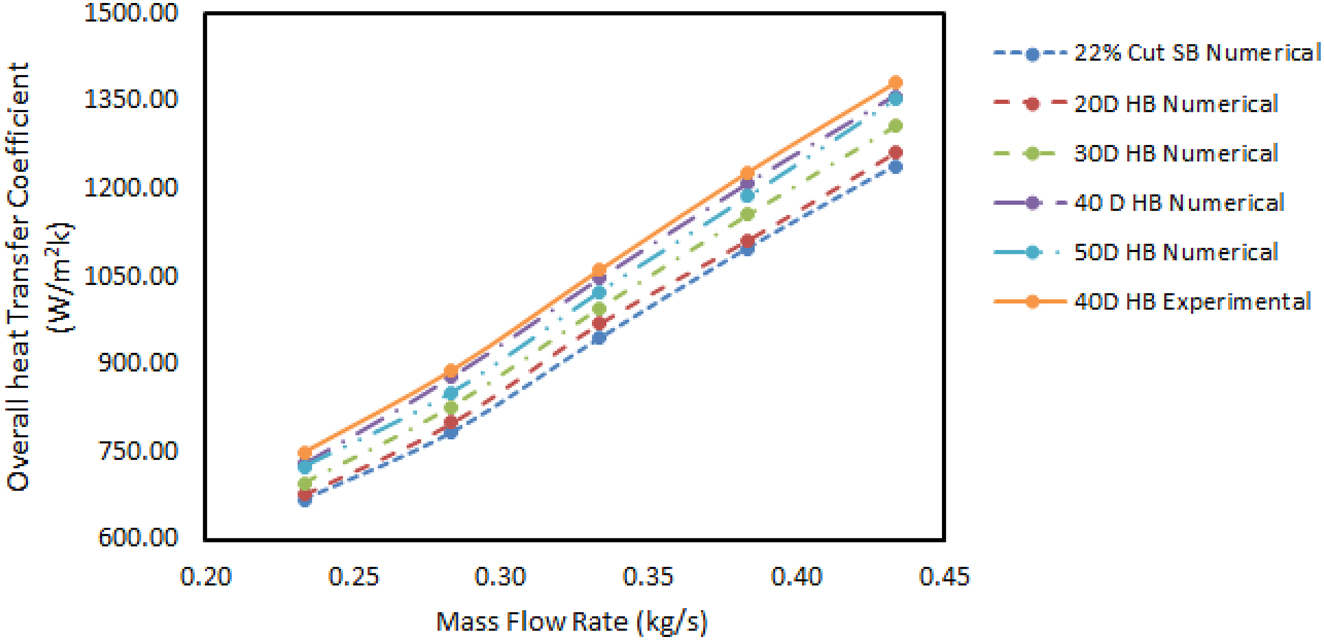
Overall heat transfer coefficient.
PD is one of the great important in design of STHX, because pumping power is highly depended on PD. It means lower PD leads to lower operating costs. Figure 6 shows the shell side PD calculated numerically and theoretically with the help of equations (17) and (18). In Figure 6 shell side PD increases with the increase of mass flow rate ranging from 0.23 kg/s to 0.43 kg/s. Among the studied heat exchanger, 40° helical baffles proved 40° helical angles are optimum by showing lesser pressure drop and experimental values are matched with numerical results. This is happening due to zig-zag flow pattern in segmental baffle and spiral flow pattern in helical baffles.

Shell side pressure drop.
The tube side PD includes PD due to friction as well as expansion at tube outlet and contraction at tube inlet, as well as reverse flow. Tube side pressure drop is calculated by using equations (19), and (20). In these, calculations several authors gave several values like G = 4 taken by Kern and 2.5 considered by Sinnot et al., and 1.5 is taken by Benoit Allen and Louis Gosselin (Allen and Gosselin 2008). Among the studied pressure drop, Benoit Allen model is showing a lesser pressure drop than Sinnot is intermediate and highest for Kern’s model (Figure 7).

Pressure drop in tube fluid.
Figure 8 depicts the change of pressure drop and friction coefficient; friction factor decreases with increase of shell side mass flow rate. Friction factor is calculated with the help of equations from (21) to (25). From Figure 8, it is clear that SB STHX have lesser friction factor were compared with HB STHX.

Friction factor.
Figure 9 shows the variation in the Colburn friction factor with mass flow rate. j factor measures the HTC. Figure 9 shows the effects of mass flow rate on the ‘j’ factor for segmental baffle (22 % cut and literature (Zhang et al. 2009a)) and helical baffles, these values are calculated using equations from (26) to (32). In the same Figure 9 the non-dimensional heat transfer coefficient Colburn friction factor-decreasing trend along with the mass flow rate, helical baffles have more Colburn friction factor as compared to the 22 % cut segmental baffles. Figure 9 shows the pumping power ratio decrease with the increase in mass flow rate. So, Colburn friction factor is the most suitable operating regime for shell-side fluid flows.

j factor.
From the Figure 10, it is clear that the friction factor decreases slowly from lower to higher Reynolds number. The variation in tube side friction factor is shown in Figure 10. The minimum deviation between 40° helical baffles STHX with literature Murugesan, Mayilsamy, and Suresh (2010) is 3.45 % at higher Re, and maximum is 23.50 % at lower Re. 1.19 % is minimum deviation at higher Re and 20.31 % at lower Re when compared with literature Murugesan et al. (2011). Finally, 40° helical baffle STHX proved lower tube side friction factor when compared with both the available literatures (Murugesan et al. 2011; Murugesan, Mayilsamy, and Suresh 2010). The overall heat transfer coefficient increases with Reynolds number ranging from 2000 to 6000. The maximum deviation between 40° helical baffles STHX and literature (Yang et al. 2019) model is 15.81 %. In Figures 10 and 11, the values are closer to literature values and showing good agreement. Figure 12 shows the new developed correlations for experimental values of overall heat transfer coefficient.

Tube side friction factor versus shell side Reynolds number.

Overall heat transfer coefficient versus shell side Reynolds number.

Overall heat transfer coefficient versus shell side Reynolds number.
9 Conclusions
In this numerical and experimental study, the author considered 22 % cut segmental baffle and 20°, 30°, 40° helical baffles for numerical study and 40° helical baffle STHX for experimental study, and was compared experimental results with numerical results. The maximum deviation between Gnielinski equation and experimental result is 4.10 %. Among the studied heat exchanger, 40° helical angles STHX shown better OHTC, Kern equation is giving more pressure drop, Sinnot one is intermediate, and Benoit Allen is giving lesser tube side pressure drop among the studied work. The present research work proved the best in OHTC, less friction factor, and lower shell side PD. The overall heat transfer coefficients between 40° helical baffles and literature (Yang et al. 2019) work is 15.81 %, i.e. 40° helical baffles STHX is producing lower overall heat transfer coefficient. 40° helical baffles STHX is producing 20.31 %, and 23.49 % lower friction factor when compared with literature (Murugesan et al. 2011) and (Murugesan, Mayilsamy, and Suresh 2010) respectively.
Nomenclature
- STHX
-
shell and tube heat exchanger
- HTC
-
heat transfer coefficient
- PD
-
pressure drop
- SB
-
segmental baffle
- HB
-
helical baffle
- HE
-
heat exchanger
- OHTC
-
overall heat transfer coefficient
- HT
-
heat transfer
- TCO
-
risection circumferential overlap baffle
- CH
-
continuous helical
- TEMA
-
tubular exchanger manufacturing association
- Nu
-
nusselt number
- P
-
helix pitch
- Pr
-
prandtl number
- ΔP
-
ressure drop
- h
-
HTC
Subscript
- s
-
Shell
- t
-
Tube
- in
-
inner
- out
-
outer
-
Author contributions: All the authors have accepted responsibility for the entire content of this submitted manuscript and approved submission.
-
Research funding: None declared.
-
Conflict of interest statement: The authors declare no conflicts of interest regarding this article.
References
Allen, B., and L. Gosselin. 2008. “Optimal Geometry and Flow Arrangement for Minimizing the Cost of Shell and Tube Condensers.” Short Communication in International Journal of Energy Research 32: 958–69. https://doi.org/10.1002/er.1398.Search in Google Scholar
Cao, X., D. Chen, T. Du, Z. Liu, and S. Ji. 2020. “Numerical Investigation and Experimental Validation of Thermo-Hydraulic and Thermodynamic Performances of Helical Baffle Heat Exchangers with Different Baffle Configurations.” International Journal of Heat and Mass Transfer 160: 120181. https://doi.org/10.1016/j.ijheatmasstransfer.2020.120181.Search in Google Scholar
Chen, Y., C. Dong and J. Wu. 2013. “Shell Side Flow and Heat Transfer Performances of Trisection Helical Baffle Heat Exchangers.” In Proceedings of the ASME 2013, International Mechanical Engineering Congress and Exposition (IMECE2013-65697), San Diego.10.1115/IMECE2013-65697Search in Google Scholar
Chen, G., M. Zeng, and Q. Wang. 2008. “Numerical Studies of Combined Multiple Shell Pass Shell and Tube Heat Exchangers with Helical Baffles.” In 6th International Conference on Heat Transfer, Fluid Mechanics and Thermodynamics (HEFAT2008). Pretoria.Search in Google Scholar
Gugulothu, R., N. Sanke, F. Ahmed, and R. Kumari Jilugu. 2021. “Numerical Study on Shell and Tube Heat Exchanger with Segmental Baffle.” In Proceedings of International Joint Conference on Advances in Computational Intelligence. Algorithms for Intelligent Systems, Springer Nature Singapore Pte Ltd.10.1007/978-981-16-0586-4_25Search in Google Scholar
Gugulothu, R., N. S. Somanchi, V. Kumar Reddy, and J. V. Tirkey. 2016. “A Review on Baffles for Shell and Tube Heat Exchangers.” In Proceedings of the Asian Congress on Gas Turbines (ACGT-2016). Bombay: Indian Institute of Technology.Search in Google Scholar
Gugulothu, R., and N. Sanke. 2022. “Use of Segmental Baffle in Shell and Tube Heat Exchanger for Nano Emulsions.” Journal of Heat Transfer 51 (3): 1–22.10.1002/htj.22418Search in Google Scholar
Gugulothu, R., and N. Sanke. 2022. “Effect of Helical Baffles and Water Based Al2O3, CuO, and SiO2 Nanoparticles in the Enhancement of Thermal Performance for Shell and Tube Heat Exchanger.” Heat Transfer 51 (5): 1–26.10.1002/htj.22474Search in Google Scholar
Gugulothu, R., N. Sanke, and A. V. S. S. K. S. Gupta. 2019. “Numerical Study of Heat Transfer Characteristics in Shell and Tube Heat Exchanger.” In Numerical Heat Transfer and Fluid Flow, Lecture Notes in Mechanical Engineering, 375–83. Singapore: Springer.10.1007/978-981-13-1903-7_43Search in Google Scholar
Gugulothu, R., N. Sanke, N. S. Somanchi, V. Normalla, F. Akter, and B. D. Y. Sunil. 2023. “A Numerical Study of Water Based Nanofluids in Shell and Tube Heat Exchanger.” In Energy Harvesting and Systems. Berlin: De Gruyter.10.1515/ehs-2022-0155Search in Google Scholar
Kaleru, A., S. Venkatesh, and N. Kumar. 2022. “Theoretical and Numerical Study of a Shell and Tube Heat Exchanger Using 22% Cut Segmental Baffle.” Heat Transfer 51 (8): 1–17.Search in Google Scholar
Kaleru, A., S. Venkatesh, and N. Kumar. 2022. “Numerical and Experimental Study of a Shell and Tube Heat Exchanger for Different Baffles.” Heat Transfer 51: 1–21.10.1002/htj.22667Search in Google Scholar
Kanti, P., A. A. Minea, K. V. Sharma, and M. Revanasiddappa. 2022. “Improved Thermophysical Properties of Graphene Ionanofluid as Heat Transfer Fluids for Thermal Applications.” Journal of Ionic Liquids 2: 100038. https://doi.org/10.1016/j.jil.2022.100038.Search in Google Scholar
Kanti, P., K. V. Sharma, C. G. Ramachandra, and B. Panitapu. 2020a. “Stability and Thermophysical Properties of Fly Ash Nanofluid for Heat Transfer Applications.” Heat Transfer 49 (8): 1–16, https://doi.org/10.1002/htj.21849.Search in Google Scholar
Kanti, P., K. V. Sharma, C. G. Ramachandra, and M. Gupta. 2020b. “Thermal Performance of Fly Ash Nanofluids at Various Inlet Fluid Temperatures: An Experimental Study.” International Communications in Heat and Mass Transfer 119: 104926. https://doi.org/10.1016/j.icheatmasstransfer.2020.104926.Search in Google Scholar
Kim, J. E., J. H. Doo, M. Y. Ha, H. S. Yoon, and C. Son. 2012. “Numerical Study on Characteristics of Flow and Heat Transfer in a Cooling Passage with Protrusion-In-Dimple Surface.” International Journal of Heat and Mass Transfer 55: 7257–67. https://doi.org/10.1016/j.ijheatmasstransfer.2012.07.052.Search in Google Scholar
Kucuk, H., M. Unverdi, and M. S. Yilmaz. 2019. “Experimental Investigation of Shell Side Heat Transfer and Pressure Drop in a Mini Channel Shell and Tube Heat Exchanger.” International Journal of Heat and Mass Transfer 143: 118493. https://doi.org/10.1016/j.ijheatmasstransfer.2019.118493.Search in Google Scholar
Lei, Y. G., Y. L. He, R. Li and Y. F. Gao. 2008. “Effects of Baffle Inclination Angle on Flow and Heat Transfer of a Heat Exchanger with Helical Baffles.” Chemical Engineering and Processing 47: 2336–45. https://doi.org/10.1016/j.cep.2008.01.012.Search in Google Scholar
Murugesan, P., K. Mayilsamy, and S. Suresh. 2010. “Turbulent Heat Transfer and Pressure Drop in Tube Fitted with Square Cut Twisted Tape.” Fluid Flow and Transport Phenomena, Chinese Journal of Chemical Engineering 18 (4): 609–17. https://doi.org/10.1016/s1004-9541(10)60264-9.Search in Google Scholar
Murugesan, P., K. Mayilsamy, S. Suresh, and P. S. S. Srinivasan. 2011. “Heat Transfer and Pressure Drop Characteristics in a Circular Tube Fitted with and without V-Cut Twisted Tape Insert.” International Communications in Heat and Mass Transfer 38: 329–34. https://doi.org/10.1016/j.icheatmasstransfer.2010.11.010.Search in Google Scholar
Naqvi, S. M. A., Elfeky, K. E., Y. Cao, and Q. Wang. 2019. “Numerical Analysis on Performances of Shell Side in Segmental Baffles, Helical Baffles and Novel Clamping Anti Vibration Baffles with Square Twisted Tubes Shell and Tube Heat exchangers.” Energy Procedia 158: 5770–5.10.1016/j.egypro.2019.01.553Search in Google Scholar
Nitturi, L. K., V. Kusuma, S. Kapu, R. Gugulothu, A. Kaleru, V. Vuyyuri, and A. Farid. 2023. “Augmentation of Heat Transfer Through Pass.” Journal of Heat Transfer. https://doi.org/10.1002/htj.22877.Search in Google Scholar
Said, Z., R. Saidur, A. Hepbasli, and N. A. Rahim. 2014. “New Thermophysical Properties of Water Based TiO2 Nanofluid-The Hysteresis Phenomenon Revisited.” International Communications in Heat and Mass Transfer 58: 85–95. https://doi.org/10.1016/j.icheatmasstransfer.2014.08.034.Search in Google Scholar
Shinde, S., and U. Chavan. 2018. “Numerical and Experimental Analysis on Shell Side Thermo-Hydraulic Performance of Shell and Tube Heat Exchanger with Continuous Helical FRP Baffles.” Thermal Science and Engineering Progress 5: 158–71. https://doi.org/10.1016/j.tsep.2017.11.006.Search in Google Scholar
Shinde, S., and U. Chavan. 2018. “Numerical and Experimental Analysis on Shell Side Thermo-Hydraulic Performance of Shell and Tube Heat Exchanger with Continuous Helical FRP Baffles.” Thermal Science and Engineering Progress 5: 158–71. https://doi.org/10.1016/j.tsep.2017.11.006.Search in Google Scholar
Somanchi, N. S., S. R. D. Rangisetty, S. P. Bellam, R. Gugulothu, and S. Bellam. 2014. “Experimental Investigations on Heat Transfer Enhancement in a Horizontal Tube using Converging and Diverging Conical Strips.” In Proceedings of the ASME 2014 Gas Turbine India Conference (GTINDIA2014), during 15–17th December 2014, New Delhi, India.10.1115/GTINDIA2014-8287Search in Google Scholar
Taher, F. N., S. Z. Movassag, K. Razmi, and R. T. Azar. 2012. “Baffle Space Impact on the Performance of Helical Baffle Shell and Tube Heat Exchangers.” Applied Thermal Engineering 44: 143–9. https://doi.org/10.1016/j.applthermaleng.2012.03.042.Search in Google Scholar
Vijaya Kumar Reddy, K., B. Sudheer Prem Kumar, R. Gugulothu, K. Anuja, and P. Vijaya Rao. 2017. “CFD Analysis of a Helically Coiled Tube in Tube Heat Exchanger.” Materials Today: Proceedings 4: 2341–9. https://doi.org/10.1016/j.matpr.2017.02.083.Search in Google Scholar
Vajjha, R. S., D. K. Das, and D. P. Kulkarni. 2010. “Development of New Correlations for Convective Heat Transfer and Friction Factor in Turbulent Regime for Nanofluids.” International Journal of Heat and Mass Transfer 53: 4607–18. https://doi.org/10.1016/j.ijheatmasstransfer.2010.06.032.Search in Google Scholar
Wang, W. H., D. Chenglai, T. Liu, and Y. H. Liu. 2016. “Performance Comparison for Oil Water Heat Transfer of Circumferential Overlap Trisection Helical Baffle Heat Exchanger.” Journal of Central South University 23: 2720–7.10.1007/s11771-016-3333-4Search in Google Scholar
Xiao, X., L. Zhang, X. Li, B. Jiang, X. Yang, and Y. Xia. 2013. “Numerical Investigation of Helical Baffles Heat Exchanger with Different Pradtl Number Fluids.” International Journal of Heat and Mass Transfer 63: 434–44. https://doi.org/10.1016/j.ijheatmasstransfer.2013.04.001.Search in Google Scholar
Xiao, X., L. Zhang, X. Li, B. Jiang, X. Yang, and Y. Xia. 2013. “Numerical Investigation of Helical Baffles Heat Exchanger with Different Prandtl Number Fluids.” International Journal of Heat and Mass Transfer 63: 434–44. https://doi.org/10.1016/j.ijheatmasstransfer.2013.04.001.Search in Google Scholar
Yang, J., A. Fan, W. Liu, and A. M. Jacobi. 2014. “Optimization of Shell and Tube Heat Exchangers Conforming to TEMA Standards with Designs Motivated by Constructal Theory.” Energy Conversion and Management 78: 468–76. https://doi.org/10.1016/j.enconman.2013.11.008.Search in Google Scholar
Yang, D., T. S. Khan, E. Al-Hajri, Z. H. Ayub, and A. H. Ayub. 2019. “Geometric Optimization of Shell and Tube Heat Exchanger with Interstitial Twisted tapes outside the Tubes Applying CFD Techniques.” Applied Thermal Engineering 152: 559–72. https://doi.org/10.1016/j.applthermaleng.2019.01.113.Search in Google Scholar
Zhang, J. F., B. Li, W. J. Huang, Y. G. Lei, Y. L. He, and W. Q. Tao. 2009. “Experimental Performance Comparison of Shell Side Heat Transfer for Shell and Tube Heat Exchangers with Middle Overlapped Helical Baffles and Segmental Baffles.” Chemical Engineering Science 64: 1643–53. https://doi.org/10.1016/j.ces.2008.12.018.Search in Google Scholar
Zhang, J. F., S. L. Guo, Z. Z. Li, Y. L. He, and W. Q. Tao. 2013. “Experimental Performance Comparison of Shell and Tube Oil Coolers with Overlapped Helical Baffles and Segmental Baffles.” Applied Thermal Engineering 58: 336–43. https://doi.org/10.1016/j.applthermaleng.2013.04.009.Search in Google Scholar
Zhang, J. F., Y. L. He, and W. Q. Tao. 2009. “3D Numerical Simulation on Shell and Tube Heat Exchangers with Middle Overlapped Helical Baffles and Continuous Baffles-Part II: Simulation Results of Periodic Model and Comparison between Continuous and Non-continuous Helical Baffles.” International Journal of Heat and Mass Transfer 52: 5381–9. https://doi.org/10.1016/j.ijheatmasstransfer.2009.07.007.Search in Google Scholar
© 2024 the author(s), published by De Gruyter, Berlin/Boston
This work is licensed under the Creative Commons Attribution 4.0 International License.
Articles in the same Issue
- Solar photovoltaic-integrated energy storage system with a power electronic interface for operating a brushless DC drive-coupled agricultural load
- Analysis of 1-year energy data of a 5 kW and a 122 kW rooftop photovoltaic installation in Dhaka
- Reviews
- Real yields and PVSYST simulations: comparative analysis based on four photovoltaic installations at Ibn Tofail University
- A comprehensive approach of evolving electric vehicles (EVs) to attribute “green self-generation” – a review
- Exploring the piezoelectric porous polymers for energy harvesting: a review
- A strategic review: the role of commercially available tools for planning, modelling, optimization, and performance measurement of photovoltaic systems
- Comparative assessment of high gain boost converters for renewable energy sources and electrical vehicle applications
- A review of green hydrogen production based on solar energy; techniques and methods
- A review of green hydrogen production by renewable resources
- A review of hydrogen production from bio-energy, technologies and assessments
- A systematic review of recent developments in IoT-based demand side management for PV power generation
- Research Articles
- Hybrid optimization strategy for water cooling system: enhancement of photovoltaic panels performance
- Solar energy harvesting-based built-in backpack charger
- A power source for E-devices based on green energy
- Theoretical and experimental investigation of electricity generation through footstep tiles
- Experimental investigations on heat transfer enhancement in a double pipe heat exchanger using hybrid nanofluids
- Comparative energy and exergy analysis of a CPV/T system based on linear Fresnel reflectors
- Investigating the effect of green composite back sheet materials on solar panel output voltage harvesting for better sustainable energy performance
- Electrical and thermal modeling of battery cell grouping for analyzing battery pack efficiency and temperature
- Intelligent techno-economical optimization with demand side management in microgrid using improved sandpiper optimization algorithm
- Investigation of KAPTON–PDMS triboelectric nanogenerator considering the edge-effect capacitor
- Design of a novel hybrid soft computing model for passive components selection in multiple load Zeta converter topologies of solar PV energy system
- A novel mechatronic absorber of vibration energy in the chimney
- An IoT-based intelligent smart energy monitoring system for solar PV power generation
- Large-scale green hydrogen production using alkaline water electrolysis based on seasonal solar radiation
- Evaluation of performances in DI Diesel engine with different split injection timings
- Optimized power flow management based on Harris Hawks optimization for an islanded DC microgrid
- Experimental investigation of heat transfer characteristics for a shell and tube heat exchanger
- Fuzzy induced controller for optimal power quality improvement with PVA connected UPQC
- Impact of using a predictive neural network of multi-term zenith angle function on energy management of solar-harvesting sensor nodes
- An analytical study of wireless power transmission system with metamaterials
- Hydrogen energy horizon: balancing opportunities and challenges
- Development of renewable energy-based power system for the irrigation support: case studies
- Maximum power point tracking techniques using improved incremental conductance and particle swarm optimizer for solar power generation systems
- Experimental and numerical study on energy harvesting performance thermoelectric generator applied to a screw compressor
- Study on the effectiveness of a solar cell with a holographic concentrator
- Non-transient optimum design of nonlinear electromagnetic vibration-based energy harvester using homotopy perturbation method
- Industrial gas turbine performance prediction and improvement – a case study
- An electric-field high energy harvester from medium or high voltage power line with parallel line
- FPGA based telecommand system for balloon-borne scientific payloads
- Improved design of advanced controller for a step up converter used in photovoltaic system
- Techno-economic assessment of battery storage with photovoltaics for maximum self-consumption
- Analysis of 1-year energy data of a 5 kW and a 122 kW rooftop photovoltaic installation in Dhaka
- Shading impact on the electricity generated by a photovoltaic installation using “Solar Shadow-Mask”
- Investigations on the performance of bottle blade overshot water wheel in very low head resources for pico hydropower
- Solar photovoltaic-integrated energy storage system with a power electronic interface for operating a brushless DC drive-coupled agricultural load
- Numerical investigation of smart material-based structures for vibration energy-harvesting applications
- A system-level study of indoor light energy harvesting integrating commercially available power management circuitry
- Enhancing the wireless power transfer system performance and output voltage of electric scooters
- Harvesting energy from a soldier's gait using the piezoelectric effect
- Study of technical means for heat generation, its application, flow control, and conversion of other types of energy into thermal energy
- Theoretical analysis of piezoceramic ultrasonic energy harvester applicable in biomedical implanted devices
- Corrigendum
- Corrigendum to: A numerical investigation of optimum angles for solar energy receivers in the eastern part of Algeria
- Special Issue: Recent Trends in Renewable Energy Conversion and Storage Materials for Hybrid Transportation Systems
- Typical fault prediction method for wind turbines based on an improved stacked autoencoder network
- Power data integrity verification method based on chameleon authentication tree algorithm and missing tendency value
- Fault diagnosis of automobile drive based on a novel deep neural network
- Research on the development and intelligent application of power environmental protection platform based on big data
- Diffusion induced thermal effect and stress in layered Li(Ni0.6Mn0.2Co0.2)O2 cathode materials for button lithium-ion battery electrode plates
- Improving power plant technology to increase energy efficiency of autonomous consumers using geothermal sources
- Energy-saving analysis of desalination equipment based on a machine-learning sequence modeling