Detection of Fusarium spp. infection in potato (Solanum tuberosum L.) during postharvest storage through visible–near-infrared and shortwave–near-infrared reflectance spectroscopy
-
Eko Widi Prasetyo


Abstract
Pathogen infection can damage agricultural products, thereby reducing their economic value. Fusarium spp. is a fungal pathogen that infects potatoes (Solanum tuberosum L.) and causes dry rot. In this study, we utilized visible–near-infrared (Vis–NIR) and shortwave–near-infrared (SW–NIR) spectroscopy for the early detection of Fusarium spp. infection in potato tubers. The spectrometer used in this study analyzed the Vis–NIR (400–1,000 nm) and SW–NIR (970–1,700 nm) regions. A total of 183 potato (G2 “Granola L.” variety) samples were used. Among these, 93 samples were artificially inoculated with Fusarium solani mycelia, while 90 samples were left uninfected and considered the control group. The potato samples were stored at two different temperatures (12 and 25°C). Vis–NIR and SW–NIR spectra were analyzed by a chemometric method, namely principal component analysis with linear discriminant analysis (PCA–LDA), to differentiate healthy and infected potatoes. The PCA–LDA model based on Vis–NIR spectra exhibited a calibration accuracy of 80.26% and a reliability of 65%. Meanwhile, the PCA–LDA model based on SW–NIR spectra exhibited a calibration accuracy of 100% and a reliability of 97.30%. Overall, both methods demonstrated their suitability for differentiating potato tubers with Fusarium spp. fungal infection and healthy ones; however, the results suggest that SW–NIR spectroscopy is more effective than Vis–NIR spectroscopy.
1 Introduction
Potato (Solanum tuberosum L.) is the fourth most popular crop consumed by humans worldwide, after wheat, corn, and rice. Potato production peaked in 2019 at 370,436,581 tons and fell to a low at 354,189,041 tons in 2016 [1]. Potato is a carbohydrate-rich energy source that contains macronutrients, micronutrients, and phytonutrients [2]. The conventional method for the clonal multiplication of commercial potato cultivars using tubers is still employed.
However, this method has a disadvantage because plant multiplication involves vegetative growth in the field, which permits viruses, fungi, and tissue-borne bacteria that infected plants the previous season to accumulate. Potato diseases lead to considerable yield losses and reduce tuber quality through seed degeneration. The costs of procuring seed potatoes for commercial potato cultivation are high, especially in emerging and developing countries where the costs reach 50–70 and 20–30% of the total production’s costs, respectively. This is due to the seed dormancy period and low seed propagation rate [3].
Fusarium spp. is the primary causal agent of putrefactive fungal infection in potato tubers during postharvest storage. Potato dry rot caused by Fusarium spp. causes losses in potato production. This disease inhibits the development of potato sprouts and causes dry rot. The toxin produced by the fungus in rotting tubers endangers consumers’ health [4,5]. The presence of dry blight during storage is adversely linked to nutritional quality measures. Starch and amylose concentrations decrease due to single and mixed inoculum infections [6]. Meanwhile, amylopectin, reducing sugar, sucrose, and total dissolved sugar concentrations increase due to dry rot infection [7]. High sugar concentrations lead to browning in finished potato products and therefore must be avoided [8].
Healthy and disease-free quality potato seeds must be used to achieve high quality and quantity potato production. Research interest in the quality of agricultural products has been growing due to the influence of global consumer expectations and perceptions about agricultural product quality. A factor that influences the fulfillment of these requirements of potato production is disease prevention and control through a sensitive and rapid disease detection system. Two types of disease detection methods are commonly adopted: destructive and nondestructive.
Destructive methods involve the analysis of food samples by destroying their ingredients before measuring their content. Accordingly, these samples can no longer be used after analysis. Destructive methods include enzyme-related measurement [9] or polymerase chain reaction (PCR)-based detection techniques [10]. Destructive methods that require chemical analysis have limitations in applicability because they require special chemicals for sample preparation types, specific instruments, and skilled analysts. Microbiological analysis is also categorized as destructive analysis, which requires long testing durations apart from its expensive analysis [11].
Nondestructive analysis of food samples can be performed without destroying samples through the assistance of machines as well as humans [12]. Nondestructive analysis methods applicable to potato samples include computer vision, electronic nose technology, and near-infrared spectroscopy (NIRS). However, computer vision has the disadvantage of detecting only external damage of potatoes, such as abrasions and wounds [13,14]. Electronic nose technology has been developed to detect dry blight using gas sensors that detect certain compounds. However, the electronic nose technology is in the developmental stage and has not been tested for widespread community application [12]. NIRS is currently preferred because it is an affordable and advanced nondestructive technology in instrumentation and applications used for tuber powder classification [15] or polysaccharide content prediction [16]. In addition, it meets the environmental requirements of no emissions and waste production [17].
Spectroscopy studies the relationship between electromagnetic waves and materials. A type of spectroscopy that uses electromagnetic radiation in the visible (Vis) and near-infrared (NIR) region has been applied to study agricultural materials because it can detect pigment content in the Vis region [18,19] and C–H–N–O molecules in the NIR region [20]. NIRS exhibits a high sensitivity while recording water absorbance (O–H molecules); however, this sensitivity can pose a challenge when analyzing products with high moisture contents [20], such as agricultural products. Recent research has shown that NIR reflectance in the range of 1,100–2,500 nm can be utilized to accurately analyze fructose, glucose, sucrose, reducing sugar, starch, and protein levels in tubers and potatoes [21,22].
NIRS has other advantages, such as online monitoring capability, equipment affordability, and low-quantity sample requirements due to the strong penetration ability of electromagnetic waves [23]. However, reports on the use of affordable and modular Vis–NIR and shortwave–NIR (SW–NIR) spectrometers are rare. The use of modular Vis–NIR spectroscopy is promising and has resulted in the accurate prediction of soluble solid content [24,25,26], pH [27,28], and acidity [29] along with the accurate detection of viability [30] and adulteration [31]. Previous research about the potential of SW–NIR also has been conducted [32]. Indeed, the evaluation of the applicability of modular Vis–NIR and SW–NIR spectrometers is a potential further research topic.
PCA is a chemometric technique that employs an unsupervised strategy to decrease the dimensionality of a dataset with numerous characteristics. This reduction in dimensions renders the dataset more manageable for analysis and improves spectral visualization [33]. LDA is widely utilized in supervised classification tasks. In the context of PCA–LDA, LDA was employed for the accumulated PCA data, allowing for the classification of noninfected and infected potato tubers. Through the utilization of PCA–LDA, an evaluation was conducted to assess the effectiveness of the classification model by means of prediction [12]. The results obtained from these predictions underscored the advantages of the PCA–LDA model [34]. Therefore, in this research, we aim to evaluate the potential of affordable and modular Vis–NIR and SW–NIR spectrometers to detect internal damage in potatoes. We investigated the accuracy and efficiency of Vis–NIR and SW–NIR spectroscopy coupled with principal component analysis (PCA)–linear discriminant analysis (LDA) to identify Fusarium spp. infection in potatoes. Our proposed method is expected to considerably contribute to improving postharvest quality management and minimizing losses in potato production.
2 Materials and methods
2.1 Potato samples and fungal inoculation
The experiment utilized freshly harvested and uniformly sized tubers of the “Granola L.” potato cultivar obtained from the Research Field of PT. BISI International, Tbk., East Java, Indonesia. The harvest period of the potato tubers was August–September 2022.
Figure 1 shows the preparation process of inoculation and control potato tuber samples. The samples included 183 potato tubers stored at two different temperatures (12 and 25°C, relative humidity [RH] 80%) as presented in Table 1. “Granola L.” potato tubers with a uniform size were thoroughly washed with tap water to remove any adhering soil and dried before analysis. Subsequently, they were surface sterilized with 1% solution of NaClO (sodium hypochlorite), commonly known as diluted (chlorine) bleach, for 10 min, and then rinsed with distilled water and dried once again. Uniform cuts with dimensions of 30 mm × 30 mm were made on all tubers using electric drills.
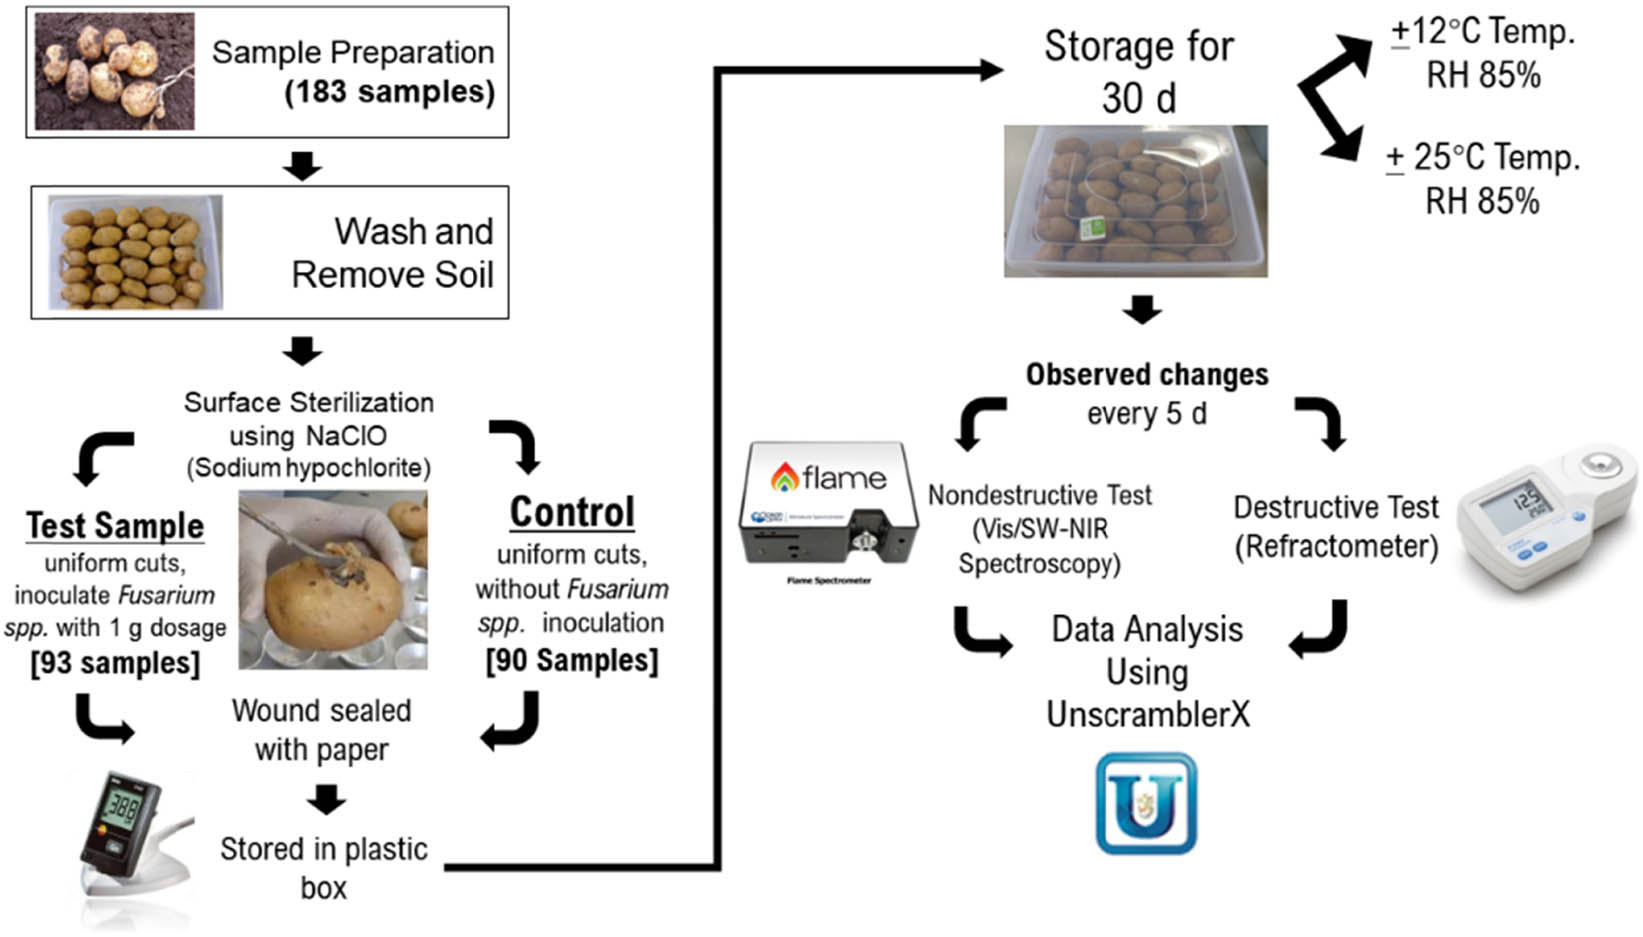
Preparation of inoculated and control potato tuber samples.
Potato samples and storage temperature treatments
| Category | Sample name | Mode of treatment |
|---|---|---|
| Infected | I-12 | Infected, 12°C storage |
| I-25 | Infected, 25°C storage | |
| Noninfected | N-12 | Noninfected, 12°C storage |
| N-25 | Noninfected, 25°C storage |
The preparation of the Fusarium spp. species inoculum involved the use of 500 g of commercially available Fusarium solani inoculant powder, which contained spores or other fungal propagules that were ready for application. The fungal pathogen for the current experiment was obtained from artificially infected potato tubers using the F. solani inoculant powder. The isolation of the pathogen was conducted on tubers that displayed symptoms of dry rot. Within a laminar cabinet, the diseased and healthy parts, measuring 1 mm × 1 mm, were excised from the infected tubers and subjected to surface sterilization with 1% sodium hypochlorite for 1 min, followed by 70% ethanol for 30 s. The sterilized portion was then washed with distilled water. Subsequently, the sterilized part was placed in potato dextrose agar media and incubated at a temperature range of 18–24°C. After 2 days, the initial fungal growth from the diseased part was carefully transferred to fresh PDA plates to establish a pure culture of the fungi. The F. solani inoculum was then applied to 93 uniformly wounded potato tubers at a dosage of 1 g. Meanwhile, 90 control potato tubers were left intact and were not subjected to inoculation with F. solani. The potato tubers were stored in closed plastic boxes with a layer of moist filter paper at the bottom. They were stored for 30 days at two different temperatures (12 and 25°C, RH 80%). Observation was conducted every 5–10 days of storage. A total of 183 samples were selected randomly and then separated into 137 samples (75% samples) of the calibration set, and the remaining 46 samples (25%) were selected as the validation set.
2.2 Acquisition of the spectra of potato samples using a modular spectrometer
The robustness of an NIRS measurement method is determined by several factors, including the optical geometry, the grating type, and the Fourier transform. The optical geometry of an NIRS system is the way that the light sources, detectors, and samples are positioned relative to each other [35]. In this research, the Vis–NIR and SW–NIR spectra of whole potato samples were acquired in reflectance mode using a modular spectrometer. According to Fu et al. [36], one of the advantages of reflectance mode is that it is easier to measure than transmission mode, and the light levels are much higher. However, variations in the superficial and surface properties of the fruit may affect the calibrations.
The Vis–NIR region (400–1,000 nm) and SW–NIR region are typically preferred for NIRS applications included in this research [37]. The long-wave–NIR (LW–NIR) range, which is from 1,700 to 2,500 nm, was not used in the research because it is not as sensitive to the chemical composition of materials as the Vis–NIR and SW–NIR regions. The Vis–NIR region is particularly sensitive to the presence of water, proteins, and carbohydrates, while the SW–NIR region is sensitive to the presence of lipids and other organic compounds [38].
The modular spectrometer consisted of two instruments: a Vis–NIR spectrometer (Ocean Optics, Flame-T [Toshiba TCD1304AP]-Vis–NIR, USA) with a wavelength range of 350–1,000 nm and an SW–NIR spectrometer (Ocean Optics, Flame-NIR+, USA) with a wavelength range of 1,000–1,700 nm. Reflectance measurements were taken for both spectra. The combined Vis–NIR and SW–NIR spectroscopy setup is presented in Figure 2.
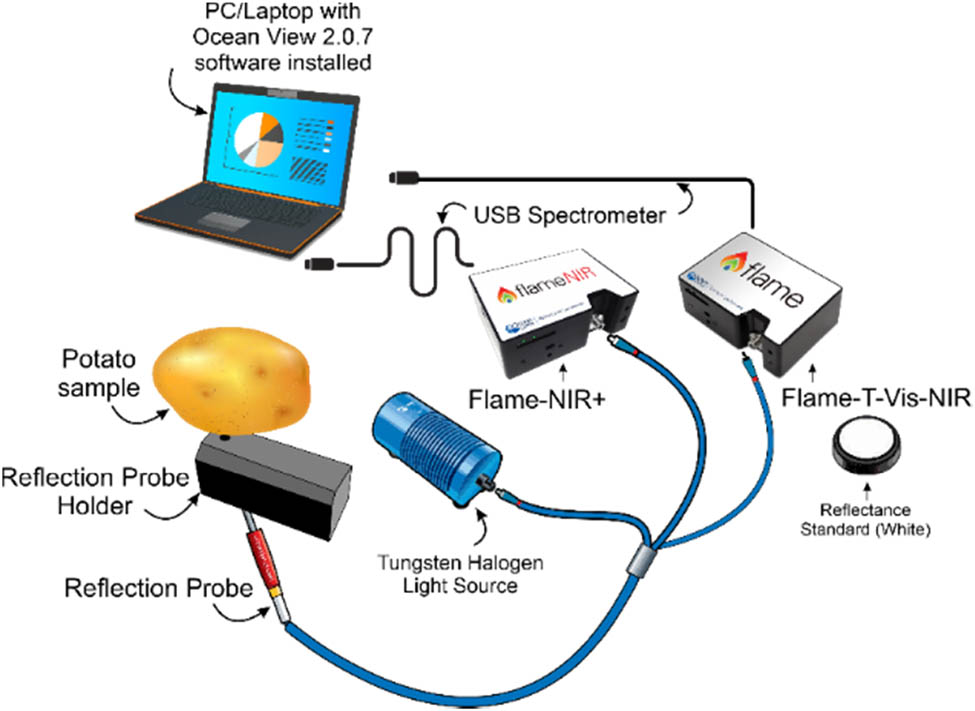
Combined Vis–NIR and SW–NIR spectroscopy setup.
The experimental setup included a modular spectrometer system equipped with a tungsten halogen light, reflection probes, and a computer installed with Ocean View 2.0.12 software. The NIR instrument utilized a halogen tungsten lamp (type: HL-2000-HP-FHSA Ocean Optics light source, wavelength range: 360–2,400 nm, Fiber Connector SMA 905, nominal bulb power: 20 W and typical output power: 8.4 mW) emitting high-intensity radiation in the Vis and IR regions as a radiation source and a semiconductor detector as a sensor.
Each potato sample was positioned on the optical probe to acquire its optical spectrum. The outer skin layer of unpeeled potato samples was tested, as this is the part that is most easily accessed and is also the part that is most likely to come into contact with the spores of Fusarium spp. [39]. In this study, the entire potato, except for the inoculation area, was defined as a scan area. The probe was used to scan the potato samples at five different locations: top, middle, and bottom. This was done to determine the variation between the scanning locations, as shown in Figure 3.
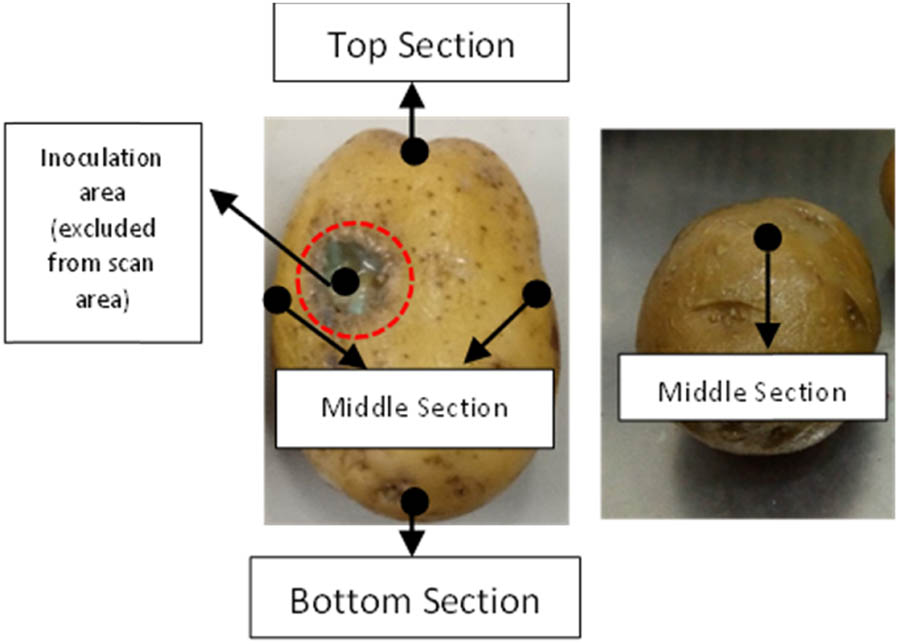
Five locations for scanning (top, middle, and bottom).
Vis–NIR and SW–NIR reflectance spectra were collected using Ocean View 2.0.12 software with an integration time of 470 and 800 ms and average scans of 20 and 12, respectively, with a boxcar width of 1. Prior to the acquisition of sample spectra, calibration was performed by taking a white reference with a ceramic diffuse reflectance standard (WS-1, Ocean Optics, USA) and a dark reference by turning off the light source. Ten spectra were obtained for each sample. A total of 1,830 spectra were recorded from 183 potato samples. The Vis–NIR and SW–NIR spectrometers could perform reading simultaneously using the same reflection probe. The captured data were automatically saved in separate csv format files.
2.3 Sugar content measurement
The individual potato samples were first measured for reflectance, and then they were sent to the reference measurements or destructive instruments for further analysis. According to the methods described by dos Santos Costa [40], sugar contents of glucose, fructose, and sucrose were determined using a digital refractometer (Hanna Instrument, Woonsocket, RI, USA). Sugar content was measured on potato samples that had been crushed with a blender. Before measuring the sugar content of the samples, the refractometer was calibrated using deionized water. The sugar content was measured in three replicates on each sample and expressed in %.
2.4 Data analysis of potato samples
Preprocessed spectra were evaluated using various chemometric tools, including unsupervised analysis utilizing PCA and supervised analysis with a combination of PCA and LDA [41]. PCA–LDA is a qualitative analysis method and involves two steps. In the first step, spectral variables were reduced to seven new variables, namely, principal components (PCs). In the second step, the new variables were categorized into two types: noninfected and infected. In PCA–LDA, spectra were considered the independent variable (X) while the category of fungal infection was considered the dependent variable (Y). The first PC (PC-1) was responsible for the largest variance in data, followed by PC-2, and so forth. This method retained the most relevant data information while reducing data dimensionality by creating new orthogonal coordinates based on the PCs [42].
PCA is an unsupervised chemometric method that reduces a high-dimensional dataset into one with few dimensions, increasing its accessibility for study. It is commonly used to improve spectral visualization by decreasing the number of data dimensions by reprojecting the dataset onto a different coordinate frame. PCA is useful for more than just reducing the number of dimensions of a dataset to be analyzed. It preserves data information as much as possible while reducing data dimensions. New orthogonal coordinates based on PCs were developed.
LDA is often used for supervised classification tasks. As part of PCA–LDA, LDA was applied to the retrieved PCA information to classify noninfected and infected potato tubers. Using PCA–LDA, prediction was performed to assess the classification model’s effectiveness. The outcomes of the predictions indicated the benefits of the PCA–LDA model [41].
The Vis–NIR range (400–1,000 nm) and SW–NIR range (1,000–1,700 nm) reflectance spectra obtained using Ocean View 2.0.12 were compiled separately in Microsoft Excel®. The Unscrambler® X Camo software (version 10.4) was used to perform chemometric analyses on 1,830 spectra consisting of 930 and 900 spectra from artificially infected and noninfected potatoes, for building and validating a multivariate model, respectively. Spectra were also preprocessed to reduce issues, such as baseline variation, light scattering, and path length discrepancies, which can affect the accuracy of chemical composition measurement [41]. Six spectral preprocessing methods, i.e., standard normal variate, multiplicative scatter correction, area normalization (AN), Savitzky–Golay smoothing, Savitzky–Golay first derivative, and Savitzky–Golay second derivative, were used.
3 Results and discussion
3.1 Sugar content analysis
The images of noninfected potatoes and artificially infected potatoes with Fusarium spp. stored at 12 and 25°C (RH 85%) are shown in Figure 4. The results revealed that after 15 days, Fusarium spp. infection was more severe in potatoes stored at 25°C (Figure 4b) than in those stored at 12°C (Figure 4a), which is evident from the widespread damage around the inoculum. Under all treatment combinations, the “Granola L.” potatoes exhibited a periodic increase in the severity of tuber rot [7]. Fusarium spp. fungus causes dry rot [4], and infections by this fungus occur through wounds found on the tuber surface, which are visible as brown circular necrotic wounds. Another characteristic of infected surface is wrinkling with the growth of a concentric ring-shaped white, blue, or yellow fungus. The infection progresses more rapidly in storage rooms with humid and warm conditions than in cold storage rooms with dry conditions [43].
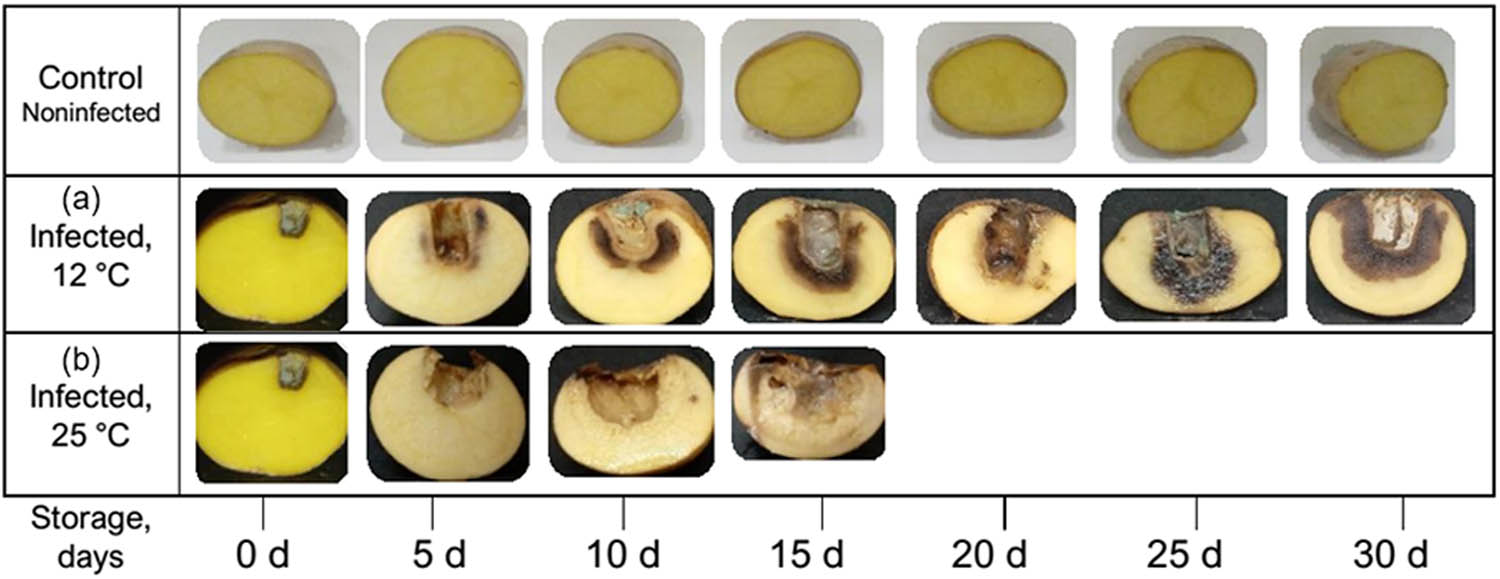
Differences in infected potato tubers stored for 30 days at (a) 12°C and (b) 25°C.
The sugar contents of the infected and noninfected potatoes stored for 30 days at ±12 and ±25°C are summarized in Table 2 and presented in Figure 5. Potato tubers infected with Fusarium spp. generally had higher glucose, fructose, and sucrose contents than noninfected ones. Studies similar to the present work found that infected potatoes had high sucrose [7] and reducing sugar [44] contents.
Sugar contents (glucose, fructose, and sucrose) of infected and noninfected potatoes stored at different temperatures (12 and 25°C)
| Storage Time, days | Glucose | Fructose | Sucrose | |||
|---|---|---|---|---|---|---|
| Infected, 12°C storage | Infected, 25°C storage | Infected, 12°C storage | Infected, 25°C storage | Infected, 12°C storage | Infected, 25°C storage | |
| I-12 | I-25 | I-12 | I-25 | I-12 | I-25 | |
| 0 | 4.78 ± 0.19 | 4.71 ± 0.20 | 4.95 ± 0.14 | 4.91 ± 0.14 | 4.50 ± 0.13 | 4.49 ± 0.12 |
| 5 | 5.45 ± 0.18 | 6.53 ± 0.20 | 5.37 ± 0.07 | 6.48 ± 0.20 | 5.53 ± 0.10 | 6.47 ± 0.47 |
| 10 | 5.55 ± 0.05 | 5.44 ± 0.37 | 5.68 ± 0.02 | 5.61 ± 0.31 | 5.62 ± 0.08 | 5.66 ± 0.16 |
| 15 | 5.76 ± 0.17 | 5.01 ± 0.45 | 5.88 ± 0.10 | 5.13 ± 0.17 | 5.76 ± 0.08 | |
| 20 | 5.76 ± 0.25 | 5.88 ± 0.21 | 5.74 ± 0.11 | |||
| 25 | 5.85 ± 0.21 | 6.01 ± 0.21 | 5.86 ± 0.11 | |||
| 30 | 6.74 ± 0.18 | 6.83 ± 0.12 | 6.55 ± 0.46 | |||
| Storage Time, days | Glucose | Fructose | Sucrose | |||
|---|---|---|---|---|---|---|
| Noninfected, 12°C storage | Noninfected, 25°C storage | Noninfected, 12°C storage | Noninfected, 25°C storage | Noninfected, 12°C storage | Noninfected, 25°C storage | |
| N-12 | N-25 | N-12 | N-25 | N-12 | N-25 | |
| 0 | 4.78 ± 0.19 | 4.71 ± 0.20 | 4.95 ± 0.14 | 4.91 ± 0.14 | 4.50 ± 0.13 | 4.49 ± 0.12 |
| 10 | 5.05 ± 0.19 | 5.10 ± 0.21 | 5.28 ± 0.11 | 5.33 ± 0.09 | 5.23 ± 0.36 | 5.23 ± 0.29 |
| 20 | 5.32 ± 0.21 | 5.55 ± 0.26 | 5.58 ± 0.08 | 5.77 ± 0.09 | 4.88 ± 0.35 | 5.61 ± 0.14 |
| 30 | 5.82 ± 0.17 | 5.98 ± 0.14 | 5.92 ± 0.22 | 6.15 ± 0.07 | 5.46 ± 0.40 | 5.84 ± 0.10 |
Data are represented as mean ± standard deviation.
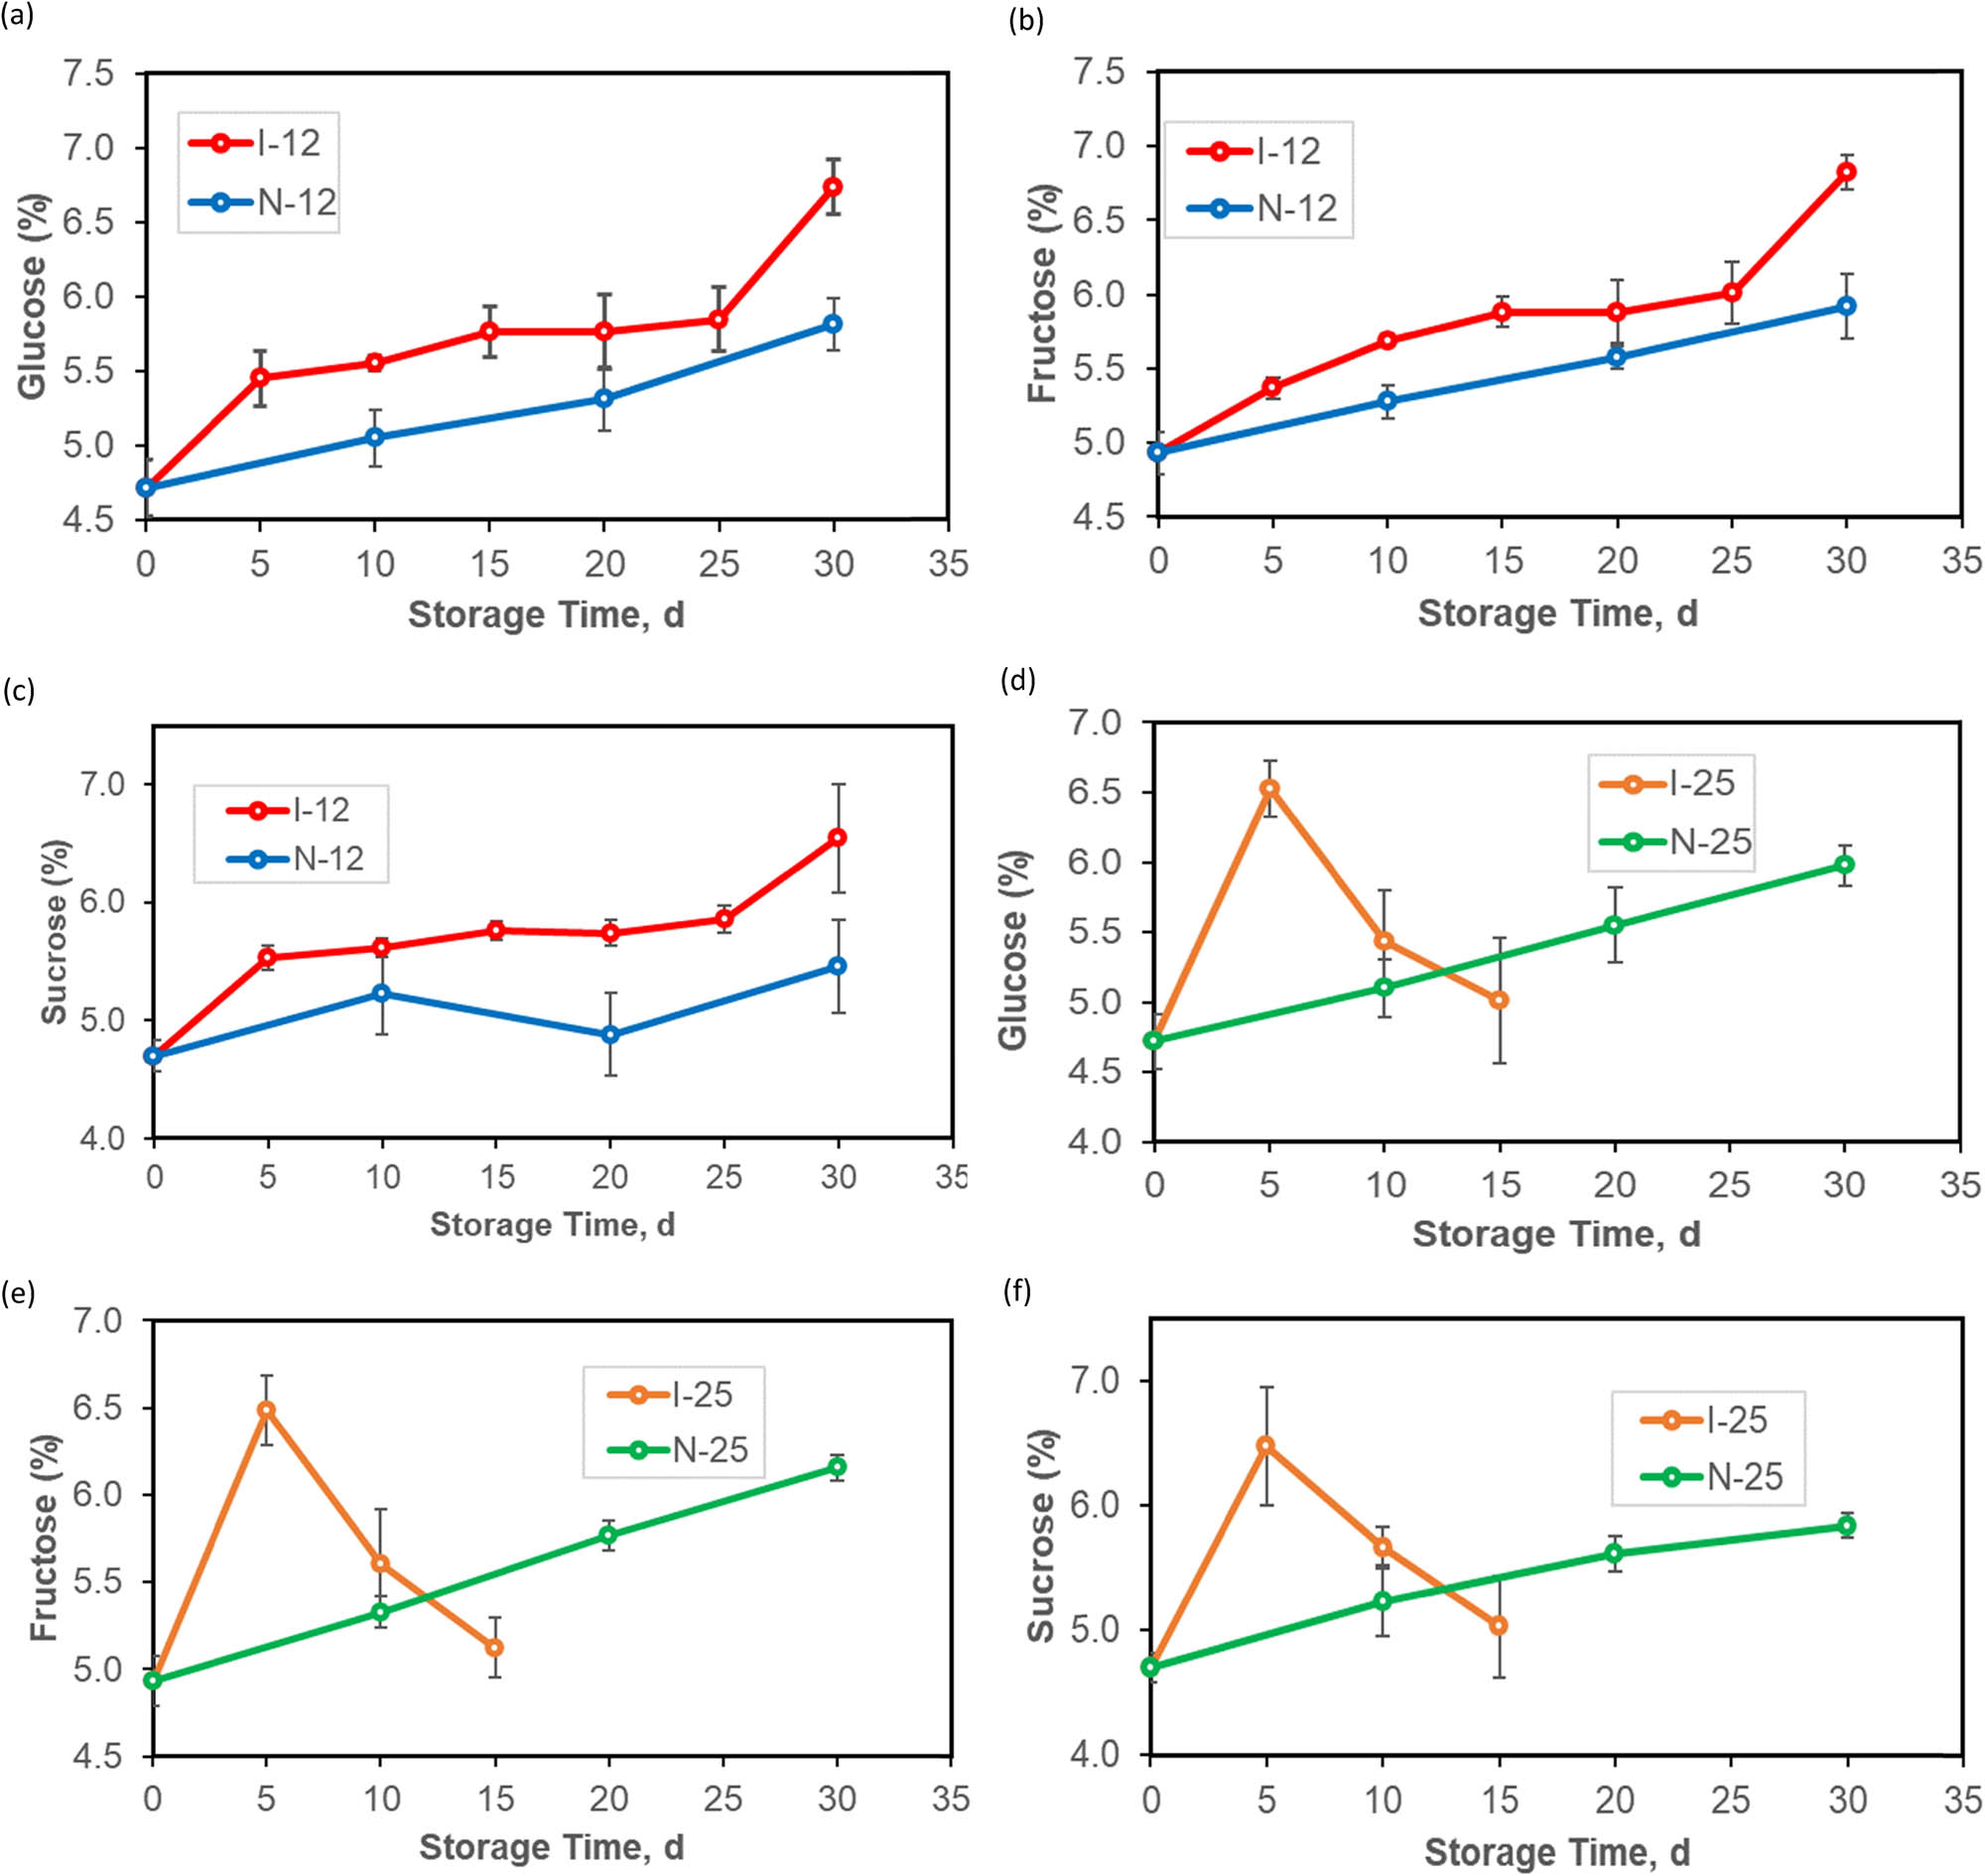
Effect of different temperatures on sugar content: (a) glucose content, 12°C storage; (b) fructose content, 12°C storage; (c) sucrose content, 12°C storage; (d) glucose content, 25°C storage; (e) fructose content, 25°C storage; and (f) sucrose content, 25°C storage of potato tubers (n = 183).
In this study, noninfected infected potatoes exhibited lower glucose content compared to those infected with Fusarium spp. fungi. Under stressful conditions, like fungal infection by Fusarium spp., potatoes experience an increase in sugar content. This rise serves as a marker for the activation of molecular responses [7]. Consequently, infected potatoes tend to undergo more rapid changes in their chemical composition. During a 30-day storage period, the glucose content of noninfected potatoes remained relatively stable, with minimal variation, as shown by the low standard deviation.
According to Lastochkina et al. [44], the increase in reducing sugar content, especially fructose, in Fusarium spp. infected potatoes is greater compared to noninfected potatoes after 6 months of storage. This is likely due to starch hydrolysis (the process of breaking down starch into simpler compounds), resulting in the formation of free sugars.
Sucrose present in potatoes can serve as a variable for assessing the maturity level of the potatoes (such as determining the time at which the potato tubers should be harvested) as well as the impact of fungal infestation (such as infection caused by Fusarium spp.) on the internal integrity of the potatoes [45]. The sugar content, including sucrose, glucose, and fructose, decreases during tuber development. Additionally, the average tuber weight is negatively correlated with the content of sucrose and reducing sugars. This suggests that as the tubers mature, the sucrose content decreases [46].
3.2 Vis–NIR spectra analysis
3.2.1 Profile of Vis–NIR spectra
Calculating the averages of both the original Vis–NIR spectra and the Vis–NIR on original spectra and preprocessed using the Savitzky–Golay first derivative method for infected (I-12, I-25) and noninfected (N-12, N-25) potatoes are presented in Figure 6. Figure 6a shows that the original spectra of infected (I-12, I-25) potatoes had the highest reflectance (or the lowest absorbance), whereas those of noninfected (N-12, N-25) potatoes had the lowest reflectance (or the highest absorbance). All of the spectra exhibited similar patterns that showed carotenoid-related absorbance peaks at 480 nm [47]. Noninfected (N-12, N-25) potatoes had lower reflectance (higher absorbance) at 670 nm, which corresponded to chlorophyll, than infected (I-12, I-25) potatoes, indicating that healthy potatoes absorbed more energy in the chlorophyll region than in other regions. A similar study reported that the chlorophyll content of healthy tomatoes is higher than that of tomatoes with Fusarium spp. infection [48].
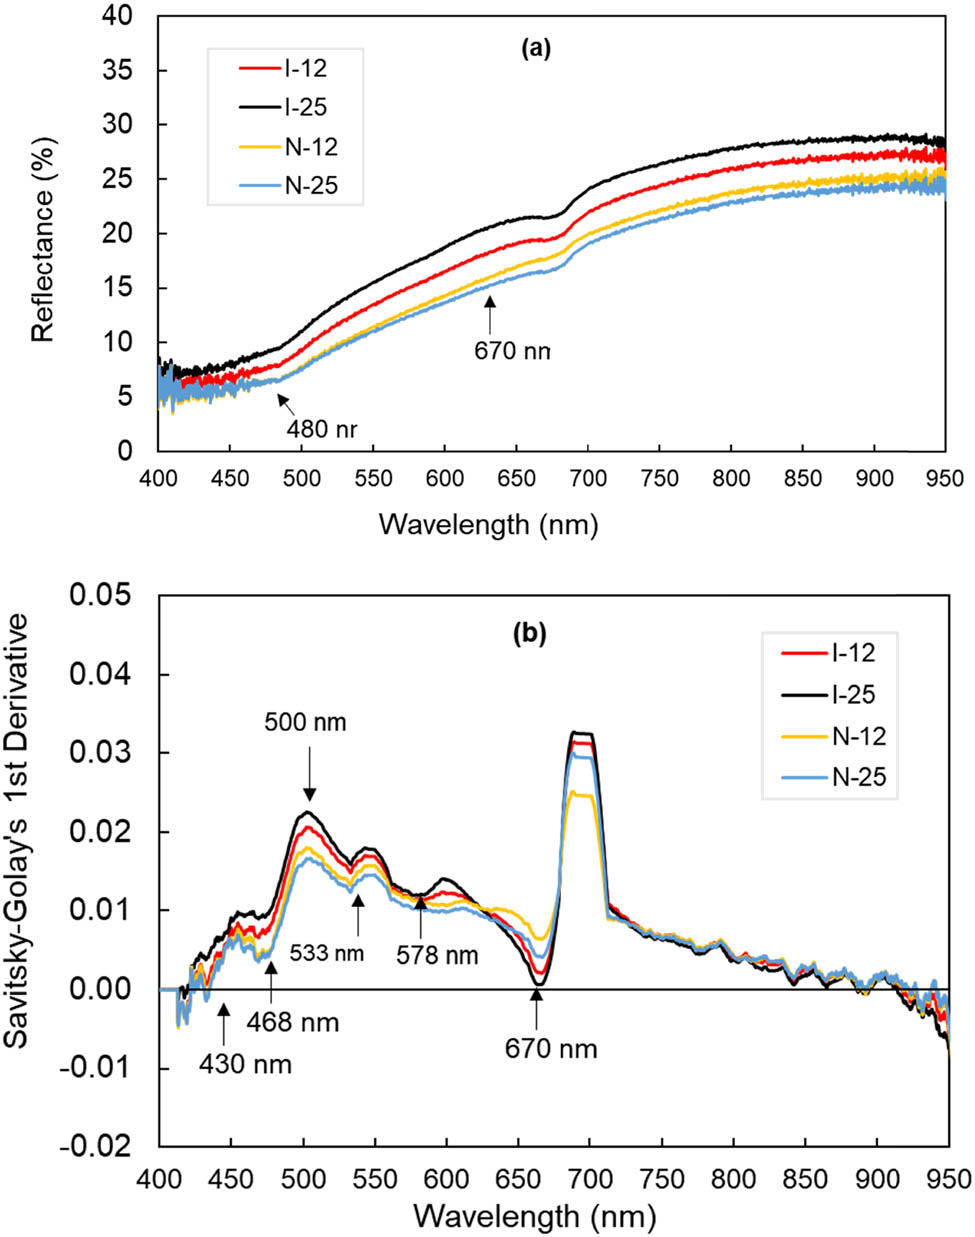
Vis–NIR spectra of infected and noninfected potatoes at different storage temperatures (12 and 25°C), generated from (a) original spectra and (b) preprocessed spectra by the Savitzky–Golay first derivative method.
Figure 6b shows that several peaks and valleys became increasingly distinct after the spectra were preprocessed by the Savitzky–Golay first derivative method. Infected (I-12, I-25) and noninfected (N-12, N-25) potatoes exhibited considerable variations in absorbance around approximate wavelength ranges of 400–700 and 700–950 nm. The peak at 670 nm corresponded to chlorophyll while that at 710 nm corresponded to fructose and glucose [49]. As evident from their absorption profiles, noninfected (N-12, N-25) potatoes showed higher chlorophyll absorption but lower sugar content than infected (I-12, I-25) potatoes.
The absorption peak at 950 nm, corresponding to the O–H molecules of water, was also observed: the difference between the water contents of infected (I-12, I-25) and noninfected (N-12, N-25) samples may be due to Fusarium-induced water deficit stress, which led to water reduction as previously reported for infected apple seedlings [50].
The most important pigments in potatoes are carotenoids, anthocyanins, and chlorophylls [51]. Only the peaks corresponding to carotenoids were visible in the original spectra, as shown in Figure 6a. However, the spectra preprocessed by the Savitzky–Golay first derivative method (Figure 5b) had distinct absorption peaks corresponding to carotenoids at 400–450 nm [26], those corresponding to anthocyanins at 500–600 nm [52], and those corresponding to chlorophylls at 670 nm [49].
3.2.2 PCA modeling
Figure 7a shows the score plot of PC-1 and PC-2 that was constructed to detect principal groupings among the observations. This plot was generated using the spectra preprocessed by the Savitzky–Golay second derivative method. The model presented in Figure 7a shows that the groups of infected and noninfected potato samples mostly overlapped. The differentiation between the two categories became increasingly apparent in the two-dimensional plot. The PCA model explained 81% of the variance in the data, in which 71 and 10% could be attributed to PC-1 and PC-2, respectively. Figure 7b shows that six PCs were found to be responsible for more than 90% of the cumulative explained variance in the calibration and validation steps (94.6 and 93.05%, respectively). Therefore, based on this result, six PCs were selected as input variables for the development of the PCA–LDA model. The use of just six PCs to explain more than 90% of the variance in the data suggests that these components capture a significant amount of the overall variation in the data. Figure 7c shows the PC1 loading values of the spectral data along with the regions of the spectra wherein the variations among potato samples were prominently discernible. The loading plot (Figure 7c) shows the significance of variables for the model and was utilized to interpret the relationships among the variables and clusters observed in the score plot. As seen from the plot presented in Figure 7c, potato samples can be differentiated through Vis–NIR spectroscopy based on the wavelengths at 417 and 976 nm. These particular peaks are associated with the typical fingerprint regions of carotenoids (400–450 nm) and starch (960–980 nm) [26,53,54]. A previous research has indicated that biotic stress, specifically viral infection, has an adverse effect on parameters related to starch quality and reported a considerable reduction in starch content due to Fusarium spp. infection in potatoes during storage [6].

PCA model using Vis–NIR spectra: (a) PC1–PC2 score plot, (b) explained variance (%) of PCs considered in the PCA model, and (c) loading plot of PC-1 and PC-2.
3.2.3 PCA–LDA modeling
The PCA–LDA differentiation of infected and noninfected potato tubers based on Vis–NIR spectra is shown in Table 3. The classification accuracies during the recognition and validation stages of the potato sample differentiation using the original Vis–NIR spectra were 74.41 and 43.33%, respectively. Among all preprocessing methods, AN was the most inaccurate and had the highest misclassification rate of 78.95%. The best model for Vis–NIR spectroscopy was obtained using spectra preprocessed by the Savitzky–Golay second derivative method, which exhibited an accuracy of 80.26% for calibration and 52.27% for prediction.
Differentiation of stored potato tubers using the PCA–LDA model based on Vis–NIR spectra
| Spectra | Performance | Calibration | Prediction | ||||||||||||
|---|---|---|---|---|---|---|---|---|---|---|---|---|---|---|---|
| Raw | Norm | SNV | MSC | SG | SGD1 | SGD2 | Raw | Norm | SNV | MSC | SG | SGD1 | SGD2 | ||
| Vis–NIR | Accuracy | 65.79 | 78.95 | 73.68 | 73.68 | 65.79 | 73.68 | 80.26 | 50.00 | 52.27 | 52.27 | 52.27 | 54.55 | 63.64 | 52.27 |
| Reliability | 29.75 | 78.95 | 51.46 | 51.46 | 29.75 | 48.71 | 65.00 | 28.28 | 32.32 | 36.44 | 36.44 | 28.17 | 52.53 | 44.72 | |
| Misclassification rate | 34.21 | 78.95 | 26.32 | 26.32 | 34.21 | 26.32 | 19.74 | 50.00 | 47.73 | 47.73 | 47.73 | 45.45 | 36.36 | 47.73 | |
Raw = Original spectra, Norm = Area normalization, SNV = Standard normal variate, MSC = Multiplicative scatter correction, SG = Savitsky–Golay Smoothing, SGD1 = Savitsky–Golay first derivative, SGD2 = Savitsky–Golay second derivative.
The results of the PCA–LDA model developed through the utilization of a set of samples for calibration (n = 76) are shown in Figure 8. The results showed PCA–LDA separation model achieved a prediction accuracy of up to 80.26%. An accuracy of 80% is considered to be a good accuracy for a PCA–LDA model [55,56]. Table 4 presents the confusion matrix showing the classification and prediction outcomes of the PCA–LDA model in which the Savitzky–Golay second derivative method was used for preprocessing the obtained spectra. Notably, the highest occurrence of false predictions (n = 36) was observed for noninfected potatoes, which were mistakenly classified as infected potatoes (n = 12).
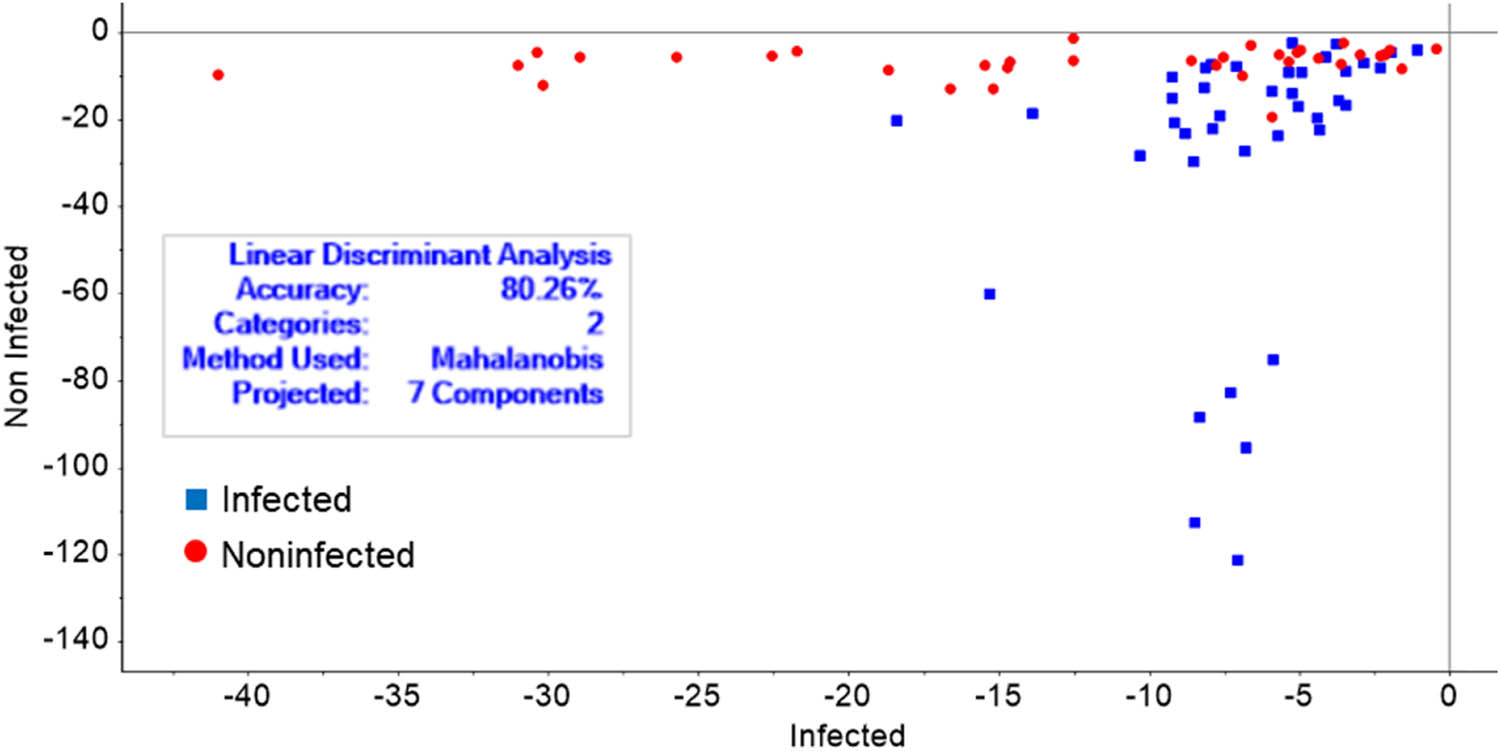
Discriminant value plot infected and noninfected sample categories based on the calibration set: PCA–LDA using Vis–NIR spectra.
Classification of potato samples using the best PCA–LDA model using Vis–NIR spectra preprocessed by the Savitsky–Golay second derivative method
| True class | Predicted class | |
|---|---|---|
| Calibration | Prediction | |
| Noninfected | Noninfected (24) | Noninfected (11) |
| Noninfected | Infected (12) | Infected (13) |
| Infected | Noninfected (3) | Noninfected (8) |
| Infected | Infected (37) | Infected (12) |
| Accuracy (%) | 80.26 | 52.27 |
| Reliability (%) | 65.00 | 44.72 |
| Misclassification rate (%) | 19.74 | 47.73 |
3.3 SW–NIR spectra analysis
3.3.1 Profile of SW–NIR spectra
The original SW–NIR spectra of noninfected and infected potatoes are shown in Figure 9a. The reflectance spectra of noninfected (N-12, N-25) and infected (I-12, I-25) potatoes exhibited the following similar patterns: high absorbance at 900 nm, low absorbance around 1,400 nm, and increased absorbance at 1,700 nm. Figure 9a shows that infected (I-12, I-25) potatoes exhibited higher reflectance around 950–1,350 nm than noninfected (N-12, N-25) potatoes. However, no apparent difference was observed between the reflectance of the two categories at around 1,400–1,700 nm. The notable absorption peaks at 995, 1,210, and 1,435 nm shown in Figure 9a correspond to water molecules [21,57]. Meanwhile, other peaks at 995 and 1,210 nm corresponded to starch [17], and those at 1,435 nm corresponded to protein [58]. Compared with infected potatoes (I-12, I-25), noninfected (N-12, N-25) ones had higher absorbance at 990 and 1,210 nm probably due to their higher water content. A similar study reported that infected apple seedlings [50] had lower water content than noninfected seedlings. Furthermore, compared with infected potatoes, noninfected potatoes had higher absorbance at 1,210 nm, indicating higher starch content [6]. Given that potatoes have low protein contents (1–2%), the high absorbance at around 1,430–1,435 nm may be related to their water content [59].
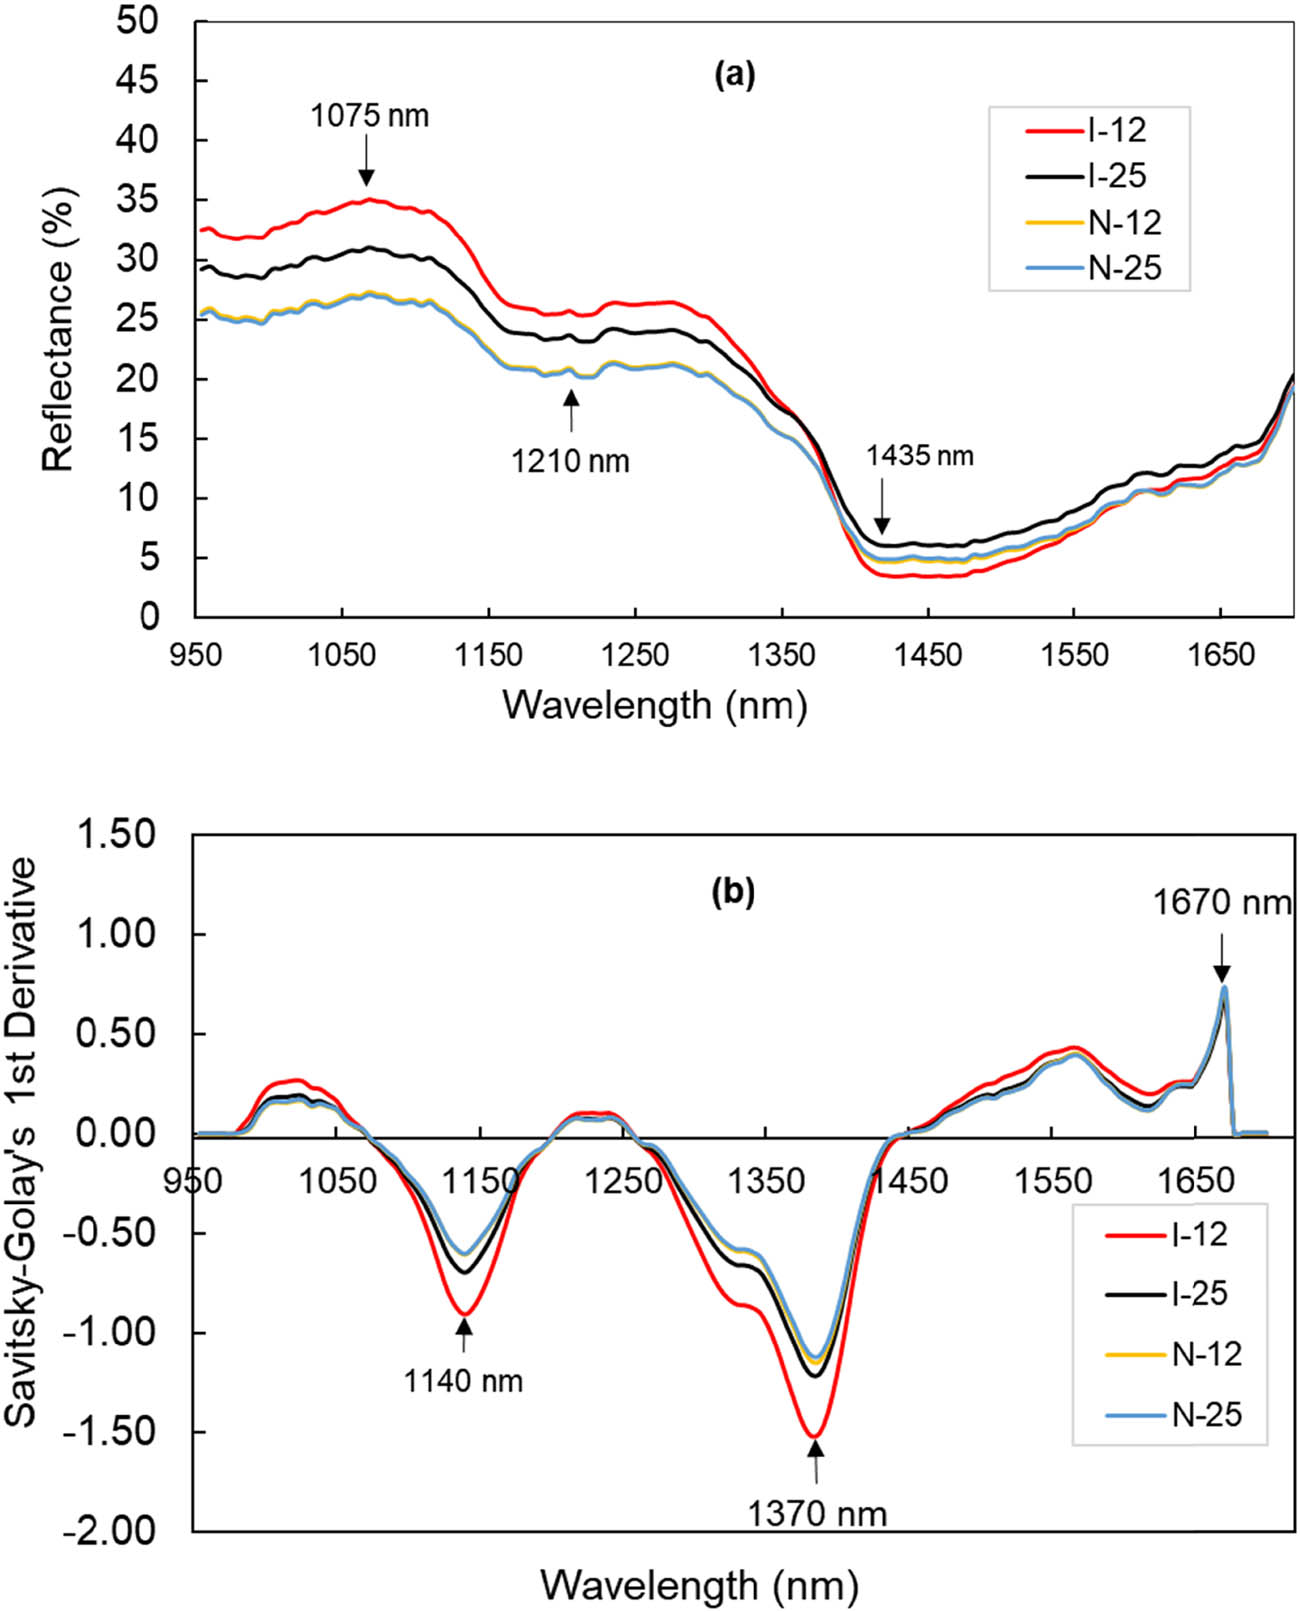
SW–NIR spectra of infected and noninfected potatoes at different storage temperatures (12 and 25°C), generated from (a) original spectra and (b) preprocessed spectra by the Savitzky–Golay first derivative method.
Figure 9b shows the SW–NIR spectral data preprocessed by the Savitzky–Golay first derivative method. We observed that the resolution of the absorbance peak between 1,065 and 1,335 nm, which represents sugar content (glucose and fructose) [60,61], considerably improved when the second derivative of the reflectance data was applied. The spectra exhibited high absorbance at 1,140 nm, which can be attributed to sugar in the sample. The additional absorption peaks or reflectance are observed at a wavelength of 1,370 nm in the SW–NIR band within the 1,355–1,400 nm region. This is visible in all three potato spectra under different storage temperature treatments, representing the second overtone of the C–H combination (carbohydrates and lipids) [58]. The NIR region provides abundant information regarding potato tubers with a particular emphasis on their major components, including moisture, carbohydrates, and protein contents [62] (Table 5).
Differentiation of stored potato tubers using the PCA–LDA model based on the SW–NIR spectra
| Spectra | Performance | Calibration | Prediction | ||||||||||||||
|---|---|---|---|---|---|---|---|---|---|---|---|---|---|---|---|---|---|
| Raw | Norm | SNV | MSC | SG | SGD1 | SGD2 | Raw | Norm | SNV | MSC | SG | SGD1 | SGD2 | ||||
| SW–NIR | Accuracy | 96.05 | 100.00 | 96.05 | 100.00 | 94.74 | 98.68 | 90.79 | 86.36 | 86.36 | 90.91 | 93.18 | 86.36 | 88.64 | 81.82 | ||
| Reliability | 89.19 | 97.30 | 94.72 | 97.30 | 86.49 | 94.59 | 78.38 | 76.15 | 76.15 | 88.35 | 84.00 | 76.15 | 80.16 | 68.14 | |||
| Misclassification rate | 3.95 | 0.00 | 3.95 | 0.00 | 5.26 | 1.32 | 9.21 | 13.64 | 13.64 | 9.09 | 6.82 | 13.64 | 11.36 | 18.18 | |||
Raw = original spectra, Norm = area normalization, SNV = standard normal variate, MSC = multiplicative scatter correction, SG = Savitsky–Golay smoothing, SGD1 = Savitsky–Golay first derivative, SGD2 = Savitsky–Golay second derivative.
3.3.2 PCA modeling
PCA provides valuable insights into the underlying causes of spectral variations among different samples. It allows for the identification of similarities and differences between samples, enabling researchers to discern the unique characteristics of each individual sample [63]. The infected and noninfected sample groups exhibited fewer overlaps with each other in the PCA model based on SW–NIR spectra (Figure 10a) than that based on Vis–NIR spectra (Figure 7a). Figure 9a shows the graphical representation or plot of PCA scores that were derived from the first and second components (PC-1 and PC-2) extracted from the initial spectra preprocessed by the AN method in the optimal LDA model (Table 6). In addition, the figure shows the partial overlap between the infected and noninfected groups. The first two components, namely PC-1 and PC-2, accounted for 98% of the variance in the data. The first main component (PC-1) was responsible for 88% of the total variance, while PC-2 was responsible for 10%. In the plot generated using PC-1 (88%), noninfected potato samples were located on the left, whereas infected potato samples were located on the right, suggesting that infected and noninfected potato samples can be potentially differentiated based on their SW–NIR spectra. Figure 10b shows that six PCs were found to account for more than 90% of the cumulative explained variance (99.98 and 99.96%) in the calibration and validation procedures. The number of PCs can vary depending on the spectral preprocessing methods used. This can lead to different numbers of PCs being retained in the model [64]. Despite using different spectral preprocessing methods, the Vis–NIR and SW–NIR models in this research resulted in similar numbers of PCs (six PCs).
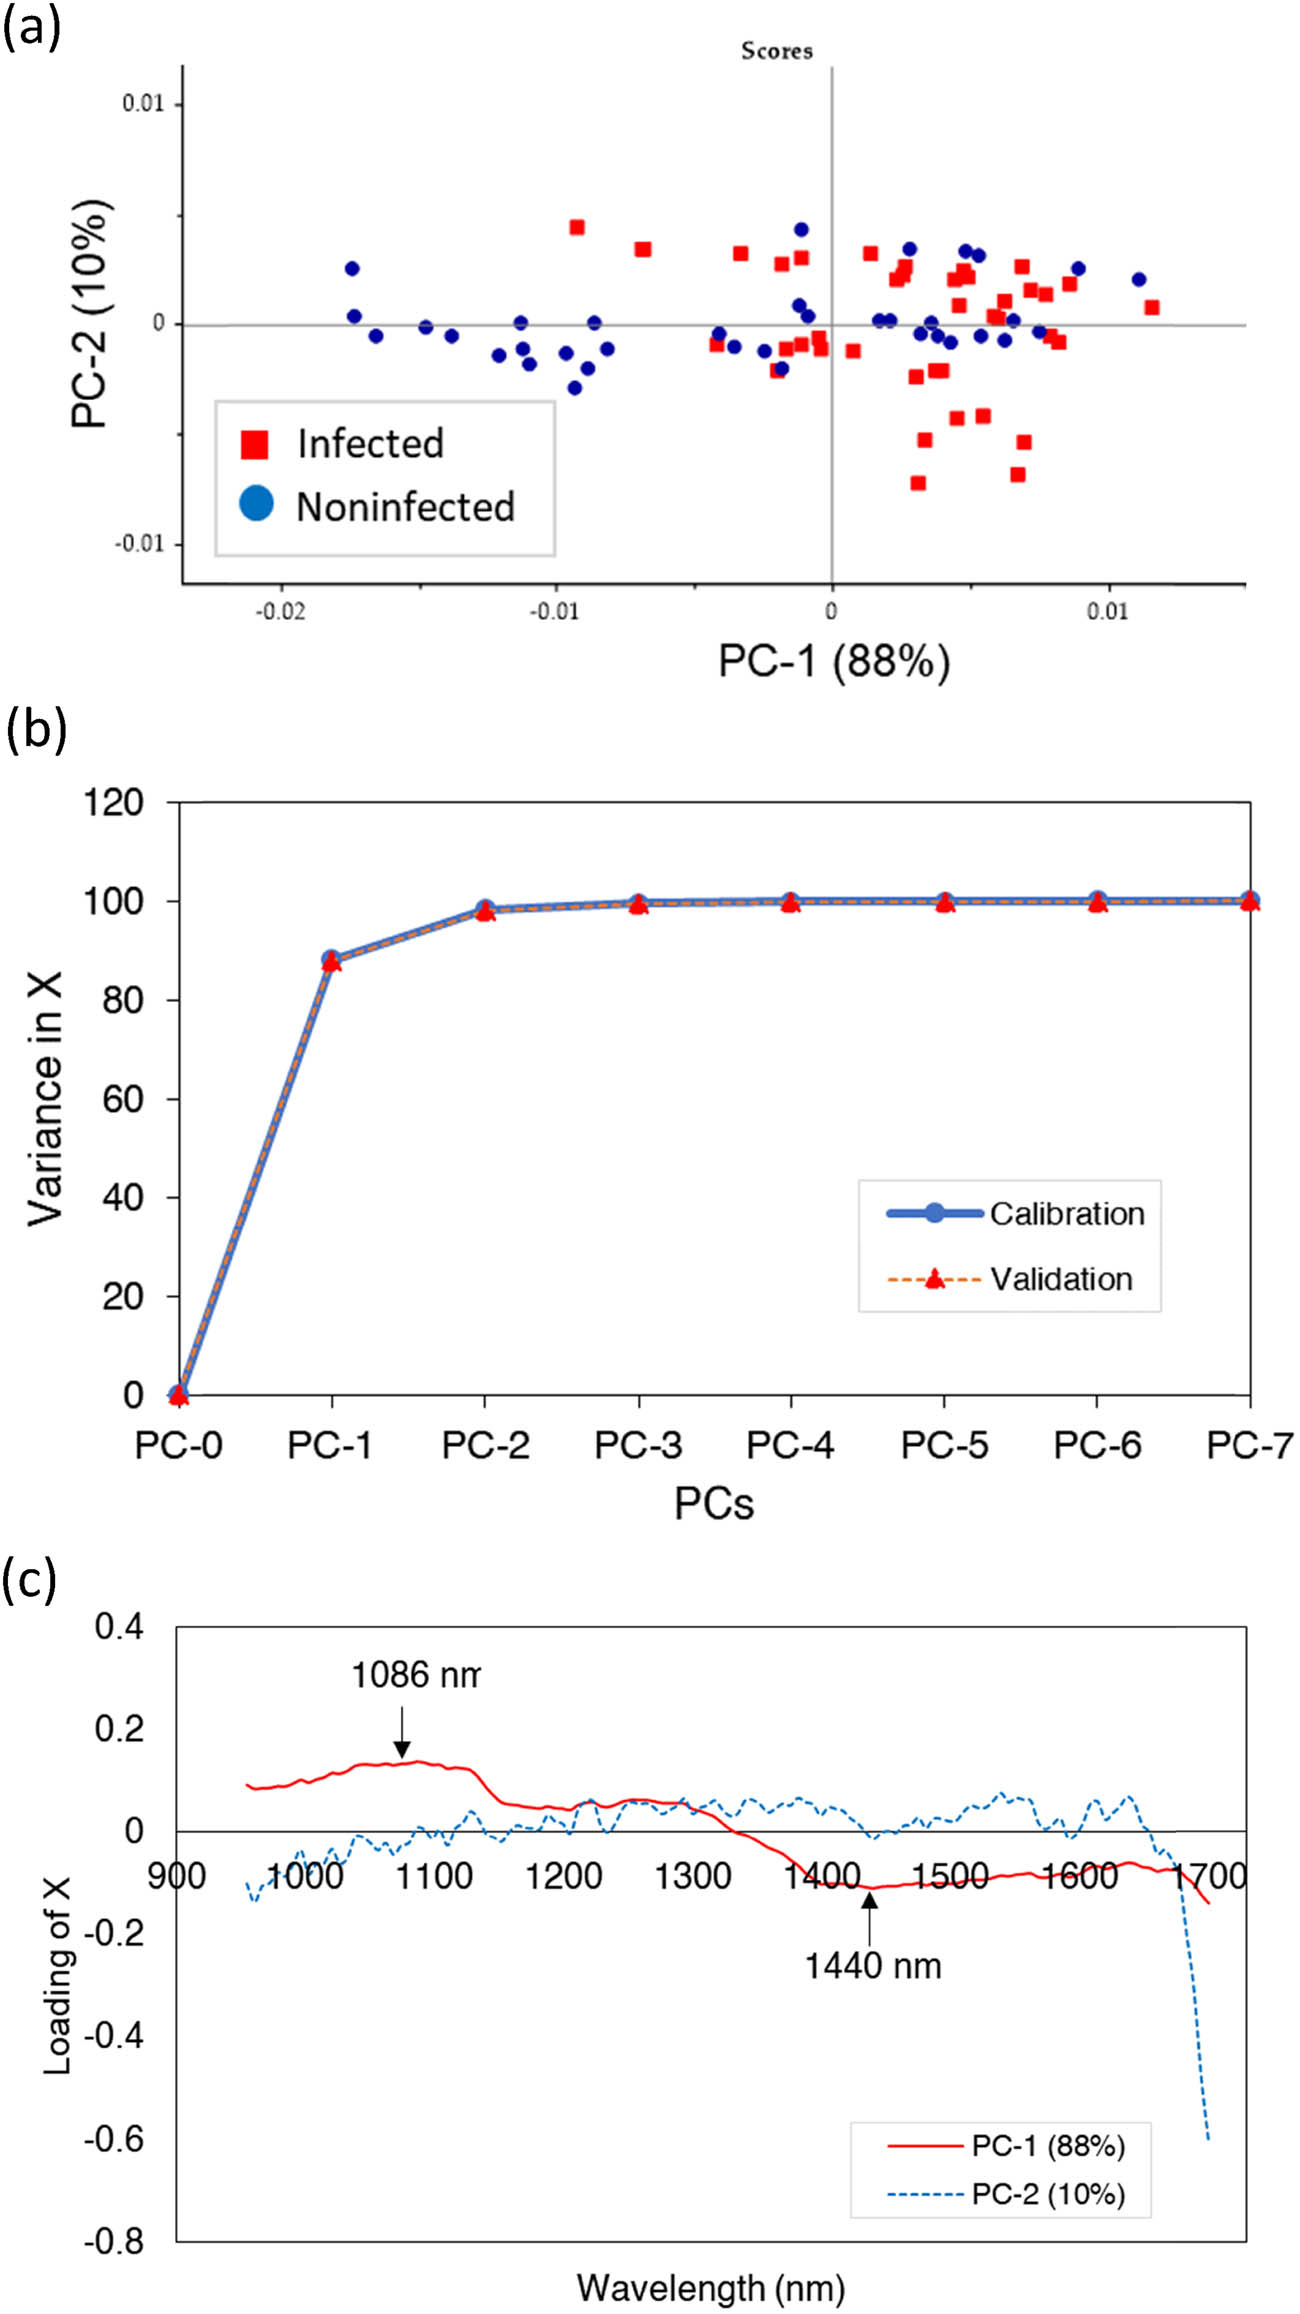
PCA model using SW-NIR spectra: (a) PC1–PC2 score plot, (b) explained variance (%) of PCs considered in the PCA model, and (c) loading plot of PC1 and PC-2.
Classification of potato samples using the best PCA–LDA model using SW-NIR spectra preprocessed by the area normalization method
| True class | Predicted class | |
|---|---|---|
| Calibration | Prediction | |
| Noninfected | Noninfected (36) | Noninfected (19) |
| Noninfected | Infected (0) | Infected (5) |
| Infected | Noninfected (0) | Noninfected (1) |
| Infected | Infected (40) | Infected (19) |
| Accuracy (%) | 100.00 | 86.36 |
| Reliability (%) | 97.30 | 76.15 |
| Misclassification rate (%) | 0.00 | 13.64 |
As inferred from the data presented in Figure 10c, the potato samples were differentiated by the wavelengths of 1,040 and 1,450 nm. The band at 1,040 nm exhibited a possible correlation with the CH and CH2 vibrations of sucrose [61]. Fusarium spp. infection has been reported to increase sugar content, especially sucrose content [7]. The 1,450 nm band is related to the first stretching vibration of the O–H bond in water. This vibration can be observed in the region of 1,400–1,600 nm [62]. During storage, several processes (transpiration, respiration, and redistribution) caused by sprouting may affect the moisture content of potato tubers [65]. SW–NIR spectroscopy can be used to differentiate between infected and noninfected potato samples based on their varying sugar contents.
3.3.3 PCA–LDA modeling
Given the constraint that the number of features should not exceed the number of samples, we first performed PCA on our high-dimensional spectral data. This approach reduced the number of features to a manageable number, allowing us to then perform LDA [66]. Evaluating the optimal number of PCs used in the model is essential for developing an effective PCA–LDA model. We performed this evaluation by conducting PCA on the IR spectra and subsequently utilizing the resulting score matrix to create a matrix of predictors. We then subjected this matrix and the membership information vector of potato samples to LDA [67]. The results obtained through LDA with leave-one-out cross-validation using AN as the best preprocessing method provided the perfect classification rate of 100 with 97.3% reliability. All samples in the calibration set were correctly classified by this processing method, as can be seen in the score plot given in Figure 11. This outcome was validated using the confusion matrix in Table 6. The confusion matrix is a tool for visualizing classification outcomes produced by the supervised method PCA–LDA. It provides data on the projected and actual classifications of specimens. In this matrix, each row denotes the occurrences in a projected class, and each column represents the occurrences in an actual class [68]. The appropriate classification accuracies during model construction (calibration) and testing (prediction) were 100 and 86.36%, respectively. The comparison of the Vis–NIR and SW–NIR spectroscopy results revealed that SW–NIR spectroscopy demonstrated a slightly higher level of accuracy than Vis–NIR spectroscopy in differentiating between infected and noninfected potato samples.
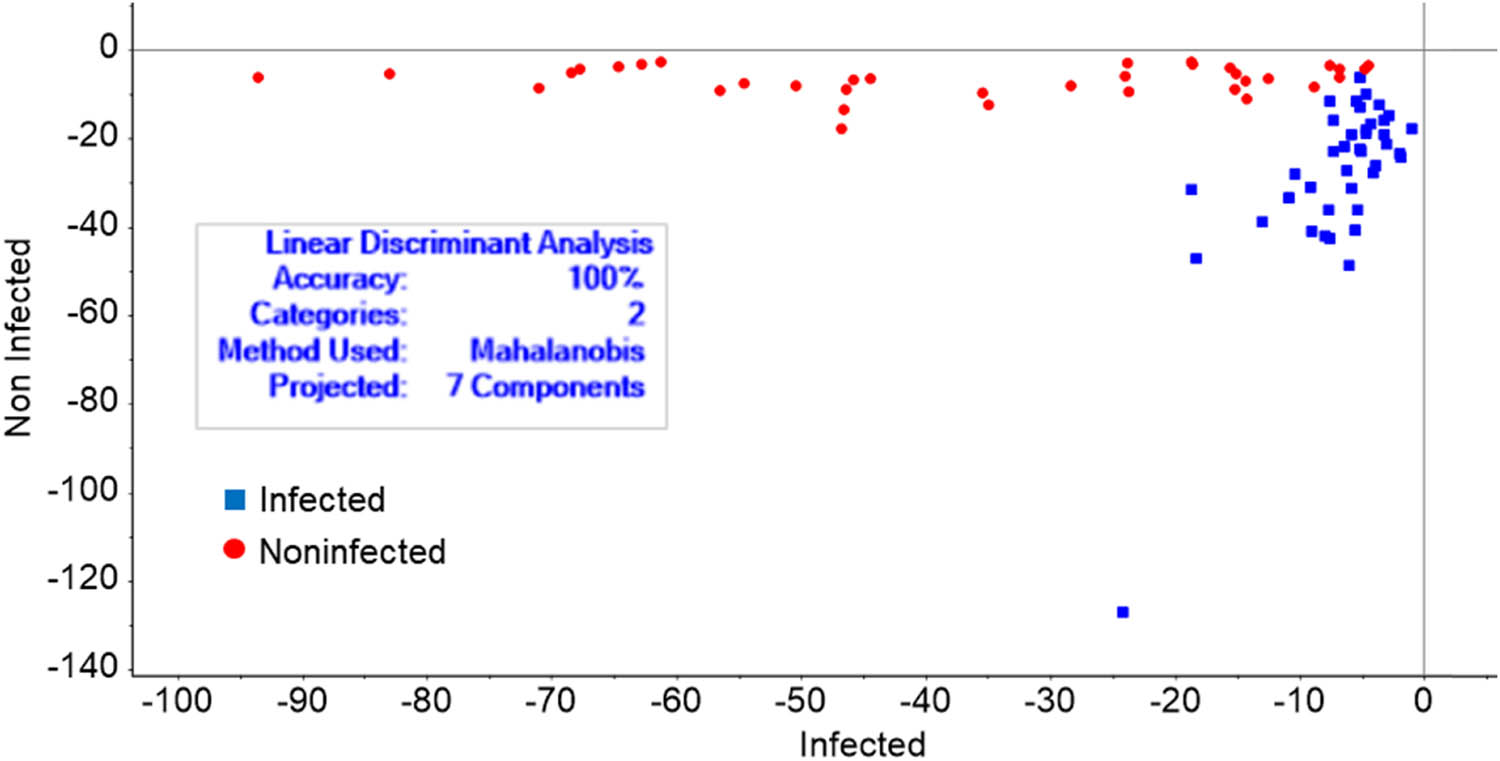
Discriminant value plot for infected and noninfected sample categories based on the calibration set: PCA–LDA using SW–NIR spectra.
4 Conclusion
Modular Vis–NIR and SW–NIR reflectance spectroscopy were applied to differentiate between healthy potato tubers and those infected with Fusarium spp. fungi. Potato samples were inoculated with the mycelia of the fungal species F. solani through artificial and natural methods. The results suggested that SW–NIR spectroscopy had higher accuracy than Vis–NIR spectroscopy. Based on PCA–LDA, the most accurate classification model achieved 100% accuracy and 97.30% reliability in differentiating infected and noninfected potatoes based on their SW–NIR spectra. The model correctly classified all the data sets that were tested. However, the efficiency of the classification model could be improved by updating the spectral database used to train the model. Our fingerprinting approach is expected to play an important role in the rapid analysis of the internal quality of potato tubers. Moreover, the spectra obtained in this work can serve as a reference for future studies on the analysis of internal potato quality that may employ Vis–NIR and SW–NIR spectroscopy.
Despite some limitations in model calibration, this technology holds considerable potential for on-site application in potato warehouses, making it an attractive option for the potato-production sector. Our research findings are noteworthy in the context of early detection systems that employ modular Vis–NIR and SW–NIR reflectance spectroscopy as a tool for the quality control of fresh potatoes. This technology is expeditious and uncomplicated because it does not require the chemical processing of samples. This technique can be deemed viable and efficacious for regulating the quality of potatoes and effectively minimize the risk of infected potatoes contaminating healthy tubers, thereby preventing resource loss.
Acknowledgement
The authors thank PT. BISI International, Tbk (Seed and Agrochemical Company, Indonesia) for the support.
-
Funding information: This article was funded by the Final Project Recognition Grant Universitas Gadjah Mada Number 5075/UN1.P.II/Dit-Lit/PT.01.01/2023.
-
Author contributions: All authors accepted the responsibility for the content of the manuscript and consented to its submission, reviewed all the results, and approved the final version of the manuscript. EWP and REM designed the experiments; EWP and IF carried out the experiments; EWP and MFRP developed the model and performed the simulations; HZA and REM validated the data; EWP prepared the manuscript with contributions from REM.
-
Conflict of interest: Authors state no conflict of interest.
-
Data availability statement: The data sets generated during and/or analyzed during the current study are available from the corresponding author upon reasonable request.
References
[1] Soare E, Chiurciu IA. Study on the dynamics of potato production and worldwide trading during the period 2012–2019. Sci Pap Ser Manag Econ Eng Agric Rural Dev. 2022;21(182):2021.Suche in Google Scholar
[2] Beals KA. Potatoes, nutrition and health. Am J Potato Res. 2019;96(2):102–10. 10.1007/s12230-018-09705-4.Suche in Google Scholar
[3] Struik PC, Wiersema SG. Seed potato technology. Wageningen: Wageningen Academic Publishers; 1999.10.3920/978-90-8686-759-2Suche in Google Scholar
[4] Tiwari RK, Kumar R, Sharma S, Sagar V, Aggarwal R, Naga KC, et al. Potato dry rot disease: current status, pathogenomics and management. 3 Biotech. 2020;10(11):1–18. 10.1007/s13205-020-02496-8.Suche in Google Scholar PubMed PubMed Central
[5] Shaumi A, Cheng UC, Guo SY, Jones EBG, Chan TY, Pang KL. Diversity of fungi isolated from carapace and gut of the marine crab Portunus sanguinolentus in northern waters of Taiwan. Bot Mar. 2023;66(4):301–7. 10.1515/bot-2022-0081.Suche in Google Scholar
[6] Tiwari RK, Lal MK, Kumar R, Sharma S, Sagar V, Kumar A, et al. Impact of fusarium infection on potato quality, starch digestibility, in vitro glycemic response, and resistant starch content. J Fungi. 2023;9(4):466. 10.3390/jof9040466.Suche in Google Scholar PubMed PubMed Central
[7] Tiwari RK, Bashyal BM, Shanmugam V, Lal MK, Kumar R, Sharma S, et al. Impact of Fusarium dry rot on physicochemical attributes of potato tubers during postharvest storage. Postharvest Biol Technol. 2021 Nov;181:111638. 10.1016/j.postharvbio.2021.111638.Suche in Google Scholar
[8] Kumar D, Singh BP, Kumar P. An overview of the factors affecting sugar content of potatoes. Ann Appl Biol. 2004 Dec;145(3):247–56. 10.1111/j.1744-7348.2004.tb00380.x.Suche in Google Scholar
[9] Kwon HW, Yoon JH, Kim SH, Hong SB, Cheon Y, Ko SJ. Detection of extracellular enzymes activities in various Fusarium spp. Mycobiology. 2007;35(3):162. 10.4489/MYCO.2007.35.3.162.Suche in Google Scholar PubMed PubMed Central
[10] Heltoft P, Brurberg MB, Skogen M, Le VH, Razzaghian J, Hermansen A. Fusarium spp. causing dry rot on potatoes in norway and development of a real-time PCR method for detection of Fusarium coeruleum. Potato Res. 2016 Mar;59(1):67–80. 10.1007/s11540-015-9313-5.Suche in Google Scholar
[11] Omori AM, Ono EYS, Bordini JG, Hirozawa MT, Fungaro MHP, Ono MA. Detection of Fusarium verticillioides by PCR-ELISA based on FUM21 gene. Food Microbiol. 2018;73:160–7. 10.1016/j.fm.2018.01.020.Suche in Google Scholar PubMed
[12] Chang Z, Lv J, Qi H, Ma Y, Chen D, Xie J, et al. Bacterial infection potato tuber soft rot disease detection based on electronic nose. Open Life Sci. 2017 Nov;12(1):379–85. 10.1515/biol-2017-0044.Suche in Google Scholar
[13] Korchagin SA, Gataullin ST, Osipov AV, Smirnov MV, Suvorov SV, Serdechnyi DV, et al. Development of an optimal algorithm for detecting damaged and diseased potato tubers moving along a conveyor belt using computer vision systems. Agronomy. 2021 Sep;11(10):1980. 10.3390/agronomy11101980.Suche in Google Scholar
[14] Moallem P, Razmjooy N, Ashourian M. Computer vision-based potato defect detection using neural networks and support vector machine. Int J Robot Autom. 2013;28(2):137–45. 10.2316/Journal.206.2013.2.206-3746.Suche in Google Scholar
[15] Masithoh RE, Amanah HZ, Cho BK. Application of fourier transform near-infrared (FT-NIR) and fourier transform infrared (FT-IR) spectroscopy coupled with wavelength selection for fast discrimination of similar color of tuber flours. Indones J Chem. 2019;20(3):680–6. Article in. 10.22146/ijc.48092.Suche in Google Scholar
[16] Masithoh RE, Lohumi S, Yoon WS, Amanah HZ, Cho BK. Development of multi-product calibration models of various root and tuber powders by fourier transform near infra-red (FT-NIR) spectroscopy for the quantification of polysaccharide contents. Heliyon. 2020;6(10):1–7. 10.1016/j.heliyon.2020.e05099.Suche in Google Scholar PubMed PubMed Central
[17] López A, Arazuri S, García I, Mangado J, Jarén C. A review of the application of near-infrared spectroscopy for the analysis of potatoes. J Agric Food Chem. 2013 Jun;61(23):5413–24. 10.1021/jf401292j.Suche in Google Scholar PubMed
[18] Zhang H, Duan Z, Li Y, Zhao G, Zhu S, Fu W, et al. Vis/NIR reflectance spectroscopy for hybrid rice variety identification and chlorophyll content evaluation for different nitrogen fertilizer levels. R Soc Open Sci. 2019;6(10):1–13. 10.1098/rsos.191132.Suche in Google Scholar PubMed PubMed Central
[19] Davey MW, Saeys W, Hof E, Ramon H, Swennen RL, Keulemans J. Application of visible and near-infrared reflectance spectroscopy (Vis/NIRS) to determine carotenoid contents in banana (Musa spp.) fruit pulp. J Agric Food Chem. 2009 Mar;57(5):1742–51. 10.1021/jf803137d.Suche in Google Scholar PubMed
[20] Manley M. Near-infrared spectroscopy and hyperspectral imaging: non-destructive analysis of biological materials. Chem Soc Rev. 2014;43(24):8200–14. 10.1039/C4CS00062E.Suche in Google Scholar
[21] Rady AM, Guyer DE. Evaluation of sugar content in potatoes using NIR reflectance and wavelength selection techniques. Postharvest Biol Technol. 2015 May;103:17–26. 10.1016/j.postharvbio.2015.02.012.Suche in Google Scholar
[22] Masithoh RE, Amanah HZ, Yoon WS, Joshi R, Cho BK. Determination of protein and glucose of tuber and root flours using NIR and MIR spectroscopy. Infrared Phys Technol. 2021 Mar;113:103577. 10.1016/j.infrared.2020.103577.Suche in Google Scholar
[23] Alander JT, Bochko V, Martinkauppi B, Saranwong S, Mantere T. A review of optical nondestructive visual and near-infrared methods for food quality and safety. Int J Spectrosc. 2013 Mar;2013:1–36. 10.1155/2013/341402.Suche in Google Scholar
[24] Masithoh RE, Pahlawan MFR, Wati RK. Non-destructive determination of SSC and pH of banana using a modular Vis/NIR spectroscopy: Comparison of partial least square (PLS) and principle component regression (PCR). IOP Conf Ser Earth Env Sci. 2021;752(1):12047. 10.1088/1755-1315/752/1/012047.Suche in Google Scholar
[25] Pahlawan MFR, Wati RK, Masithoh RE. Development of a low-cost modular VIS/NIR spe ctroscopy for predicting soluble solid content of banana. In IOP Conference Series: Earth and Environmental Science; 2021.10.1088/1755-1315/644/1/012047Suche in Google Scholar
[26] Pratiwi EZD, Pahlawan MFR, Rahmi DN, Amanah HZ, Masithoh RE. Non-destructive evaluation of soluble solid content in fruits with various skin thicknesses using visible–shortwave near-infrared spectroscopy. Open Agric. 2023 Mar;8(1):1–12. 10.1515/opag-2022-0183.Suche in Google Scholar
[27] Wati RK, Pahlawan MFR, Masithoh RE. Development of calibration model for pH content of intact tomatoes using a low-cost Vis/NIR spectroscopy. IOP Conf Ser Earth Environ Sci. 2021 Mar;686(1):012049. 10.1088/1755-1315/686/1/012049.Suche in Google Scholar
[28] Priambodo DC, Saputro D, Pahlawan MFR, Saputro AD, Masithoh RE. Determination of acid level (pH) and moisture content of cocoa beans at various fermentation level using visible near-infrared (Vis-NIR) spectroscopy. IOP Conf Ser Earth Environ Sci. 2022 Feb;985(1):012045. 10.1088/1755-1315/985/1/012045.Suche in Google Scholar
[29] Rahmia DN, Pratiwi EZD, Pahlawan MFR, Amanah HZ, Masithoh RE. Non-destructive measurement of malic acid content of sapodilla fruit using visible near infrared (VisNIR) spectroscopy with variations in storage temperature. IOP Conf Ser Earth Environ Sci. 2022 Dec;1116(1):012027. 10.1088/1755-1315/1116/1/012027.Suche in Google Scholar
[30] Saputri DAS, Fahri Reza Pahlawan M, Murti BMA, Masithoh RE. Vis/NIR spectroscopy for non-destructive method in detecting soybean seeds viability. IOP Conf Ser Earth Environ Sci. 2022 Jun;1038(1):012043. 10.1088/1755-1315/1038/1/012043.Suche in Google Scholar
[31] Rahmawati L, Masithoh RE, Pahlawan MFR, Hariadi H. Detection of encapsulant addition in butterfly-pea (Clitoria ternatea L.) extract powder using visible-near infrared spectroscopy and chemometrics analysis. Open Agric J. 2022;711–23. 10.1515/opag-2022-0135.Suche in Google Scholar
[32] Huang Y, Cavinato AG, Mayes DM, Kangas LJ, Bledsoe GE, Rasco BA. Nondestructive determination of moisture and sodium chloride in cured atlantic salmon (Salmo salar) (Teijin) using short-wavelength near-infrared Spectroscopy (SW-NIR). J Food Sci. 2003 Mar;68(2):482–6. 10.1111/j.1365-2621.2003.tb05698.x.Suche in Google Scholar
[33] Dharmawan A, Masithoh RE, Amanah HZ. Development of PCA-MLP model based on visible and shortwave near infrared spectroscopy for authenticating Arabica coffee origins. Foods. 2023;12(11):2112. 10.3390/foods12112112.Suche in Google Scholar PubMed PubMed Central
[34] Gudkov SV, Matveeva TA, Sarimov RM, Simakin AV, Stepanova EV, Moskovskiy MN, et al. Optical methods for the detection of plant pathogens and diseases (review). Agriengineering. 2023 Oct;5(4):1789–812. 10.3390/agriengineering5040110.Suche in Google Scholar
[35] Magwaza LS, Opara UL, Nieuwoudt H, Cronje PJR, Saeys W, Nicolaï B. NIR spectroscopy applications for internal and external quality analysis of citrus fruit—A review. Food Bioprocess Technol. 2012 Feb;5(2):425–44. 10.1007/s11947-011-0697-1.Suche in Google Scholar
[36] Fu X, Ying Y, Lu H, Xu H. Comparison of diffuse reflectance and transmission mode of visible-near infrared spectroscopy for detecting brown heart of pear. J Food Eng. 2007 Dec;83(3):317–23. 10.1016/j.jfoodeng.2007.02.041.Suche in Google Scholar
[37] López-Maestresalas A, Keresztes JC, Goodarzi M, Arazuri S, Jarén C, Saeys W. Non-destructive detection of blackspot in potatoes by Vis-NIR and SWIR hyperspectral imaging. Food Control. 2016 Dec;70:229–41. 10.1016/j.foodcont.2016.06.001.Suche in Google Scholar
[38] Zhang W, Wang A, Lv Z, Gao Z. Nondestructive measurement of kiwifruit firmness, soluble solid content (SSC), titratable acidity (TA), and sensory quality by vibration spectrum. Food Sci Nutr. 2020 Feb;8(2):1058–66. 10.1002/fsn3.1390.Suche in Google Scholar PubMed PubMed Central
[39] López A, Jarén C, Arazuri S. Analysis of the influence of the skin on the near infrared absorbance spectra of potato tubers. NIR News. 2014 May;25(3):6–8. 10.1255/nirn.1433.Suche in Google Scholar
[40] dos Santos Costa D, Oliveros Mesa NF, Santos Freire M, Pereira Ramos R, Teruel Mederos BJ. Development of predictive models for quality and maturation stage attributes of wine grapes using vis-nir reflectance spectroscopy. Postharvest Biol Technol. 2019 Apr;150(January):166–78. 10.1016/j.postharvbio.2018.12.010.Suche in Google Scholar
[41] Raypah ME, Zhi LJ, Loon LZ, Omar AF. Near-infrared spectroscopy with chemometrics for identification and quantification of adulteration in high-quality stingless bee honey. Chemom Intell Lab Syst. 2022 May;224(Jan):104540. 10.1016/j.chemolab.2022.104540.Suche in Google Scholar
[42] Kongklad G, Chitaree R, Taechalertpaisarn T, Panvisavas N, Nuntawong N. Discriminant analysis PCA-LDA assisted surface-enhanced Raman spectroscopy for direct identification of malaria-infected red blood cells. Methods Protoc. 2022;5(3):49. 10.3390/mps5030049.Suche in Google Scholar PubMed PubMed Central
[43] Wharton P, Hammerschmidt R, Kirk W. Fusarium dry rot. Michigan Potato Dis. 2007;E-2992(May):1–6.Suche in Google Scholar
[44] Lastochkina O, Pusenkova L, Garshina D, Yuldashev R, Shpirnaya I, Kasnak C, et al. The effect of endophytic bacteria bacillus subtilis and salicylic acid on some resistance and quality traits of stored solanum tuberosum l. Tubers infected with fusarium dry rot. Plants. 2020;9(6):1–22. 10.3390/plants9060738.Suche in Google Scholar PubMed PubMed Central
[45] Pinhero RG, Yada RY. Postharvest storage of potatoes. Advances in potato chemistry and technology. 2nd edn. Amsterdam, Netherlands: Elsevier Inc; 2016. p. 283–314.10.1016/B978-0-12-800002-1.00010-8Suche in Google Scholar
[46] Gong HL, Chen QQ. Exogenous sucrose protects potato seedlings against heat stress by enhancing the antioxidant defense system. J Soil Sci Plant Nutr. 2021 Jun;21(2):1511–9. 10.1007/s42729-021-00457-5.Suche in Google Scholar
[47] Rodriguez-Amaya DB. Natural food pigments and colorants. Curr Opin Food Sci. 2016;7:20–6. 10.1016/j.cofs.2015.08.004.Suche in Google Scholar
[48] Attia MS, El-Wakil DA, Hashem AH, Abdelaziz AM. Antagonistic effect of plant growth-promoting fungi against Fusarium wilt disease in tomato: In vitro and in vivo study. Appl Biochem Biotechnol. 2022;194(11):5100–18. 10.1007/s12010-022-03975-9.Suche in Google Scholar PubMed PubMed Central
[49] Chen JY, Han Z, Yelian M, Ryuji M. Nondestructive determination of sugar content in potato tubers. Jpn J Food Eng. 2010;11(1):59–64.10.11301/jsfe.11.59Suche in Google Scholar
[50] Yan K, Han G, Ren C, Zhao S, Wu X, Bian T. Fusarium solani infection depressed photosystem performance by inducing foliage wilting in apple seedlings. Front Plant Sci. 2018;9:479. 10.3389/fpls.2018.00479.Suche in Google Scholar PubMed PubMed Central
[51] Lewis CE. Anthocyanins and related compounds in Potatoes (Solanum tuberosum L.). Christchurch, New Zealand: University of Canterbury; 1996.Suche in Google Scholar
[52] Elmasry G, Radwan SM, Wang N. Utilization of hyperspectral imaging for classifying potato tubers based on anthocyanin content. J Agric Sci Mansoura Univ. 2007;32(5):3557–69. 10.21608/jssae.2007.201259.Suche in Google Scholar
[53] Rodriguez-Amaya DB, Kimura M. Harvestplus handbook for carotenoid analysis. Harvest Tech Monogr 2. 2004;71–7. 10.3141/2068-08.Suche in Google Scholar
[54] Helgerud T, Wold JP, Pedersen MB, Liland KH, Ballance S, Knutsen SH, et al. Towards on-line prediction of dry matter content in whole unpeeled potatoes using near-infrared spectroscopy. Talanta. 2015 Jun;143:138–44. 10.1016/j.talanta.2015.05.037.Suche in Google Scholar PubMed
[55] Ren Z, Liu T, Liu G. Distinction of bloods based on photoacoustic spectroscopy combined with PCA-LDA algorithm. In Future Sensing Technologies. Cergy-Pontoise, France; 2020.10.1117/12.2584032Suche in Google Scholar
[56] Yang XM. Prediction of O-linked glycosylation sites in protein sequence by PCA-LDA. Proc – 2009 9th Int Conf Hybrid Intell Syst HIS; 2009. p. 158–61. 10.1109/HIS.2009.39.Suche in Google Scholar
[57] Chen JY, Miao Y, Matsunaga R. Non-destructive determination of carbohydrate content in potatoes using near infrared spectroscopy. Infrared Spectrosc. 2004;314:311–4. 10.1255/jnirs.439.Suche in Google Scholar
[58] Beć KB, Grabska J, Huck CW. Miniaturized NIR spectroscopy in food analysis and quality control: Promises, challenges, and perspectives. Foods. 2022;11(10):1–3.10.3390/foods11101465Suche in Google Scholar PubMed PubMed Central
[59] Thamasopinkul C, Ritthiruangdej P, Kasemsumran S, Suwonsichon T, Haruthaithanasan V, Ozaki Y. Temperature compensation for determination of moisture and reducing sugar of longan honey by near infrared spectroscopy. J Infrared Spectrosc. 2017;25(1):36–44. 10.1177/0967033516685549.Suche in Google Scholar
[60] Camps C, Camps ZN. Optimized prediction of reducing sugars and dry matter of potato frying by FT-NIR spectroscopy on peeled tubers. Molecules. 2019;24(5):967. 10.3390/molecules24050967.Suche in Google Scholar PubMed PubMed Central
[61] Golic M, Walsh K, Lawson P. Short-wavelength near-infrared spectra of sucrose, glucose, and fructose with respect to sugar concentration and temperature. Appl Spectrosc. 2003;57(2):139–45. 10.1366/000370203321535033.Suche in Google Scholar PubMed
[62] Al Riza DF, Suzuki T, Ogawa Y, Kondo N. Diffuse reflectance characteristic of potato surface for external defects discrimination. Postharvest Biol Technol. 2017 Nov;133:12–9. 10.1016/j.postharvbio.2017.07.006.Suche in Google Scholar
[63] Kusumiyati, Hadiwijaya Y, Putri IE, Munawar AA. Multi-product calibration model for soluble solids and water content quantification in Cucurbitaceae family, using visible/near-infrared spectroscopy. Heliyon. 2021;7(8):e07677. 10.1016/j.heliyon.2021.e07677.Suche in Google Scholar PubMed PubMed Central
[64] Tamura M, Tsujita S. A study on the number of principal components and sensitivity of fault detection using PCA. Comput Chem Eng. 2007;31(9):1035–46. 10.1016/j.compchemeng.2006.09.004.Suche in Google Scholar
[65] Rivero RC, Rodríguez ER, Romero CD. Effects of current storage conditions on nutrient retention in several varieties of potatoes from Tenerife. Food Chem. 2003;80(4):445–50. 10.1016/S0308-8146(02)00281-9.Suche in Google Scholar
[66] Terouzi W, Chem MJ, Rizki H, Kzaiber F, Hanine H, Nabloussi A, et al. Characterization and rapid detection of adulterations in sesame oil using FT-MIR and PCA-LDA. Moroccan J Chem. 2016;4(4):1052–60.Suche in Google Scholar
[67] Yulia M, Suhandy D. UV spectral analysis coupled with PCA-LDA to classify organic and conventional Lampung robusta coffee from different origins. IOP Conf Ser Earth Environ Sci. 2022 Jun;1038(1):012035. 10.1088/1755-1315/1038/1/012035.Suche in Google Scholar
[68] Venkateswaran B. Neural Networks with R. Birmingham, UK: Packt; 2017. p. 314.Suche in Google Scholar
© 2024 the author(s), published by De Gruyter
This work is licensed under the Creative Commons Attribution 4.0 International License.
Artikel in diesem Heft
- Regular Articles
- Supplementation of P-solubilizing purple nonsulfur bacteria, Rhodopseudomonas palustris improved soil fertility, P nutrient, growth, and yield of Cucumis melo L.
- Yield gap variation in rice cultivation in Indonesia
- Effects of co-inoculation of indole-3-acetic acid- and ammonia-producing bacteria on plant growth and nutrition, soil elements, and the relationships of soil microbiomes with soil physicochemical parameters
- Impact of mulching and planting time on spring-wheat (Triticum aestivum) growth: A combined field experiment and empirical modeling approach
- Morphological diversity, correlation studies, and multiple-traits selection for yield and yield components of local cowpea varieties
- Participatory on-farm evaluation of new orange-fleshed sweetpotato varieties in Southern Ethiopia
- Yield performance and stability analysis of three cultivars of Gayo Arabica coffee across six different environments
- Biology of Spodoptera frugiperda (Lepidoptera: Noctuidae) on different types of plants feeds: Potency as a pest on various agricultural plants
- Antidiabetic activity of methanolic extract of Hibiscus sabdariffa Linn. fruit in alloxan-induced Swiss albino diabetic mice
- Bioinformatics investigation of the effect of volatile and non-volatile compounds of rhizobacteria in inhibiting late embryogenesis abundant protein that induces drought tolerance
- Nicotinamide as a biostimulant improves soybean growth and yield
- Farmer’s willingness to accept the sustainable zoning-based organic farming development plan: A lesson from Sleman District, Indonesia
- Uncovering hidden determinants of millennial farmers’ intentions in running conservation agriculture: An application of the Norm Activation Model
- Mediating role of leadership and group capital between human capital component and sustainability of horticultural agribusiness institutions in Indonesia
- Biochar technology to increase cassava crop productivity: A study of sustainable agriculture on degraded land
- Effect of struvite on the growth of green beans on Mars and Moon regolith simulants
- UrbanAgriKG: A knowledge graph on urban agriculture and its embeddings
- Provision of loans and credit by cocoa buyers under non-price competition: Cocoa beans market in Ghana
- Effectiveness of micro-dosing of lime on selected chemical properties of soil in Banja District, North West, Ethiopia
- Effect of weather, nitrogen fertilizer, and biostimulators on the root size and yield components of Hordeum vulgare
- Effects of selected biostimulants on qualitative and quantitative parameters of nine cultivars of the genus Capsicum spp.
- Growth, yield, and secondary metabolite responses of three shallot cultivars at different watering intervals
- Design of drainage channel for effective use of land on fully mechanized sugarcane plantations: A case study at Bone Sugarcane Plantation
- Technical feasibility and economic benefit of combined shallot seedlings techniques in Indonesia
- Control of Meloidogyne javanica in banana by endophytic bacteria
- Comparison of important quality components of red-flesh kiwifruit (Actinidia chinensis) in different locations
- Efficiency of rice farming in flood-prone areas of East Java, Indonesia
- Comparative analysis of alpine agritourism in Trentino, Tyrol, and South Tyrol: Regional variations and prospects
- Detection of Fusarium spp. infection in potato (Solanum tuberosum L.) during postharvest storage through visible–near-infrared and shortwave–near-infrared reflectance spectroscopy
- Forage yield, seed, and forage qualitative traits evaluation by determining the optimal forage harvesting stage in dual-purpose cultivation in safflower varieties (Carthamus tinctorius L.)
- The influence of tourism on the development of urban space: Comparison in Hanoi, Danang, and Ho Chi Minh City
- Optimum intra-row spacing and clove size for the economical production of garlic (Allium sativum L.) in Northwestern Highlands of Ethiopia
- The role of organic rice farm income on farmer household welfare: Evidence from Yogyakarta, Indonesia
- Exploring innovative food in a developing country: Edible insects as a sustainable option
- Genotype by environment interaction and performance stability of common bean (Phaseolus vulgaris L.) cultivars grown in Dawuro zone, Southwestern Ethiopia
- Factors influencing green, environmentally-friendly consumer behaviour
- Factors affecting coffee farmers’ access to financial institutions: The case of Bandung Regency, Indonesia
- Morphological and yield trait-based evaluation and selection of chili (Capsicum annuum L.) genotypes suitable for both summer and winter seasons
- Sustainability analysis and decision-making strategy for swamp buffalo (Bubalus bubalis carabauesis) conservation in Jambi Province, Indonesia
- Understanding factors affecting rice purchasing decisions in Indonesia: Does rice brand matter?
- An implementation of an extended theory of planned behavior to investigate consumer behavior on hygiene sanitation-certified livestock food products
- Information technology adoption in Indonesia’s small-scale dairy farms
- Draft genome of a biological control agent against Bipolaris sorokiniana, the causal phytopathogen of spot blotch in wheat (Triticum turgidum L. subsp. durum): Bacillus inaquosorum TSO22
- Assessment of the recurrent mutagenesis efficacy of sesame crosses followed by isolation and evaluation of promising genetic resources for use in future breeding programs
- Fostering cocoa industry resilience: A collaborative approach to managing farm gate price fluctuations in West Sulawesi, Indonesia
- Field investigation of component failures for selected farm machinery used in small rice farming operations
- Near-infrared technology in agriculture: Rapid, simultaneous, and non-destructive determination of inner quality parameters on intact coffee beans
- The synergistic application of sucrose and various LED light exposures to enhance the in vitro growth of Stevia rebaudiana (Bertoni)
- Weather index-based agricultural insurance for flower farmers: Willingness to pay, sales, and profitability perspectives
- Meta-analysis of dietary Bacillus spp. on serum biochemical and antioxidant status and egg quality of laying hens
- Biochemical characterization of trypsin from Indonesian skipjack tuna (Katsuwonus pelamis) viscera
- Determination of C-factor for conventional cultivation and soil conservation technique used in hop gardens
- Empowering farmers: Unveiling the economic impacts of contract farming on red chilli farmers’ income in Magelang District, Indonesia
- Evaluating salt tolerance in fodder crops: A field experiment in the dry land
- Labor productivity of lowland rice (Oryza sativa L.) farmers in Central Java Province, Indonesia
- Cropping systems and production assessment in southern Myanmar: Informing strategic interventions
- The effect of biostimulants and red mud on the growth and yield of shallots in post-unlicensed gold mining soil
- Effects of dietary Adansonia digitata L. (baobab) seed meal on growth performance and carcass characteristics of broiler chickens: A systematic review and meta-analysis
- Analysis and structural characterization of the vid-pisco market
- Pseudomonas fluorescens SP007s enhances defense responses against the soybean bacterial pustule caused by Xanthomonas axonopodis pv. glycines
- A brief investigation on the prospective of co-composted biochar as a fertilizer for Zucchini plants cultivated in arid sandy soil
- Supply chain efficiency of red chilies in the production center of Sleman Indonesia based on performance measurement system
- Investment development path for developed economies: Is agriculture different?
- Power relations among actors in laying hen business in Indonesia: A MACTOR analysis
- High-throughput digital imaging and detection of morpho-physiological traits in tomato plants under drought
- Converting compression ignition engine to dual-fuel (diesel + CNG) engine and experimentally investigating its performance and emissions
- Structuration, risk management, and institutional dynamics in resolving palm oil conflicts
- Spacing strategies for enhancing drought resilience and yield in maize agriculture
- Composition and quality of winter annual agrestal and ruderal herbages of two different land-use types
- Investigating Spodoptera spp. diversity, percentage of attack, and control strategies in the West Java, Indonesia, corn cultivation
- Yield stability of biofertilizer treatments to soybean in the rainy season based on the GGE biplot
- Evaluating agricultural yield and economic implications of varied irrigation depths on maize yield in semi-arid environments, at Birfarm, Upper Blue Nile, Ethiopia
- Chemometrics for mapping the spatial nitrate distribution on the leaf lamina of fenugreek grown under varying nitrogenous fertilizer doses
- Pomegranate peel ethanolic extract: A promising natural antioxidant, antimicrobial agent, and novel approach to mitigate rancidity in used edible oils
- Transformative learning and engagement with organic farming: Lessons learned from Indonesia
- Tourism in rural areas as a broader concept: Some insights from the Portuguese reality
- Assessment enhancing drought tolerance in henna (Lawsonia inermis L.) ecotypes through sodium nitroprusside foliar application
- Edible insects: A survey about perceptions regarding possible beneficial health effects and safety concerns among adult citizens from Portugal and Romania
- Phenological stages analysis in peach trees using electronic nose
- Harvest date and salicylic acid impact on peanut (Arachis hypogaea L.) properties under different humidity conditions
- Hibiscus sabdariffa L. petal biomass: A green source of nanoparticles of multifarious potential
- Use of different vegetation indices for the evaluation of the kinetics of the cherry tomato (Solanum lycopersicum var. cerasiforme) growth based on multispectral images by UAV
- First evidence of microplastic pollution in mangrove sediments and its ingestion by coral reef fish: Case study in Biawak Island, Indonesia
- Physical and textural properties and sensory acceptability of wheat bread partially incorporated with unripe non-commercial banana cultivars
- Cereibacter sphaeroides ST16 and ST26 were used to solubilize insoluble P forms to improve P uptake, growth, and yield of rice in acidic and extreme saline soil
- Avocado peel by-product in cattle diets and supplementation with oregano oil and effects on production, carcass, and meat quality
- Optimizing inorganic blended fertilizer application for the maximum grain yield and profitability of bread wheat and food barley in Dawuro Zone, Southwest Ethiopia
- The acceptance of social media as a channel of communication and livestock information for sheep farmers
- Adaptation of rice farmers to aging in Thailand
- Combined use of improved maize hybrids and nitrogen application increases grain yield of maize, under natural Striga hermonthica infestation
- From aquatic to terrestrial: An examination of plant diversity and ecological shifts
- Statistical modelling of a tractor tractive performance during ploughing operation on a tropical Alfisol
- Participation in artisanal diamond mining and food security: A case study of Kasai Oriental in DR Congo
- Assessment and multi-scenario simulation of ecosystem service values in Southwest China’s mountainous and hilly region
- Analysis of agricultural emissions and economic growth in Europe in search of ecological balance
- Bacillus thuringiensis strains with high insecticidal activity against insect larvae of the orders Coleoptera and Lepidoptera
- Technical efficiency of sugarcane farming in East Java, Indonesia: A bootstrap data envelopment analysis
- Comparison between mycobiota diversity and fungi and mycotoxin contamination of maize and wheat
- Evaluation of cultivation technology package and corn variety based on agronomy characters and leaf green indices
- Exploring the association between the consumption of beverages, fast foods, sweets, fats, and oils and the risk of gastric and pancreatic cancers: Findings from case–control study
- Phytochemical composition and insecticidal activity of Acokanthera oblongifolia (Hochst.) Benth & Hook.f. ex B.D.Jacks. extract on life span and biological aspects of Spodoptera littoralis (Biosd.)
- Land use management solutions in response to climate change: Case study in the central coastal areas of Vietnam
- Evaluation of coffee pulp as a feed ingredient for ruminants: A meta-analysis
- Interannual variations of normalized difference vegetation index and potential evapotranspiration and their relationship in the Baghdad area
- Harnessing synthetic microbial communities with nitrogen-fixing activity to promote rice growth
- Agronomic and economic benefits of rice–sweetpotato rotation in lowland rice cropping systems in Uganda
- Response of potato tuber as an effect of the N-fertilizer and paclobutrazol application in medium altitude
- Bridging the gap: The role of geographic proximity in enhancing seed sustainability in Bandung District
- Evaluation of Abrams curve in agricultural sector using the NARDL approach
- Challenges and opportunities for young farmers in the implementation of the Rural Development Program 2014–2020 of the Republic of Croatia
- Yield stability of ten common bean (Phaseolus vulgaris L.) genotypes at different sowing dates in Lubumbashi, South-East of DR Congo
- Effects of encapsulation and combining probiotics with different nitrate forms on methane emission and in vitro rumen fermentation characteristics
- Phytochemical analysis of Bienertia sinuspersici extract and its antioxidant and antimicrobial activities
- Evaluation of relative drought tolerance of grapevines by leaf fluorescence parameters
- Yield assessment of new streak-resistant topcross maize hybrids in Benin
- Improvement of cocoa powder properties through ultrasonic- and microwave-assisted alkalization
- Potential of ecoenzymes made from nutmeg (Myristica fragrans) leaf and pulp waste as bioinsecticides for Periplaneta americana
- Analysis of farm performance to realize the sustainability of organic cabbage vegetable farming in Getasan Semarang, Indonesia
- Revealing the influences of organic amendment-derived dissolved organic matter on growth and nutrient accumulation in lettuce seedlings (Lactuca sativa L.)
- Identification of viruses infecting sweetpotato (Ipomoea batatas Lam.) in Benin
- Assessing the soil physical and chemical properties of long-term pomelo orchard based on tree growth
- Investigating access and use of digital tools for agriculture among rural farmers: A case study of Nkomazi Municipality, South Africa
- Does sex influence the impact of dietary vitD3 and UVB light on performance parameters and welfare indicators of broilers?
- Design of intelligent sprayer control for an autonomous farming drone using a multiclass support vector machine
- Deciphering salt-responsive NB-ARC genes in rice transcriptomic data: A bioinformatics approach with gene expression validation
- Review Articles
- Impact of nematode infestation in livestock production and the role of natural feed additives – A review
- Role of dietary fats in reproductive, health, and nutritional benefits in farm animals: A review
- Climate change and adaptive strategies on viticulture (Vitis spp.)
- The false tiger of almond, Monosteira unicostata (Hemiptera: Tingidae): Biology, ecology, and control methods
- A systematic review on potential analogy of phytobiomass and soil carbon evaluation methods: Ethiopia insights
- A review of storage temperature and relative humidity effects on shelf life and quality of mango (Mangifera indica L.) fruit and implications for nutrition insecurity in Ethiopia
- Green extraction of nutmeg (Myristica fragrans) phytochemicals: Prospective strategies and roadblocks
- Potential influence of nitrogen fertilizer rates on yield and yield components of carrot (Dacus carota L.) in Ethiopia: Systematic review
- Corn silk: A promising source of antimicrobial compounds for health and wellness
- State and contours of research on roselle (Hibiscus sabdariffa L.) in Africa
- The potential of phosphorus-solubilizing purple nonsulfur bacteria in agriculture: Present and future perspectives
- Minor millets: Processing techniques and their nutritional and health benefits
- Meta-analysis of reproductive performance of improved dairy cattle under Ethiopian environmental conditions
- Review on enhancing the efficiency of fertilizer utilization: Strategies for optimal nutrient management
- The nutritional, phytochemical composition, and utilisation of different parts of maize: A comparative analysis
- Motivations for farmers’ participation in agri-environmental scheme in the EU, literature review
- Evolution of climate-smart agriculture research: A science mapping exploration and network analysis
- Short Communications
- Music enrichment improves the behavior and leukocyte profile of dairy cattle
- Effect of pruning height and organic fertilization on the morphological and productive characteristics of Moringa oleifera Lam. in the Peruvian dry tropics
- Corrigendum
- Corrigendum to “Bioinformatics investigation of the effect of volatile and non-volatile compounds of rhizobacteria in inhibiting late embryogenesis abundant protein that induces drought tolerance”
- Corrigendum to “Composition and quality of winter annual agrestal and ruderal herbages of two different land-use types”
- Special issue: Smart Agriculture System for Sustainable Development: Methods and Practices
- Construction of a sustainable model to predict the moisture content of porang powder (Amorphophallus oncophyllus) based on pointed-scan visible near-infrared spectroscopy
- FruitVision: A deep learning based automatic fruit grading system
- Energy harvesting and ANFIS modeling of a PVDF/GO-ZNO piezoelectric nanogenerator on a UAV
- Effects of stress hormones on digestibility and performance in cattle: A review
- Special Issue of The 4th International Conference on Food Science and Engineering (ICFSE) 2022 - Part II
- Assessment of omega-3 and omega-6 fatty acid profiles and ratio of omega-6/omega-3 of white eggs produced by laying hens fed diets enriched with omega-3 rich vegetable oil
- Special Issue on FCEM - International Web Conference on Food Choice & Eating Motivation - Part II
- Special Issue on FCEM – International Web Conference on Food Choice & Eating Motivation: Message from the editor
- Fruit and vegetable consumption: Study involving Portuguese and French consumers
- Knowledge about consumption of milk: Study involving consumers from two European Countries – France and Portugal