Optimization of thermal and hydrophobic properties of GO-doped epoxy nanocomposite coatings
-
Xintian Liu
 ,
Zhanqiang Liu
,
Zhanqiang Liu

Abstract
Corrosion and icing are common problems in aerospace and wind power fields. In order to improve the thermal and hydrophobic properties of epoxy-based anticorrosive coatings and expand the application in various working environments, the modified graphene oxide (GO) was introduced into the epoxy-based anticorrosive coatings to prepare GO/polyvinyl butyral/epoxy resin nanocomposite coatings. The preparation process of nanocomposite coating was optimized by response surface method. Through heat transfer experiment and contact angle experiment, the fitting model of influence factors and response values were established, and the response surface was optimized with heating rate and contact angle as response value. It is reported that the heating rate of the optimum parameter is 0.218°C/s, and the contact angle is 85.757°. The maximum error of the optimized response values verified by the coating experiment is 8.58%, which indicates that the reliability of the RSM optimization result is high. The optimization results of the preparation process parameters can meet the requirements of the nanocomposite coatings with high thermal and hydrophobic properties.
Graphical abstract
1 Introduction
Metal materials will be accelerated to be corroded in the material environment with salt, acid, and alkali. The appearance of corrosion will seriously affect the normal use of machinery. It will not only lead to the mere loss of metal mass, but also challenge the safe, effective, and productive operation of machinery and equipment, resulting in economic and quality losses [1]. Relevant research shows that the most effective, cheap, and convenient way to prevent metal corrosion is to coat a layer of anticorrosive coating on the surface [2]. Epoxy resin (EP) has excellent corrosion resistance, film adhesion, mechanical strength, and weather resistance, and hence, EP coatings are widely used in the field of anti-corrosion [3,4,5]. However, there are some serious problems in pure EP coating. The microspores generated during the curing of EP will affect the hardness and corrosion resistance of the coating. Therefore, the main way to solve the above problem is to prepare epoxy coating matrix composites with high anti-corrosion and barrier properties by doping nanocomposite fillers [5].
Graphene has a special two-dimensional structure, with excellent thermal [6], electrical [7], and mechanical properties [8], which can form a barrier and shielding effect on corrosive media [9]. However, it is difficult to disperse graphene in epoxy matrix. Graphene oxide (GO) can be better dispersed in materials to overcome the difficulty of uneven dispersion of graphene [10]. Moreover, as an important derivative of graphene, GO maintains many excellent characteristics of graphene and is widely used to improve the thermal conductivity of composites. Lin et al. [11] studied the thermal conductivity of GO doped composites and found that its thermal conductivity is much higher than that of liquids and polymers. The thermal conductivity of hydroxy-terminated polydimethylsiloxane was increased by 20% by Ge et al. [12]. The method of diisocyanate modifying GO was applied in the experiments. Liu et al. [13] employed the combination of GO and carbon nanotube as fillers to improve the thermal conductivity of the microcapsules. Esfahani et al. [14] compared the thermal conductivity of GO nanofluid with different mass concentrations, and found that GO had the best concentration. Yuan et al. [15] added different amounts of GO fillers and AlN particles to the EP. The highest thermal conductivity of 2.77 W/(m K) was obtained, containing 5 μm-AlN and 6 wt% of GO. Signe et al. [16] compared the contact angle and icing temperature of GO on Ir(111) and pristine graphene on Ir(111), and found that the icing temperature of GO on Ir(111) was lower.
In addition, modified GO is widely used to improve the hydrophobicity of the composite coatings. Zhang et al. [17] successfully improved the hydrophobicity of waterborne polyurethanes by using polyether amine interconnected GO. Kolya et al. [18] used GO composite coating to improve the hydrophobicity of wood surface, and found that polyvinyl acetate (PVAc)/reduced graphene oxide-poly(diallyldimethylammonium) composite coating has better hydrophobicity than PVAc and industrial wood stain coatings. Huang et al. [19] obtained graphene/carbon nanofiber composites by using electrical spinning technology, which made the contact angle between carbon nanofiber and water increase from 120–130° up to 130–135°. Gong et al. [20] prepared fabric of polylactic acid (PLA)/hydroxyapatite (HA)/GO composite and tested its hydrophobicity. PLA/HA/GO with different concentrations of GO showed better hydrophobicity than PLA. Wang et al. [21] prepared amino-functionalized GO/polyimide composite film and obtained a larger contact angle than GO-NH2 and pure PI films. They think that the reason for this phenomenon may be the removal of oxygen-containing groups on the surface of GO-NH2 or the strong interfacial interaction and good compatibility between GO-NH2 and PI matrix.
Polyvinyl butyral (PVB) has good film forming and adhesion property. The composites formed by PVB has excellent characteristics such as good mechanical properties [22], corrosion resistance [23], and flexibility [24]. Moreover, PVB has special chemical structure, so it also has good compatibility with other resins [25]. Zhang et al. prepared synthesis of poly(p-phenylenediamine) encapsulated graphene and found that it has excellent corrosion resistance [26]. Yang et al. [27] prepared a composite of rubber/PVB/epoxy, and found that PVB was mixed with EP and the mechanical properties of the materials have also been greatly improved.
In the field of aerospace and wind power as well as in some extreme environments, EP-based coatings need not only high anti-corrosion performance but also good heat transfer characteristics, such as aircraft wing anti icing and deicing technology based on electric heating [28,29,30]. The requirement of electric heating anti-/deicing surface coating challenges the heat transfer performance of the materials. The thermal conductivity of pure EP coating is low, and hence, cannot achieve the effect of rapid heat conduction, thus greatly limiting the application range of EP-based coating [31,32].
Nowadays, graphene and its derivatives are widely used to improve the thermal conductivity and hydrophobicity of epoxy anticorrosive coatings. Lv et al. [33] discussed the preparation, modification, coating treatment, and hybrid filling of graphene reinforced epoxy composites. Liu et al. [34] prepared a graphene/Ni/epoxy composite, and increased the thermal conductivity of pure epoxy by 914.5%. He et al. [35] prepared a graphene composite, whose thermal conductivity is more than three times that of EP. Hou et al. [36] reviewed the recent progress of GO-reinforced epoxy, and described the effects of GO on the different properties of epoxy, like mechanical, thermal, anti-corrosion, etc. Zhang et al. [37] carried out molecular dynamics simulations, using different structures of dopamine-modified GO to improve the thermal properties of epoxy coatings. Moradi Kooshksara and Mohammadi [38] produced the reduced multi-layered GO/epoxy nanocoating and multi-layered GO/epoxy nanocoating and found their water contact angle to be larger than the pure epoxy. Ramirez-Soria et al. [39] bifunctionalized GO (BFGO) with –NH2 and –NH3 groups and prepared EP-BFGO composites. The EP-BFGO composite shows a larger contact angle, which indicates a better hydrophobicity of the composites.
However, the anti-/deicing performance of the coating was seldom considered in the past works, and the thermal conductivity and hydrophobicity of graphene-doped epoxy coating were rarely reported. Both the thermal conductivity and hydrophobicity have influence on the anti-/deicing effect of the coating. In the process of coating preparation, the thermal conductivity and hydrophobicity will be influenced by the preparation technology. Therefore, in order to prepare epoxy coating with good anti-/deicing performance, it is necessary to comprehensively consider the thermal conductivity and hydrophobicity.
In this study, the modified GO sheets were introduced to prepare GO/PVB/EP nanocomposite coatings with high thermal conductivity and hydrophobicity. The thermal conductivity and surface contact angle were set as the optimal response values. By employing the response surface optimization method, different preparation processes were designed and optimized. Through the heat transfer experiments and contact angle tests, the fitting model between the influence factors and the response values was established. The heat transfer characteristics and surface hydrophobicity of GO/PVB/EP nanocomposite coatings prepared under different preparation conditions were analyzed, and the main influence factors in the preparation process were determined.
2 Materials and methods
2.1 Materials
The monolayer GO used in the preparation was supplied by Suzhou Hengqiu Graphene Technology Co., Ltd. Aviation grade PVB with diameter of 3–5 μm and DDM (4,4′-Methylenedianiline) were supplied by Shanghai Zhanyun Chemical Co., Ltd. EP (E-51) was purchased from Shanghai Aotun Chemical Technology Co., Ltd. DMF (N,N-dimethylformamide) was purchased from Wuxi Yatai United Chemical Co., Ltd. Silane coupling agent (KH-550) was procured from Nanjing Chuangshi Chemical Additives Co., Ltd. And anhydrous ethanol was procured from Wuxi Prospect Chemical Reagent Co., Ltd. All the materials were used without further depuration.
2.2 Optimization of preparation process
In this article, the GO/PVB/EP nanocomposite coating was prepared by mixing method. The preparation parameters, such as GO content, ultrasonic time, water bath temperature, water bath time, coating thickness, and silane coupling agent content, were selected as the influencing factors of thermal conductivity and hydrophobicity of the nanocomposite coating. Considering the existence of multiple factors, response surface method (RSM) is a good way to analyze the interaction between those factors. In order to investigate the influence of various factors on the thermal conductivity and hydrophobicity of the coating, the RSM was employed to design the experiments. In order to characterize thermal conductivity and hydrophobicity, two response factors, heating rate and contact angle, were introduced. The preparation of experimental scheme was designed by Box–Behnken Design (BBD) method using the software Design Expert. According to the reasonable range of each variable, the response surface analysis factor level is determined as shown in Table 1, and the experimental data and optimization results are shown in Table 2 (Section 3.2 for details).
Response surface analysis factor level
| Code number | GO content (wt%) | Ultrasonic time (min) | Water bath temperature (°C) | Water bath time (min) | Coating thickness (mm) | KH-550 content (g) |
|---|---|---|---|---|---|---|
| −1 | 0.38 | 15 | 80 | 10 | 0.4 | 0.04 |
| 0 | 0.635 | 30 | 90 | 20 | 0.5 | 0.05 |
| 1 | 0.89 | 45 | 100 | 30 | 0.6 | 0.06 |
BBD matrix and results
| Factor 1 | Factor 2 | Factor 3 | Factor 4 | Factor 5 | Factor 6 | Resp. 1 | Resp. 2 | |
|---|---|---|---|---|---|---|---|---|
| Run | A:GO content (wt%) | B:ultrasonic time (min) | C:water bath temperature (°C) | D:water bath time (min) | E:coating thickness (mm) | F:KH-550 (g) | Heating rate (°C/s) | Contact angle (°) |
| 1 | 0.635 | 15 | 80 | 20 | 0.6 | 0.05 | 0.1841 | 68.7 |
| 2 | 0.635 | 30 | 90 | 20 | 0.5 | 0.05 | 0.1723 | 79.5 |
| 3 | 0.635 | 30 | 80 | 10 | 0.5 | 0.06 | 0.1970 | 66.6 |
| 4 | 0.89 | 30 | 90 | 10 | 0.6 | 0.05 | 0.0867 | 83.0 |
| 5 | 0.89 | 30 | 80 | 20 | 0.5 | 0.04 | 0.1513 | 84.5 |
| 6 | 0.89 | 45 | 90 | 10 | 0.5 | 0.05 | 0.1994 | 84.5 |
| 7 | 0.38 | 45 | 90 | 10 | 0.5 | 0.05 | 0.1559 | 72.6 |
| 8 | 0.635 | 15 | 90 | 20 | 0.6 | 0.04 | 0.1856 | 80.1 |
| 9 | 0.635 | 15 | 90 | 20 | 0.4 | 0.06 | 0.1701 | 76.7 |
| 10 | 0.635 | 15 | 90 | 20 | 0.4 | 0.04 | 0.1596 | 79.5 |
| 11 | 0.38 | 30 | 80 | 20 | 0.5 | 0.06 | 0.1303 | 66.0 |
| 12 | 0.635 | 45 | 100 | 20 | 0.6 | 0.05 | 0.1235 | 70.4 |
| 13 | 0.635 | 45 | 90 | 20 | 0.6 | 0.04 | 0.0854 | 80.4 |
| 14 | 0.635 | 30 | 100 | 30 | 0.5 | 0.06 | 0.1693 | 75.6 |
| 15 | 0.38 | 30 | 90 | 30 | 0.4 | 0.05 | 0.1410 | 79.4 |
| 16 | 0.38 | 30 | 90 | 30 | 0.6 | 0.05 | 0.1126 | 76.8 |
| 17 | 0.635 | 30 | 90 | 20 | 0.5 | 0.05 | 0.1723 | 79.5 |
| 18 | 0.635 | 30 | 100 | 10 | 0.5 | 0.04 | 0.1401 | 79.0 |
| 19 | 0.89 | 30 | 90 | 30 | 0.6 | 0.05 | 0.1051 | 76.8 |
| 20 | 0.635 | 45 | 100 | 20 | 0.4 | 0.05 | 0.1585 | 69.4 |
| 21 | 0.635 | 45 | 90 | 20 | 0.4 | 0.06 | 0.1303 | 78.9 |
| 22 | 0.635 | 45 | 80 | 20 | 0.6 | 0.05 | 0.1811 | 67.8 |
| 23 | 0.38 | 15 | 90 | 10 | 0.5 | 0.05 | 0.1183 | 78.1 |
| 24 | 0.38 | 30 | 90 | 10 | 0.6 | 0.05 | 0.0961 | 76.3 |
| 25 | 0.38 | 30 | 100 | 20 | 0.5 | 0.06 | 0.1790 | 74.6 |
| 26 | 0.635 | 30 | 100 | 30 | 0.5 | 0.04 | 0.1530 | 78.8 |
| 27 | 0.635 | 30 | 90 | 20 | 0.5 | 0.05 | 0.1723 | 79.5 |
| 28 | 0.89 | 45 | 90 | 30 | 0.5 | 0.05 | 0.1170 | 73.3 |
| 29 | 0.38 | 45 | 90 | 30 | 0.5 | 0.05 | 0.2064 | 69.4 |
| 30 | 0.635 | 45 | 80 | 20 | 0.4 | 0.05 | 0.1273 | 68.6 |
| 31 | 0.38 | 30 | 90 | 10 | 0.4 | 0.05 | 0.1710 | 74.2 |
| 32 | 0.635 | 30 | 80 | 30 | 0.5 | 0.06 | 0.1875 | 70.6 |
| 33 | 0.635 | 30 | 90 | 20 | 0.5 | 0.05 | 0.1723 | 79.5 |
| 34 | 0.38 | 15 | 90 | 30 | 0.5 | 0.05 | 0.184 | 68.2 |
| 35 | 0.38 | 30 | 80 | 20 | 0.5 | 0.04 | 0.1516 | 76.2 |
| 36 | 0.635 | 30 | 100 | 10 | 0.5 | 0.06 | 0.1839 | 77.0 |
| 37 | 0.635 | 45 | 90 | 20 | 0.6 | 0.06 | 0.1915 | 74.7 |
| 38 | 0.89 | 30 | 80 | 20 | 0.5 | 0.06 | 0.1515 | 83.9 |
| 39 | 0.89 | 30 | 100 | 20 | 0.5 | 0.06 | 0.1678 | 76.0 |
| 40 | 0.89 | 15 | 90 | 10 | 0.5 | 0.05 | 0.1275 | 73.5 |
| 41 | 0.635 | 15 | 100 | 20 | 0.6 | 0.05 | 0.0995 | 78.2 |
| 42 | 0.635 | 30 | 90 | 20 | 0.5 | 0.05 | 0.1723 | 79.5 |
| 43 | 0.635 | 30 | 80 | 30 | 0.5 | 0.04 | 0.1574 | 76.8 |
| 44 | 0.635 | 15 | 80 | 20 | 0.4 | 0.05 | 0.1741 | 74.5 |
| 45 | 0.635 | 15 | 90 | 20 | 0.6 | 0.06 | 0.1399 | 79.4 |
| 46 | 0.38 | 30 | 100 | 20 | 0.5 | 0.04 | 0.1645 | 80.0 |
| 47 | 0.89 | 30 | 100 | 20 | 0.5 | 0.04 | 0.1475 | 76.9 |
| 48 | 0.635 | 45 | 90 | 20 | 0.4 | 0.04 | 0.1635 | 76.4 |
| 49 | 0.89 | 15 | 90 | 30 | 0.5 | 0.05 | 0.179 | 78.0 |
| 50 | 0.89 | 30 | 90 | 30 | 0.4 | 0.05 | 0.1596 | 77.7 |
| 51 | 0.635 | 30 | 80 | 10 | 0.5 | 0.04 | 0.155 | 78.9 |
| 52 | 0.89 | 30 | 90 | 10 | 0.4 | 0.05 | 0.1389 | 75.7 |
| 53 | 0.635 | 15 | 100 | 20 | 0.4 | 0.05 | 0.1242 | 77.6 |
| 54 | 0.635 | 30 | 90 | 20 | 0.5 | 0.05 | 0.1723 | 79.5 |
2.3 Sample preparation
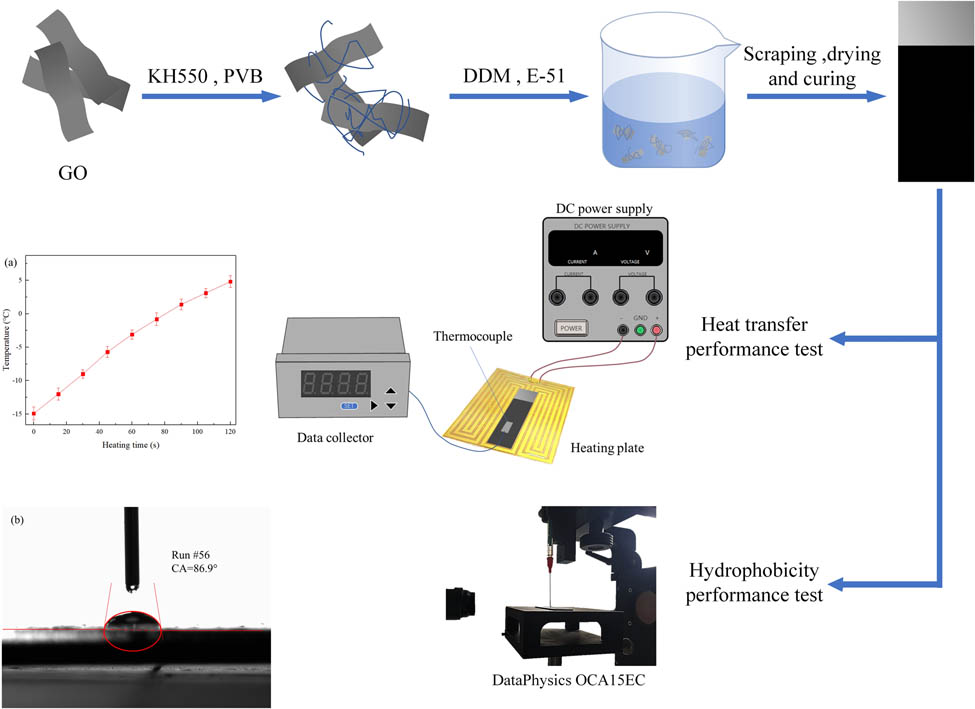
The principle of coating preparation is shown in Figure 1. Different proportions of GO (0.38, 0.635, and 0.89 wt%) were mixed and stirred with 3 g DMF and a certain amount of silane coupling agent KH-550. 0.7 g PVB and 3 g DMF were added in another beaker and mixed evenly. The two solutions were treated with ultrasonic treatment, respectively, and then mixed and treated with ultrasonic treatment again. Then, 7 g of EP E-51 was added and stirred evenly. The curing agent used in the experiments was DDM, and its molecular formula is C13H14N2. The relative molecular weight was M = 198.26. The number of active hydrogen atom in amino group of curing agent is H n = 4, and the epoxy value of E-51 is E = 0.51. Therefore, the mass of DDM required in this experiment is M = (M/H n ) × E ∗ 7 g/100 g = 1.77 g. The magnetic stirring water bath was heated at a certain temperature, and a small amount of 1.77 g of DDM was added several times.
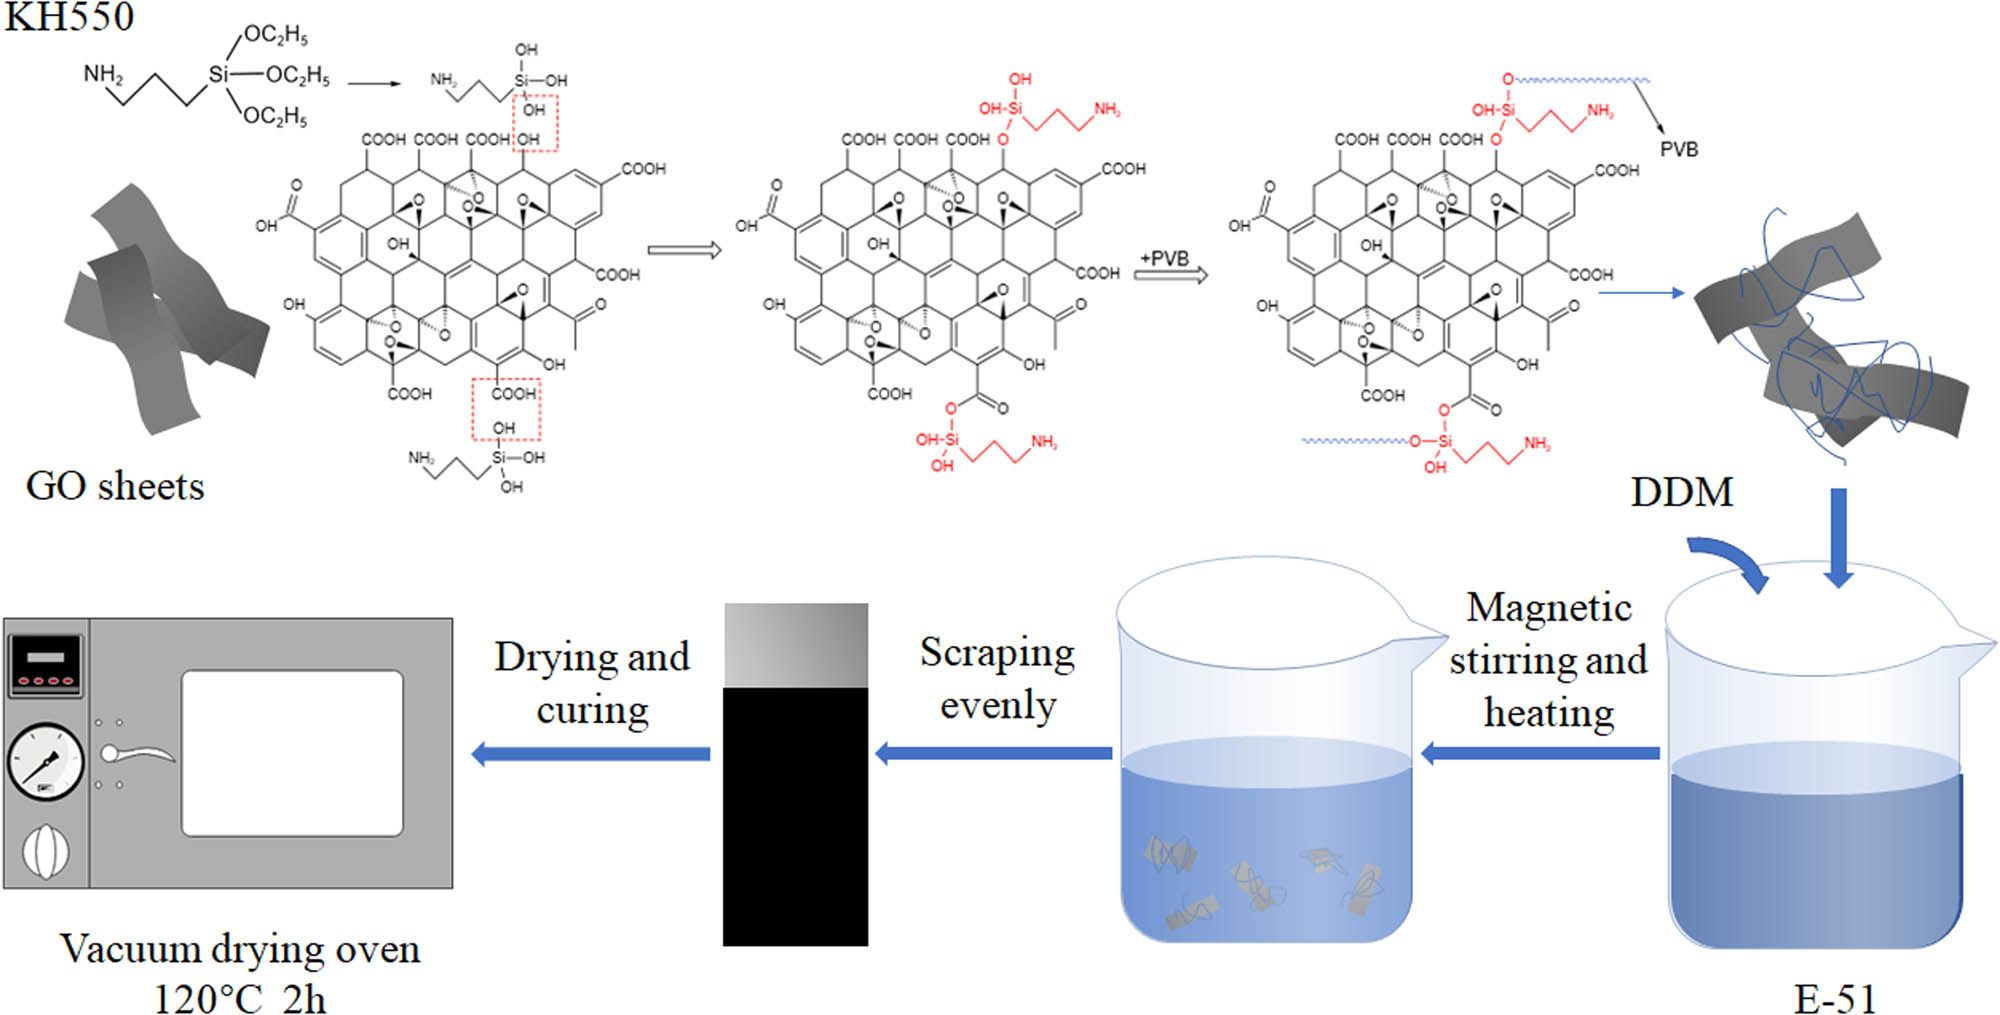
Preparation diagram of the GO/PVB/EP nanocomposite coatings.
The 304 stainless steel plates with the size of 20 mm × 60 mm × 1 mm were selected as the coating substrate, and cleaned with absolute alcohol and dried. The prepared coating solution was applied on a clean steel plate with an adjustable thickness coater. Then, a vacuum drying oven was employed to solidify the coated stainless steel plates at 120°C for 2 h.
2.4 Characterization and morphology
Scanning electron microscopy (SEM, Hitachi SU8010) was employed to characterize the cross section morphology of the GO/PVB/EP coatings. Through SEM observation, we can observe whether GO is evenly distributed in the coating, so as to ensure good coating performance. During the process of SEM observation, liquid nitrogen was proposed for quick freezing and then brittle fracture was made under mechanical action to obtain ideal cross section morphology. The samples were cooled at low temperature in liquid nitrogen until the material was embrittled. External force was applied to the samples with experimental pliers to make the samples brittle. The morphologies of the samples were observed at a working voltage of 1.5–3 kV.
2.5 Heat transfer performance test
The heat transfer performance of GO/PVB/EP nanocomposite coatings prepared by different processes was obtained by heat transfer experiments. As shown in Figure 2, the K-type thermocouple was pasted on the surface of the prepared samples, and the electric heating plate was straightened after precooling to −15°C in the refrigeration box. The thermal sensitivity of the thermocouple is 0.10°C, and the measurement error is ±1°C. The sample and thermocouple were placed on the heating plate and the door of the rectification box was closed. The heating rate of GO/PVB/EP nanocomposite coating was measured to reflect the heat transfer ability of the coating samples. The electric heating system is designed as an adjustable heating system. The surface temperature is controlled by changing the output power. After the thermocouple indicates –15°C, heating and timing were started. The thermocouple thermometer readings are recorded by data collector every 15 s until 120 s. The DC power supply (Maxon MS605D, rated power 300 W) was connected to the electric heating line, and all measurements were performed in the DC mode.
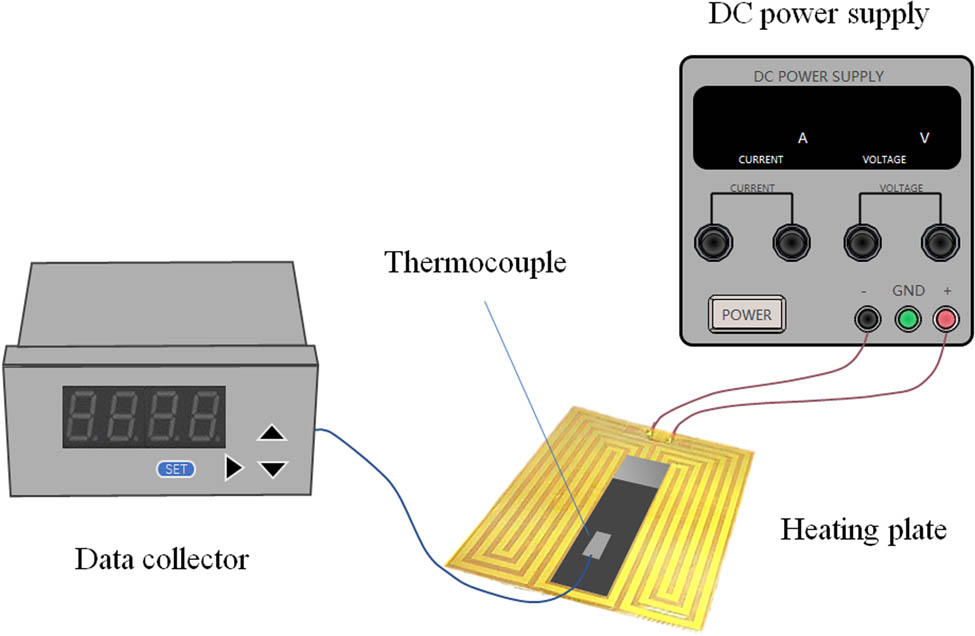
Schematic of heat transfer experiment.
2.6 Hydrophobicity performance test
The hydrophobicity of the GO/PVB/EP coatings can be analyzed by measuring the contact angle between the coating and water with contact angle measuring instrument (DataPhysics OCA15EC). In order to not affect the accuracy of the measurement results, we used anhydrous ethanol to wipe the prepared coating samples to keep the surface clean. After the ethanol volatilizes completely, the sample was placed on the sample table of the contact angle measuring instrument, and the SCA 20 software was used to process the measurement data. Before the experiments, the light source, camera focal length, and needle position were adjusted to make the picture clear, and the relative position between the needle and the sample was reasonable. The water volume was set to 10 μL each time. The syringe was moved down to make the liquid of the needle touch the surface of the samples and then moved away from the contact surface. The baseline was selected manually and the contact angles were measured automatically by software.
3 Results and discussion
3.1 Microscopic morphologies analysis
The GO/PVB/EP nanocomposite coatings were brittle and broke at low temperature, and the morphology of the coating was observed by SEM as shown in Figure 3. In the figure, the structure with laminated pairs is GO (red circles). After the matrix EP mixed with PVB, it is the mixed matrix in the SEM image, and the small dots in the figure are the SEM image of PVB (yellow circles). It can be seen that GO was uniformly distributed in PVB/EP nanocomposite, and no damage or tear was found in GO layered structure. The results show that GO with different doping contents was relatively uniformly dispersed in PVB/EP matrix and no interface separation between GO and polymer matrix was observed. As shown in Figure 3(e) and (f), when the GO content is 0.89%, there is a small amount of uneven dispersion and agglomeration of GO. The agglomeration only occurs at the place with more GO lamellae, which is beneficial to the corrosion resistance of the GO/PVB/EP coating.
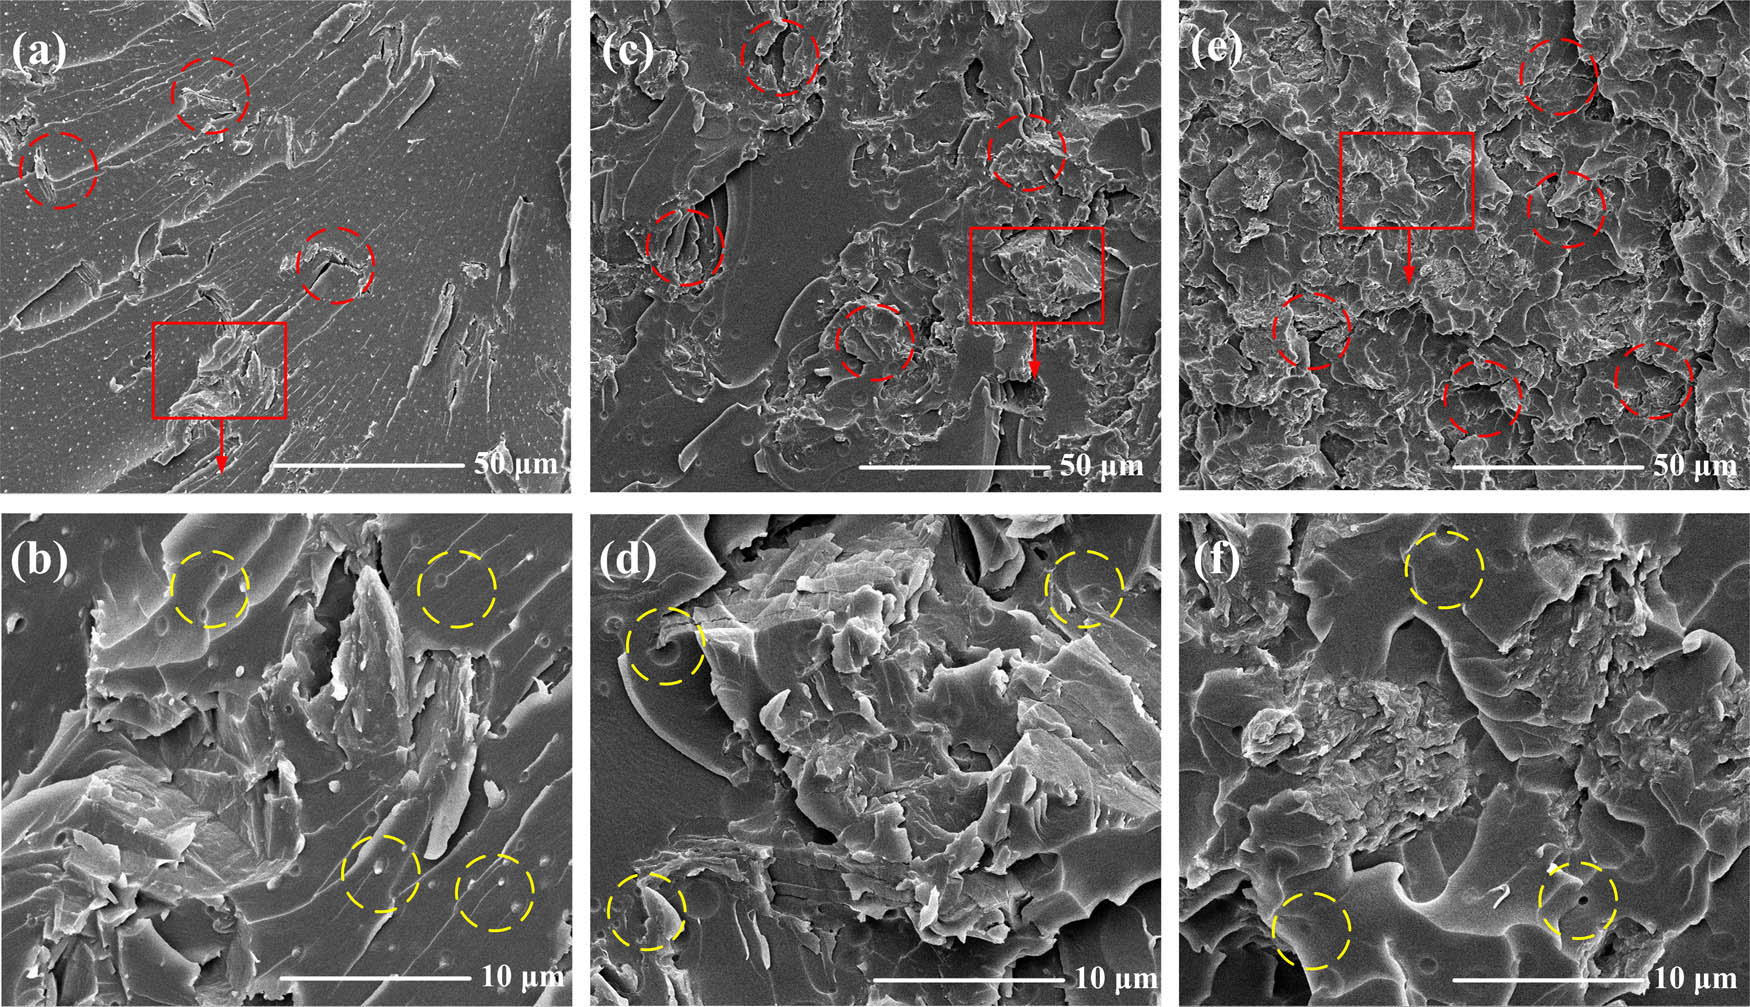
SEM micrographs of the GO/PVB/EP coating specimens. (a) and (b) 0.38 wt% of GO content; (c) and (d) 0.635 wt% of GO content; (e) and (f) 0.89 wt% of GO content.
3.2 RSM optimization
Six factors including GO content, ultrasonic time, water bath temperature, water bath time, coating thickness, and KH-550 content were selected to design the Box–Behnken experiment, and the error was estimated. In the experimental design, each factor is taken as three levels (+1, 0, and −1). The heating rate of the GO/PVB/EP nanocomposite coating sample reflects the thermal conductivity of the coatings. The thermal conductivity rate and contact angle of the samples were measured. The experiment was carried out according to the Design Expert experiment matrix, and the experiment was repeated three times. The experimental design and results are shown in Table 2.
3.2.1 Optimization analysis of heat transfer data
A multiple regression analysis method was employed to investigate the relationship between the significant influencing factors and heat transfer characteristics. Response surface regression analysis was conducted on the experimental results in Table 3, and the final equation of heating rate and each factor expressed by coding factor were obtained. The regression equation is given as equation (1), where the synergistic effect of variables is positive and the antagonistic effect of variables is negative. Y indicates heating rate.
Variance analysis of response surface experiments of heating rate
| Source | Sum of squares | df | Mean square | F-value | P-value Prob > F | Remarks |
|---|---|---|---|---|---|---|
| Model | 0.036 | 20 | 1.792 × 10⁻³ | 5.78 | <0.0001 | Significant |
| B-ultrasonic time | 1.550 × 10⁻⁶ | 1 | 1.550 × 10⁻⁶ | 4.998 × 10⁻³ | 0.9441 | |
| C-water bath temperature | 3.200 × 10⁻⁴ | 1 | 3.200 × 10⁻⁴ | 1.03 | 0.3172 | |
| F-KH-550 | 1.804 × 10⁻³ | 1 | 1.804 × 10⁻³ | 5.82 | 0.0216 | Significant |
| AB | 3.138 × 10⁻⁴ | 1 | 3.138 × 10⁻⁴ | 1.01 | 0.3219 | |
| AC | 3.014 × 10⁻⁴ | 1 | 3.014 × 10⁻⁴ | 0.97 | 0.3315 | |
| BC | 1.461 × 10⁻³ | 1 | 1.461 × 10⁻³ | 4.71 | 0.0373 | Significant |
| BD | 2.779 × 10⁻³ | 1 | 2.779 × 10⁻³ | 8.96 | 0.0052 | Significant |
| BF | 1.461 × 10⁻³ | 1 | 1.461 × 10⁻³ | 4.71 | 0.0373 | Significant |
| CE | 1.907 × 10⁻³ | 1 | 1.907 × 10⁻³ | 6.15 | 0.0185 | Significant |
| EF | 8.632 × 10⁻⁴ | 1 | 8.632 × 10⁻⁴ | 2.78 | 0.1048 | |
| A 2 | 2.624 × 10⁻³ | 1 | 2.624 × 10⁻³ | 8.46 | 0.0065 | Significant |
| D 2 | 9.780 × 10⁻⁵ | 1 | 9.780 × 10⁻⁵ | 0.32 | 0.5783 | |
| E 2 | 8.006 × 10⁻³ | 1 | 8.006 × 10⁻³ | 25.81 | <0.0001 | Significant |
| BCE | 3.659 × 10⁻⁴ | 1 | 3.659 × 10⁻⁴ | 1.18 | 0.2854 | |
| BEF | 4.778 × 10⁻³ | 1 | 4.778 × 10⁻³ | 15.40 | 0.0004 | Significant |
| A 2 C | 9.719 × 10⁻⁴ | 1 | 9.719 × 10⁻⁴ | 3.13 | 0.0860 | |
| A 2 E | 5.513 × 10⁻³ | 1 | 5.513 × 10⁻³ | 17.77 | 0.0002 | Significant |
| A 2 F | 4.230 × 10⁻⁴ | 1 | 4.230 × 10⁻⁴ | 1.36 | 0.2513 | |
| AB 2 | 2.174 × 10⁻⁴ | 1 | 2.174 × 10⁻⁴ | 0.70 | 0.4086 | |
| B 2 C | 7.604 × 10⁻⁴ | 1 | 7.604 × 10⁻⁴ | 2.45 | 0.1270 | |
| Residual | 0.010 | 33 | 3.102 × 10⁻⁴ | |||
| Lack of fit | 0.010 | 28 | 3.656 × 10⁻⁴ | |||
| Pure error | 0.000 | 5 | 0.000 | |||
| Cor total | 0.046 | 53 |
| R-squared | Adj R-squared | Pred R-squared | Adeq precision |
|---|---|---|---|
| 0.7778 | 0.6431 | 0.2286 | 10.7354 |
It can be seen from Table 3 that the P-value of the fitting model is less than 0.0001, and the F-value is 5.78. The results indicated that the model item was credible which means that the model is significant. The response values of model items F, BC, BD, BF, CE, A 2 , E 2 , BEF, and A 2 E were significant (P-value <0.0001). The Adeq precision of the model is 10.7345 (>4), which shows that the signal of the model is sufficient. While the value of determination coefficient R 2 is 0.7778, which shows that the fitting equation is not ideal.
Figure 4(a) shows the relationship between the residual and the predicted value of heat conduction rate, and the distribution of data points in the figure is irregular. This shows that the relationship between the original observation values and the response values is not obvious, which indicates that the linear model can theoretically predict the change in heat conduction rate of the GO/PVB/EP samples. It can be seen from Figure 4(b) that the residuals are basically linear distribution, which indicates that the residuals obey the normal distribution and the accuracy of this experimental design. In Figure 4(d), the residual error of each run is basically in the range of (−3, 3), indicating that the data or model operation error is small. However, in Figure 4(b), the point representing Run #29 is far away from the straight line fitting other points, which indicates that the residual error of Run #29 does not conform to the normal distribution and the accuracy is low. In Figure 4(c), Run #29 deviates far from the straight line of Predicted = Actual, which indicates that the error between the predicted value and the actual value is large. In addition, the residual value of Run #29 in Figure 4(d) is more than 4, which means that there are operational errors in the data or model. Therefore, it is considered that the data of Run #29 obviously deviates from the predicted fitting model. Thus, the data of Run #29 was ignored. It can be observed from Figure 4(c) that the actual value of Run#29 is smaller than the predicted value. This may be because the thermocouple did not appress to the sample or separated from the sample surface during the experiment. It may also be due to the tilting of heating plate during heating, resulting in loose fit between the heating plate and the sample. The fitting model was analyzed again to obtain the fitting result as shown in equation (2):
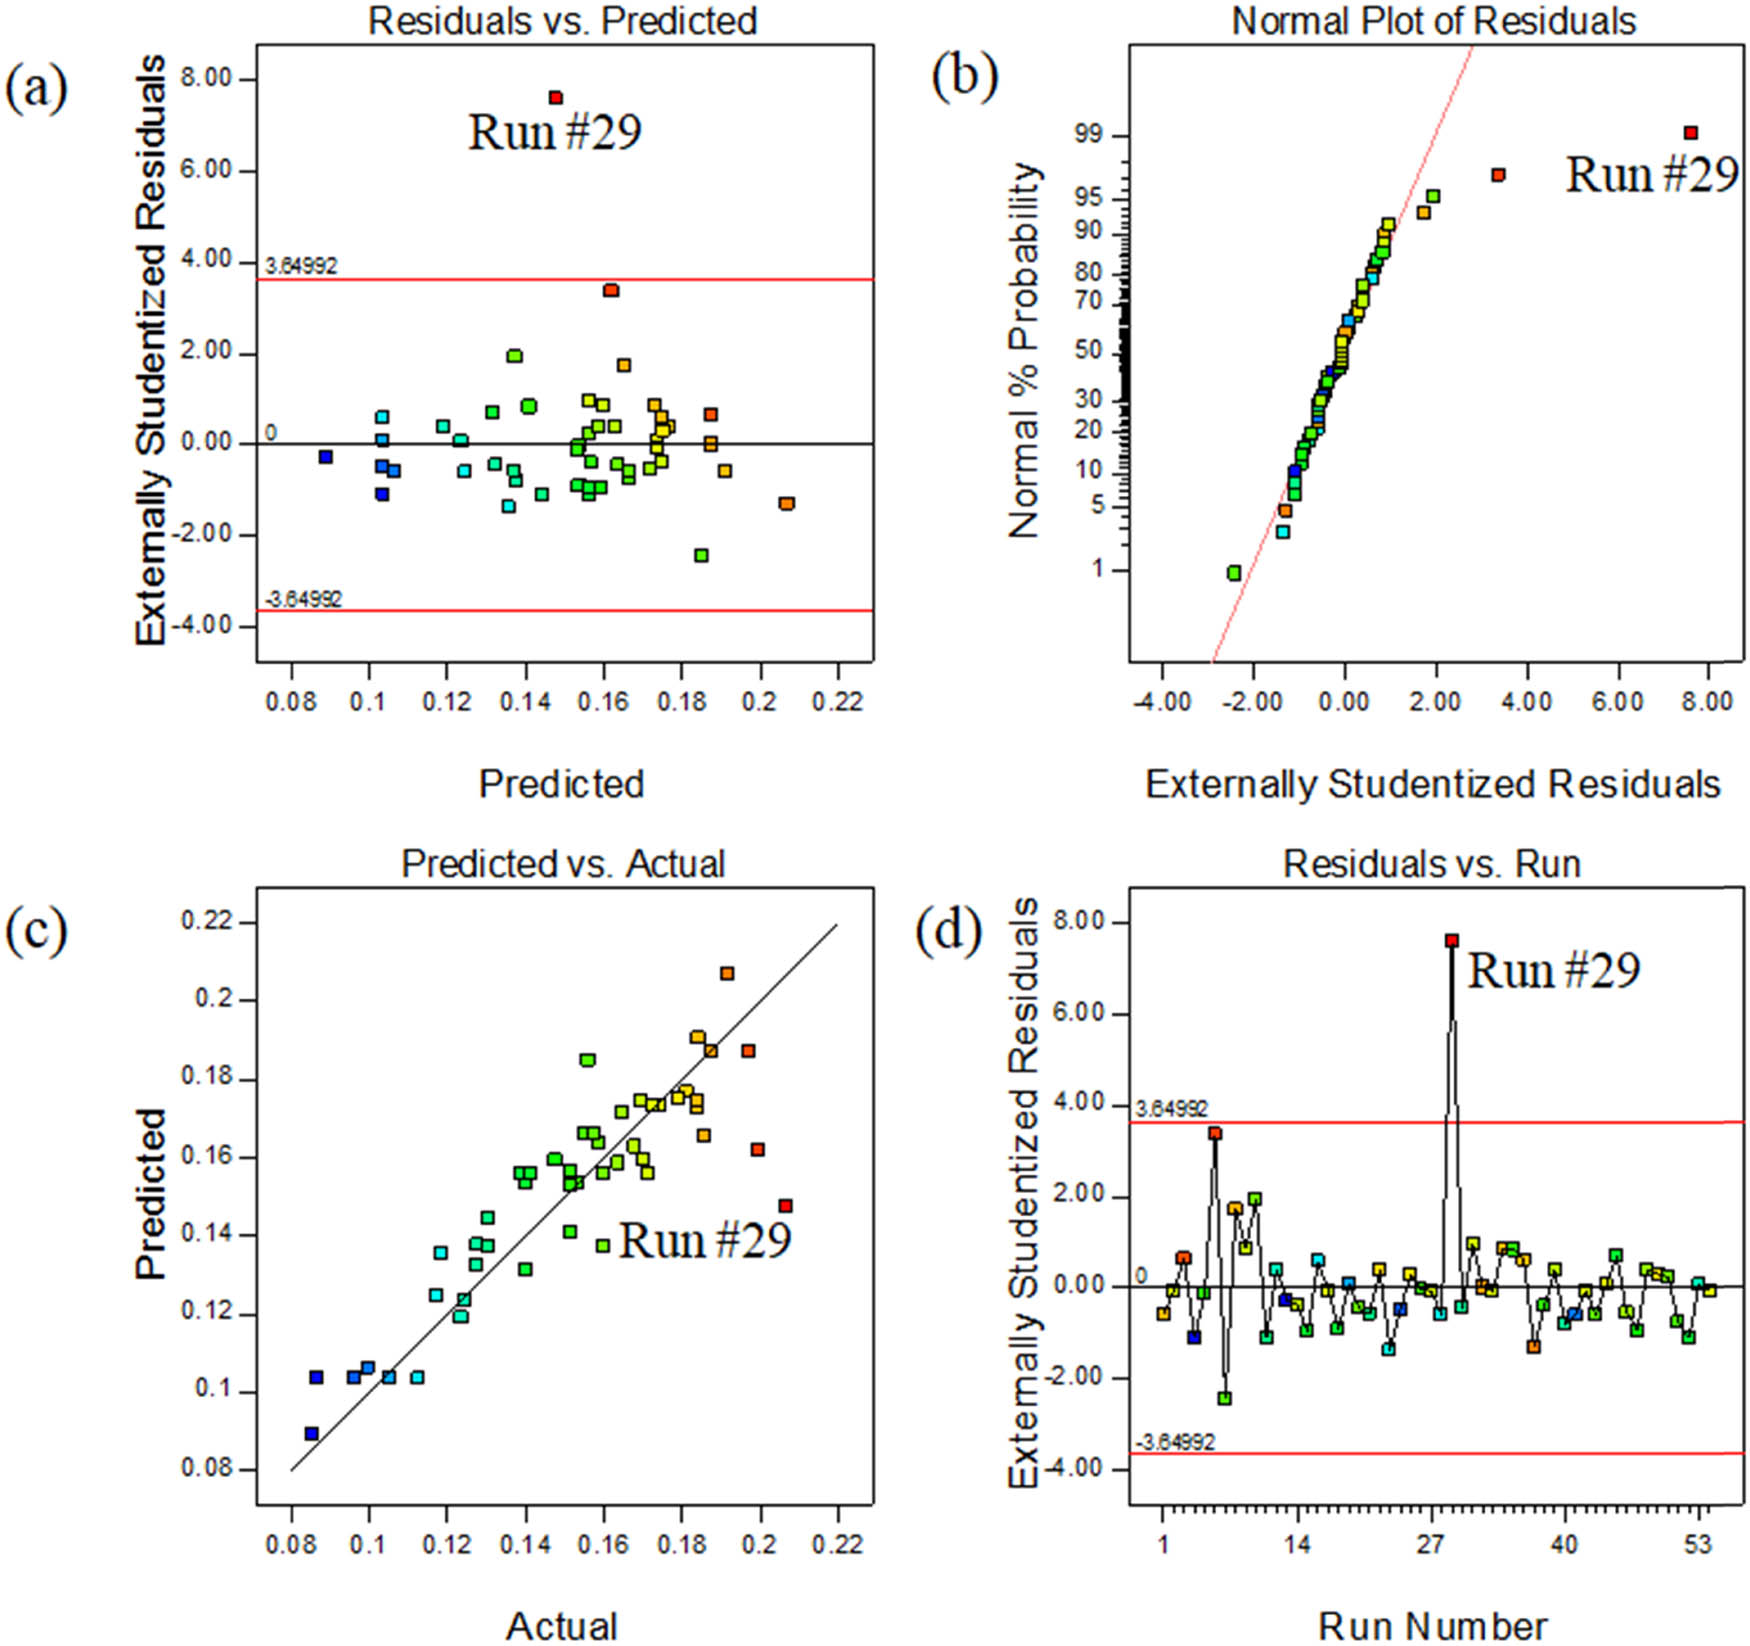
(a) Externally studentized residuals vs the predicted temperature, (b) normal% probability and externally studentized residual plot, (c) predicted vs experimental temperature, and (d) outlier t plot.
It can be seen from Table 4 that the significance F-value of the statistical model is 17.36 and the error probability P-value is <0.0001, indicating that the fitting model is significant. The appropriate accuracy of the model is 17.537, which is much higher than 4, indicating that the signal of the model is sufficient. In this model, the items with P-value less than 0.05 are highly significant at 95% confidence level. Obviously, the model items B, F, BC, BD, BF, CE, EF, A 2 , E 2 , BEF, A 2 C, A 2 E, AB 2 , and B 2 C are significant. “Adeq precision” measures the signal to noise ratio. A ratio greater than 4 is desirable. The ratio of 17.537 indicates an adequate signal that the model can be used to navigate the design space.
Analysis of variance of adjusted response surface experiments
| Source | Sum of squares | df | Mean square | F-value | P-value Prob > F | Remarks |
|---|---|---|---|---|---|---|
| Model | 0.040 | 20 | 1.981 × 10⁻³ | 17.36 | <0.0001 | Significant |
| B-ultrasonic time | 5.382 × 10⁻⁴ | 1 | 5.382 × 10⁻⁴ | 4.72 | 0.0374 | Significant |
| C-water bath temperature | 3.200 × 10⁻⁴ | 1 | 3.200 × 10⁻⁴ | 2.81 | 0.1037 | |
| F-KH-550 | 1.804 × 10⁻³ | 1 | 1.804 × 10⁻³ | 15.81 | 0.0004 | Significant |
| AB | 3.866 × 10⁻⁴ | 1 | 3.866 × 10⁻⁴ | 3.39 | 0.0750 | |
| AC | 3.014 × 10⁻⁴ | 1 | 3.014 × 10⁻⁴ | 2.64 | 0.1139 | |
| BC | 1.461 × 10⁻³ | 1 | 1.461 × 10⁻³ | 12.80 | 0.0011 | Significant |
| BD | 6.882 × 10⁻³ | 1 | 6.882 × 10⁻³ | 60.32 | <0.0001 | Significant |
| BF | 1.461 × 10⁻³ | 1 | 1.461 × 10⁻³ | 12.80 | 0.0011 | Significant |
| CE | 1.907 × 10⁻³ | 1 | 1.907 × 10⁻³ | 16.71 | 0.0003 | Significant |
| EF | 8.632 × 10⁻⁴ | 1 | 8.632 × 10⁻⁴ | 7.57 | 0.0097 | Significant |
| A 2 | 3.675 × 10⁻³ | 1 | 3.675 × 10⁻³ | 32.21 | <0.0001 | Significant |
| D 2 | 3.839 × 10⁻⁴ | 1 | 3.839 × 10⁻⁴ | 3.36 | 0.0759 | |
| E 2 | 6.393 × 10⁻³ | 1 | 6.393 × 10⁻³ | 56.03 | <0.0001 | Significant |
| BCE | 3.659 × 10⁻⁴ | 1 | 3.659 × 10⁻⁴ | 3.21 | 0.0828 | |
| BEF | 4.778 × 10⁻³ | 1 | 4.778 × 10⁻³ | 41.87 | <0.0001 | Significant |
| A 2 C | 9.719 × 10⁻⁴ | 1 | 9.719 × 10⁻⁴ | 8.52 | 0.0064 | Significant |
| A 2 E | 5.512 × 10⁻³ | 1 | 5.512 × 10⁻³ | 48.31 | <0.0001 | Significant |
| A 2 F | 4.230 × 10⁻⁴ | 1 | 4.230 × 10⁻⁴ | 3.71 | 0.0631 | |
| AB 2 | 4.987 × 10⁻⁴ | 1 | 4.987 × 10⁻⁴ | 4.37 | 0.0446 | Significant |
| B 2 C | 7.604 × 10⁻⁴ | 1 | 7.604 × 10⁻⁴ | 6.66 | 0.0146 | Significant |
| Residual | 3.651 × 10⁻³ | 32 | 1.141 × 10⁻⁴ | |||
| Lack of fit | 3.651 × 10⁻³ | 27 | 1.352 × 10⁻⁴ | |||
| Pure error | 0.000 | 5 | 0.000 | |||
| Cor total | 0.043 | 52 |
| R-squared | Adj R-squared | Pred R-squared | Adeq precision |
|---|---|---|---|
| 0.9156 | 0.8629 | 0.7106 | 17.537 |
The value of the coefficient of determination “R-squared” represents the quality of the polynomial model equation fitting. The higher the R-squared, the more consistent the model is with the experimental data. The results show that R-squared is 0.9156, which is close to 1, indicating that the thermal conductivity of the experiment can be explained by the fitting model equation under the condition of 91.56% variability.
The model analysis after adjustment is shown in Figure 5. It can be seen from Figure 5(a) that the experimental data and predicted values are basically distributed along a straight line, which indicates that the difference between the predicted value and the real value is small. Figure 5(b) is the normal distribution table of the residuals. The experimental residuals are distributed along a straight line, which shows that the experiment has good accuracy. Figure 5(c) shows the relationship between the residual and the predicted heating rate. The distribution of data points is scattered and irregular, which indicates that the model can predict the experimental results more accurately in theory. As can be seen from Figure 5(d), the residual error of each data point is in the range of (−3,3), indicating that the data or model operation error is small. Therefore, it can be judged that the fitting model accurately approximates all the experimental data.
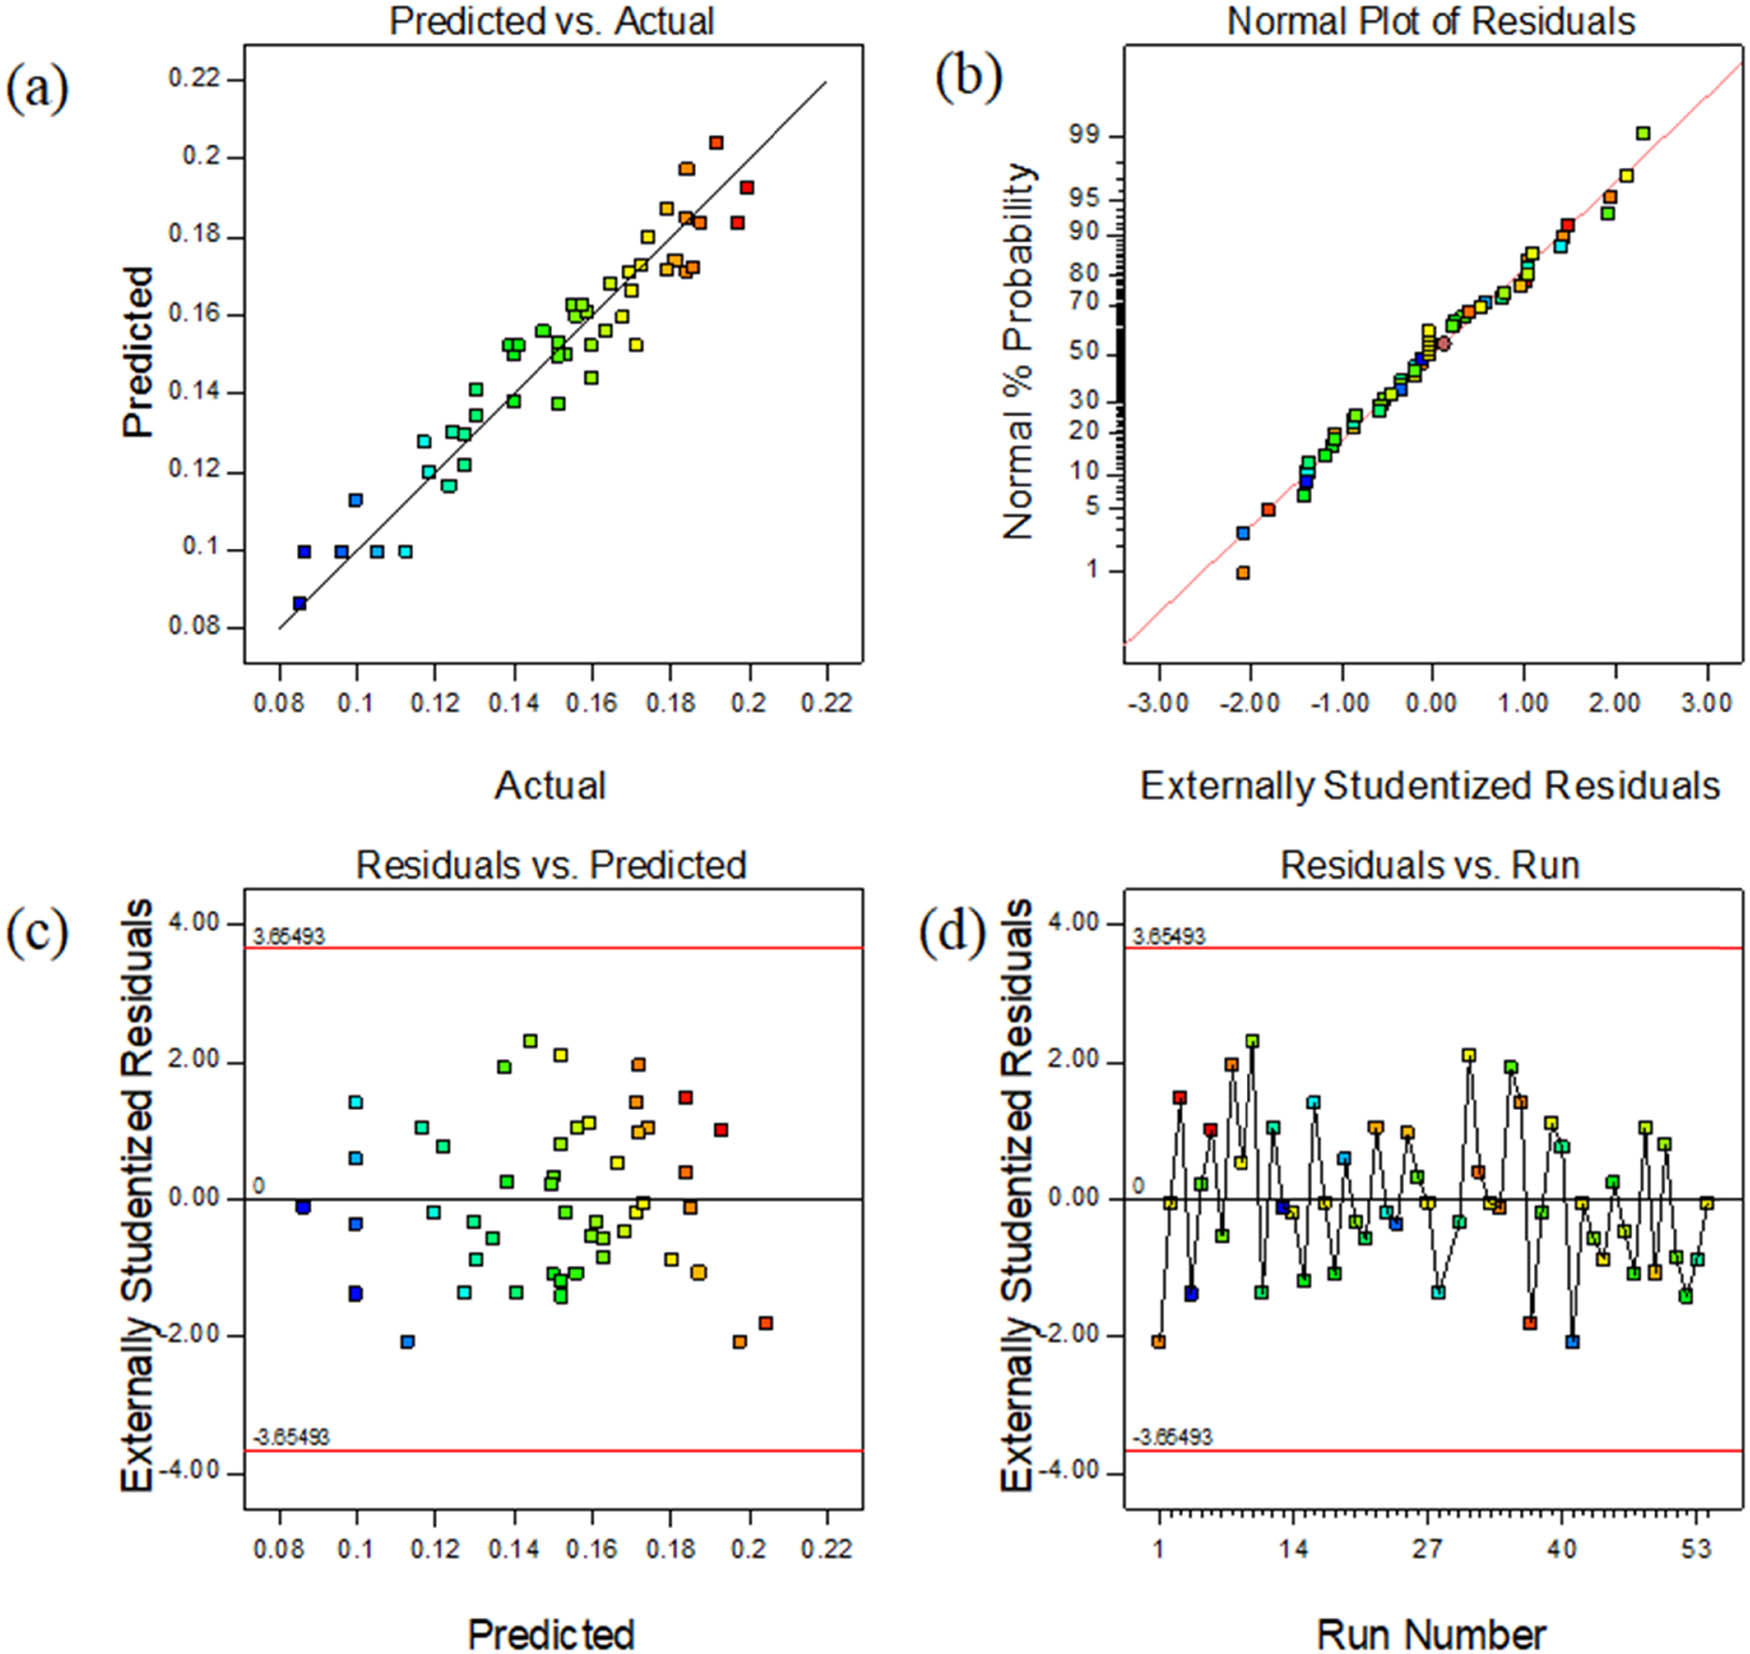
(a) Predicted vs experimental temperature; (b) normal% probability and externally studentized residual plot; (c) externally studentized residuals vs the predicted temperature; and (d) outlier t plot.
3.2.2 Optimization analysis of hydrophobicity data
The optimal fitting of contact angle data adopts multivariate regression analysis method to carry out response surface regression analysis on the experimental results in Table 2. The final equation of contact angle and each factor expressed by coding factor were obtained. The regression equation of contact angle fitting is shown in equation (3), and the variance analysis results are shown in Table 5. Y indicates contact angle.
Variance analysis of response surface experiments of contact angle
| Source | Sum of squares | df | Mean square | F-value | P-value Prob > F | Remarks |
|---|---|---|---|---|---|---|
| Model | 924.86 | 18 | 51.38 | 11.80 | <0.0001 | Significant |
| B-ultrasonic time | 49.35 | 1 | 49.35 | 11.34 | 0.0019 | Significant |
| C-water bath temperature | 70.14 | 1 | 70.14 | 16.11 | 0.0003 | Significant |
| F-KH-550 | 94.01 | 1 | 94.01 | 21.60 | <0.0001 | Significant |
| AC | 97.30 | 1 | 97.30 | 22.35 | <0.0001 | Significant |
| AF | 24.85 | 1 | 24.85 | 5.71 | 0.0224 | Significant |
| CF | 19.80 | 1 | 19.80 | 4.55 | 0.0400 | Significant |
| DE | 20.80 | 1 | 20.80 | 4.78 | 0.0356 | Significant |
| B 2 | 113.13 | 1 | 113.13 | 25.99 | <0.0001 | Significant |
| C 2 | 196.80 | 1 | 196.80 | 45.21 | <0.0001 | Significant |
| D 2 | 35.60 | 1 | 35.60 | 8.18 | 0.0071 | Significant |
| F 2 | 45.58 | 1 | 45.58 | 10.47 | 0.0027 | Significant |
| ABD | 62.72 | 1 | 62.72 | 14.41 | 0.0006 | Significant |
| BEF | 13.26 | 1 | 13.26 | 3.05 | 0.0897 | |
| A 2 B | 21.47 | 1 | 21.47 | 4.93 | 0.0329 | Significant |
| A 2 C | 32.84 | 1 | 32.84 | 7.54 | 0.0095 | Significant |
| AB 2 | 55.12 | 1 | 55.12 | 12.66 | 0.0011 | Significant |
| AC 2 | 75.03 | 1 | 75.03 | 17.24 | 0.0002 | Significant |
| B 2 D | 49.01 | 1 | 49.01 | 11.26 | 0.0019 | Significant |
| Residual | 152.36 | 35 | 4.35 | |||
| Lack of fit | 152.36 | 30 | 5.08 | |||
| Pure error | 0.000 | 5 | 0.000 | |||
| Cor total | 1077.21 | 53 |
| R-squared | Adj R-squared | Pred R-squared | Adeq precision |
|---|---|---|---|
| 0.8586 | 0.7858 | 0.5936 | 15.5814 |
The F-value of the fitting model is 11.80, which implies that the model is significant. The probability that such a large F-value may occur due to the noise is less than 0.01%. In this model, items with P-value less than 0.05 are considered to be highly significant at 95% confidence level. Thus, in this case B, C, F, AC, AF, CF, DE, B 2 , C 2 , D 2 , F 2 , ABD, A 2 B, A 2 C, AB 2 , AC 2 , and B 2 D are significant model terms.
The value of R-squared is 0.8586, which means that the contact angle can be explained by this model at the probability of 85.86%. The “Pred R-squared” of 0.5936 is in reasonable agreement with the “Adj R-squared” of 0.7858. The difference is less than 0.2. The value of “Adeq precision” is 15.5814. The above optimized data analysis shows that the signal is an adequate signal.
According to the analysis in Figure 6(a), the experimental data and predicted values are basically distributed along a straight line, indicating that the difference between the predicted value and the real value is small. Figure 6(b) shows that the residual error of the experiment is distributed along a straight line. It shows that the experiments have good accuracy. Figure 6(c) shows the relationship between the residual and the predicted heat conduction rate. The distribution of data points is random and uniform. It is considered that the model can predict the experimental results accurately in theory. As can be seen in Figure 6(d), the residuals of each data point are in the range of (−3.6, 3.6), indicating that the data or model operation error is small. Therefore, it can be judged that the model fits the experimental data well.
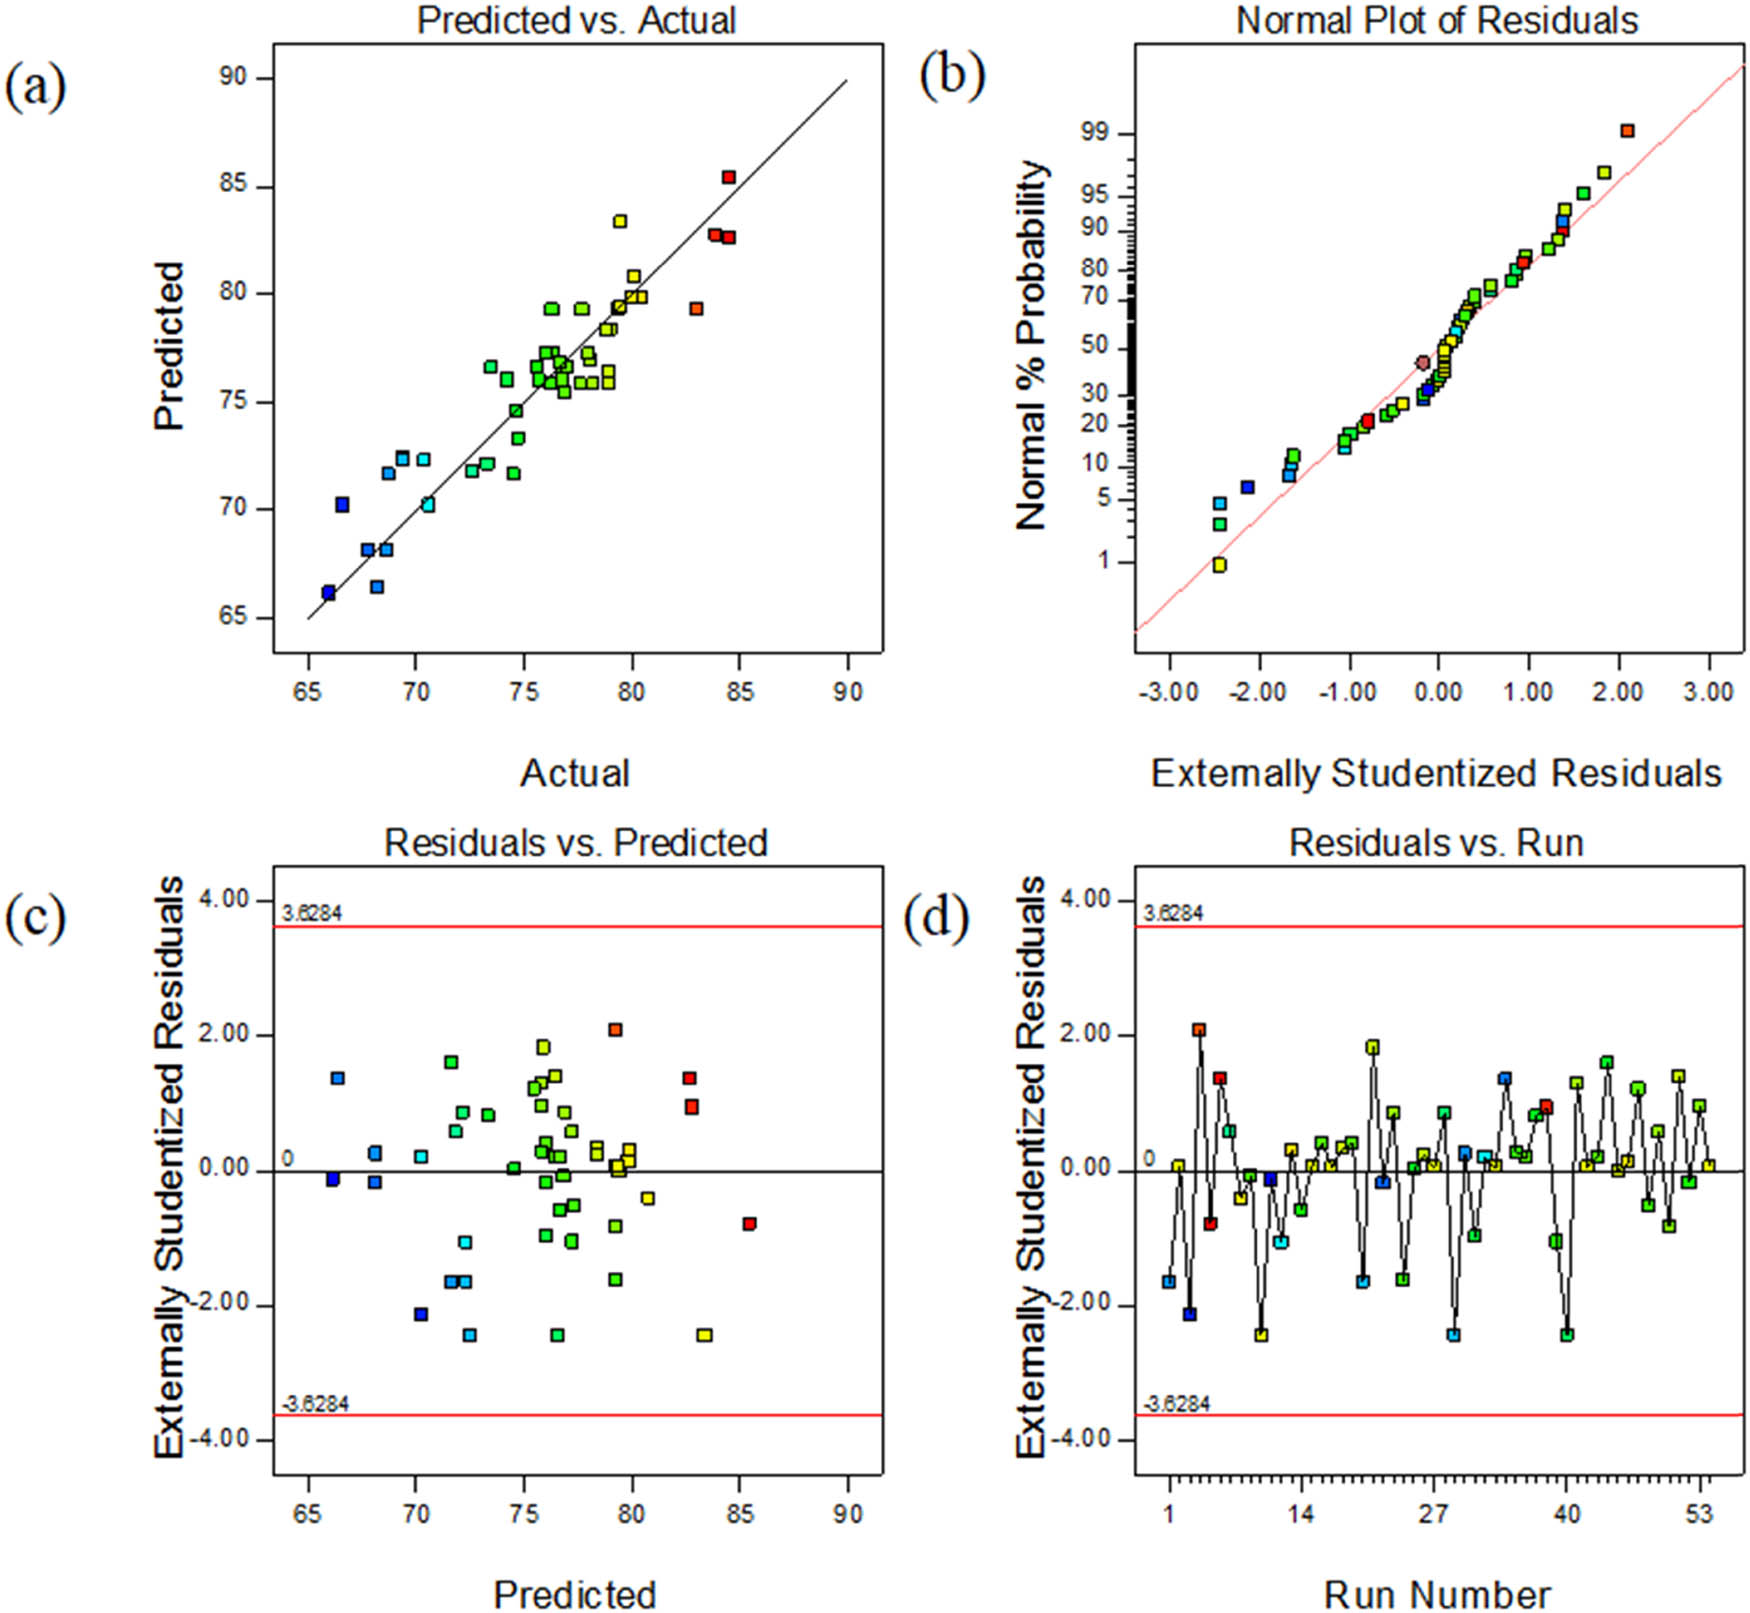
(a) Predicted vs experimental contact angle; (b) normal% probability and externally studentized residual plot; (c) externally studentized residuals vs the predicted contact angle; and (d) outlier t plot.
3.3 Optimization and verification of coating preparation parameters
Response surface and contour map can reflect the degree of interaction between different factors. The 3D surface plots of heating rate are shown in Figure 7(a)–(i). It can be seen from Figure 7(a) that under the condition of water bath temperature of 90°C, water bath time of 20 min, coating thickness of 0.5 mm, and the mass of KH-550 of 0.05 g, the heating rate first increased and then decreased with the increase in GO, and the effect of ultrasonic time on response surface was not significant. Figure 7(b) shows that under the condition of ultrasonic time of 30 min, water bath time of 20 min, coating thickness of 0.5 mm, and the mass of KH-550 of 0.05 g, the heating rate also increases and then decreases with the increase in GO. When GO content is low, the higher the water bath temperature is, the higher the heating rate is. When GO content is high, the effect of water bath temperature on response is not significant.
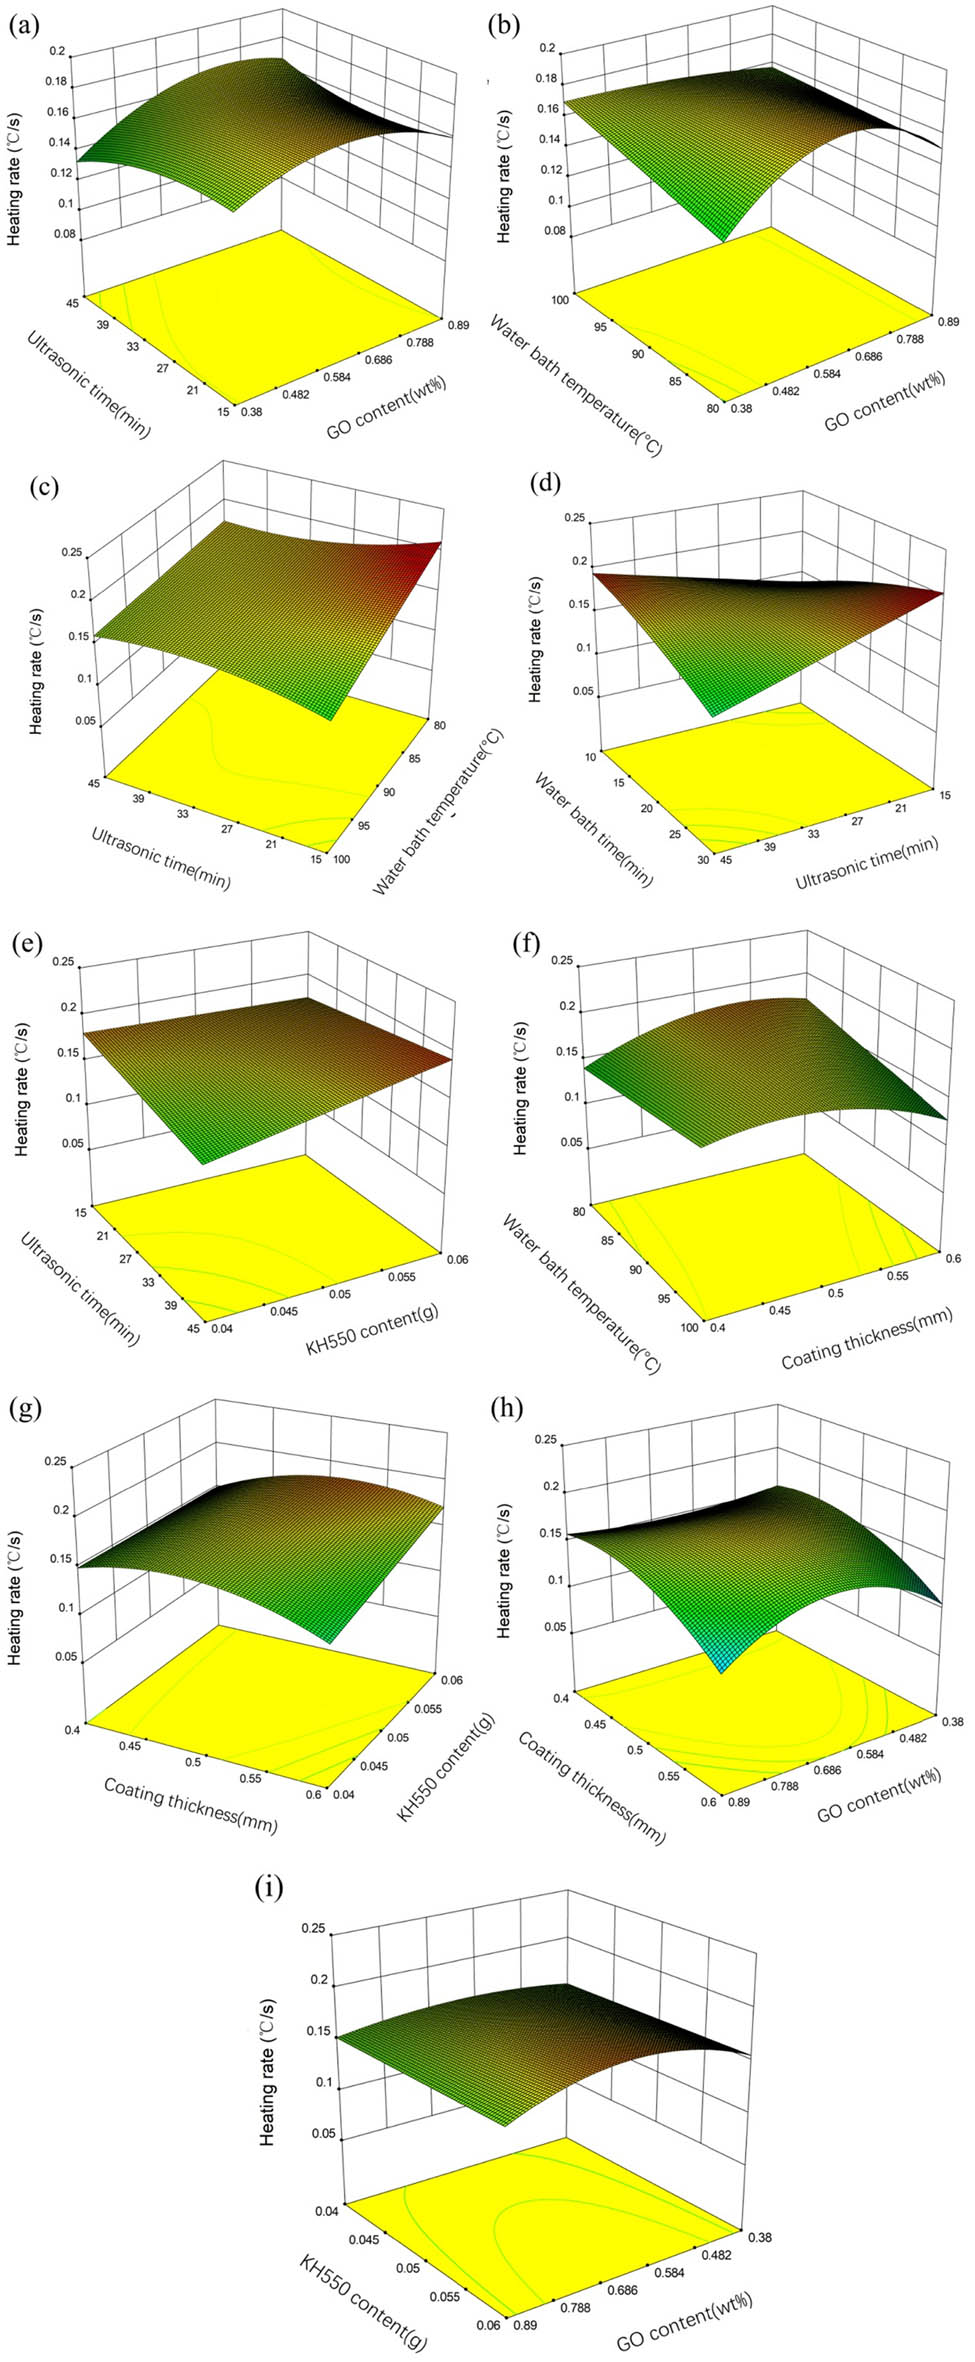
Response surface plots (a)–(i) showing interaction effects of heating rate.
From Figure 7(c), when the ultrasonic time and water bath temperature are both small, the heating rate increases with the decrease in the ultrasonic time and water bath temperature. In Figure 7(d), when the ultrasonic time is at a low level, the heating rate increases with the increase in water bath time. When ultrasonic time is at a high level, the trend is opposite. And when the water bath time is at a low level, the heating rate increases with the increase in the ultrasonic time. In Figure 7(e), when the ultrasonic time is at a low level, the heating rate increases with the increase in the KH-550. Figure 7(f) shows that the heating rate increased and then decreased with the increase in the coating thickness, and then decreased with the increase in the water bath temperature. When the coating thickness was 0.6 mm, the water bath temperature was 100°C, the heat rate was the minimum. Figure 7(g) shows that when the coating thickness was at a high level and the higher the KH-550 content, the heating rate was high.
It can be seen from Figure 7(h) that the heating rate first increases and then decreases with the increase in GO concentration, and decreases with the increase in the coating thickness. However, when the coating thickness was small, GO concentration had no significant effect on the heating rate. It can be seen from Figure 7(i) that the heating rate first increases and then decreases with the increase in the GO concentration, which is less affected by the additional amount of KH-550.
The 3D surface plots of contact angle are shown in Figure 8(a)–(f). In Figure 8(a), when the GO content is low, the contact angle first increases and then decreases with the increase in water bath temperature. While with high GO content, the contact angle decreases with the increase in water bath temperature. When the water bath temperature is low, the contact angle increases with the increase in the GO content. Under the condition of water bath temperature of 80°C, GO content of 0.89 wt%, the contact angle reaches the maximum. In Figure 8(b), under the condition of ultrasonic time of 30 min, water bath time of 20 min, water bath temperature of 90°C, the coating thickness of 0.5 mm, and low GO content, the contact angle decreases with the increase in KH-550, and the effect of GO content on the contact angle is not significant. Under the condition of ultrasonic time of 30 min, water bath time of 20 min, coating thickness of 0.5 mm, and mass of KH-550 of 0.05 g, the contact angle increases and then decreases with the increase in water bath temperature. In Figure 8(d) it can be seen that the influence of coating thickness and water bath time on the contact angle is small. Figure 8(e) shows that when the GO content is low, the heating rate increased and then decreased with the increase in ultrasonic time. It can be seen from Figure 8(f) that the contact angle decreases with the increase in bath time and ultrasonic time.
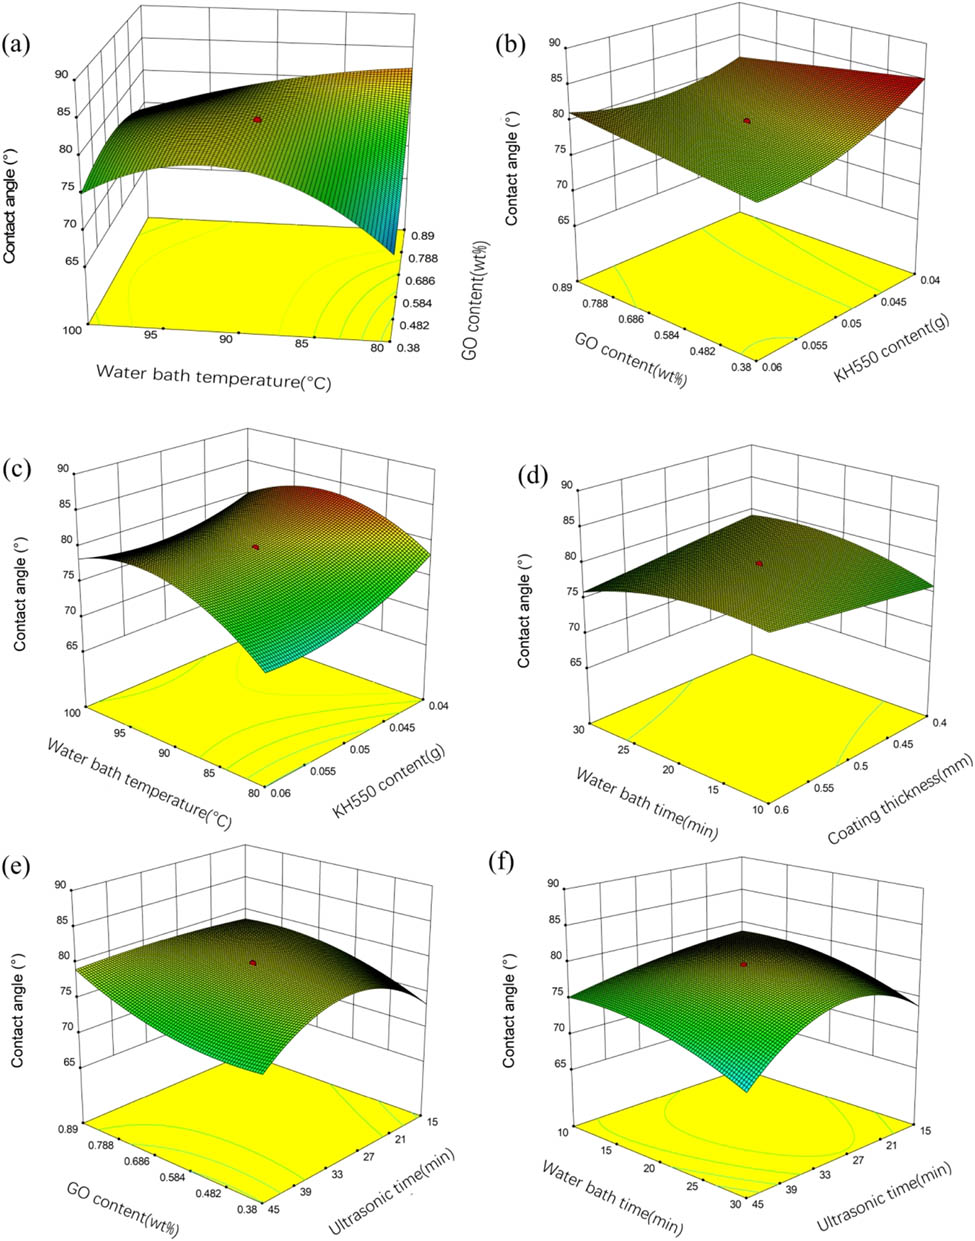
Response surface plots (a)–(f) showing interaction effects of contact angle.
According to the prediction of fitting model, under the condition of GO content of 0.659 wt%, ultrasonic time of 44.981 min, water bath temperature of 80.001°C, water bath time of 10 min, coating thickness of 0.600 mm, and mass of KH-550 of 0.060 g, the heating rate reaches the maximum value of 0.260°C/s. While the maximum contact angle can be reached is 91.525° under the condition of GO content of 0.890 wt%, ultrasonic time of 44.960 min, water bath temperature of 80.102°C, water bath time of 10.065 min, coating thickness of 0.600 mm, and KH-550 of 0.040 g. In order to optimize the comprehensive response surface of the two response values, the optimization module was employed to analyze the optimal scheme parameters. The six factors are considered to be within the reasonable range. According to the requirements of high thermal conductivity and hydrophobicity of GO/PVB/EP nanocomposite coating, the optimization target of Response 1 (heating rate) is set to the maximum. In this work, importance levels of six factors are set as “+++,” and the importance level of heating rate was set as “+++++.”
The contact angle is the characterization parameter of hydrophobicity of coatings. The relevant literature indicates that the superhydrophobic surface has better anti-icing ability [40,41,42]. However, the effect of hydrophobicity on the anti-icing ability is still inconclusive. For example, Memon et al. [43] reported a bad anti-icing performance of hydrophobic surface. Therefore, it is considered that the optimization objective of contact angle (Resp. 2) is the maximum value, while the importance level is lower than that of heating rate (Resp. 1), which is set as “+++.” There are no special requirements for the weight, and the value is set to 1. Thus, the optimal process parameters (Run #55) and corresponding heating rate and contact angle can be obtained by comprehensively considering the two response values through response surface optimization, as shown in Table 6.
Comprehensive optimization of optimal process parameters
| Factor 1 | Factor 2 | Factor 3 | Factor 4 | Factor 5 | Factor 6 | Resp. 1 | Resp.2 | |
|---|---|---|---|---|---|---|---|---|
| GO content (wt%) | Ultrasonic time (min) | Water bath temperature (°C) | Water bath time (min) | Thickness (mm) | KH-550 (g) | Heating rate (°C/s) | Contact angle (°) | |
| Run 55 | 0.884 | 45.000 | 80.000 | 10.000 | 0.567 | 0.060 | 0.218 | 85.75 |
| Run 56 | 0.884 | 45.000 | 80.000 | 10.000 | 0.567 | 0.060 | 0.199 | 86.90 |
In order to verify the correctness of the comprehensive optimized process parameters, the GO/PVB/EP nanocomposite coating samples were prepared by using the process parameters shown in Table 6. The heat transfer characteristics and contact angle of the samples were measured and set as Run #56. In the measurement process, three measurements were taken, the experimental data were recorded, and the measurement error was analyzed as shown in Figure 9(a). It can be seen from Figure 9(a) that the heating rate of the optimized coating sample is 0.199°C/s, and the error between the experimental heating rate and the predicted value of the fitting equation is 8.58%. The measured contact angle is 86.90° as shown in Figure 9(b). The error between the experimental contact angle and the optimized value is 1.33%, which indicates that the comprehensive optimization process parameters are reliable.
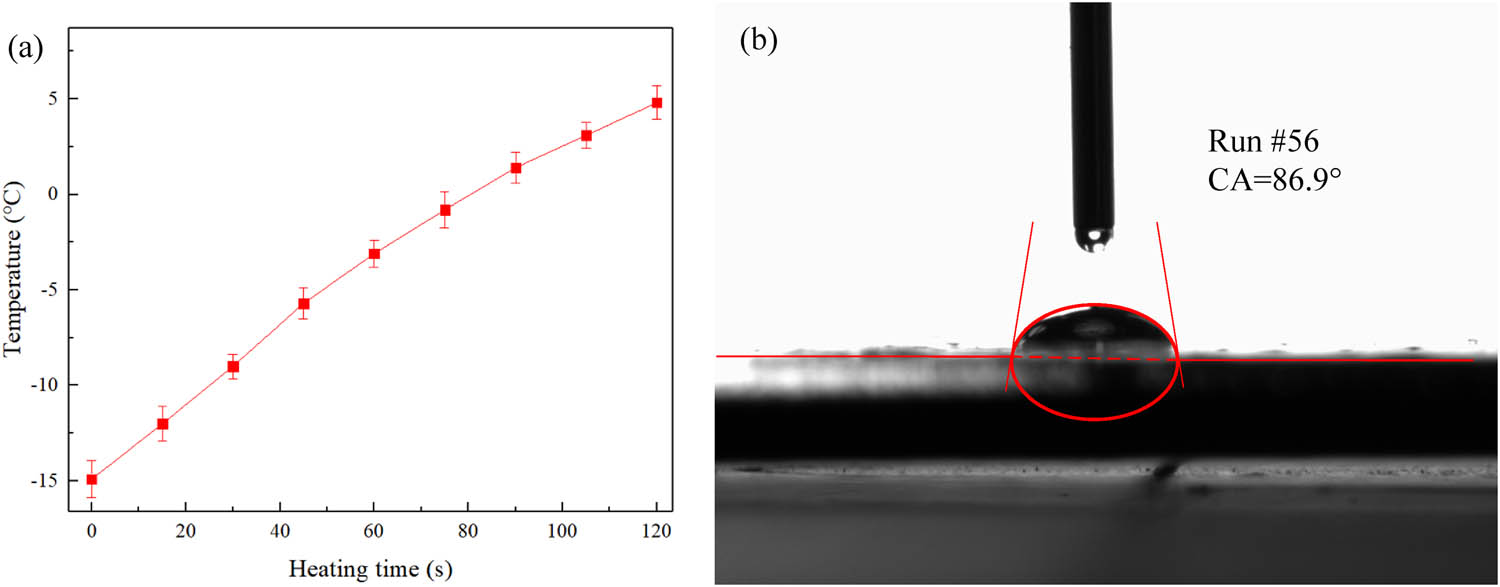
(a) Heating curve and (b) water contact angle of the optimized GO/PVB/EP nanocomposite coatings.
4 Conclusion
In this article, the GO/PVB/EP nanocomposite coatings were prepared, and the thermal and hydrophobic properties of GO/PVB/EP nanocomposite coatings were investigated. GO was uniformly distributed in PVB/EP nanocomposite, and no damage or tear was found in GO layered structure. In order to obtain the optimum parameters, a total of 54 samples were evaluated for performance and a fitting model was proposed. The RSM of the experimental data was effectively employed to investigate the relationship between the significant process parameters. The accuracies of the prediction of the response values were verified by experiments, and the optimized process experimental scheme was obtained. In the optimization process, taking the heat transfer rate and water contact angle as the response values, the response surface analysis of main parameters such as GO content, ultrasonic time, water bath temperature, coating thickness, and KH-550 content was performed.
With the GO content of 0.884 wt%, ultrasonic time of 45 min, water bath temperature of 80°C, water bath time of 10 min, coating thickness of 0.567 mm, and KH-550 content of 0.060 g, the scheme is considered to be the best solution between thermal and hydrophobic properties. Within the scope of this study, the contact angle fitting value of the best compromise between thermal and hydrophobic properties is 0.218°C/s and the fitting value of contact angle is 85.75°. Therefore, in the range of important parameters studied, the multi-functional nanocomposite coating with heat transfer performance and surface hydrophobicity can be prepared by using the optimized process.
In this work, we studied the best combination of preparation parameters of GO/PVB/EP nanocomposite coatings; however, the micro reasons were not explored. Moreover, the relationship between contact angle and hydrophobicity was not discussed.
-
Funding information: This work was supported by the Natural Foundation of Shandong Province (Grant No. ZR2019BEE068), and Guangdong Basic and Applied Basic Research Foundation (Grant No. 2020A1515111208). The authors thank the referees of this article for their valuable and very helpful comments.
-
Author contributions: Xintian Liu: investigation, writing: original draft. Long Chen: supervision, resources, writing: review & editing. Zhanqiang Liu: resources, writing: review & editing. Qinghua Song: data curation, methodology. Chaozong Liu: resources, formal analysis. All authors have accepted responsibility for the entire content of this manuscript and approved its submission.
-
Conflict of interest: The authors state no conflict of interest.
References
[1] Bupesh Raja VK, Palanikumar K, Rohith Renish R, Ganesh Babu AN, Varma J, Gopal P. Corrosion resistance of corten steel – a review. Mater Today Proc. 2021;46:3572–7. 10.1016/j.matpr.2021.01.334.Suche in Google Scholar
[2] Zhou C, Li Z, Li J, Yuan T, Chen B, Ma X, et al. Epoxy composite coating with excellent anticorrosion and self-healing performances based on multifunctional zeolitic imidazolate framework derived nanocontainers. Chem Eng J. 2020;385:123835. 10.1016/j.cej.2019.123835.Suche in Google Scholar
[3] Liu T, Wei J, Ma L, Liu S, Zhang D, Zhao H. Effect of polyaniline-based plate on the anticorrosion performance of epoxy coating. Prog Org Coat. 2021;151:106109. 10.1016/j.porgcoat.2020.106109.Suche in Google Scholar
[4] Kumari S, Saini A, Dhayal V. Metal oxide based epoxy coatings for corrosion protection of steel. In: Materials Today: Proceedings. England: Elsevier Ltd; 2021. p. 3105–9. 10.1016/j.matpr.2021.01.587.Suche in Google Scholar
[5] Rajitha K, Mohana KNS. Synthesis of graphene oxide-based nanofillers and their influence on the anticorrosion performance of epoxy coating in saline medium. Diam Relat Mater. 2020;108:107974. 10.1016/j.diamond.2020.107974.Suche in Google Scholar
[6] Balandin AA, Ghosh S, Bao W, Calizo I, Teweldebrhan D, Miao F, et al. Superior thermal conductivity of single-layer graphene. Nano Lett. 2008;8:902–7. 10.1021/nl0731872.Suche in Google Scholar PubMed
[7] Kolesnikov DV. Numerical investigation of the electrical conductivity of irradiated graphene. Solid State Commun. 2020;308:113834. 10.1016/j.ssc.2020.113834.Suche in Google Scholar
[8] Yang J, Custer D, Chiang CC, Meng Z, Yao XH. Understanding the mechanical and viscoelastic properties of graphene reinforced polycarbonate nanocomposites using coarse-grained molecular dynamics simulations. Comput Mater Sci. 2021;191:110339. 10.1016/j.commatsci.2021.110339.Suche in Google Scholar PubMed PubMed Central
[9] Mu J, Gao F, Cui G, Wang S, Tang S, Li Z. A comprehensive review of anticorrosive graphene-composite coatings. Prog Org Coat. 2021;157:106321. 10.1016/j.porgcoat.2021.106321.Suche in Google Scholar
[10] Ding R, Chen S, Lv J, Zhang W, Zhao XD, Liu J. Study on graphene modified organic anti-corrosion coatings: a comprehensive review. J Alloy Compd. 2019;806:611–35. 10.1016/j.jallcom.2019.07.256.Suche in Google Scholar
[11] Lin S, Buehler MJ. Thermal transport in monolayer graphene oxide: atomistic insights into phonon engineering through surface chemistry. Carbon NY. 2014;77:351–9. 10.1016/j.carbon.2014.05.038.Suche in Google Scholar
[12] Ge T, Zhang M, Tang K, Tang H. Diisocyanate-modified graphene oxide/hydroxyl-terminated silicone rubber composites for improved thermal conductivity. Mater Chem Phys. 2020;252:123250. 10.1016/j.matchemphys.2020.123250.Suche in Google Scholar
[13] Liu Z, Chen Z, Yu F. Enhanced thermal conductivity of microencapsulated phase change materials based on graphene oxide and carbon nanotube hybrid filler. Sol Energy Mater Sol Cell. 2019;192:72–80. 10.1016/j.solmat.2018.12.014.Suche in Google Scholar
[14] Esfahani MR, Languri EM, Nunna MR. Effect of particle size and viscosity on thermal conductivity enhancement of graphene oxide nanofluid. Int Commun Heat Mass Transf. 2016;76:308–15. 10.1016/j.icheatmasstransfer.2016.06.006.Suche in Google Scholar
[15] Yuan W, Xiao Q, Li L, Xu T. Thermal conductivity of epoxy adhesive enhanced by hybrid graphene oxide/AlN particles. Appl Therm Eng. 2016;106:1067–74. 10.1016/j.applthermaleng.2016.06.089.Suche in Google Scholar
[16] Kyrkjebø S, Cassidy A, Akhtar N, Balog R, Scheffler M, Hornekær L, et al. Graphene and graphene oxide on Ir(111) are transparent to wetting but not to icing. Carbon N Y. 2021;174:396–403. 10.1016/j.carbon.2020.12.030.Suche in Google Scholar
[17] Zhang F, Liu W, Liang L, Yang M, Wang S, Shi H, et al. Application of polyether amine intercalated graphene oxide as filler for enhancing hydrophobicity, thermal stability, mechanical and anti-corrosion properties of waterborne polyurethane. Diam Relat Mater. 2020;109:108077. 10.1016/j.diamond.2020.108077.Suche in Google Scholar
[18] Kolya H, Kang CW. Polyvinyl acetate/reduced graphene oxide-poly (diallyl dimethylammonium chloride) composite coated wood surface reveals improved hydrophobicity. Prog Org Coat. 2021;156:106253. 10.1016/j.porgcoat.2021.106253.Suche in Google Scholar
[19] Huang HD, Guo Z, Yang PYan, Chen P, Wu J. Chem Phys Lett. 2021;771:138551. 10.1016/j.cplett.2021.138551.Suche in Google Scholar
[20] Gong M, Zhao Q, Dai L, Li Y, Jiang T. Fabrication of polylactic acid/hydroxyapatite/graphene oxide composite and their thermal stability, hydrophobic and mechanical properties. J Asian Ceram Soc. 2017;5:160–8. 10.1016/j.jascer.2017.04.001.Suche in Google Scholar
[21] Wang C, Lan Y, Yu W, Li X, Qian Y, Liu H. Preparation of amino-functionalized graphene oxide/polyimide composite films with improved mechanical, thermal and hydrophobic properties. Appl Surf Sci. 2016;362:11–9. 10.1016/j.apsusc.2015.11.201.Suche in Google Scholar
[22] Valera TS, Demarquette NR. Polymer toughening using residue of recycled windshields: PVB film as impact modifier. Eur Polym J. 2008;44:755–68. 10.1016/J.EURPOLYMJ.2007.12.012.Suche in Google Scholar
[23] Ma Z, Sun M, Li A, Zhu G, Zhang Y. Anticorrosion behavior of polyvinyl butyral (PVB)/polymethylhydrosiloxane (PMHS)/chitosan (Ch) environment-friendly assembled coatings. Prog Org Coat. 2020;144:105662. 10.1016/J.PORGCOAT.2020.105662.Suche in Google Scholar
[24] Ambrósio JD, Sônego M, Staffa LH, Chinelatto MA, Costa LC. Characterization of flexible Poly(vinyl butyral)/wood flour composites. Compos Part B Eng. 2019;175:107118. 10.1016/J.COMPOSITESB.2019.107118.Suche in Google Scholar
[25] Yao H, Zhang X, Shen L, Bao N. Tribological and anticorrosion properties of polyvinyl butyral (PVB) coating reinforced with phenol formaldehyde resin (PF). Prog Org Coatings. 2021;158:106382. 10.1016/J.PORGCOAT.2021.106382.Suche in Google Scholar
[26] Zhang J, Zhang X, Zheng Y. Synthesis of poly(p-phenylenediamine) encapsulated graphene and its application in steel protection. Prog Org Coat. 2021;158:106330. 10.1016/J.PORGCOAT.2021.106330.Suche in Google Scholar
[27] Yang B, Wang W, Huang J. Synergic effects of poly(vinyl butyral) on toughening epoxies by nanostructured rubbers. Polym (Guildf). 2015;77:129–42. 10.1016/J.POLYMER.2015.09.027.Suche in Google Scholar
[28] Zhao Z, Chen H, Liu X, Wang Z, Zhu Y, Zhou Y. Novel sandwich structural electric heating coating for anti-icing/de-icing on complex surfaces. Surf Coat Technol. 2020;404:126489. 10.1016/j.surfcoat.2020.126489.Suche in Google Scholar
[29] Mohammed AG, Ozgur G, Sevkat E. Electrical resistance heating for deicing and snow melting applications: experimental study. Cold Reg Sci Technol. 2019;160:128–38. 10.1016/j.coldregions.2019.02.004.Suche in Google Scholar
[30] Nilsson F, Moyassari A, Bautista Á, Castro A, Arbeloa I, Järn M, et al. Modelling anti-icing of railway overhead catenary wires by resistive heating. Int J Heat Mass Transf. 2019;143:118505. 10.1016/j.ijheatmasstransfer.2019.118505.Suche in Google Scholar
[31] Na T, Liu X, Jiang H, Zhao L, Zhao C. Enhanced thermal conductivity of fluorinated epoxy resins by incorporating inorganic filler. React Funct Polym. 2018;128:84–90. 10.1016/j.reactfunctpolym.2018.05.004.Suche in Google Scholar
[32] Assael MJ, Antoniadis KD, Tzetzis D. The use of the transient hot-wire technique for measurement of the thermal conductivity of an epoxy-resin reinforced with glass fibres and/or carbon multi-walled nanotubes. Compos Sci Technol. 2008;68:3178–83. 10.1016/j.compscitech.2008.07.019.Suche in Google Scholar
[33] Lv R, Ren Y, Guo H, Bai S. Recent progress on thermal conductivity of graphene filled epoxy composites. Nano Mater Sci. 2021:1–15. 10.1016/J.NANOMS.2021.06.001.Suche in Google Scholar
[34] Liu Y, Lu J, Cui Y. Improved thermal conductivity of epoxy resin by graphene–nickel three-dimensional filler. Carbon Resour Convers. 2020;3:29–35. 10.1016/J.CRCON.2019.12.003.Suche in Google Scholar
[35] He J, Wang H, Qu Q, Su Z, Qin T, Tian X. Three-dimensional network constructed by vertically oriented multilayer graphene and SiC nanowires for improving thermal conductivity and operating safety of epoxy composites with ultralow loading. Compos Part A Appl Sci Manuf. 2020;139:106062. 10.1016/J.COMPOSITESA.2020.106062.Suche in Google Scholar
[36] Hou W, Gao Y, Wang J, Blackwood DJ, Teo S. Recent advances and future perspectives for graphene oxide reinforced epoxy resins. Mater Today Commun. 2020;23:100883. 10.1016/J.MTCOMM.2019.100883.Suche in Google Scholar
[37] Zhang W, Wang Z, Lv S, Zhan W, Bai G, Zhou A, et al. Molecular simulation of different structure dopamine-modified graphene oxide and its effects on thermal and mechanical properties of the epoxy resin system. Polym (Guildf). 2021;212:123120. 10.1016/J.POLYMER.2020.123120.Suche in Google Scholar
[38] Moradi Kooshksara M, Mohammadi S. Investigation of the in-situ solvothermal reduction of multi-layered Graphene oxide in epoxy coating by acetonitrile on improving the hydrophobicity and corrosion resistance. Prog Org Coat. 2021;159:106432. 10.1016/J.PORGCOAT.2021.106432.Suche in Google Scholar
[39] Ramirez-Soria EH, León-Silva U, Lara-Ceniceros TE, Bazán-Díaz L, Advíncula RC, Bonilla-Cruz J. Graphene oxide bifunctionalized with NH2/NH3+ and their outstanding-performance against corrosion. Appl Surf Sci. 2021;561:150048. 10.1016/J.APSUSC.2021.150048.Suche in Google Scholar
[40] Ge C, Yuan G, Guo C, Ngo CV, Li W. Femtosecond laser fabrication of square pillars integrated Siberian-Cocklebur-like microstructures surface for anti-icing. Mater Des. 2021;204:109689. 10.1016/j.matdes.2021.109689.Suche in Google Scholar
[41] Gao Y, Qu L, He B, Dai K, Fang Z, Zhu R. Study on effectiveness of anti-icing and deicing performance of super-hydrophobic asphalt concrete. Constr Build Mater. 2018;191:270–80. 10.1016/j.conbuildmat.2018.10.009.Suche in Google Scholar
[42] Maghsoudi K, Vazirinasab E, Momen G, Jafari R. Icephobicity and durability assessment of superhydrophobic surfaces: The role of surface roughness and the ice adhesion measurement technique. J Mater Process Technol. 2021;288:116883. 10.1016/j.jmatprotec.2020.116883.Suche in Google Scholar
[43] Memon H, Liu J, De Focatiis DS, Choi KS, Hou X. Intrinsic dependence of ice adhesion strength on surface roughness. Surf Coat Technol. 2020;385:125382. 10.1016/j.surfcoat.2020.125382.Suche in Google Scholar
© 2021 Xintian Liu et al., published by De Gruyter
This work is licensed under the Creative Commons Attribution 4.0 International License.
Artikel in diesem Heft
- Research Articles
- Improved impedance matching by multi-componential metal-hybridized rGO toward high performance of microwave absorption
- Pure-silk fibroin hydrogel with stable aligned micropattern toward peripheral nerve regeneration
- Effective ion pathways and 3D conductive carbon networks in bentonite host enable stable and high-rate lithium–sulfur batteries
- Fabrication and characterization of 3D-printed gellan gum/starch composite scaffold for Schwann cells growth
- Synergistic strengthening mechanism of copper matrix composite reinforced with nano-Al2O3 particles and micro-SiC whiskers
- Deformation mechanisms and plasticity of ultrafine-grained Al under complex stress state revealed by digital image correlation technique
- On the deformation-induced grain rotations in gradient nano-grained copper based on molecular dynamics simulations
- Removal of sulfate from aqueous solution using Mg–Al nano-layered double hydroxides synthesized under different dual solvent systems
- Microwave-assisted sol–gel synthesis of TiO2-mixed metal oxide nanocatalyst for degradation of organic pollutant
- Electrophoretic deposition of graphene on basalt fiber for composite applications
- Polyphenylene sulfide-coated wrench composites by nanopinning effect
- Thermal conductivity and thermoelectric properties in 3D macroscopic pure carbon nanotube materials
- An effective thermal conductivity and thermomechanical homogenization scheme for a multiscale Nb3Sn filaments
- Friction stir spot welding of AA5052 with additional carbon fiber-reinforced polymer composite interlayer
- Improvement of long-term cycling performance of high-nickel cathode materials by ZnO coating
- Quantum effects of gas flow in nanochannels
- An approach to effectively improve the interfacial bonding of nano-perfused composites by in situ growth of CNTs
- Effects of nano-modified polymer cement-based materials on the bending behavior of repaired concrete beams
- Effects of the combined usage of nanomaterials and steel fibres on the workability, compressive strength, and microstructure of ultra-high performance concrete
- One-pot solvothermal synthesis and characterization of highly stable nickel nanoparticles
- Comparative study on mechanisms for improving mechanical properties and microstructure of cement paste modified by different types of nanomaterials
- Effect of in situ graphene-doped nano-CeO2 on microstructure and electrical contact properties of Cu30Cr10W contacts
- The experimental study of CFRP interlayer of dissimilar joint AA7075-T651/Ti-6Al-4V alloys by friction stir spot welding on mechanical and microstructural properties
- Vibration analysis of a sandwich cylindrical shell in hygrothermal environment
- Water barrier and mechanical properties of sugar palm crystalline nanocellulose reinforced thermoplastic sugar palm starch (TPS)/poly(lactic acid) (PLA) blend bionanocomposites
- Strong quadratic acousto-optic coupling in 1D multilayer phoxonic crystal cavity
- Three-dimensional shape analysis of peripapillary retinal pigment epithelium-basement membrane layer based on OCT radial images
- Solvent regulation synthesis of single-component white emission carbon quantum dots for white light-emitting diodes
- Xanthate-modified nanoTiO2 as a novel vulcanization accelerator enhancing mechanical and antibacterial properties of natural rubber
- Effect of steel fiber on impact resistance and durability of concrete containing nano-SiO2
- Ultrasound-enhanced biosynthesis of uniform ZnO nanorice using Swietenia macrophylla seed extract and its in vitro anticancer activity
- Temperature dependence of hardness prediction for high-temperature structural ceramics and their composites
- Study on the frequency of acoustic emission signal during crystal growth of salicylic acid
- Controllable modification of helical carbon nanotubes for high-performance microwave absorption
- Role of dry ozonization of basalt fibers on interfacial properties and fracture toughness of epoxy matrix composites
- Nanosystem’s density functional theory study of the chlorine adsorption on the Fe(100) surface
- A rapid nanobiosensing platform based on herceptin-conjugated graphene for ultrasensitive detection of circulating tumor cells in early breast cancer
- Improving flexural strength of UHPC with sustainably synthesized graphene oxide
- The role of graphene/graphene oxide in cement hydration
- Structural characterization of microcrystalline and nanocrystalline cellulose from Ananas comosus L. leaves: Cytocompatibility and molecular docking studies
- Evaluation of the nanostructure of calcium silicate hydrate based on atomic force microscopy-infrared spectroscopy experiments
- Combined effects of nano-silica and silica fume on the mechanical behavior of recycled aggregate concrete
- Safety study of malapposition of the bio-corrodible nitrided iron stent in vivo
- Triethanolamine interface modification of crystallized ZnO nanospheres enabling fast photocatalytic hazard-free treatment of Cr(vi) ions
- Novel electrodes for precise and accurate droplet dispensing and splitting in digital microfluidics
- Construction of Chi(Zn/BMP2)/HA composite coating on AZ31B magnesium alloy surface to improve the corrosion resistance and biocompatibility
- Experimental and multiscale numerical investigations on low-velocity impact responses of syntactic foam composites reinforced with modified MWCNTs
- Comprehensive performance analysis and optimal design of smart light pole for cooperative vehicle infrastructure system
- Room temperature growth of ZnO with highly active exposed facets for photocatalytic application
- Influences of poling temperature and elongation ratio on PVDF-HFP piezoelectric films
- Large strain hardening of magnesium containing in situ nanoparticles
- Super stable water-based magnetic fluid as a dual-mode contrast agent
- Photocatalytic activity of biogenic zinc oxide nanoparticles: In vitro antimicrobial, biocompatibility, and molecular docking studies
- Hygrothermal environment effect on the critical buckling load of FGP microbeams with initial curvature integrated by CNT-reinforced skins considering the influence of thickness stretching
- Thermal aging behavior characteristics of asphalt binder modified by nano-stabilizer based on DSR and AFM
- Building effective core/shell polymer nanoparticles for epoxy composite toughening based on Hansen solubility parameters
- Structural characterization and nanoscale strain field analysis of α/β interface layer of a near α titanium alloy
- Optimization of thermal and hydrophobic properties of GO-doped epoxy nanocomposite coatings
- The properties of nano-CaCO3/nano-ZnO/SBR composite-modified asphalt
- Three-dimensional metallic carbon allotropes with superhardness
- Physical stability and rheological behavior of Pickering emulsions stabilized by protein–polysaccharide hybrid nanoconjugates
- Optimization of volume fraction and microstructure evolution during thermal deformation of nano-SiCp/Al–7Si composites
- Phase analysis and corrosion behavior of brazing Cu/Al dissimilar metal joint with BAl88Si filler metal
- High-efficiency nano polishing of steel materials
- On the rheological properties of multi-walled carbon nano-polyvinylpyrrolidone/silicon-based shear thickening fluid
- Fabrication of Ag/ZnO hollow nanospheres and cubic TiO2/ZnO heterojunction photocatalysts for RhB degradation
- Fabrication and properties of PLA/nano-HA composite scaffolds with balanced mechanical properties and biological functions for bone tissue engineering application
- Investigation of the early-age performance and microstructure of nano-C–S–H blended cement-based materials
- Reduced graphene oxide coating on basalt fabric using electrophoretic deposition and its role in the mechanical and tribological performance of epoxy/basalt fiber composites
- Effect of nano-silica as cementitious materials-reducing admixtures on the workability, mechanical properties and durability of concrete
- Machine-learning-assisted microstructure–property linkages of carbon nanotube-reinforced aluminum matrix nanocomposites produced by laser powder bed fusion
- Physical, thermal, and mechanical properties of highly porous polylactic acid/cellulose nanofibre scaffolds prepared by salt leaching technique
- A comparative study on characterizations and synthesis of pure lead sulfide (PbS) and Ag-doped PbS for photovoltaic applications
- Clean preparation of washable antibacterial polyester fibers by high temperature and high pressure hydrothermal self-assembly
- Al 5251-based hybrid nanocomposite by FSP reinforced with graphene nanoplates and boron nitride nanoparticles: Microstructure, wear, and mechanical characterization
- Interlaminar fracture toughness properties of hybrid glass fiber-reinforced composite interlayered with carbon nanotube using electrospray deposition
- Microstructure and life prediction model of steel slag concrete under freezing-thawing environment
- Synthesis of biogenic silver nanoparticles from the seed coat waste of pistachio (Pistacia vera) and their effect on the growth of eggplant
- Study on adaptability of rheological index of nano-PUA-modified asphalt based on geometric parameters of parallel plate
- Preparation and adsorption properties of nano-graphene oxide/tourmaline composites
- A study on interfacial behaviors of epoxy/graphene oxide derived from pitch-based graphite fibers
- Multiresponsive carboxylated graphene oxide-grafted aptamer as a multifunctional nanocarrier for targeted delivery of chemotherapeutics and bioactive compounds in cancer therapy
- Piezoresistive/piezoelectric intrinsic sensing properties of carbon nanotube cement-based smart composite and its electromechanical sensing mechanisms: A review
- Smart stimuli-responsive biofunctionalized niosomal nanocarriers for programmed release of bioactive compounds into cancer cells in vitro and in vivo
- Photoremediation of methylene blue by biosynthesized ZnO/Fe3O4 nanocomposites using Callistemon viminalis leaves aqueous extract: A comparative study
- Study of gold nanoparticles’ preparation through ultrasonic spray pyrolysis and lyophilisation for possible use as markers in LFIA tests
- Review Articles
- Advance on the dispersion treatment of graphene oxide and the graphene oxide modified cement-based materials
- Development of ionic liquid-based electroactive polymer composites using nanotechnology
- Nanostructured multifunctional electrocatalysts for efficient energy conversion systems: Recent perspectives
- Recent advances on the fabrication methods of nanocomposite yarn-based strain sensor
- Review on nanocomposites based on aerospace applications
- Overview of nanocellulose as additives in paper processing and paper products
- The frontiers of functionalized graphene-based nanocomposites as chemical sensors
- Material advancement in tissue-engineered nerve conduit
- Carbon nanostructure-based superhydrophobic surfaces and coatings
- Functionalized graphene-based nanocomposites for smart optoelectronic applications
- Interfacial technology for enhancement in steel fiber reinforced cementitious composite from nano to macroscale
- Metal nanoparticles and biomaterials: The multipronged approach for potential diabetic wound therapy
- Review on resistive switching mechanisms of bio-organic thin film for non-volatile memory application
- Nanotechnology-enabled biomedical engineering: Current trends, future scopes, and perspectives
- Research progress on key problems of nanomaterials-modified geopolymer concrete
- Smart stimuli-responsive nanocarriers for the cancer therapy – nanomedicine
- An overview of methods for production and detection of silver nanoparticles, with emphasis on their fate and toxicological effects on human, soil, and aquatic environment
- Effects of chemical modification and nanotechnology on wood properties
- Mechanisms, influencing factors, and applications of electrohydrodynamic jet printing
- Application of antiviral materials in textiles: A review
- Phase transformation and strengthening mechanisms of nanostructured high-entropy alloys
- Research progress on individual effect of graphene oxide in cement-based materials and its synergistic effect with other nanomaterials
- Catalytic defense against fungal pathogens using nanozymes
- A mini-review of three-dimensional network topological structure nanocomposites: Preparation and mechanical properties
- Mechanical properties and structural health monitoring performance of carbon nanotube-modified FRP composites: A review
- Nano-scale delivery: A comprehensive review of nano-structured devices, preparative techniques, site-specificity designs, biomedical applications, commercial products, and references to safety, cellular uptake, and organ toxicity
- Effects of alloying, heat treatment and nanoreinforcement on mechanical properties and damping performances of Cu–Al-based alloys: A review
- Recent progress in the synthesis and applications of vertically aligned carbon nanotube materials
- Thermal conductivity and dynamic viscosity of mono and hybrid organic- and synthetic-based nanofluids: A critical review
- Recent advances in waste-recycled nanomaterials for biomedical applications: Waste-to-wealth
- Layup sequence and interfacial bonding of additively manufactured polymeric composite: A brief review
- Quantum dots synthetization and future prospect applications
- Approved and marketed nanoparticles for disease targeting and applications in COVID-19
- Strategies for improving rechargeable lithium-ion batteries: From active materials to CO2 emissions