Strong quadratic acousto-optic coupling in 1D multilayer phoxonic crystal cavity
-
Jun Jin


Abstract
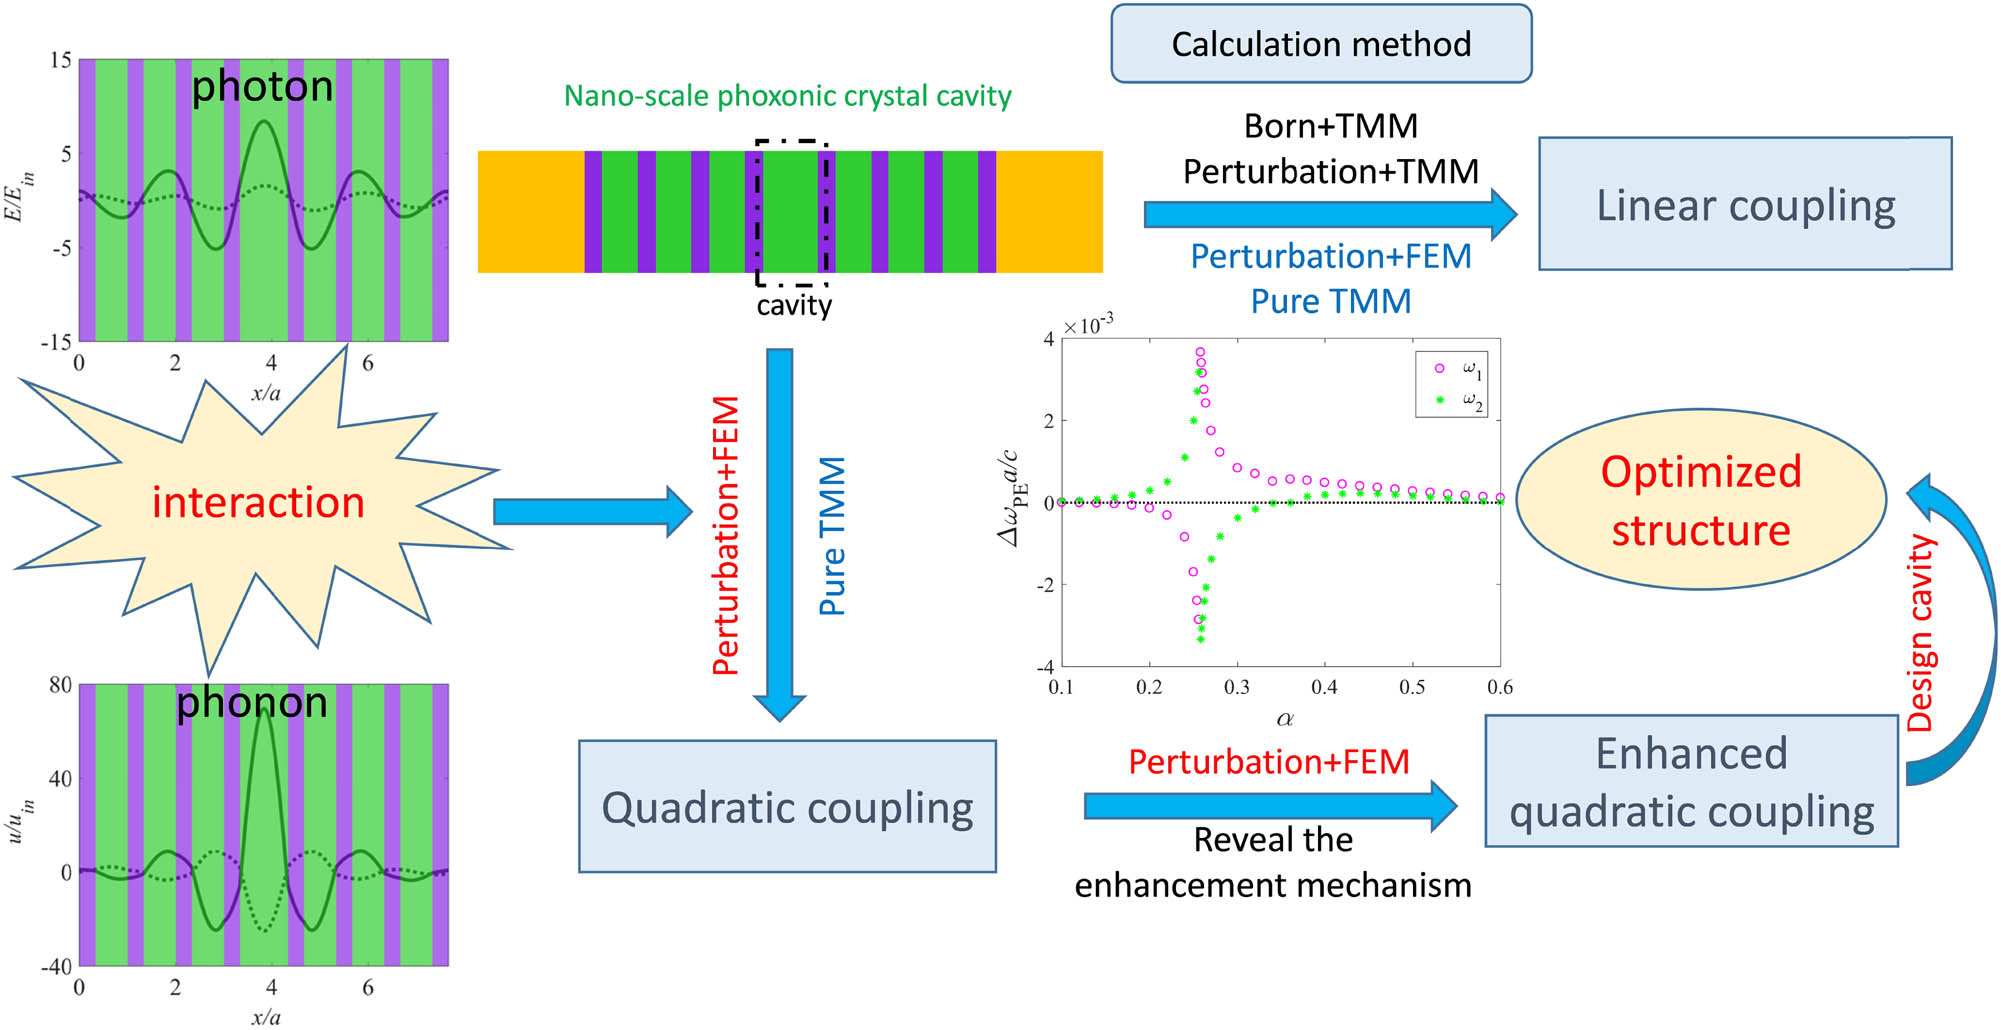
Four methods are applied to calculate the acousto-optic (AO) coupling in one-dimensional (1D) phoxonic crystal (PXC) cavity: transfer matrix method (TMM), finite element method (FEM), perturbation theory, and Born approximation. Two types of mechanisms, the photoelastic effect (PE) and the moving interface effect (MI), are investigated. Whether the AO coupling belongs to linear or quadratic, the results obtained by the perturbation theory are in good agreement with the numerical results. We show that the combination method of FEM and perturbation theory has some advantages over Born approximation. The dependence of linear and quadratic couplings on the symmetry of acoustic and optical modes has been discussed in detail. The linear coupling will vanish if the defect acoustic mode is even symmetry, but the quadratic effect may be enhanced. Based on second-order perturbation theory, the contribution of each optical eigenfrequency to quadratic coupling is clarified. Finally, the quadratic coupling is greatly enhanced by tuning the thickness of the defect layer, which is an order of magnitude larger than that of normal defect thickness. The enhancement mechanism of quadratic coupling is illustrated. The symmetry of the acoustic defect mode is transformed from odd to even, and two optical defect modes are modulated to be quasi-degenerated modes. This study opens up a possibility to achieve tunable phoxonic crystals on the basis of nonlinear AO effects.
Graphical abstract
1 Introduction
The acousto-optic (AO) effect, also known as optomechanics interaction, has been widely used to process light signals in homogeneous materials in recent years [1,2,3,4,5,6], for example, gravitational wave detection [2], tunable photonic crystals [3], and the optical bandpass switching [4]. The study concerning the AO effect begins with the opening of dual phononic and photonic band gaps [7]. Such simultaneous band gaps have been demonstrated and optimized in various PXCs [8,9,10,11,12,13,14,15,16,17]. Square, hexagonal (honeycomb), and triangular arrays are included, and large bandgaps can be obtained in square and hexagonal arrays but not for triangular arrays [9]. By introducing a defect into perfect periodic PXC, the PXC cavity can be obtained. In such a cavity, both mechanical energy and electromagnetic energy are localized [18]. From a quantum perspective, phonon and photon are highly confined in a very small volume, and interaction between phonon and photon can be boosted. Large per-photon force is realized in a nanometer-scale photonic crystal, making it possible for the exploration of cavity optomechanical regimes [19]. The experimental demonstration of optomechanical interaction between 200 THz photon and several GHz phonon provides new methods for stimulating optomechanical interactions in a chip-scale platform [20]. Etching air holes array into thin film of silicon, electromagnetically induced transparency and tunable optical delays are both demonstrated with optomechanics [21,22,23]. By utilizing optical radiation pressure, the nanomechanical mode of several GHz with the bath temperature of 20 K is cooled into its quantum mechanical ground state [24]. This enables the control of mesoscale mechanical oscillators in the quantum regime. The interaction of the acoustic wave and the optical wave in cavities has attracted strong attention. The design for quasi-2D PXC cavities is proposed in detail [25]. The AO coupling in L 1 cavity, including optical frequency modulation and the coupling rate, was studied by FEM [26,27,28,29]. Both slow photon and phonon modes are induced in nanobeam waveguide, and the AO couplings are significantly enhanced due to the slow group velocities [30]. The symmetry of the modes was found to play a dominant role in AO coupling [31,32,33,34]. The phononic and photonic modes highly overlap near the slot within a 2D air-slot PXC cavity, which greatly enhances the interface effect [35]. Considering the plasmonic behavior, AO coupling was studied in 2D PXC cavities with a line defect [36,37]. The development of AO coupling in recent years was studied [38]. A recent research showed an efficient AO modulation realized in an on-chip piezo-optomechanical transducer and addressed several challenges such as low optical quality factor [39]. Quadratic AO coupling has attracted more interests [40,41]. As we know earlier, quadratic AO coupling is proportional to the square of input displacement. Because the quadratic coupling is generally weak, its enhancement is very important for a PXC. Up to now, the quadratic coupling has just been enhanced in a 2D PXC by adjusting its cavity slot width approaching cavity mode linewidth [40,42].
Almost all of these studies were carried out by FEM. Although FEM is very convenient to calculate the AO coupling, it cannot provide intrinsic physical interpretation due to its purely numerical calculation. The analytical results of the AO coupling in 1D PXC cavity can be obtained by solving the wave equations of the low-dimensional system. Moreover, due to the similarity between the Maxwell equation and the Schrodinger equation, the solution method of the nonlinear Schrodinger equation can also be used to solve the nonlinear Maxwell equation. As an analytical method, Born approximation was first applied to analyze the reflection and transmission of light in multilayer media perturbed by acoustic waves, and the expression of reflection coefficient was derived by means of Green’s function [43]. In this method, the complex reflection coefficient perturbed by the acoustic wave was evaluated, and then, the perturbed optical frequency was obtained in the reflectivity spectrum. The linear and nonlinear AO couplings were analyzed by Born approximation [44,45]. Elastodynamic and electrodynamic layer multiple-scattering method was used for the calculation [46,47,48]. For linear coupling, the results obtained by the first-order Born approximation are consistent with numerical results when the input displacement is at the low level. Nevertheless, as the incident displacement increases, the results start to deviate from the numerical results. For its calculation on quadratic coupling, it has not been verified by the numerical method.
In this study, four methods are compared to find the most effective and accurate method. We combine the perturbation theory with TMM or FEM to analyze AO coupling. The strength of AO coupling is evaluated by the normalized optical frequency shift. The normalized frequency shift obtained by the perturbation theory, especially combined with FEM, is highly consistent with the numerical result, whether linear or quadratic coupling, even for large input displacement levels. Besides, we can also predict the direction of optical frequency drift from equations of the perturbation theory for both PE and MI contributions, which cannot be realized directly by Born approximation. Furthermore, the quadratic coupling is enhanced by adjusting the thickness of the defect layer. We focus on the enhancement mechanism of the quadratic coupling. The study provides an efficient method to evaluate AO coupling and the theoretical basis to design strong AO coupling devices, especially for quadratic AO coupling.
This study is organized as follows. In Section 2, we review the perturbation theory briefly and introduce the 1D PXC structure. In Section 3, four kinds of methods are applied to the calculation of linear and quadratic coupling, and the advantages and disadvantages of each method are then analyzed. In addition, some coupling laws are drawn for linear coupling and quadratic coupling. In Section 4, the enhancement mechanism of the quadratic coupling is further revealed. The structure with an optimal cavity is designed. The graphical abstract is also presented.
2 Perturbation theory
A 1D PXC has a multilayer structure of periodically arranging materials with different acoustic and optical properties as shown in Figure 1. The PXC cavity is formed by the introduction of a defect into the perfect periodic structure. Defect acoustic modes and optical modes are highly confined in a small volume. The interactions between these two modes are enhanced. When a resonant acoustic wave propagates in the structure, a strain field is induced, and the interfaces between different materials are also moved. The perturbation by the acoustic wave results in redistribution of the permittivity of the structure. Two mechanisms are responsible for the interactions between acoustic modes and optical modes: (1) photoelastic effect (PE), permittivity variation induced by the strain field; (2) moving interface effect (MI), permittivity variation caused by the moving of the interface. The variation of permittivity can be regarded as a quasi-static behavior since the speed of the light is several orders of magnitude larger than that of the sound. The permittivity variation is related to the amplitude of the acoustic wave. In the following, the displacement amplitude of the PXC is named as input displacement u in, which is a perfect candidate as the perturbation parameter. The permittivity variations caused by two effects in the 1D structure are reduced as follows:
where p 12(z) and S(z) denote the photoelastic coefficient and strain field of the material at point z, respectively. ε i the relative permittivity in the ith layer of the multilayer structure and u i is the displacement of ith interface.
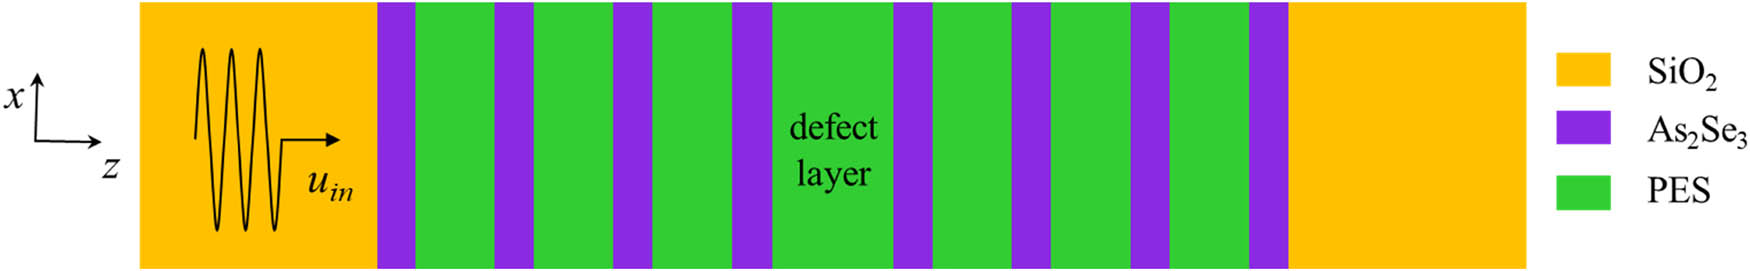
Schematic diagram of 1D multilayer PXC cavity.
The perturbation theory is a classic method to evaluate the effect of small variation in parameters on solutions to the equations. It is widely used in astrophysics, solid mechanics, and other disciplines. The Maxwell equations are written in a Dirac notation form:
where E and c denote electric field and velocity of light, respectively. Based on perturbation theory, and the orthogonality of the modes for the generalized Hermitian eigenproblem, the first-order correction is obtained as follows [49]:
where E (0) and ω (0) denote the unperturbed eigensolutions.
where L denotes the length of the structure. The term
If the structure is symmetric and the integrand is odd, linear coupling of the PE effect will vanish. For MI effect,
where N denotes the total number of interfaces between adjacent layers. The second-order correction is expressed as follows [50]:
where d j denotes the degree of the degeneracy mode.
3 Calculation methods on linear and quadratic couplings
We apply the perturbation theory to the same structure as previously investigated by Born approximation [44]. As shown in Figure 1, each lattice of the multilayer structure consists of As2Se3(a/3)/PES(2a/3) with the lattice constant a = 440 nm. As a resonant cavity, the defect layer is made of PES whose thickness is denoted by a d. a d is equal to a unless otherwise stated. The whole structure is embedded in a silica (SiO2) matrix. The structure can be formed in silicon-on-insulator (SOI). The acoustic and optical parameters of three kinds of materials are listed in Table 1.
Acoustic and optical physical parameters of As2Se3, PES, and SiO2
| Refractive index n | Photoelastic coefficient p 12 | Density ρ (kg/m3) | Longitudinal sound velocity c l (m/s) | |
|---|---|---|---|---|
| As2Se3 | 2.83 | 0.27 | 4,640 | 2,250 |
| PES | 1.55 | 0.30 | 1,370 | 2,260 |
| SiO2 | 1.44 | 0.27 | 2,200 | 5,965 |
The calculations on the unperturbed structure are carried out by TMM [51,52]. Figure 2(a) and (d) displays the dispersion curve of PTC and PNC, respectively. After the introduction of a defect into the perfect periodic PXC, two defect PTC modes and two defect PNC modes are localized in the defect of the PXC. Their dispersion curves appear in the green and yellow shadow regions of PTC and PNC band gaps, respectively. Normalized frequencies of the defect PNC modes are
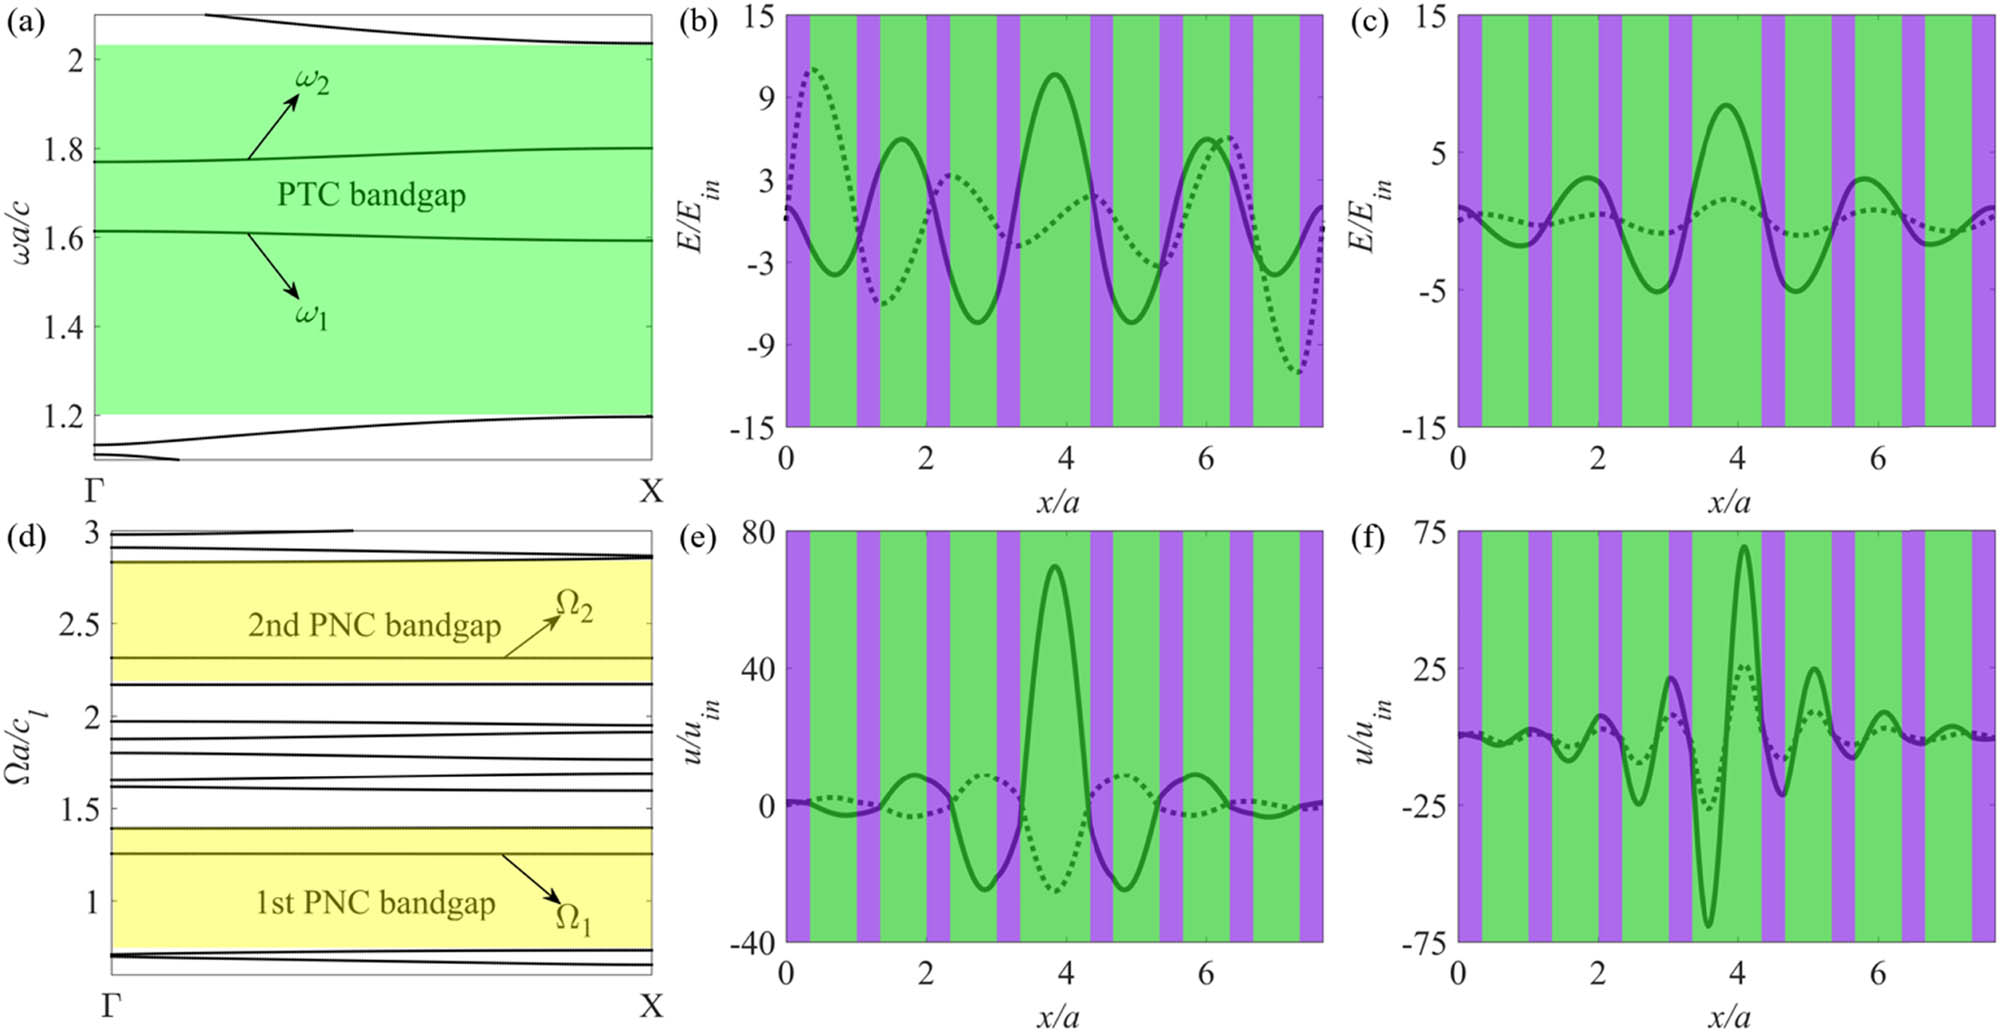
(a) Dispersion curve of PTC. Electric distribution of the defect PTC modes (b) ω
1
a/c = 1.61176 (because the imaginary part is much bigger than real part at this frequency, the imaginary is multiplied with 0.1 to show the real part), and (c) ω
2
a/c = 1.77056. (d) Dispersion curve of PNC. Displacement distribution of the defect PNC modes (e)
With four methods, the linear AO coupling is studied. The normal incident acoustic wave perturbation is applied to the cavity. We know the first-order correction for PE effect from equation (5), and the terms p 12(z), ε 2(z), and |E(z)|2 of the line integral all have even symmetry. The linear AO coupling, measured by the first-order correction Δω (1), will vanish if the strain field of the acoustic mode has odd symmetry, namely, displacement field has even symmetry, such as Ω 1 shown in Figure 2(e). The same conclusion can be drawn for MI contribution. Hence, we turn to Ω 2. For comparison, input displacement u in = 0.022 nm, which is similar to that mentioned in ref. [44]. Computed by four methods, the AO couplings between optical mode ω 2 and acoustic mode Ω 2 are listed in Table 2. Two analytical methods, the first-order Born approximation and the first-order perturbation theory, are carried out by TMM, which are denoted by “Born + TMM” and “Perturbation + TMM,” respectively. “Perturbation + FEM” means FEM based on the perturbation theory. “Pure FEM” represents numerical calculation by FEM. The results obtained by the first-order perturbation theory are highly consistent with the numerical results and are more accurate than that by the first-order Born approximation for both PE effect and MI effect.
Normalized frequency shift of optical mode ω
2 is continuously perturbed by the acoustic wave at the resonance frequency
| Methods |
|
|
|
|
|---|---|---|---|---|
| 1st Born + TMM | 1.77056 | 2.13 | 1.05 | 2.93 |
| 1st Perturbation + TMM | 1.77056 | 2.31 | 1.10 | 3.41 |
| 1st Perturbation + FEM | 1.77056 | 2.366 | 1.09 | 3.456 |
| Pure FEM | 1.77056 | 2.367 | 1.09 | 3.457 |
Figure 3 illustrates the variation of the normalized frequency shift of the optical modes ω
2 with the input displacement at
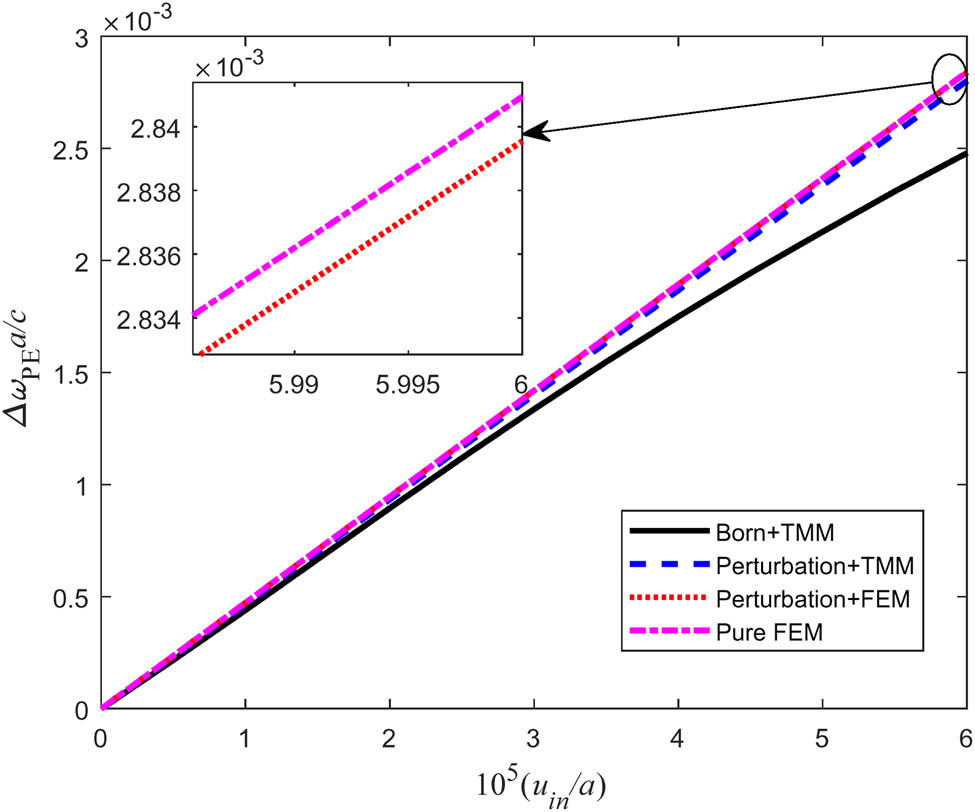
Normalized frequency shift of the optical modes ω
2
versus the input displacement at the acoustic normalized frequency of
Advantages and shortcomings of these four methods for evaluating AO coupling
| Methods | Advantages | Shortcomings |
|---|---|---|
| Born + TMM | Good physical interpretation | Only 1D structure |
| Low accuracy on nonlinear effect | ||
| Limit on small acoustic perturbation | ||
| Perturbation + TMM | High accuracy | Only 1D structure |
| Best physical interpretation | Only linear and quadratic effects | |
| Perturbation + FEM | Highest accuracy | Only linear and quadratic effects |
| Best physical interpretation | ||
| Pure FEM | Highest accuracy | Weak physical interpretation |
From equation (3), a positive frequency correction sign means an increase in the optical frequency, and a negative sign means the opposite. The frequency correction sign of the PE effect is further analyzed. From equation (5), ε 2(z) and |E(z)|2 are always positive. For the given materials, the sign of p 12(z) is known. Thus, only the strain field is unknown. The sign of the PE effect can be transformed by redistributing the photoelastic coefficient and strain field of the materials. As for the MI effect, the same methods can be applied as well.
Quadratic coupling is then investigated. The PNC defect mode Ω
2 has an odd symmetry, and the quadratic coupling is suppressed since the linear coupling is much stronger. Hence, we turn to the first PNC defect mode with the normalized frequency of
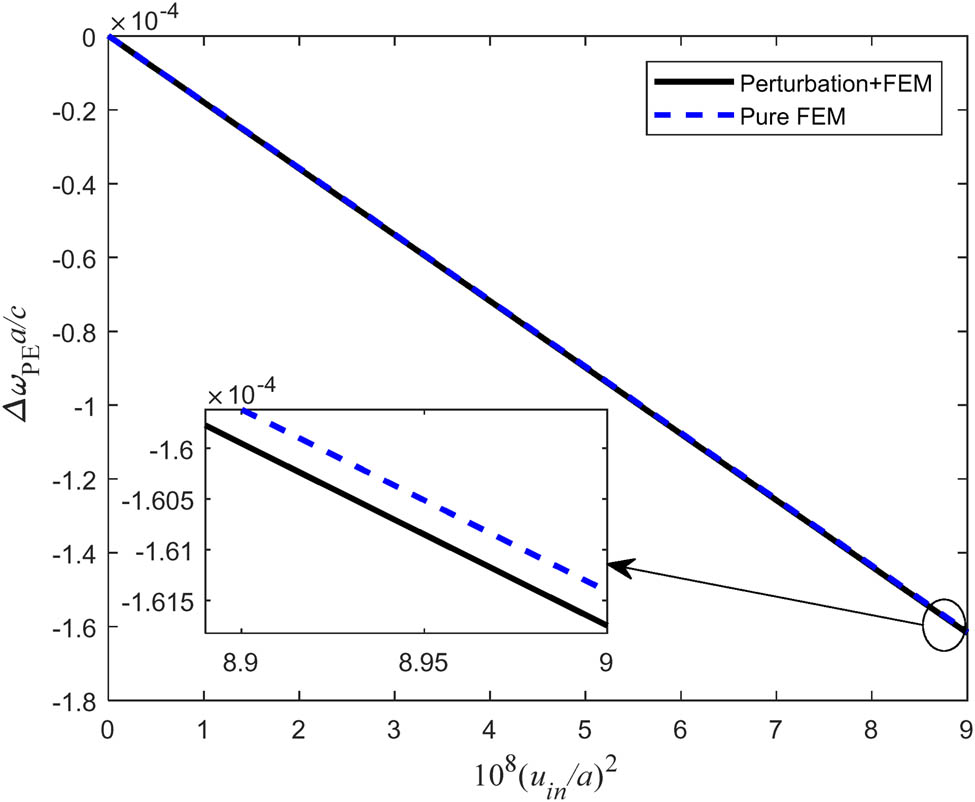
Normalized frequency shift of the optical modes ω
1 as a function of the acoustic input displacement level (u
in/a)2 at the acoustic normalized frequency of
It is noteworthy that quadratic coupling is not only affected by the symmetry of the acoustic mode but also determined by the symmetry of the optical mode of the eigenfrequency. Its contribution to quadratic coupling will vanish if the optical mode of one eigenfrequency has the same symmetry as the defect mode. Furthermore, the quadratic coupling will also be weakened if these eigenfrequencies are too far away from the defect optical resonance frequency, even if their modes and defect mode have different symmetries. Table 4 lists the linear and quadratic couplings depending on the symmetry of the PNC defect mode, the defect PTC mode, and the other PTC modes. It can be inferred that the quartic coupling will be dominant in the AO coupling if both linear and quadratic couplings vanish. In our case, the relatively large contribution on the quadratic coupling is −0.10, −0.21, −0.42, −0.60, and −0.20 (×10−4), which comes from the optical eigenfrequencies of 231, 272, 315, 356, and 401 THz, respectively. Finally, with the input displacement similar to that of ref. [44], the PE contribution is −1.6 × 10⁻⁴ and MI contribution is −3.0 × 10⁻⁵, which can be obtained by TMM or FEM. The superposition of both effects is −8.9 × 10⁻⁵, which is calculated by FEM. However, the superposition of both effects is about −0.001 in ref. [44]. It should be noted that for quadratic coupling, these two effects cannot be added linearly as their superposition.
Linear and quadratic couplings depend on symmetry of the defect PNC mode, the defect PTC mode, and the other PTC modes
| Defect PNC mode | Linear effect | Defect PTC mode | Other PTC mode | Quadratic effect |
|---|---|---|---|---|
| Odd | Strong | — | — | Suppressed |
| Even | Vanish | Even | Even | Vanish |
| Even | Vanish | Odd | Odd | Vanish |
4 Enhanced quadratic AO coupling
We further study the dependence of the symmetry of the PNC defect mode on the thickness a d of the defect layer. The symmetry remains the same when the thickness a d is an integer multiple of the lattice constant a, i.e., a d = ma (m is an arbitrary integer). However, the symmetry of these defect modes can be transformed if the thickness a d ≠ ma. Figure 5 displays the second PNC defect mode Ω′2 and two PTC defect modes when a d = 5a/4. The symmetry of the PNC defect mode transforms from odd (Figure 2(f)) to even (Figure 5(a)), while the PTC defect mode remains even symmetric. Certainly, when thickness a d increases from a to 5a/4, the normalized frequency of the second PNC mode increases from 2.3132 to 2.6522, but the normalized unperturbed frequency of the second PTC defect mode decreases from 1.77056 to 1.61596, while that of the first PTC defect mode remains unchanged. The mode profile of ω 2 and ω′ 2 has little difference. However, the normalized imaginary parts of ω 1 and ω′ 1 are significantly different, whose amplitude varies from 110 to 0.51.
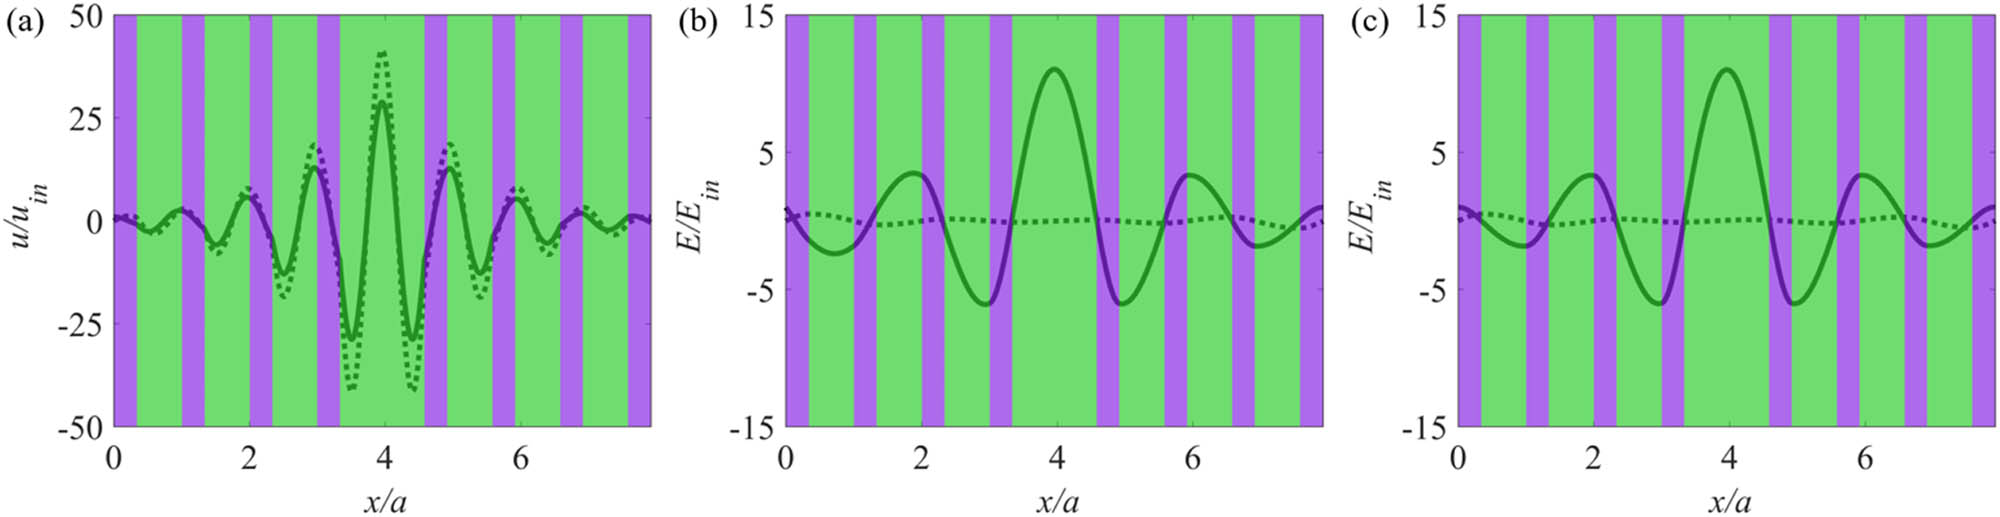
(a) Displacement field distribution of the defect PNC mode
We then focus on the dependence of the symmetry of the second PNC defect mode on the thickness of the defect layer. The relative thickness increment of the defect layer is defined as α = (a
d – a)/a
d. Results show that the symmetry of the PNC defect mode Ω
2 can be transformed from odd to even as long as 0 < α < 0.6. Nevertheless, when α is less than 0.1, the frequency of the defect mode moves toward the band gap edge and the corresponding displacement field is no longer localized in the cavity. Thus, the quadratic coupling is studied by setting α between 0.1 and 0.6, as shown in Figure 6(a). The input displacement is set as u
in = 0.132 nm. The normalized frequency shift of the quadratic coupling is obtained by “pure FEM” and “Perturbation + FEM,” respectively, where only the PE effect is taken into consideration. The result obtained by “Perturbation + FEM” agrees well with that done by “pure FEM” unless the frequencies of these two PTC defect modes are too close. Hence, it is still reasonable to reveal the enhancement mechanism of the quadratic coupling by the perturbation theory. The absolute values of the normalized frequency shift of these two PTC defect modes increase first and then decrease as α increases. The normalized frequency shift reaches its maximum value when α approaches 0.258 and then undergoes a leapfrog change. From Figure 6(b), as α increases, the frequency ω
1 remains the same, whereas the frequency ω
2 decreases all the time. The curves of ω
2 and ω
1 intersect when α is equal to 0.258, and these two PTC defect modes become quasi-degenerate modes. The AO coupling becomes stronger, which is not only quadratic but also contains higher-order nonlinear contributions. Here, the term
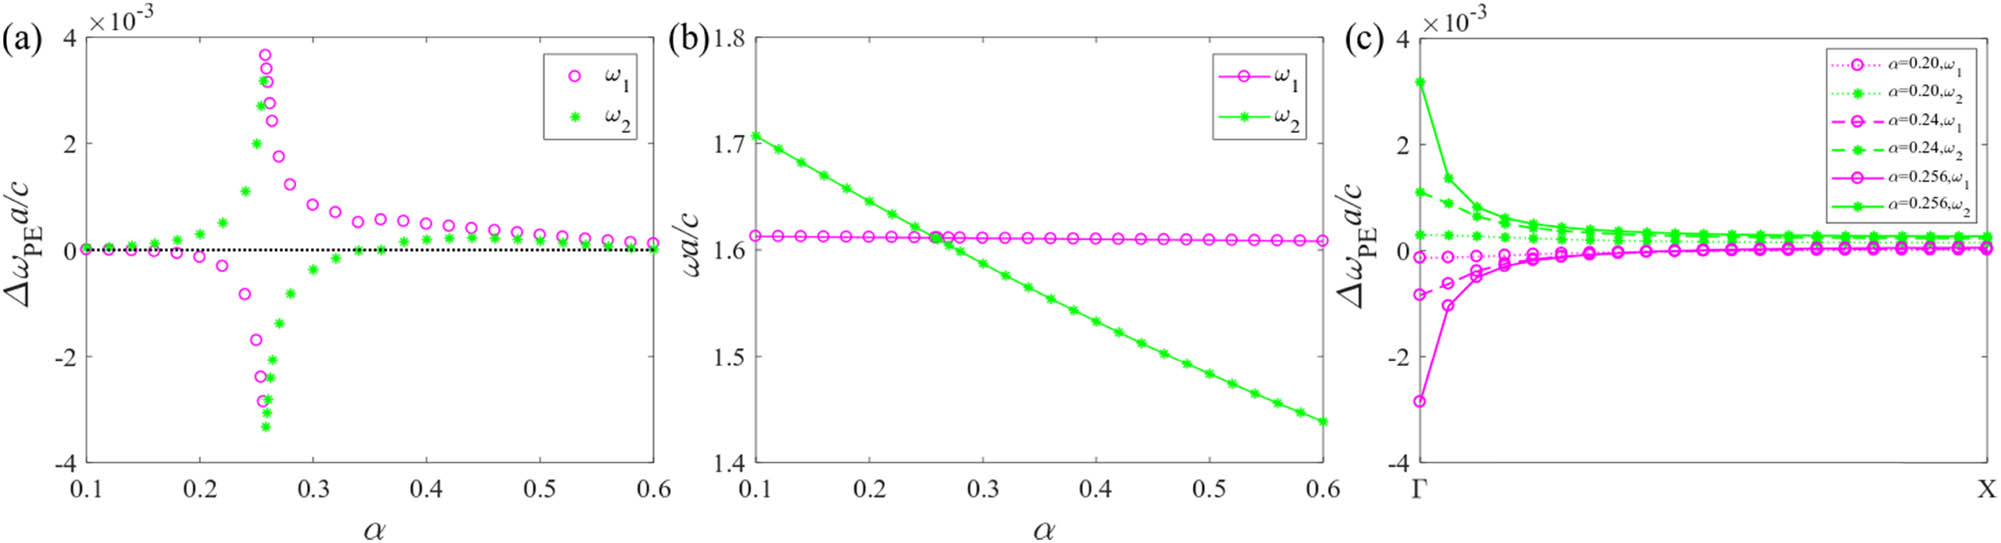
When two PTC defect modes are coupled with the second PNC defect mode, (a) their normalized frequency shift and (b) their unperturbed frequencies versus the relative increment α of the defect layer thickness, and (c) their normalized frequency shift versus the wavenumber in first irreducible Brillouin zone for different α.
5 Conclusions
We applied the perturbation theory to the calculation of the AO coupling in a multilayer PXC cavity. In the calculation of linear AO coupling, four methods were compared. We further focus on the quadratic coupling to find the coupling mechanism, especially for enhancing the coupling. The following conclusions can be drawn:
Among these four methods, “Perturbation + FEM” is the best choice for the AO coupling analysis, the physical interpretation, high-speed computing, and high precision.
As listed in Table 4, the linear, quadratic, or quartic coupling is dominant under specific acoustic and optical mode symmetry. Besides, these modes of symmetry can be changed by adjusting the thickness of the defect layer. Thus, the linear coupling can be transformed to quadratic coupling and vice versa.
Quadratic coupling is enhanced by tuning two defect photonic modes to be quasi-degenerate modes. When the two defect photonic modes become quasi-degenerate modes, the coupling strength is wavenumber dependent and reaches the maximum value in Γ point of the first irreducible Brillouin zone.
-
Funding information: The authors gratefully acknowledge the financial support of the National Natural Science Foundation of China (NSFC; 11872186) and Fundamental Research Funds for the Central Universities (HUST: 2016JCTD114).
-
Author contributions: All authors have accepted responsibility for the entire content of this manuscript and approved its submission.
-
Conflict of interest: The authors state no conflict of interest.
References
[1] Yariv A, Yeh P. Optical waves in crystals. New York: Wiley; 1984.Search in Google Scholar
[2] Kippenberg TJ, Vahala KJ. Cavity opto-mechanics. Opt Express. 2007;15(25):17172–205.10.1364/OE.15.017172Search in Google Scholar PubMed
[3] Ma H, Qu S, Xu Z. Photonic crystals based on acousto-optic effects. J Appl Phys. 2008;103(10):104904.10.1063/1.2924432Search in Google Scholar
[4] Berstermann T, Brüggemann C, Bombeck M, Akimov A, Yakovlev D, Kruse C, et al. Optical bandpass switching by modulating a microcavity using ultrafast acoustics. Phys Rev B Condens Matter Microelectron Eng. 2010;81(8):085316.10.1103/PhysRevB.81.085316Search in Google Scholar
[5] Sun Y, Peng Y, Zhou T, Liu H, Gao P. Study of the mechanical-electrical-magnetic properties and the microstructure of three-layered cement-based absorbing boards. Rev Adv Mater Sci. 2020;59(1):160–9.10.1515/rams-2020-0014Search in Google Scholar
[6] Lofy J, Gasparian V, Gevorkian Z, Jódar E. Faraday and Kerr effects in right and left-handed films and layered materials. Rev Adv Mater Sci. 2020;59(1):243–51.10.1515/rams-2020-0032Search in Google Scholar
[7] Bian Z, Yang S, Zhou X, Hui D. Band gap manipulation of viscoelastic functionally graded phononic crystal. Nanotechnol Rev. 2020;9(1):515–23.10.1515/ntrev-2020-0042Search in Google Scholar
[8] Maldovan M, Thomas EL. Simultaneous localization of photons and phonons in two-dimensional periodic structures. Appl Phys Lett. 2006;88(25):251907.10.1063/1.2216885Search in Google Scholar
[9] Mohammadi S, Eftekhar AA, Khelif A, Adibi A. Simultaneous two-dimensional phononic and photonic band gaps in opto-mechanical crystal slabs. Opt Express. 2010;18(9):9164–72.10.1364/OE.18.009164Search in Google Scholar PubMed
[10] Bria D, Assouar M, Oudich M, Pennec Y, Vasseur J, Djafari-Rouhani B. Opening of simultaneous photonic and phononic band gap in two-dimensional square lattice periodic structure. J Appl Phys. 2011;109(1):014507.10.1063/1.3530682Search in Google Scholar
[11] Pennec Y, Djafari-Rouhani B, El Boudouti E, Li C, El Hassouani Y, Vasseur J, et al. Simultaneous existence of phononic and photonic band gaps in periodic crystal slabs. Opt Express. 2010;18(13):14301–10.10.1364/OE.18.014301Search in Google Scholar PubMed
[12] Safavi-Naeini AH, Hill JT, Meenehan S, Chan J, Gröblacher S, Painter O. Two-dimensional phononic-photonic band gap optomechanical crystal cavity. Phys Rev Lett. 2014;112(15):153603.10.1103/PhysRevLett.112.153603Search in Google Scholar PubMed
[13] Dong HW, Wang YS, Ma TX, Su XX. Topology optimization of simultaneous photonic and phononic bandgaps and highly effective phoxonic cavity. J Optical Soc Am B. 2014;31(12):2946–55.10.1364/JOSAB.31.002946Search in Google Scholar
[14] Dong HW, Wang YS, Zhang C. Topology optimization of chiral phoxonic crystals with simultaneously large phononic and photonic bandgaps. IEEE Photonics J. 2017;9(2):1–16.10.1109/JPHOT.2017.2665700Search in Google Scholar
[15] Sadat-Saleh S, Benchabane S, Baida FI, Bernal M-P, Laude V. Tailoring simultaneous photonic and phononic band gaps. J Appl Phys. 2009;106(7):074912.10.1063/1.3243276Search in Google Scholar
[16] Tang Z, Jiang Z, Chen T, Lei D, Yan W, Qiu F, et al. Simultaneous microwave photonic and phononic band gaps in piezoelectric–piezomagnetic superlattices with three types of domains in a unit cell. Phys Lett B. 2016;380(20):1757–62.10.1016/j.physleta.2016.02.037Search in Google Scholar
[17] Laude V, Beugnot J-C, Benchabane S, Pennec Y, Djafari-Rouhani B, Papanikolaou N, et al. Simultaneous guidance of slow photons and slow acoustic phonons in silicon phoxonic crystal slabs. Opt Express. 2011;19(10):9690–8.10.1364/OE.19.009690Search in Google Scholar PubMed
[18] Hasan T. Mechanical properties of nanomaterials: a review. Nanotechnol Rev. 2020;9(1):259–73.10.1515/ntrev-2020-0021Search in Google Scholar
[19] Eichenfield M, Camacho R, Chan J, Vahala KJ, Painter O. A picogram-and nanometre-scale photonic-crystal optomechanical cavity. Nature. 2009;459(7246):550–5.10.1038/nature08061Search in Google Scholar PubMed
[20] Eichenfield M, Chan J, Camacho RM, Vahala KJ, Painter O. Optomechanical crystals. Nature. 2009;462(7269):78.10.1038/nature08524Search in Google Scholar PubMed
[21] Weis S, Rivière R, Deléglise S, Gavartin E, Arcizet O, Schliesser A, et al. Optomechanically induced transparency. Science. 2010;330(6010):1520–3.10.1126/science.1195596Search in Google Scholar PubMed
[22] Safavi-Naeini AH, Alegre TM, Chan J, Eichenfield M, Winger M, Lin Q, et al. Electromagnetically induced transparency and slow light with optomechanics. Nature. 2011;472(7341):69–73.10.1038/nature09933Search in Google Scholar PubMed
[23] Chang D, Safavi-Naeini AH, Hafezi M, Painter O. Slowing and stopping light using an optomechanical crystal array. N J Phys. 2011;13(2):023003.10.1088/1367-2630/13/2/023003Search in Google Scholar
[24] Chan J, Alegre TM, Safavi-Naeini AH, Hill JT, Krause A, Gröblacher S, et al. Laser cooling of a nanomechanical oscillator into its quantum ground state. Nature. 2011;478(7367):89–92.10.1038/nature10461Search in Google Scholar PubMed
[25] Safavi-Naeini AH, Painter O. Design of optomechanical cavities and waveguides on a simultaneous bandgap phononic-photonic crystal slab. Opt Express. 2010;18(14):14926–43.10.1364/OE.18.014926Search in Google Scholar PubMed
[26] El-Jallal S, Oudich M, Pennec Y, Djafari-Rouhani B, Makhoute A, Rolland Q, et al. Optomechanical interactions in two-dimensional Si and GaAs phoXonic cavities. J Phys Condens Matter. 2013;26(1):015005.10.1088/0953-8984/26/1/015005Search in Google Scholar PubMed
[27] Rolland Q, Oudich M, El-Jallal S, Dupont S, Pennec Y, Gazalet J, et al. Acousto-optic couplings in two-dimensional phoxonic crystal cavities. Appl Phys Lett. 2012;101(6):061109.10.1063/1.4744539Search in Google Scholar
[28] Djafari-Rouhani B, El-Jallal S, Pennec Y. Phoxonic crystals and cavity optomechanics. CR Phys. 2016;17(5):555–64.10.1016/j.crhy.2016.02.001Search in Google Scholar
[29] El-Jallal S, Oudich M, Pennec Y, Djafari-Rouhani B, Laude V, Beugnot J, et al. Analysis of optomechanical coupling in two-dimensional square lattice phoxonic crystal slab cavities. Phys Rev B. 2013;88(20):205410.10.1103/PhysRevB.88.205410Search in Google Scholar
[30] Hsiao FL, Hsieh HY, Hsieh CY, Chiu CC. Acousto–optical interaction in fishbone-like one-dimensional phoxonic crystal nanobeam. Appl Phys A. 2014;116(3):873–8.10.1007/s00339-014-8456-6Search in Google Scholar
[31] Chiu CC, Chen WM, Sung KW, Hsiao FL. High-efficiency acousto-optic coupling in phoxonic resonator based on silicon fishbone nanobeam cavity. Opt Express. 2017;25(6):6076–91.10.1364/OE.25.006076Search in Google Scholar PubMed
[32] Hsiao FL, Hsieh CY, Hsieh HY, Chiu CC. High-efficiency acousto-optical interaction in phoxonic nanobeam waveguide. Appl Phys Lett. 2012;100(17):171103.10.1063/1.4705295Search in Google Scholar
[33] Eichenfield M, Chan J, Safavi-Naeini AH, Vahala KJ, Painter O. Modeling dispersive coupling and losses of localized optical and mechanical modes in optomechanical crystals. Opt Express. 2009;17(22):20078–98.10.1364/OE.17.020078Search in Google Scholar PubMed
[34] Chandel VS, Wang G, Talha M. Advances in modelling and analysis of nano structures: a review. Nanotechnol Rev. 2020;9(1):230–58.10.1515/ntrev-2020-0020Search in Google Scholar
[35] Ma TX, Wang YS, Zhang C. Enhancement of acousto-optical coupling in two-dimensional air-slot phoxonic crystal cavities by utilizing surface acoustic waves. Phys Lett B. 2017;381(4):323–9.10.1016/j.physleta.2016.10.052Search in Google Scholar
[36] Lin TR, Lin CH, Hsu JC. Enhanced acousto-optic interaction in two-dimensional phoxonic crystals with a line defect. J Appl Phys. 2013;113(5):053508.10.1063/1.4790288Search in Google Scholar
[37] Hsu JC, Lu TY, Lin TR. Acousto-optic coupling in phoxonic crystal nanobeam cavities with plasmonic behavior. Opt Express. 2015;23(20):25814–26.10.1364/OE.23.025814Search in Google Scholar PubMed
[38] Pennec Y, Laude V, Papanikolaou N, Djafari-Rouhani B, Oudich M, El Jallal S, et al. Modeling light-sound interaction in nanoscale cavities and waveguides. Nanophotonics. 2014;3(6):413–40.10.1515/nanoph-2014-0004Search in Google Scholar
[39] Jiang W, Sarabalis CJ, Dahmani YD, Patel RN, Mayor FM, McKenna TP, et al. Efficient bidirectional piezo-optomechanical transduction between microwave and optical frequency. Nat Commun. 2020;11(1):1–7.10.1364/CLEO_AT.2020.AF3K.4Search in Google Scholar
[40] Kalaee M, Paraiso TK, Pfeifer H, Painter O. Design of a quasi-2D photonic crystal optomechanical cavity with tunable, large x 2-coupling. Opt Express. 2016;24(19):21308–28.10.1364/OE.24.021308Search in Google Scholar PubMed
[41] Kaviani H, Healey C, Wu M, Ghobadi R, Hryciw A, Barclay PE. Nonlinear optomechanical paddle nanocavities. Optica. 2015;2(3):271–4.10.1109/PN.2015.7292526Search in Google Scholar
[42] Paraïso TK, Kalaee M, Zang L, Pfeifer H, Marquardt F, Painter O. Position-squared coupling in a tunable photonic crystal optomechanical cavity. Phys Rev X. 2015;5(4):041024.10.1103/PhysRevX.5.041024Search in Google Scholar
[43] Matsuda O, Wright O. Reflection and transmission of light in multilayers perturbed by picosecond strain pulse propagation. J Opt Soc Am B. 2002;19(12):3028–41.10.1364/JOSAB.19.003028Search in Google Scholar
[44] Almpanis E, Papanikolaou N, Stefanou N. Breakdown of the linear acousto-optic interaction regime in phoxonic cavities. Opt Express. 2014;22(26):31595–607.10.1364/OE.22.031595Search in Google Scholar
[45] Psarobas IE, Papanikolaou N, Stefanou N, Djafari-Rouhani B, Bonello B, Laude V. Enhanced acousto-optic interactions in a one-dimensional phoxonic cavity. Phys Rev B. 2010;82(17):174303.10.1103/PhysRevB.82.174303Search in Google Scholar
[46] Stefanou N, Yannopapas V, Modinos A. Heterostructures of photonic crystals: frequency bands and transmission coefficients. Comput Phys Commun. 1998;113(1):49–77.10.1016/S0010-4655(98)00060-5Search in Google Scholar
[47] Stefanou N, Yannopapas V, Modinos A. MULTEM 2: a new version of the program for transmission and band-structure calculations of photonic crystals. Comput Phys Commun. 2000;132(1–2):189–96.10.1016/S0010-4655(00)00131-4Search in Google Scholar
[48] Sainidou R, Stefanou N, Psarobas I, Modinos A. A layer-multiple-scattering method for phononic crystals and heterostructures of such. Comput Phys Commun. 2005;166(3):197–240.10.1016/j.cpc.2004.11.004Search in Google Scholar
[49] Johnson SG, Ibanescu M, Skorobogatiy M, Weisberg O, Joannopoulos J, Fink Y. Perturbation theory for Maxwell’s equations with shifting material boundaries. Phys Rev E. 2002;65(6):066611.10.1103/PhysRevE.65.066611Search in Google Scholar PubMed
[50] El-Soussi A, Gazalet J, Dupont S, Kastelik J. Evaluation of second order optomechanical coupling strength in photonic crystal cavities including the case of degenerated modes. J Opt. 2019;21(4):045103.10.1088/2040-8986/ab0400Search in Google Scholar
[51] Mizuno S, Tamura S. Theory of acoustic-phonon transmission in finite-size superlattice systems. Phys Rev B. 1992;45(2):734.10.1103/PhysRevB.45.734Search in Google Scholar
[52] Yariv A, Yeh P. Photonics: optical electronics in modern communications. New York: Oxford university press; 2007.Search in Google Scholar
© 2021 Jun Jin et al., published by De Gruyter
This work is licensed under the Creative Commons Attribution 4.0 International License.
Articles in the same Issue
- Research Articles
- Improved impedance matching by multi-componential metal-hybridized rGO toward high performance of microwave absorption
- Pure-silk fibroin hydrogel with stable aligned micropattern toward peripheral nerve regeneration
- Effective ion pathways and 3D conductive carbon networks in bentonite host enable stable and high-rate lithium–sulfur batteries
- Fabrication and characterization of 3D-printed gellan gum/starch composite scaffold for Schwann cells growth
- Synergistic strengthening mechanism of copper matrix composite reinforced with nano-Al2O3 particles and micro-SiC whiskers
- Deformation mechanisms and plasticity of ultrafine-grained Al under complex stress state revealed by digital image correlation technique
- On the deformation-induced grain rotations in gradient nano-grained copper based on molecular dynamics simulations
- Removal of sulfate from aqueous solution using Mg–Al nano-layered double hydroxides synthesized under different dual solvent systems
- Microwave-assisted sol–gel synthesis of TiO2-mixed metal oxide nanocatalyst for degradation of organic pollutant
- Electrophoretic deposition of graphene on basalt fiber for composite applications
- Polyphenylene sulfide-coated wrench composites by nanopinning effect
- Thermal conductivity and thermoelectric properties in 3D macroscopic pure carbon nanotube materials
- An effective thermal conductivity and thermomechanical homogenization scheme for a multiscale Nb3Sn filaments
- Friction stir spot welding of AA5052 with additional carbon fiber-reinforced polymer composite interlayer
- Improvement of long-term cycling performance of high-nickel cathode materials by ZnO coating
- Quantum effects of gas flow in nanochannels
- An approach to effectively improve the interfacial bonding of nano-perfused composites by in situ growth of CNTs
- Effects of nano-modified polymer cement-based materials on the bending behavior of repaired concrete beams
- Effects of the combined usage of nanomaterials and steel fibres on the workability, compressive strength, and microstructure of ultra-high performance concrete
- One-pot solvothermal synthesis and characterization of highly stable nickel nanoparticles
- Comparative study on mechanisms for improving mechanical properties and microstructure of cement paste modified by different types of nanomaterials
- Effect of in situ graphene-doped nano-CeO2 on microstructure and electrical contact properties of Cu30Cr10W contacts
- The experimental study of CFRP interlayer of dissimilar joint AA7075-T651/Ti-6Al-4V alloys by friction stir spot welding on mechanical and microstructural properties
- Vibration analysis of a sandwich cylindrical shell in hygrothermal environment
- Water barrier and mechanical properties of sugar palm crystalline nanocellulose reinforced thermoplastic sugar palm starch (TPS)/poly(lactic acid) (PLA) blend bionanocomposites
- Strong quadratic acousto-optic coupling in 1D multilayer phoxonic crystal cavity
- Three-dimensional shape analysis of peripapillary retinal pigment epithelium-basement membrane layer based on OCT radial images
- Solvent regulation synthesis of single-component white emission carbon quantum dots for white light-emitting diodes
- Xanthate-modified nanoTiO2 as a novel vulcanization accelerator enhancing mechanical and antibacterial properties of natural rubber
- Effect of steel fiber on impact resistance and durability of concrete containing nano-SiO2
- Ultrasound-enhanced biosynthesis of uniform ZnO nanorice using Swietenia macrophylla seed extract and its in vitro anticancer activity
- Temperature dependence of hardness prediction for high-temperature structural ceramics and their composites
- Study on the frequency of acoustic emission signal during crystal growth of salicylic acid
- Controllable modification of helical carbon nanotubes for high-performance microwave absorption
- Role of dry ozonization of basalt fibers on interfacial properties and fracture toughness of epoxy matrix composites
- Nanosystem’s density functional theory study of the chlorine adsorption on the Fe(100) surface
- A rapid nanobiosensing platform based on herceptin-conjugated graphene for ultrasensitive detection of circulating tumor cells in early breast cancer
- Improving flexural strength of UHPC with sustainably synthesized graphene oxide
- The role of graphene/graphene oxide in cement hydration
- Structural characterization of microcrystalline and nanocrystalline cellulose from Ananas comosus L. leaves: Cytocompatibility and molecular docking studies
- Evaluation of the nanostructure of calcium silicate hydrate based on atomic force microscopy-infrared spectroscopy experiments
- Combined effects of nano-silica and silica fume on the mechanical behavior of recycled aggregate concrete
- Safety study of malapposition of the bio-corrodible nitrided iron stent in vivo
- Triethanolamine interface modification of crystallized ZnO nanospheres enabling fast photocatalytic hazard-free treatment of Cr(vi) ions
- Novel electrodes for precise and accurate droplet dispensing and splitting in digital microfluidics
- Construction of Chi(Zn/BMP2)/HA composite coating on AZ31B magnesium alloy surface to improve the corrosion resistance and biocompatibility
- Experimental and multiscale numerical investigations on low-velocity impact responses of syntactic foam composites reinforced with modified MWCNTs
- Comprehensive performance analysis and optimal design of smart light pole for cooperative vehicle infrastructure system
- Room temperature growth of ZnO with highly active exposed facets for photocatalytic application
- Influences of poling temperature and elongation ratio on PVDF-HFP piezoelectric films
- Large strain hardening of magnesium containing in situ nanoparticles
- Super stable water-based magnetic fluid as a dual-mode contrast agent
- Photocatalytic activity of biogenic zinc oxide nanoparticles: In vitro antimicrobial, biocompatibility, and molecular docking studies
- Hygrothermal environment effect on the critical buckling load of FGP microbeams with initial curvature integrated by CNT-reinforced skins considering the influence of thickness stretching
- Thermal aging behavior characteristics of asphalt binder modified by nano-stabilizer based on DSR and AFM
- Building effective core/shell polymer nanoparticles for epoxy composite toughening based on Hansen solubility parameters
- Structural characterization and nanoscale strain field analysis of α/β interface layer of a near α titanium alloy
- Optimization of thermal and hydrophobic properties of GO-doped epoxy nanocomposite coatings
- The properties of nano-CaCO3/nano-ZnO/SBR composite-modified asphalt
- Three-dimensional metallic carbon allotropes with superhardness
- Physical stability and rheological behavior of Pickering emulsions stabilized by protein–polysaccharide hybrid nanoconjugates
- Optimization of volume fraction and microstructure evolution during thermal deformation of nano-SiCp/Al–7Si composites
- Phase analysis and corrosion behavior of brazing Cu/Al dissimilar metal joint with BAl88Si filler metal
- High-efficiency nano polishing of steel materials
- On the rheological properties of multi-walled carbon nano-polyvinylpyrrolidone/silicon-based shear thickening fluid
- Fabrication of Ag/ZnO hollow nanospheres and cubic TiO2/ZnO heterojunction photocatalysts for RhB degradation
- Fabrication and properties of PLA/nano-HA composite scaffolds with balanced mechanical properties and biological functions for bone tissue engineering application
- Investigation of the early-age performance and microstructure of nano-C–S–H blended cement-based materials
- Reduced graphene oxide coating on basalt fabric using electrophoretic deposition and its role in the mechanical and tribological performance of epoxy/basalt fiber composites
- Effect of nano-silica as cementitious materials-reducing admixtures on the workability, mechanical properties and durability of concrete
- Machine-learning-assisted microstructure–property linkages of carbon nanotube-reinforced aluminum matrix nanocomposites produced by laser powder bed fusion
- Physical, thermal, and mechanical properties of highly porous polylactic acid/cellulose nanofibre scaffolds prepared by salt leaching technique
- A comparative study on characterizations and synthesis of pure lead sulfide (PbS) and Ag-doped PbS for photovoltaic applications
- Clean preparation of washable antibacterial polyester fibers by high temperature and high pressure hydrothermal self-assembly
- Al 5251-based hybrid nanocomposite by FSP reinforced with graphene nanoplates and boron nitride nanoparticles: Microstructure, wear, and mechanical characterization
- Interlaminar fracture toughness properties of hybrid glass fiber-reinforced composite interlayered with carbon nanotube using electrospray deposition
- Microstructure and life prediction model of steel slag concrete under freezing-thawing environment
- Synthesis of biogenic silver nanoparticles from the seed coat waste of pistachio (Pistacia vera) and their effect on the growth of eggplant
- Study on adaptability of rheological index of nano-PUA-modified asphalt based on geometric parameters of parallel plate
- Preparation and adsorption properties of nano-graphene oxide/tourmaline composites
- A study on interfacial behaviors of epoxy/graphene oxide derived from pitch-based graphite fibers
- Multiresponsive carboxylated graphene oxide-grafted aptamer as a multifunctional nanocarrier for targeted delivery of chemotherapeutics and bioactive compounds in cancer therapy
- Piezoresistive/piezoelectric intrinsic sensing properties of carbon nanotube cement-based smart composite and its electromechanical sensing mechanisms: A review
- Smart stimuli-responsive biofunctionalized niosomal nanocarriers for programmed release of bioactive compounds into cancer cells in vitro and in vivo
- Photoremediation of methylene blue by biosynthesized ZnO/Fe3O4 nanocomposites using Callistemon viminalis leaves aqueous extract: A comparative study
- Study of gold nanoparticles’ preparation through ultrasonic spray pyrolysis and lyophilisation for possible use as markers in LFIA tests
- Review Articles
- Advance on the dispersion treatment of graphene oxide and the graphene oxide modified cement-based materials
- Development of ionic liquid-based electroactive polymer composites using nanotechnology
- Nanostructured multifunctional electrocatalysts for efficient energy conversion systems: Recent perspectives
- Recent advances on the fabrication methods of nanocomposite yarn-based strain sensor
- Review on nanocomposites based on aerospace applications
- Overview of nanocellulose as additives in paper processing and paper products
- The frontiers of functionalized graphene-based nanocomposites as chemical sensors
- Material advancement in tissue-engineered nerve conduit
- Carbon nanostructure-based superhydrophobic surfaces and coatings
- Functionalized graphene-based nanocomposites for smart optoelectronic applications
- Interfacial technology for enhancement in steel fiber reinforced cementitious composite from nano to macroscale
- Metal nanoparticles and biomaterials: The multipronged approach for potential diabetic wound therapy
- Review on resistive switching mechanisms of bio-organic thin film for non-volatile memory application
- Nanotechnology-enabled biomedical engineering: Current trends, future scopes, and perspectives
- Research progress on key problems of nanomaterials-modified geopolymer concrete
- Smart stimuli-responsive nanocarriers for the cancer therapy – nanomedicine
- An overview of methods for production and detection of silver nanoparticles, with emphasis on their fate and toxicological effects on human, soil, and aquatic environment
- Effects of chemical modification and nanotechnology on wood properties
- Mechanisms, influencing factors, and applications of electrohydrodynamic jet printing
- Application of antiviral materials in textiles: A review
- Phase transformation and strengthening mechanisms of nanostructured high-entropy alloys
- Research progress on individual effect of graphene oxide in cement-based materials and its synergistic effect with other nanomaterials
- Catalytic defense against fungal pathogens using nanozymes
- A mini-review of three-dimensional network topological structure nanocomposites: Preparation and mechanical properties
- Mechanical properties and structural health monitoring performance of carbon nanotube-modified FRP composites: A review
- Nano-scale delivery: A comprehensive review of nano-structured devices, preparative techniques, site-specificity designs, biomedical applications, commercial products, and references to safety, cellular uptake, and organ toxicity
- Effects of alloying, heat treatment and nanoreinforcement on mechanical properties and damping performances of Cu–Al-based alloys: A review
- Recent progress in the synthesis and applications of vertically aligned carbon nanotube materials
- Thermal conductivity and dynamic viscosity of mono and hybrid organic- and synthetic-based nanofluids: A critical review
- Recent advances in waste-recycled nanomaterials for biomedical applications: Waste-to-wealth
- Layup sequence and interfacial bonding of additively manufactured polymeric composite: A brief review
- Quantum dots synthetization and future prospect applications
- Approved and marketed nanoparticles for disease targeting and applications in COVID-19
- Strategies for improving rechargeable lithium-ion batteries: From active materials to CO2 emissions