Effect of tool traverse speed on joint line remnant and mechanical properties of friction stir welded 2195-T8 Al–Li alloy joints
-
Qingsong Zhang
 ,
Fengbo Dong
,
Fengbo Dong

Abstract
AA2195-T8 Al–Li alloy plates were welded by friction stir welding (FSW) at tool rotational speed of 1,000 rpm and tool traverse speeds (TS) of 100–400 mm·min−1 under three types of butting surface conditions, i.e., (1) without butting surface treatment, (2) butting surface milled, and (3) bead-on-plate welding. The effect of welding heat input and butting surface condition on joint line remnant (JLR) and mechanical properties of friction stir welded 2195-T8 Al–Li alloy was investigated comprehensively. In the stir zone of 2195-T8 FSW joints, there exists JLR composed of alumina-particle arrays and microcracks generated from the initial butting surface, and the morphology of JLR would evolve from smooth to serrate as TS increases. Moreover, as TS increases (i.e., the welding heat input decreases), JLR deteriorates the tensile strength of the 2195-T8 FSW joints, with joints prematurely fracturing along JLR. The fracture mode of 2195-T8 FSW joints was considered to be determined by the lower one between strength of JLR (S JLR) and strength of the lowest hardness zone (S LHZ), and JLR tends to be the fracture path at lower welding heat input. Furthermore, butting surface treatment (milling off oxide layer prior to welding) was found to be able to make the JLR in the 2195-T8 FSW joints less distinct and thus improve S JLR, while fracture along JLR could not be avoided.
1 Introduction
2195 Al–Li alloy is a new generation of aerospace materials, which has obtained more and more applications in the aerospace industry due to its low density and good mechanical properties such as high strength, good ambient, and cryogenic mechanical properties, high corrosion resistance, and good plastic formability. The previous study has shown that each 1% increment of lithium addition to an aluminum alloy decreases the density by about 3% and increases the elastic modulus (stiffness) by 6% [1,2]. However, it is difficult to obtain a high-integrity joint by traditional fusion welding, which can cause critical welding problems such as hot cracking, welding porosity, and evaporation loss of Li [3,4,5]. Friction stir welding (FSW) developed by the Welding Institute in 1991 is a novel and efficient solid-state joining process, which is an ideal technology for the joining of Al alloys [6,7]. Compared with fusion welding processes, the relatively lower heat input during FSW would not result in melting of Al alloy sheets, which could avoid not only the appearance of hot cracking and porosity but also the loss of Li element in Al–Li alloy joints; thus, better mechanical property of the joints could be obtained [8,9,10].
However, despite the above-mentioned unique advantages, FSW of Al alloys would also induce some defects different from fusion welding. Previous studies have observed the existence of joint line remnant (JLR) in the stir zone, which are essentially the distribution of residual oxide film from original butting surface [11,12,13,14,15,16,17,18]. From the cross-section of joints, JLR commonly appears as a discontinuous twisted line consisting of Al2O3 particles, and thus, it is also called as a zigzag line or lazy S [13,15,16]. Moreover, at the bottom of the stir zone, JLR is often observed as a continuous oxide film which is also called as kissing bond [11,12,17,18].
The effect of JLR on the mechanical properties of joints is undoubtedly a very important issue. Niu et al. [19] found that the tensile properties of AA2024 joints depend on the amount and distribution of the residual A12O3 particles, and the maximum degradation in tensile strength was 159 MPa. Chen et al. [13] found that the JLR in the 5456 Al alloy joint is distributed at the fracture surface of the tensile sample, and A12O3 particles are actually the major cause of joint failure, resulting in a dramatically decreased ductility. Chen et al. [20] found that the tensile strength of AA2219-T62 joints with JLR inside the stir zone only reached about 60% of a sound joint, and the fractography analysis of broken tensile specimens exposed a series of severe “scalloping” correlated with JLR flaw. Tao’s study [21] revealed that JLR in Al–Mg–Sc joints tended to become crack initiation sources and exhibited poor ductility during tension, but did not deteriorate the tensile strength of joints. However, Ren et al. [22] reported that JLR did not show up and not affect tensile properties and fracture behavior of 7075Al-T651 joints under as-welded conditions. Similarly, Liu et al. [15] reported that JLR did not affect the tensile properties of the as-welded 2219-O Al alloy joints even if it exists. Furthermore, some research studies [14,23,24,25] suggested that JLR would also make an adverse impact on fatigue properties of joints. Therefore, the effects of JLR on the mechanical properties of joints are complicated and sensitive to the composition and heat treatment state of Al alloys.
On the other hand, the welding heat input which depends on the tool rotation speed and welding speed was found to be influential on the JLR feature and thus how JLR affects the mechanical properties of joints [16,26,27]. Sharma et al. [26] reported that JLR could be seen under lower heat input (635 rpm–190 mm·min−1, 540 rpm–75 mm·min−1 and 410 rpm–75 mm·min−1) during FSW of AA7039, and JLR deteriorated mechanical properties of joints under 635 rpm–190 mm·min−1 and 410 rpm–75 mm·min−1 but not under 540 rpm–75 mm·min−1. Zhou et al. [27] found that the length of the kissing bond in AA5083-H112 joints has a reasonably linear relation with the heat input, and with the increase in the length of the kissing bond, the ultimate tensile strength (UTS) and elongation increased first and then decreased, while the yield strength had no obvious trend with the kissing bond length. However, Zhang’s study [16] on FSW of 7N01-T5 Al alloy found that higher heat input (600 rpm–175 mm·min−1, 600 rpm–50 mm·min−1) resulted in significant JLR composed of denser and more concentrated distributed oxide particles, leading to the joint failure at the JLR and the deterioration of joint properties, while lower heat input (600 rpm–300 mm·min−1) resulted in scattered and dilute distribution of oxide particles, which weakens the microcracked JLR feature and consequently improves the joint properties. Thus, the JLR feature is closely related to heat input and also sensitive to the composition of Al alloys.
However, the effect of welding heat input on JLR and its affecting characteristic on mechanical properties have not been comprehensively studied for FSW of 2195-T8 Al–Li alloy. Moreover, the mechanical properties of 2195-T8 high-strength Al alloy, as a heat-treatable alloy, are also sensitive to the change of heat input during FSW because of the dissolution of T 1 (Al2CuLi) and θ′ (Al2Cu) phases [9]. Thus, in this study, 2195-T8 Al–Li alloy was subjected to the FSW process under different butting surface conditions to study whether and how the existence of JLR makes a difference in tensile properties. At the same time, the FSW processes were carried out under different tool traverse speeds (TS) to investigate the effect of heat input on JLR in the stir zone of 2195-T8 joints and also its impact on the tensile properties and fracture behavior of the joints.
2 Experimental
The base material in this study is 2195-T8 Al–Li alloy rolled plates supplied by Southwest Aluminum (Group) Co., Ltd, China. The chemical compositions and mechanical properties (transverse direction) perpendicular to the rolling direction of the base material are shown in Table 1. The welding direction was parallel to the rolling direction as shown in Figure 1(a). Thus, the tensile direction of the base metal specimens was consistent with that of the as-welded specimens. The tool rotation speed was fixed at 1,000 rpm and the TS during the welding process were 100–400 mm·min−1 as shown in Table 2. The plunge depth of the pin was set as 2.0 mm, which was controlled by the displacement of the pin. The plunge depth along the whole weld seam was considered constant, which was verified by the relatively steady Z-axis force of 6 kN during welding. Plates with the dimensions of 385 mm × 50 mm × 2 mm were longitudinally butt welded directly (A series) and after butting surface treatment – initial oxide layer had been milled (B series). Plates with the dimensions of 385 mm × 100 mm × 2 mm were bead-on-plate welded (C series) with the FSW running along the centerline of the plate, in which there is virtually no butting surface. Thus, all butt and bead-on-plate FSW processes had the same heat input and similar heat dissipation. Before the welding, the top surfaces of the plates at the welding zone were all cleared to remove oxide. An FSW tool made of commercial H13 steel was used. As shown in Figure 1, it had a concave shoulder of 8 mm in diameter and 7° in internal inclination angle, and a taper pin of 1.85 mm in length and 2.8 mm in tip diameter and 3.4 mm in root diameter with three flats. The tool tilt was kept constant at 3° for all welding experiments.
Chemical compositions and mechanical properties of 2195-T8 Al alloy
| Measured chemical composition (wt%) | Mechanical properties (TD) | |||||||||
|---|---|---|---|---|---|---|---|---|---|---|
| Cu | Mg | Li | Zr | Ag | Ti | Fe | Al | YS (MPa) | UTS (MPa) | El. (%) |
| 3.52 | 0.27 | 1.07 | 0.21 | 0.43 | 0.11 | 0.29 | Bal. | 533.4 ± 0.4 | 580.7 ± 0.2 | 9.7 ± 0.64 |
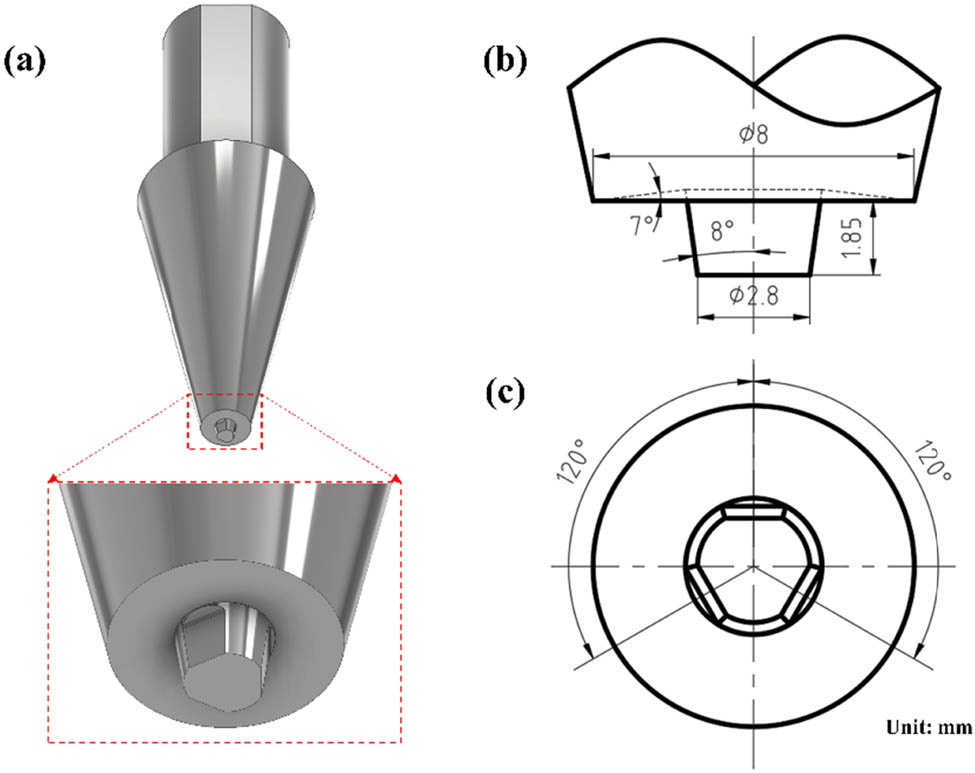
Schematic draft of the tool: (a) the tool, (b) and (c) dimensions of shoulder and pin.
Welding conditions applied in current study and their tensile properties
| Designation | Welding procedure | TS (mm·min−1) | YS (MPa) | UTS (MPa) | El. (%) |
|---|---|---|---|---|---|
| A1 | FSW | 100 | 288 ± 1.1 | 399 ± 9.4 | 4.3 ± 0.38 |
| A2 | FSW | 200 | 293 ± 3.6 | 370 ± 54.6 | 3.6 ± 2.27 |
| A3 | FSW | 300 | 301 ± 0.3 | 315 ± 5.3 | 0.7 ± 0.17 |
| A4 | FSW | 400 | 308 ± 12.2 | 324 ± 16.6 | 0.6 ± 0.07 |
| B1 | Butting surface treatment + FSW | 100 | 290 ± 1.3 | 379 ± 20.4 | 2.8 ± 1.06 |
| B2 | Butting surface treatment + FSW | 200 | 299 ± 6.8 | 379 ± 31.9 | 3.2 ± 0.99 |
| B3 | Butting surface treatment + FSW | 300 | 310 ± 2.7 | 378 ± 17.7 | 2.0 ± 0.65 |
| B4 | Butting surface treatment + FSW | 400 | 317 ± 3.0 | 368 ± 9.9 | 1.6 ± 0.20 |
| C1 | bead-on-plate | 100 | 271 ± 1.9 | 388 ± 1.6 | 5.2 ± 0.25 |
| C2 | bead-on-plate | 200 | 292 ± 1.9 | 397 ± 5.4 | 3.9 ± 0.27 |
| C3 | bead-on-plate | 300 | 290 ± 0.1 | 400 ± 3.0 | 5.1 ± 0.74 |
| C4 | bead-on-plate | 400 | 300 ± 3.5 | 408 ± 3.2 | 4.9 ± 0.29 |
In the present investigation, metallographic specimens and tensile specimens were taken from the stable welding part. Tensile specimens with a reduced parallel section of 32 mm in length and 6 mm in width were machined perpendicular to the weld seam, which was kept in the center of the parallel segment. Three tensile specimens that conformed to the ASTM E8/E8M-09 standard were cut following the scheme shown in Figure 2(a). The schematic diagram of the tensile specimen is shown in Figure 2(b). The tensile tests were carried out by Zwick20 universal testing machine with a tensile speed of 2 mm·min−1, and the gage length of the extensometer was set as 25 mm. Hardness measurements were conducted on the polished transverse cross-section of the welds using an automatic testing machine (Zwick/Roell Zhu) under a load of 100 gf for 15 s.
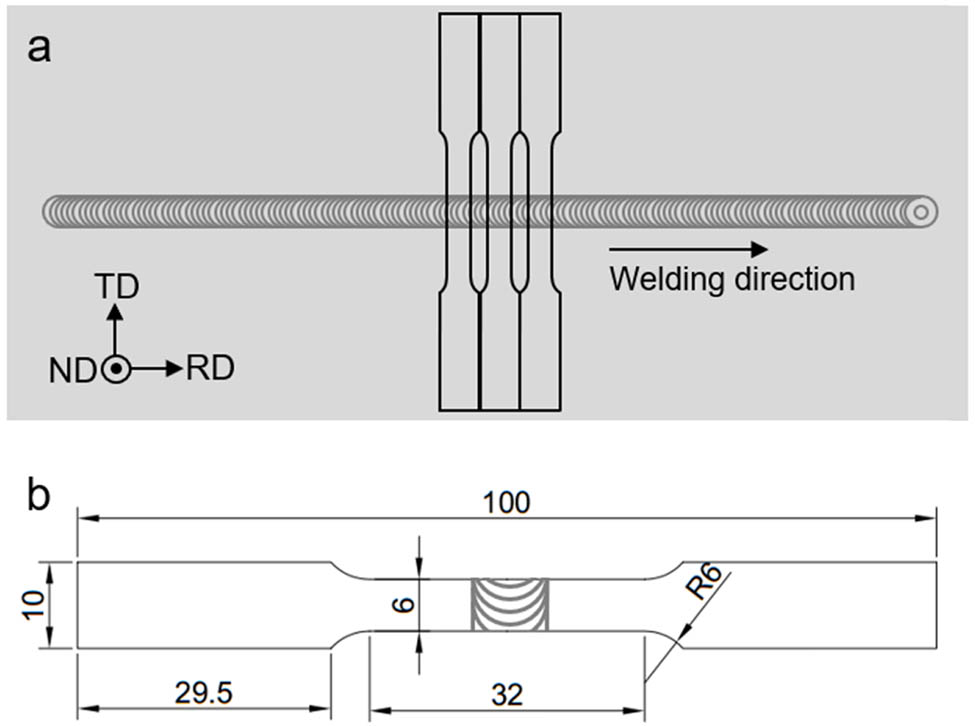
(a) Selected location of tensile specimens for 2195-T8 FSW joint, and (b) configuration and dimensions of the tensile specimen (unit: mm).
After grinding and polishing, metallurgical specimens were etched with Keller reagent (i.e., a solution of 5 mL HNO3 + 3 mL HCl + 2 mL HF in 90 mL water). The transverse cross-section of the as-welded and tensile-tested specimens was examined using an optical microscope (DM 4000). Microstructure characterization and energy dispersive spectroscopy (EDS) analysis were performed using high-resolution field emission scanning electron microscopy (SEM, Sirion 200).
3 Results
3.1 Macrostructure and microstructure
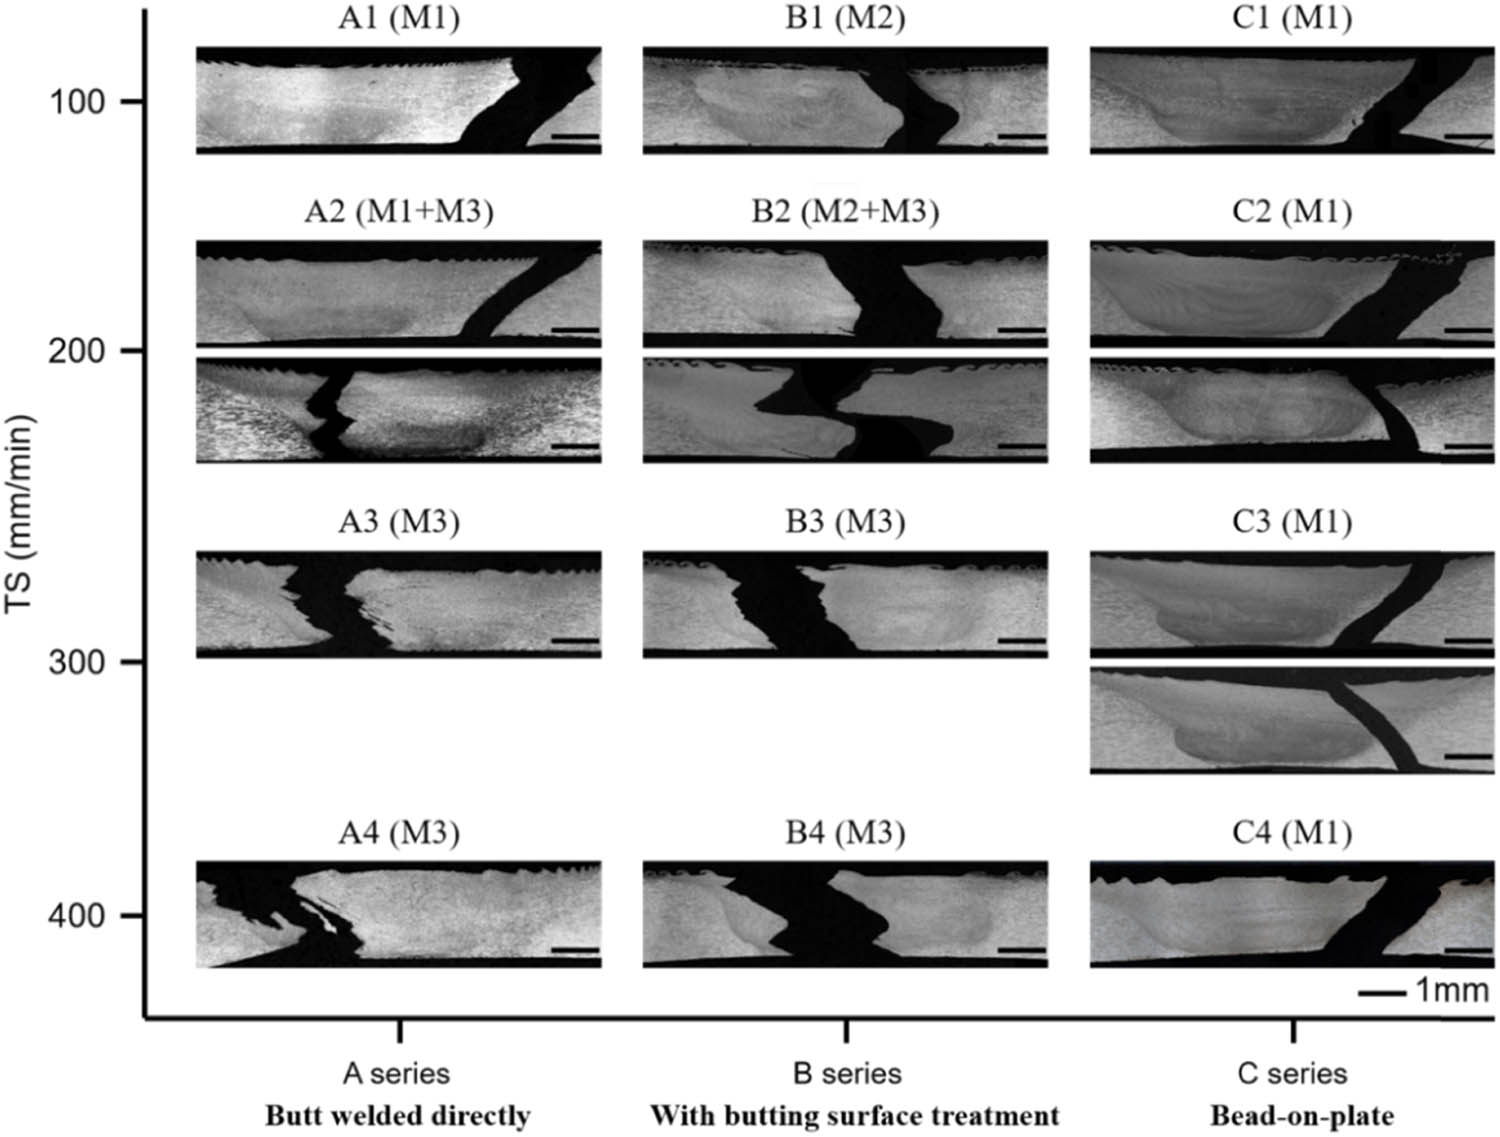
The macrostructure of an A1 joint (without butting surface treatment; TS = 100 mm·min−1) is shown in Figure 3(a), which is typical for A-series joints. Within the stir zone, JLR can be clearly observed at the upper part of the advancing side (AS), boxed in a white rectangle. The magnified view of this region is given in Figure 3(b), showing the morphology of JLR more distinctly. Micrographs of similar regions in A2, A3, and A4 joints are given in Figure 3(c)–(e). It can be clearly seen that JLR is smooth at lower TS and becomes serrate gradually with the increase of TS. Figure 4(a) shows the macrostructure of a B1 joint (with butting surface treatment; TS = 100 mm·min−1). Figure 4(b) shows the magnified views of the boxed region in Figure 4(a) (c) and (d) presents the microstructure of similar regions in B2, B3, and B4 joints. As indicated by the arrows in Figure 4(b)–(d), JLR still exists after butting surface treatment, even though they are less distinct than those in A-series joints. In the insets added to the upper right corners of Figure 4(b)–(d), JLR are emphasized into the black lines for better showing the morphology and location. Similar to A series, JLR in B series evolves from smooth to serrate with the increase of TS. In C-series joints (bead-on-plate welding; TS: 100–400 mm·min−1), no JLR was observed. This is consistent with the expectation, since there is no butting surface in C-series welding.
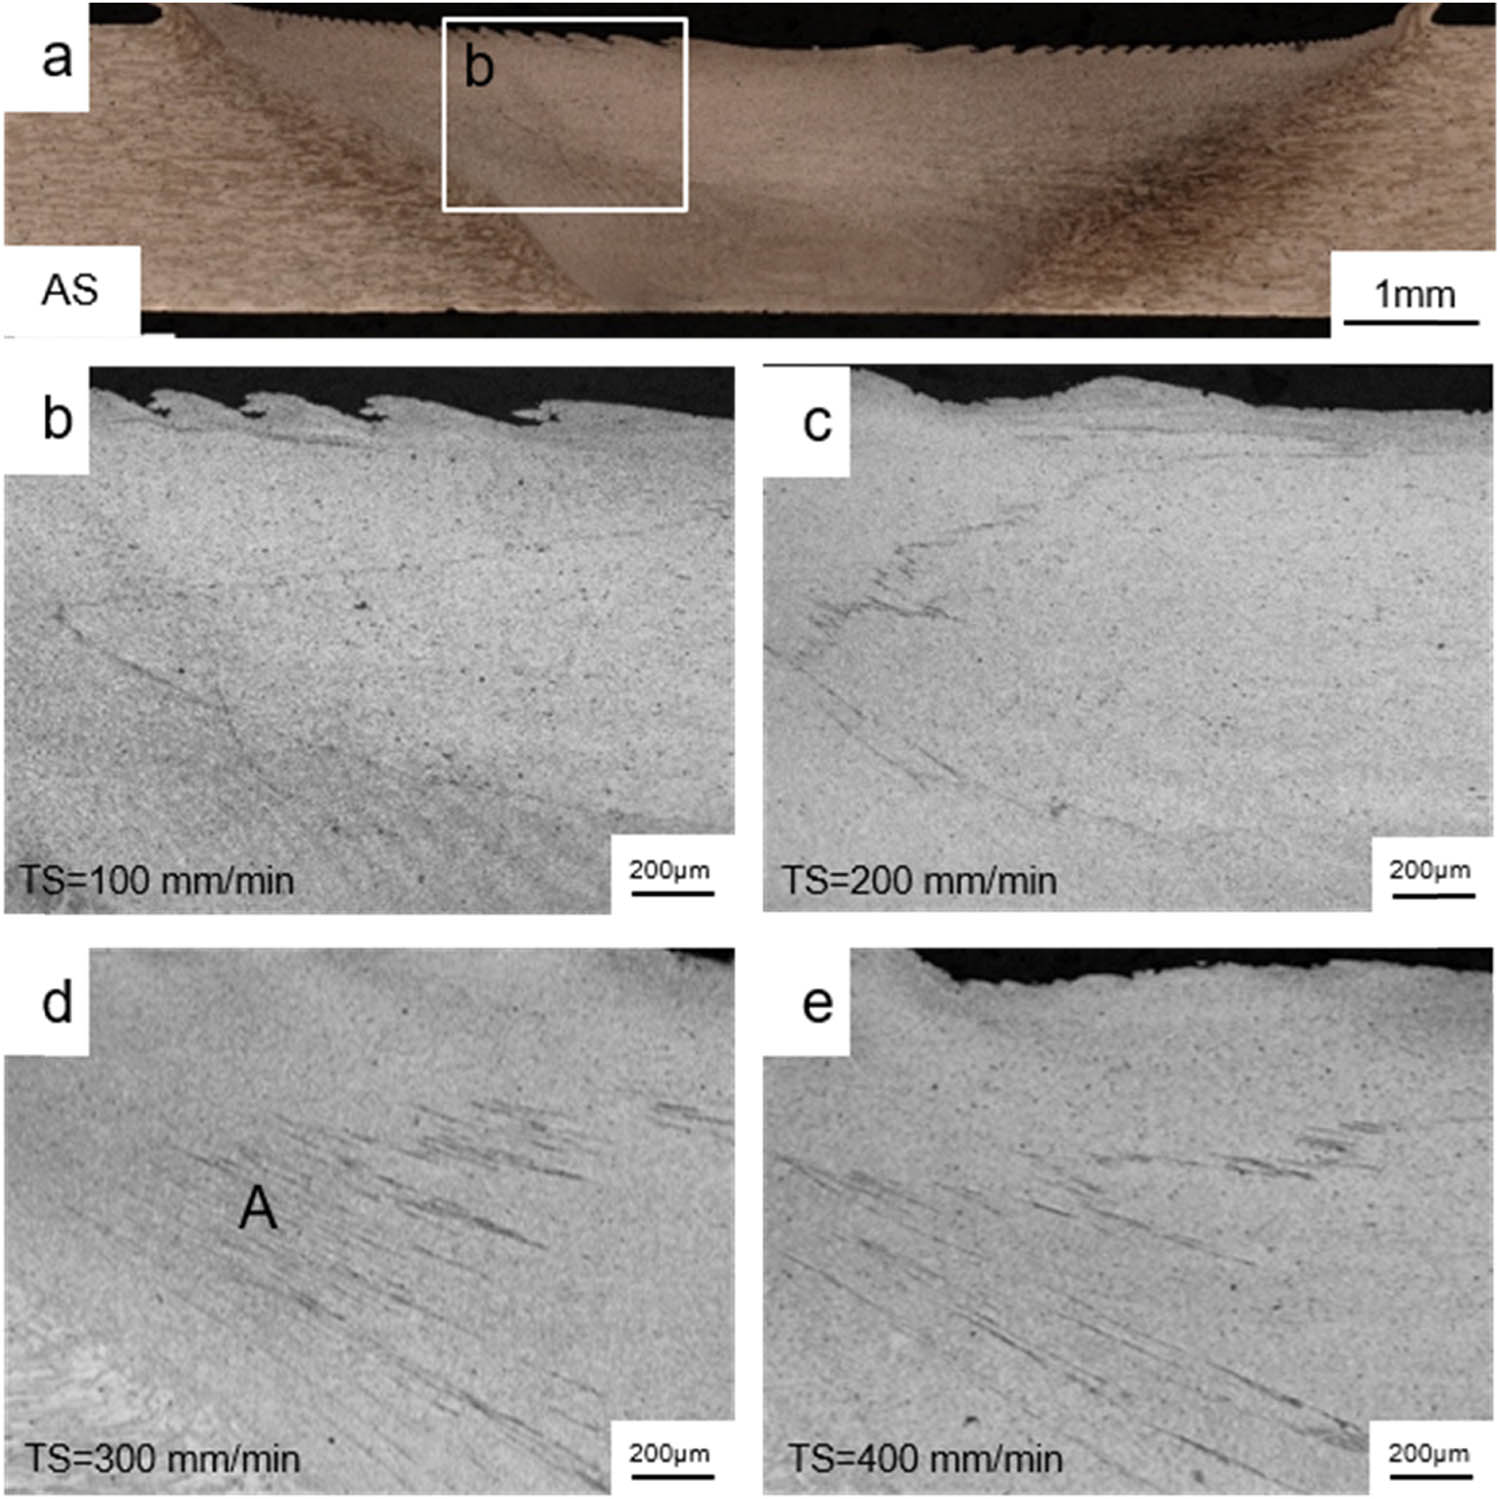
Macrostructure and JLR of A series (butt welded directly): macrostructure of (a) A1; JLR of (b) A1, (c) A2, (d) A3, and (e) A4.
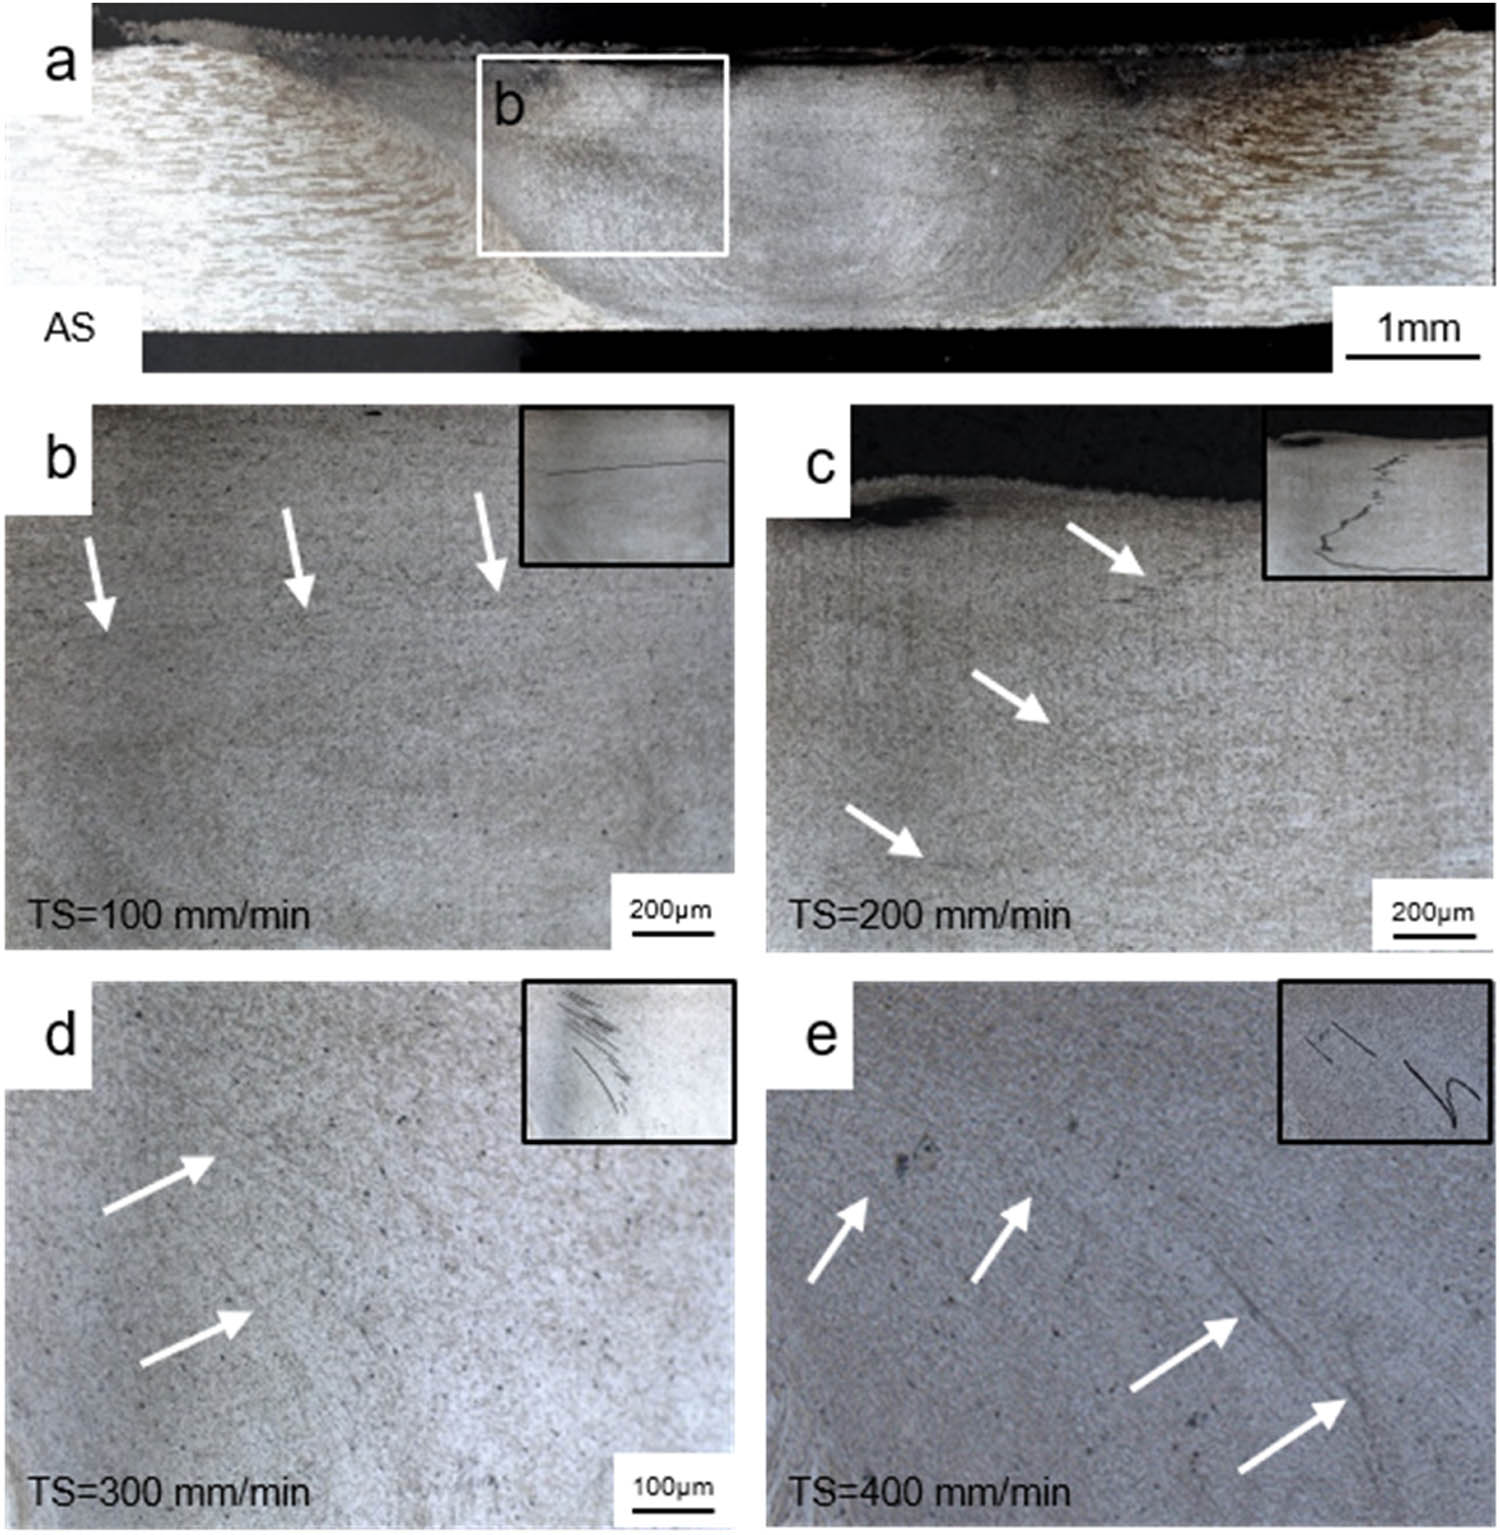
Macrostructure and JLR of B series (with butting surface treatment – initial oxide layer had been milled): macrostructure of (a) B1; JLR of (b) B1, (c) B2, (d) B3, and (e) B4.
Figure 5 shows the morphology observed using SEM in secondary electron mode and EDS analysis of local areas from the A3 specimen. As shown in Figure 5(a), there are some gray and dark lines that are parts of JLR. From Figure 5(b), it can be found the gray line consists of gray particle arrays. Table 3 shows the element compositions at these points indicated in Figure 5(b). Point 3 at the white area has a high Cu content, which indicates that the white area could be the precipitation phase Al2Cu. The O content of Points 1 and 2 is obviously higher than that of Points 3 and 4. There are some microcracks at JLR indicated by dark areas in Figure 5(c) and (d). Figure 5(e) shows EDS analysis across the microcrack of JLR in Figure 5(d). Al content in the middle of the arrow is significantly reduced due to the existence of microcrack. However, the oxygen content increases in this region. Di et al. [14] tested the composition of the particle near the JLR by EDS analysis, and the result indicated that JLR had a composition roughly conforming to the composition of Al2O3. With TEM analysis, Sato et al. [11,12] also identified the particles along JLR as Al2O3. Thus, from higher oxygen content at Points 1 and 2 in Figure 5(b) and that at microcrack in Figure 5(d), it can be speculated there is Al2O3 in these regions. Thus, JLR consists of Al2O3 particle arrays and some microcracks distributed along JLR.
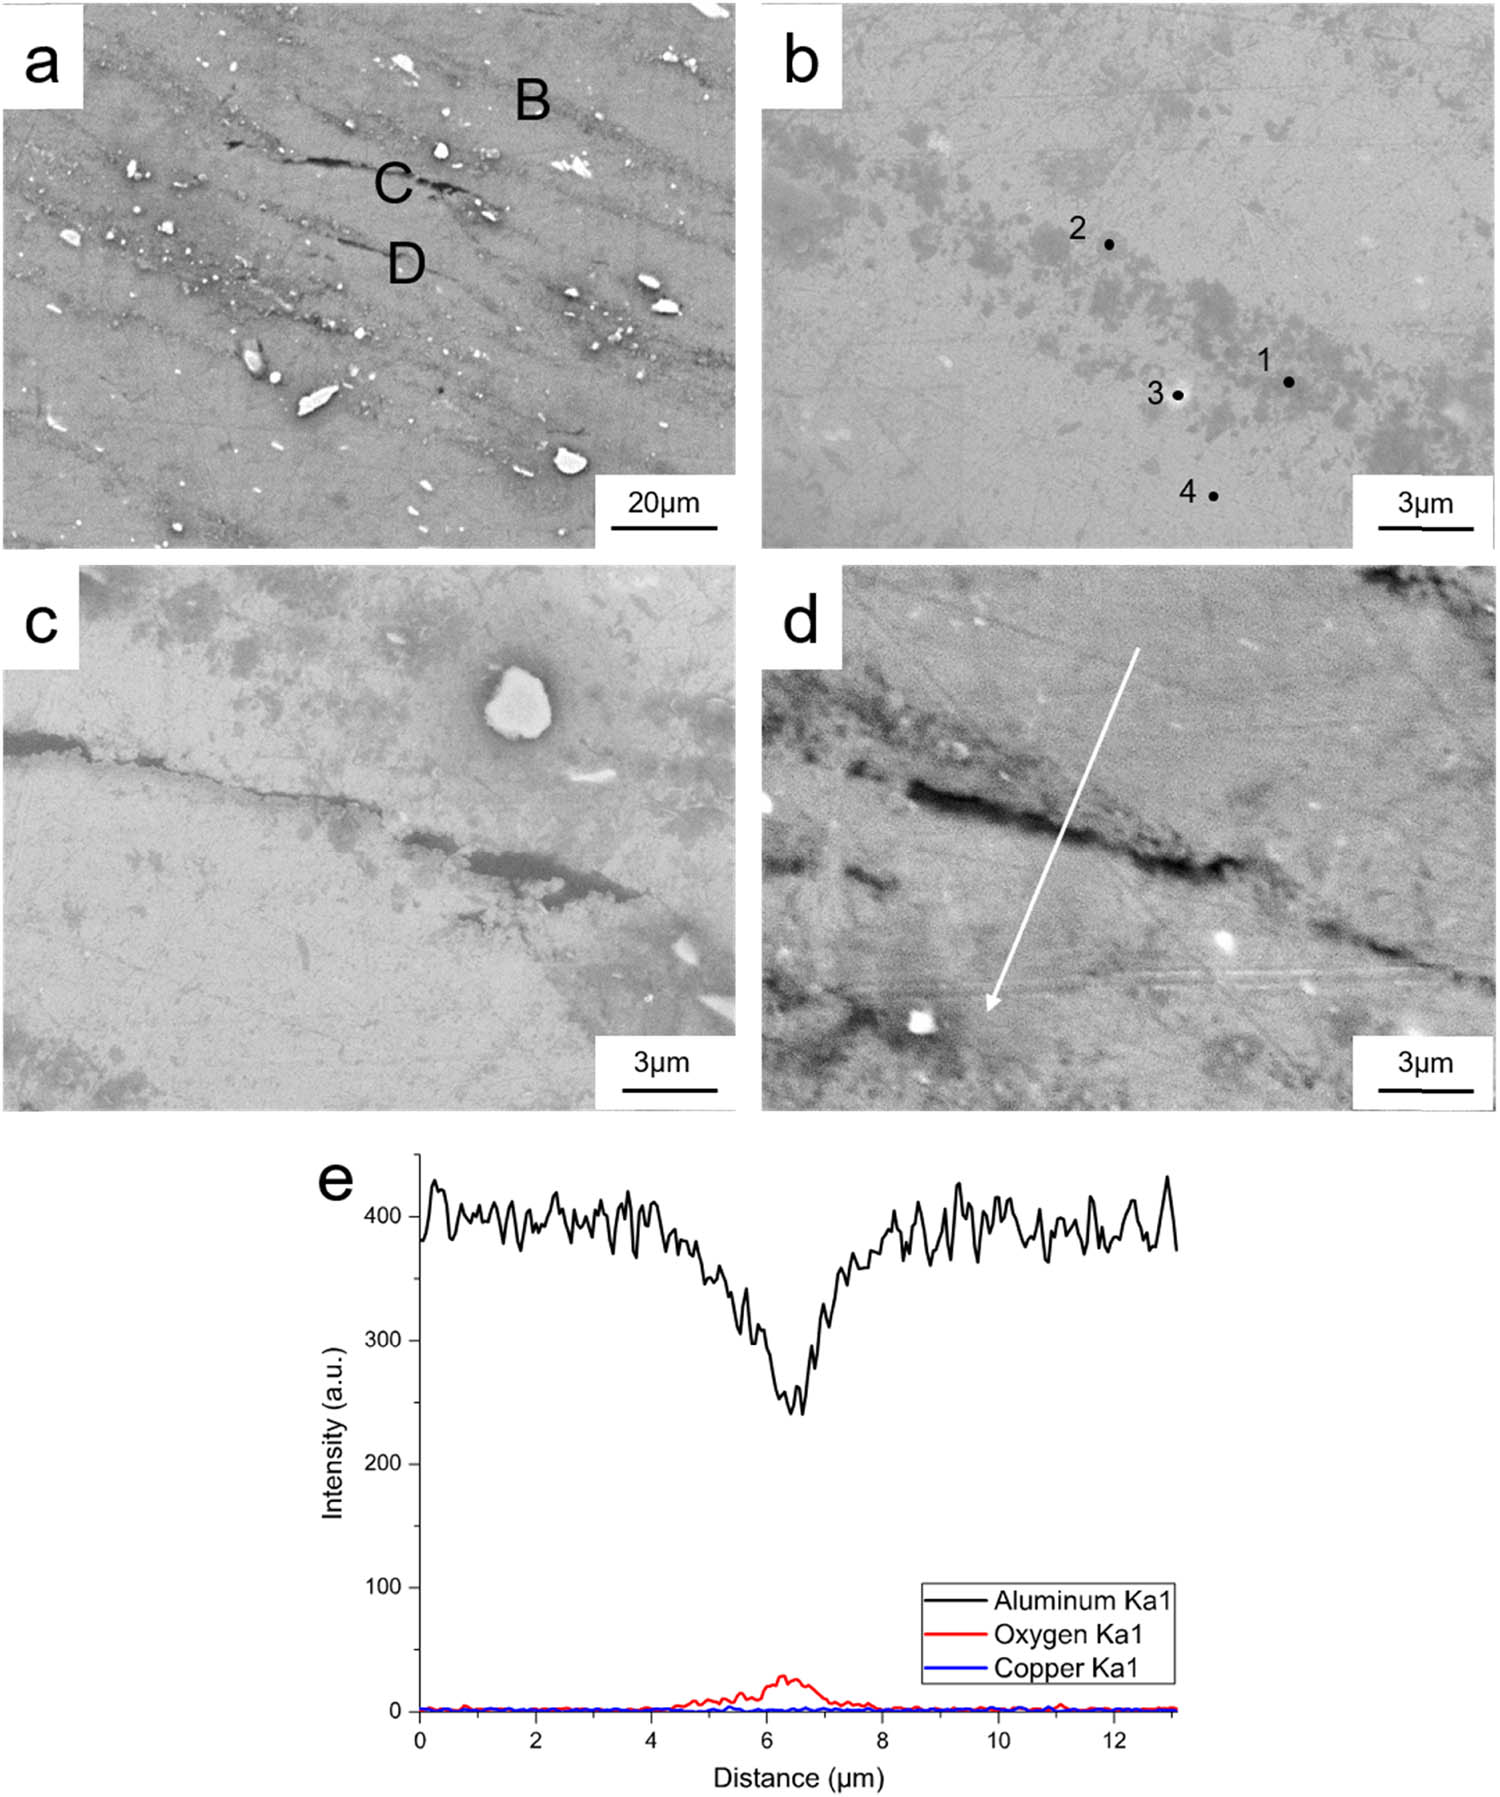
(a) SEM surface morphology of JLR at region A in Figure 2(d); (b)–(d) magnification of B, C, and D in (a); (e) EDS analysis along the white arrow in (d).
EDS Analysis of element compositions at the points indicated in Figure 4(b)
| Element | Point 1 (at.%) | Point 2 (at.%) | Point 3 (at.%) | Point 4 (at.%) |
|---|---|---|---|---|
| O | 19.29 | 11.33 | 3.37 | |
| Al | 79.40 | 87.00 | 79.35 | 97.83 |
| Cu | 1.31 | 1.67 | 17.28 | 1.33 |
| Mg | 0.84 |
3.2 Microhardness profiles of joints
The typical hardness profiles of the welds are shown in Figure 6. Sixty Vickers microhardness indentations, along the mid-thickness of the plate, were performed at an interval of 0.2 mm for each weld. There is a similar trend at the profiles that the microhardness values of the stir zone are significantly lower than those of the base metal. Moreover, the lowest hardness is observed near the boundary of heat-affected zone (HAZ) and thermomechanically affected zone (TMAZ) in all joints, which could be attributed to the dissolution and/or coarsening of the precipitations during the FSW thermal cycle [28]. In addition, the overall microhardness values of A2 are higher than that of A1, which could be due to the decrease of heat input.
Vickers hardness distribution of FSW 2195-T8 welds A1 (TS = 100 mm·min−1); A2 (TS = 200 mm·min−1).
3.3 Tensile properties and fracture behavior
Tensile properties of A-, B-, and C-series joints are reported in Table 2 and Figure 7. The average UTS of the FSW joints varies from 315 to 408 MPa, as shown in Figure 7(a). Yield strength (YS) increases as TS increases because less precipitations (T 1 and θ′ phases) in base material will be dissolved as heat input decreases. In C series (bead-on-plate FSW), as TS increases, UTS is also improved although there are some differences in the trend of elongation (Figure 7(b)). In A series (without butting surface treatment), UTS and elongation significantly decrease while TS increases from 200 to 300 mm·min−1. In B series (with butting surface treatment), elongation also decreases but UTS is almost unchanged while TS increases from 200 to 300 mm·min−1.
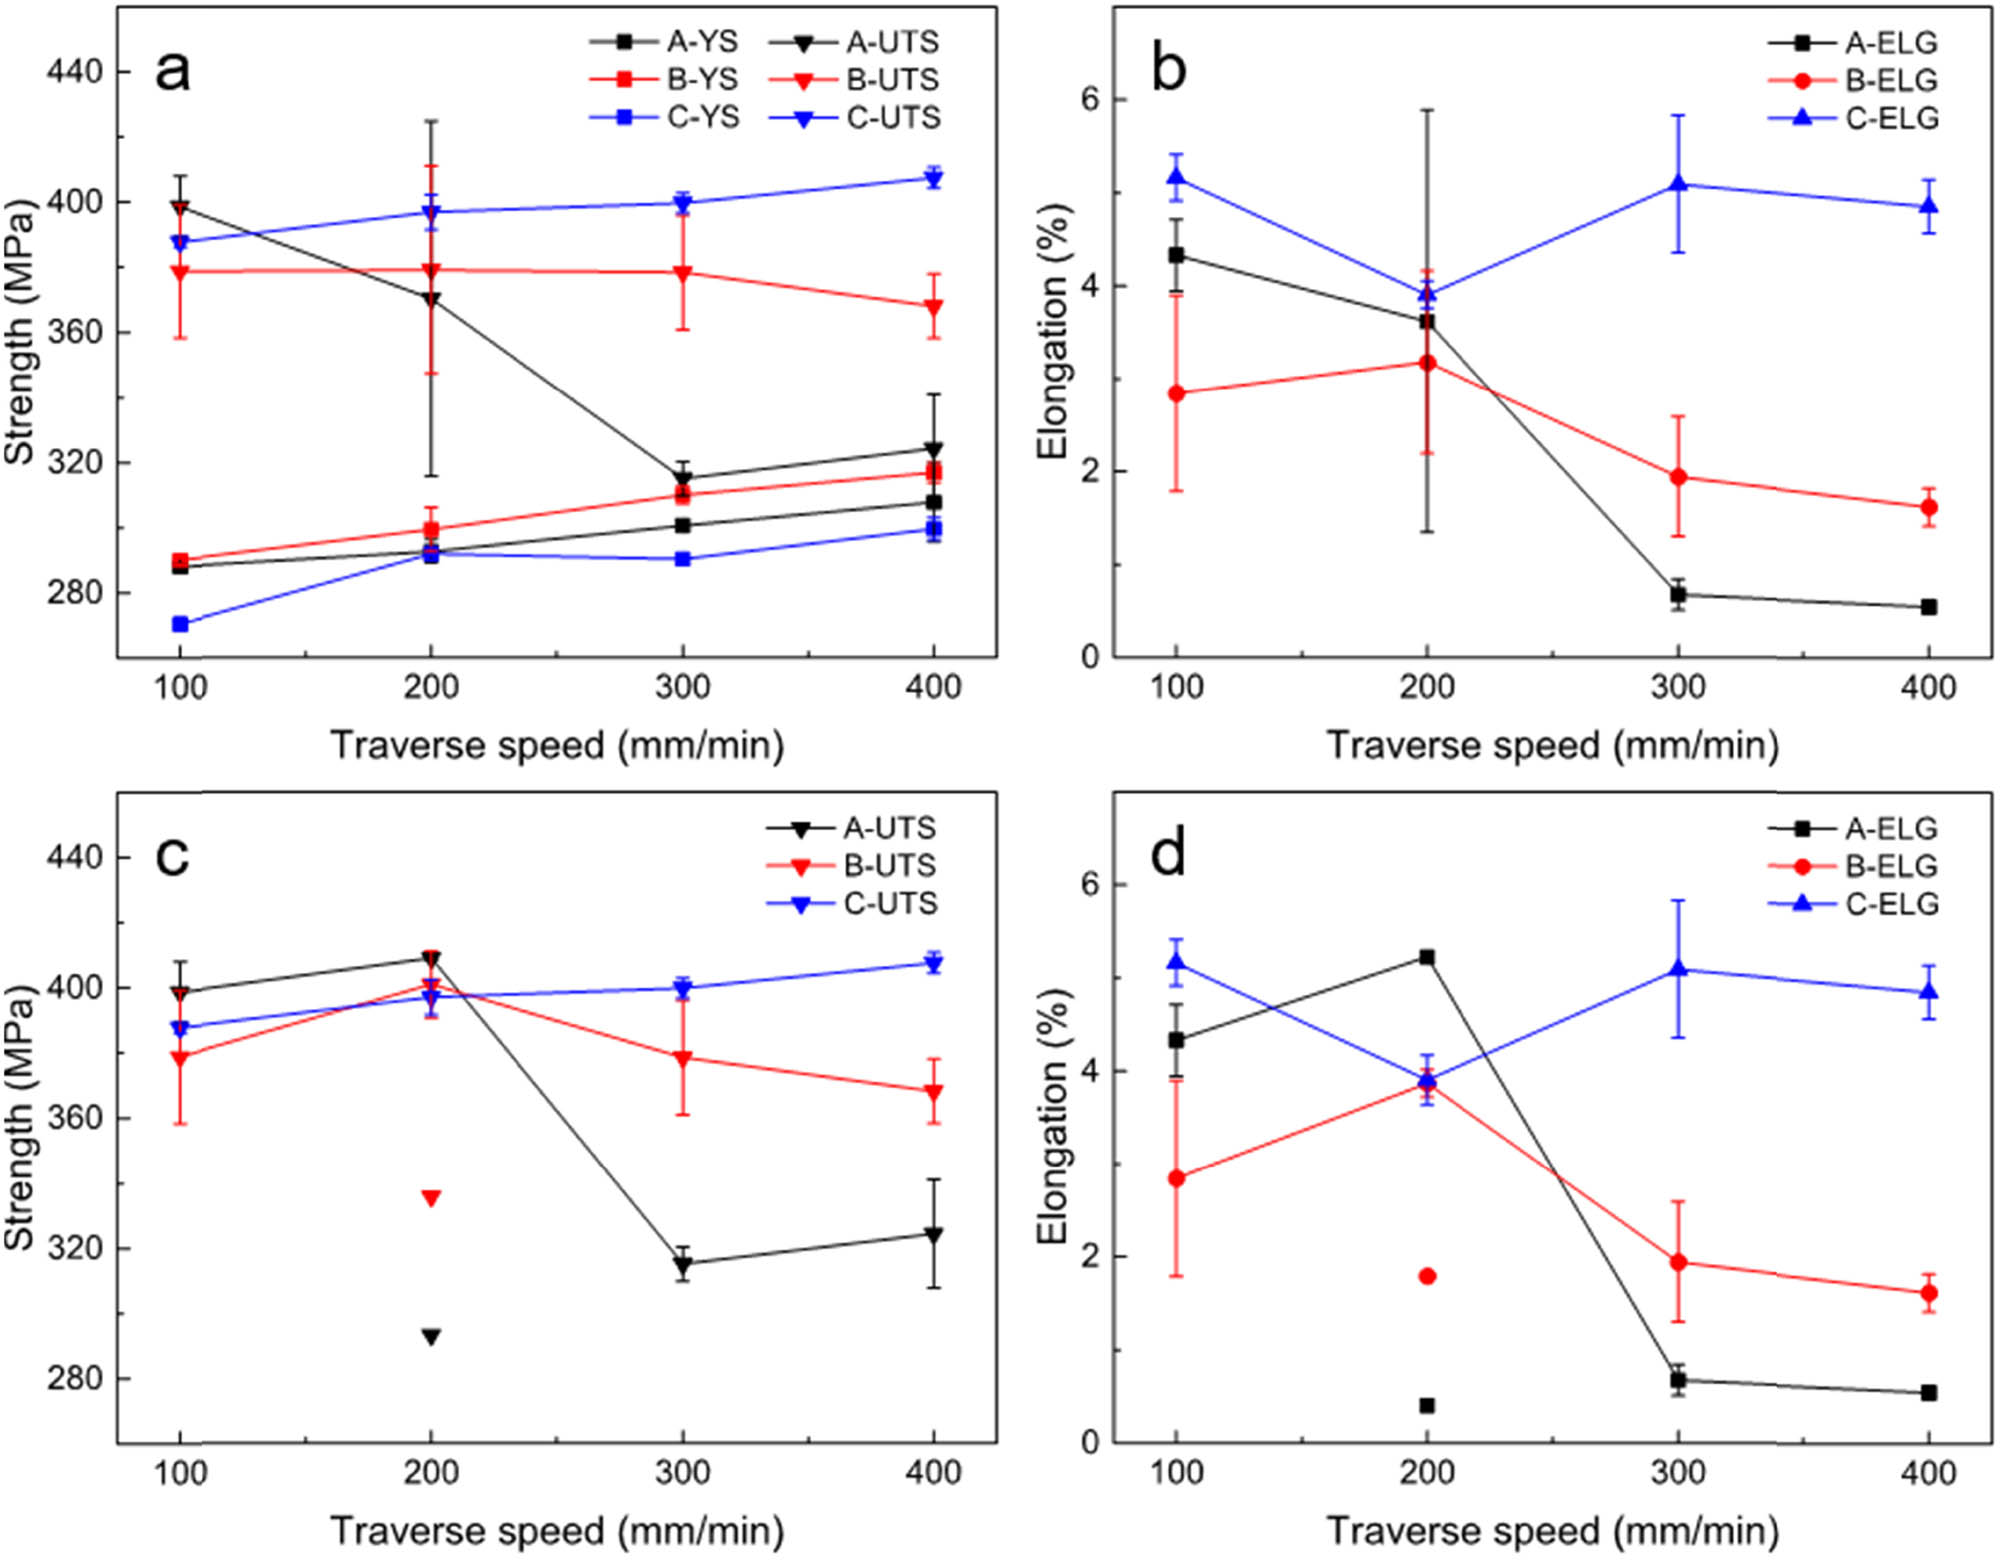
Properties change of A, B, and C series as the increase of TS: (a) YS and UTS, and (b) elongation; (c) UTS and (d) elongation (specimens with fracture mode M3 in A2 and B2 are separated).
Figure 8 shows typical stress–strain curves for each welding condition. All specimens have a similar linear elastic stage and the elastic modulus is 75–81 GPa. In C series (Figure 8(c)), all specimens also have a similar strain hardening stage to the UTS and then fracture with good ductility. In A and B series, as shown in Figure 8(a) and (b), tensile specimens under lower TS (100–200 mm·min−1) yield at ∼290 MPa, following a similar strain hardening stage of C-series specimens; A3 and A4 specimens prematurely rupture with poor ductility due to the change of fracture location (Figure 9). There is a longer strain hardening stage in stress–strain curves of B3 and B4 specimens, although their fracture location is the same as that of A3 and A4 specimens (Figure 9). Thus, UTS and elongation of B3 and B4 specimens are improved, compared with A3 and A4.
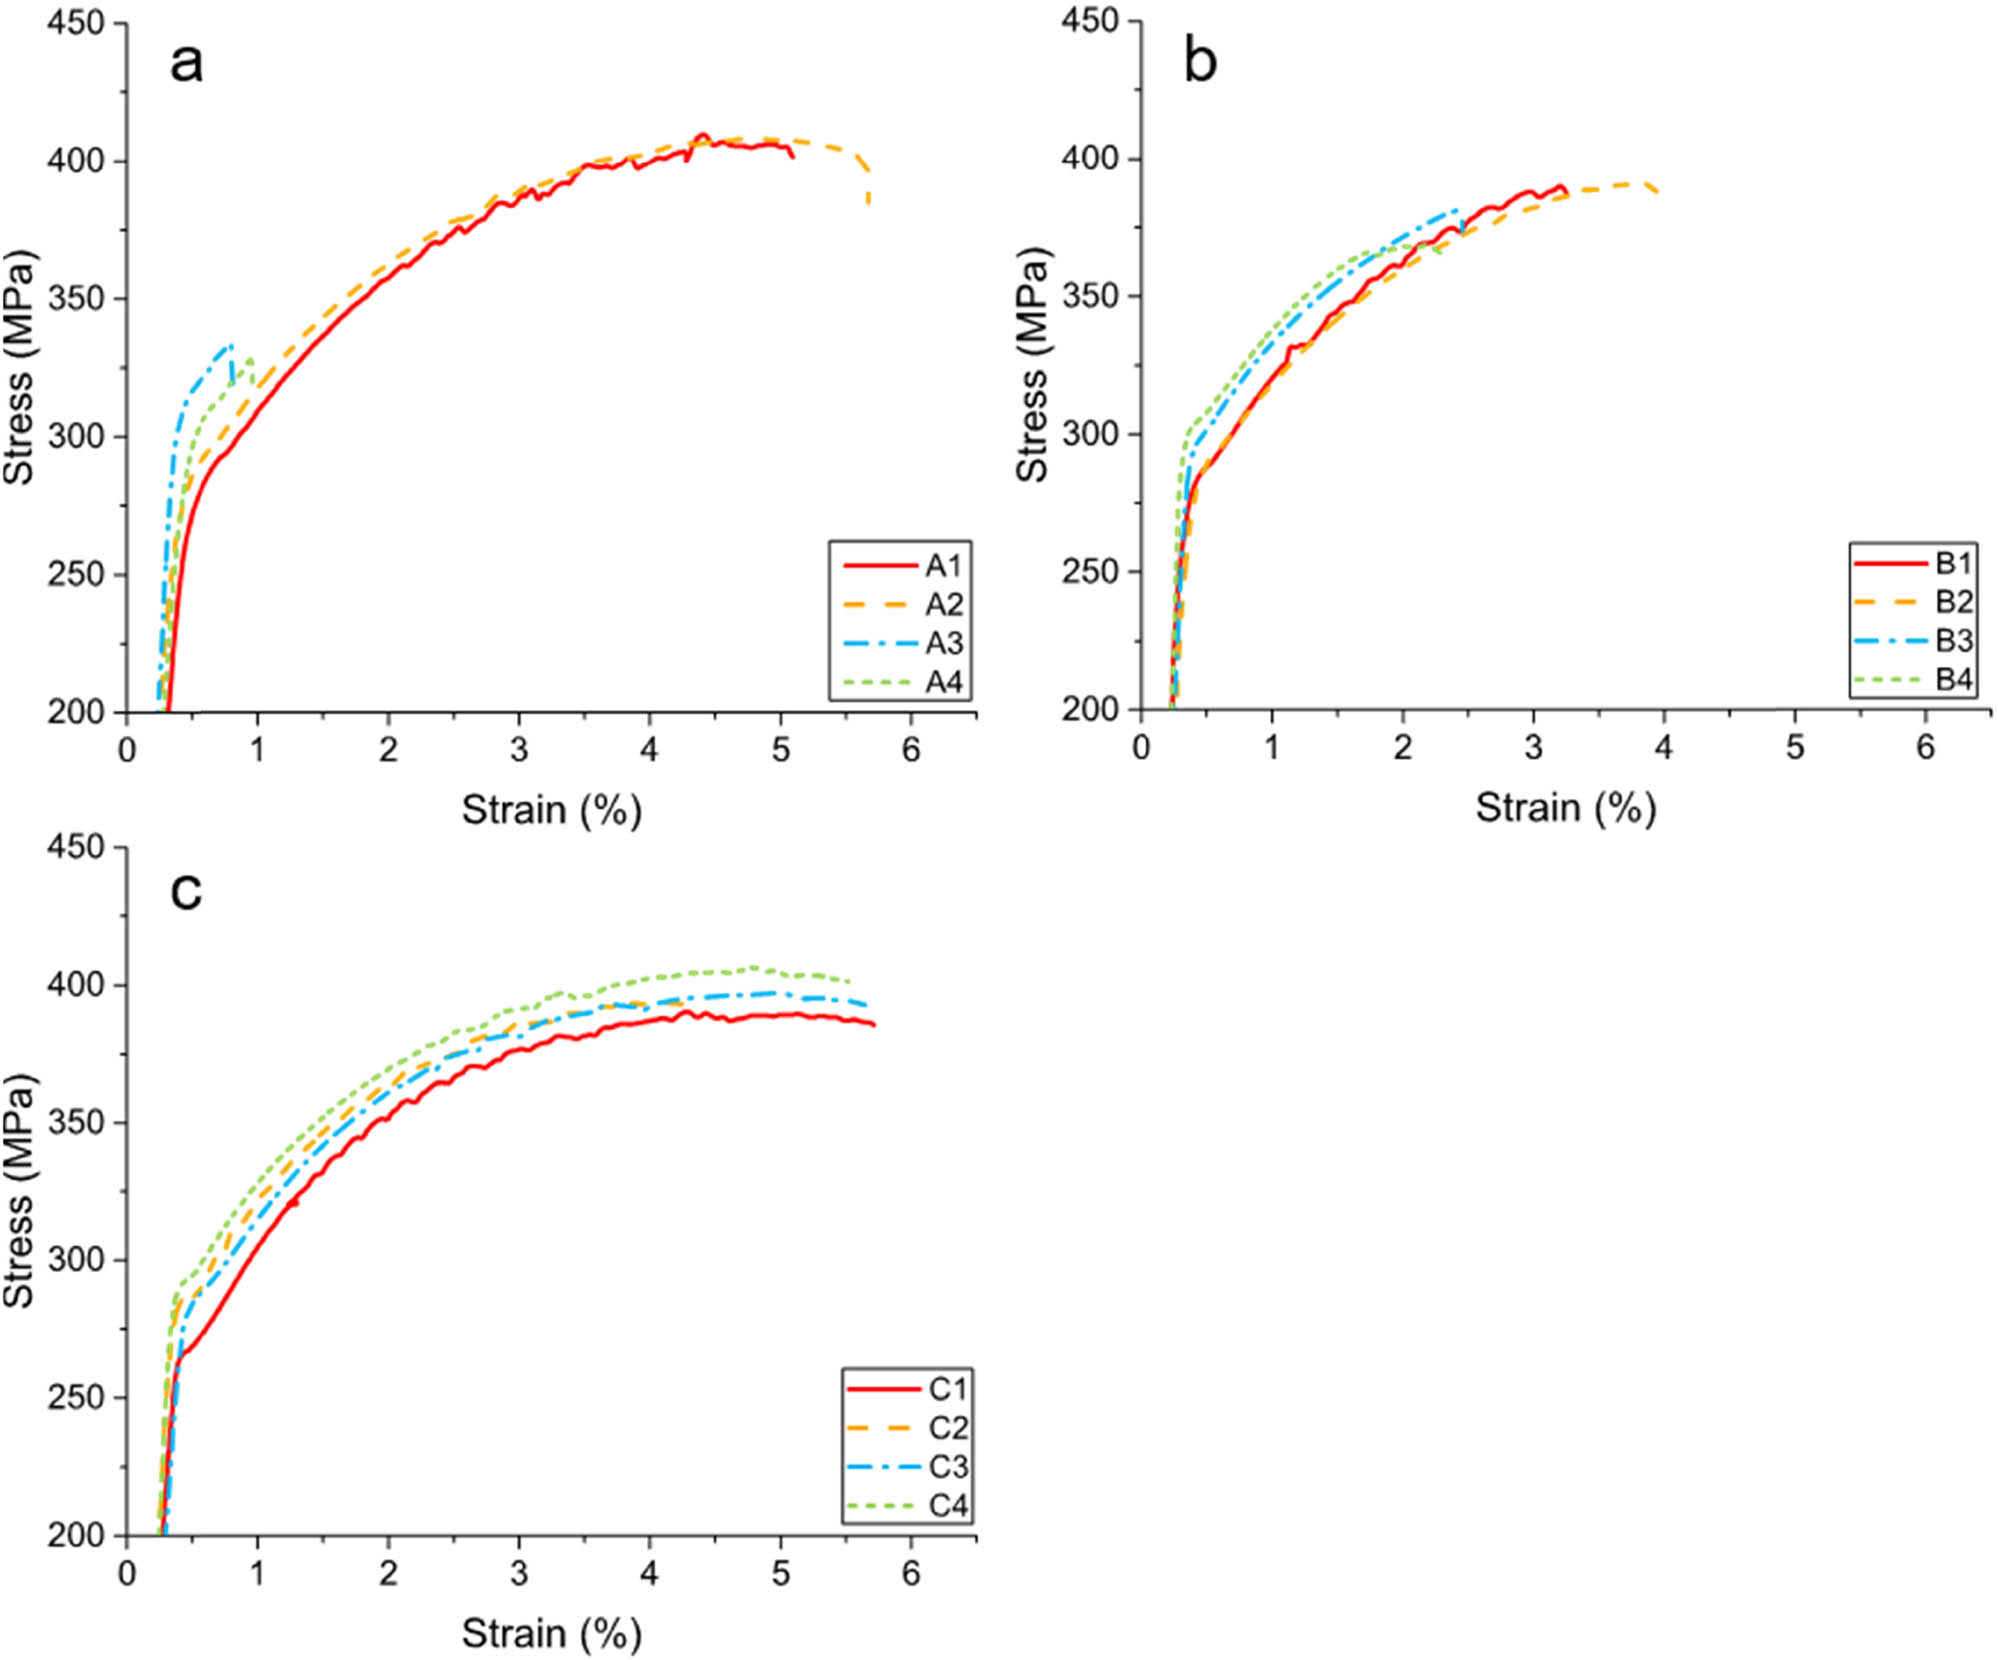
Typical stress–strain curves for (a) A, (b) B and (c) C series.
Summary of fracture modes corresponding to each welding condition.
There are three main fracture modes observed in the current study, as listed in Table 4. Specimens with shear fracture along 45° and 135° directions at the retreating side have similar tensile properties, and the fracture paths in both directions are connected to the boundary of TMAZ/HAZ. Thus, it is considered appropriate to classify these two fracture paths into one fracture mode, named mode 1 (M1). Moreover, the fracture path of 135° shear fracture at the upper part and fracture along the onion ring at the bottom part was classified as mode 2 (M2), and the fracture path along JLR was classified as mode 3 (M3). Different fracture modes corresponding to each welding condition are shown in Figure 9. All specimens of C series (C1–C4) and all specimens of A1 exhibited the fracture mode of M1. All specimens of B1 were fractured by the fracture mode of M2. A-series and B-series specimens with higher TS (i.e., A3, A4, B3, and B4) all fractured along JLR (fracture mode M3). Interestingly, in A2 and B2 conditions, there seems to be a critical transition of fracture mode in A series and B series, respectively. Two of A2 specimens exhibited the fracture mode of M1, while one of A2 fractured along JLR (fracture mode M3). Similarly, two of B2 specimens exhibited the fracture mode of M2, while one of the B2 fractured partially along JLR.
Typical fracture modes
| Designation | Fracture mode |
|---|---|
| M1 | 45° or 135° shear fracture at lowest hardness zone of retreating side |
| M2 | 135° Shear fracture at upper part and fracture along the onion ring at bottom part |
| M3 | Fracture along JLR |
The specimens with fracture mode M3 under TS of 200 mm·min−1 (i.e., A2 and B2) are separated from other specimens; then, the properties of every welding condition are re-showed in Figure 7(c) and (d). Comparing A, B, and C series, TS of 200 mm·min−1 is a critical point. UTS and elongation have no apparent change after butting surfaces are treated at lower TS (100–200 mm·min−1). However, UTS and elongation have a significant improvement after butting surfaces were treated when TS is 300–400 mm·min−1. In addition, in butt FSW (A series and B series), when TS < 200 mm·min−1, specimens of A1 showed a shear fracture at the retreating side (M1), and specimens of B1 showed a shear fracture at the upper part and partially fractured along the onion ring at the bottom part (M2); when TS > 200 mm·min−1, both specimens of A series and B series fractured along JLR (M3); when TS = 200 mm·min−1, both the specimens of A2 and B2 have two fracture mode, i.e., M1 + M3, M2 + M3, respectively.
4 Discussion
4.1 Formation and evolution of JLR
When the fresh surface of Al alloy is exposed to air at room temperature, a compact and amorphous oxide layer will grow to ∼2.5 nm (25 Å) in thickness within a few minutes, and the growth rate is greatly reduced thereafter and a thicker and more permeable outer layer will form after a long period of time [29]. The ultimate thickness of natural oxide film composed of these two layers is at sub-10-nm scale [29,30,31]. If not removed (i.e., A series), the oxide film of the butting surface would be broken and flow with the stirring pin during FSW. Moreover, under the same rotating speed, an increase in the TS from 100 to 400 mm·min−1 weakened the stirring of material per unit advance of the tool. Therefore, the oxides of the initial interface can flow sufficiently at lower TS, resulting in a relatively smooth morphology of JLR. While at higher TS, as the initial oxide layer cannot flow sufficiently, JLR becomes serrate and discontinuous (as shown in Figures 3 and 4).
However, JLR still exists even though the butting surfaces were milled prior to FSW, i.e., B series. On the one hand, a new oxide layer will re-form immediately after butting surface treatment since there must be a period of time (a few minutes) between butting surface treatment and welding. On the other hand, oxidation can also occur during welding due to entrained air and high processing temperature which could accelerate the oxidation growth rate [32]. Whereas even though the oxide layer could not be removed totally during the welding condition, it is speculated that newly formed oxide layer of the B series butting surface during such a short time is thinner than the natural oxide layer in the A series. Thus, JLR of the B series is less discernable than that of the A series. Moreover, as a control group, JLR does not exist in bead-on-plate FSW joints (i.e., C series) since there is no butting surface, which further confirms the rationality of the above discussion.
4.2 Analysis of fracture modes
Figure 10(a) is a typical OM of cross section of the as-tested A2 specimen with fracture mode M1. Figure 10(b) shows the SEM of the fracture surface of as-tested base material specimen, which also fractured along 45° direction with tensile direction. The fracture surface is mainly composed of cleavage river patterns and small dimples. Therefore, the fracture feature of the base material is a mixture of dimple fracture and cleavage fracture. Figure 10(c)–(g) shows SEM of the fracture surface of the as-tested A2 specimen. At the upper part of the fracture surface, there are lots of small dimples and some flat quasi-cleavage surfaces (Figure 10(f)). At the bottom part of the fracture surface, lots of elongated grain structures (from TMAZ) and larger dimples are observed (Figure 10(e) and (g)). Therefore, fracture mode M1 owns a mixed feature of dimples and quasi-cleavage surfaces, similar to that of the base material.
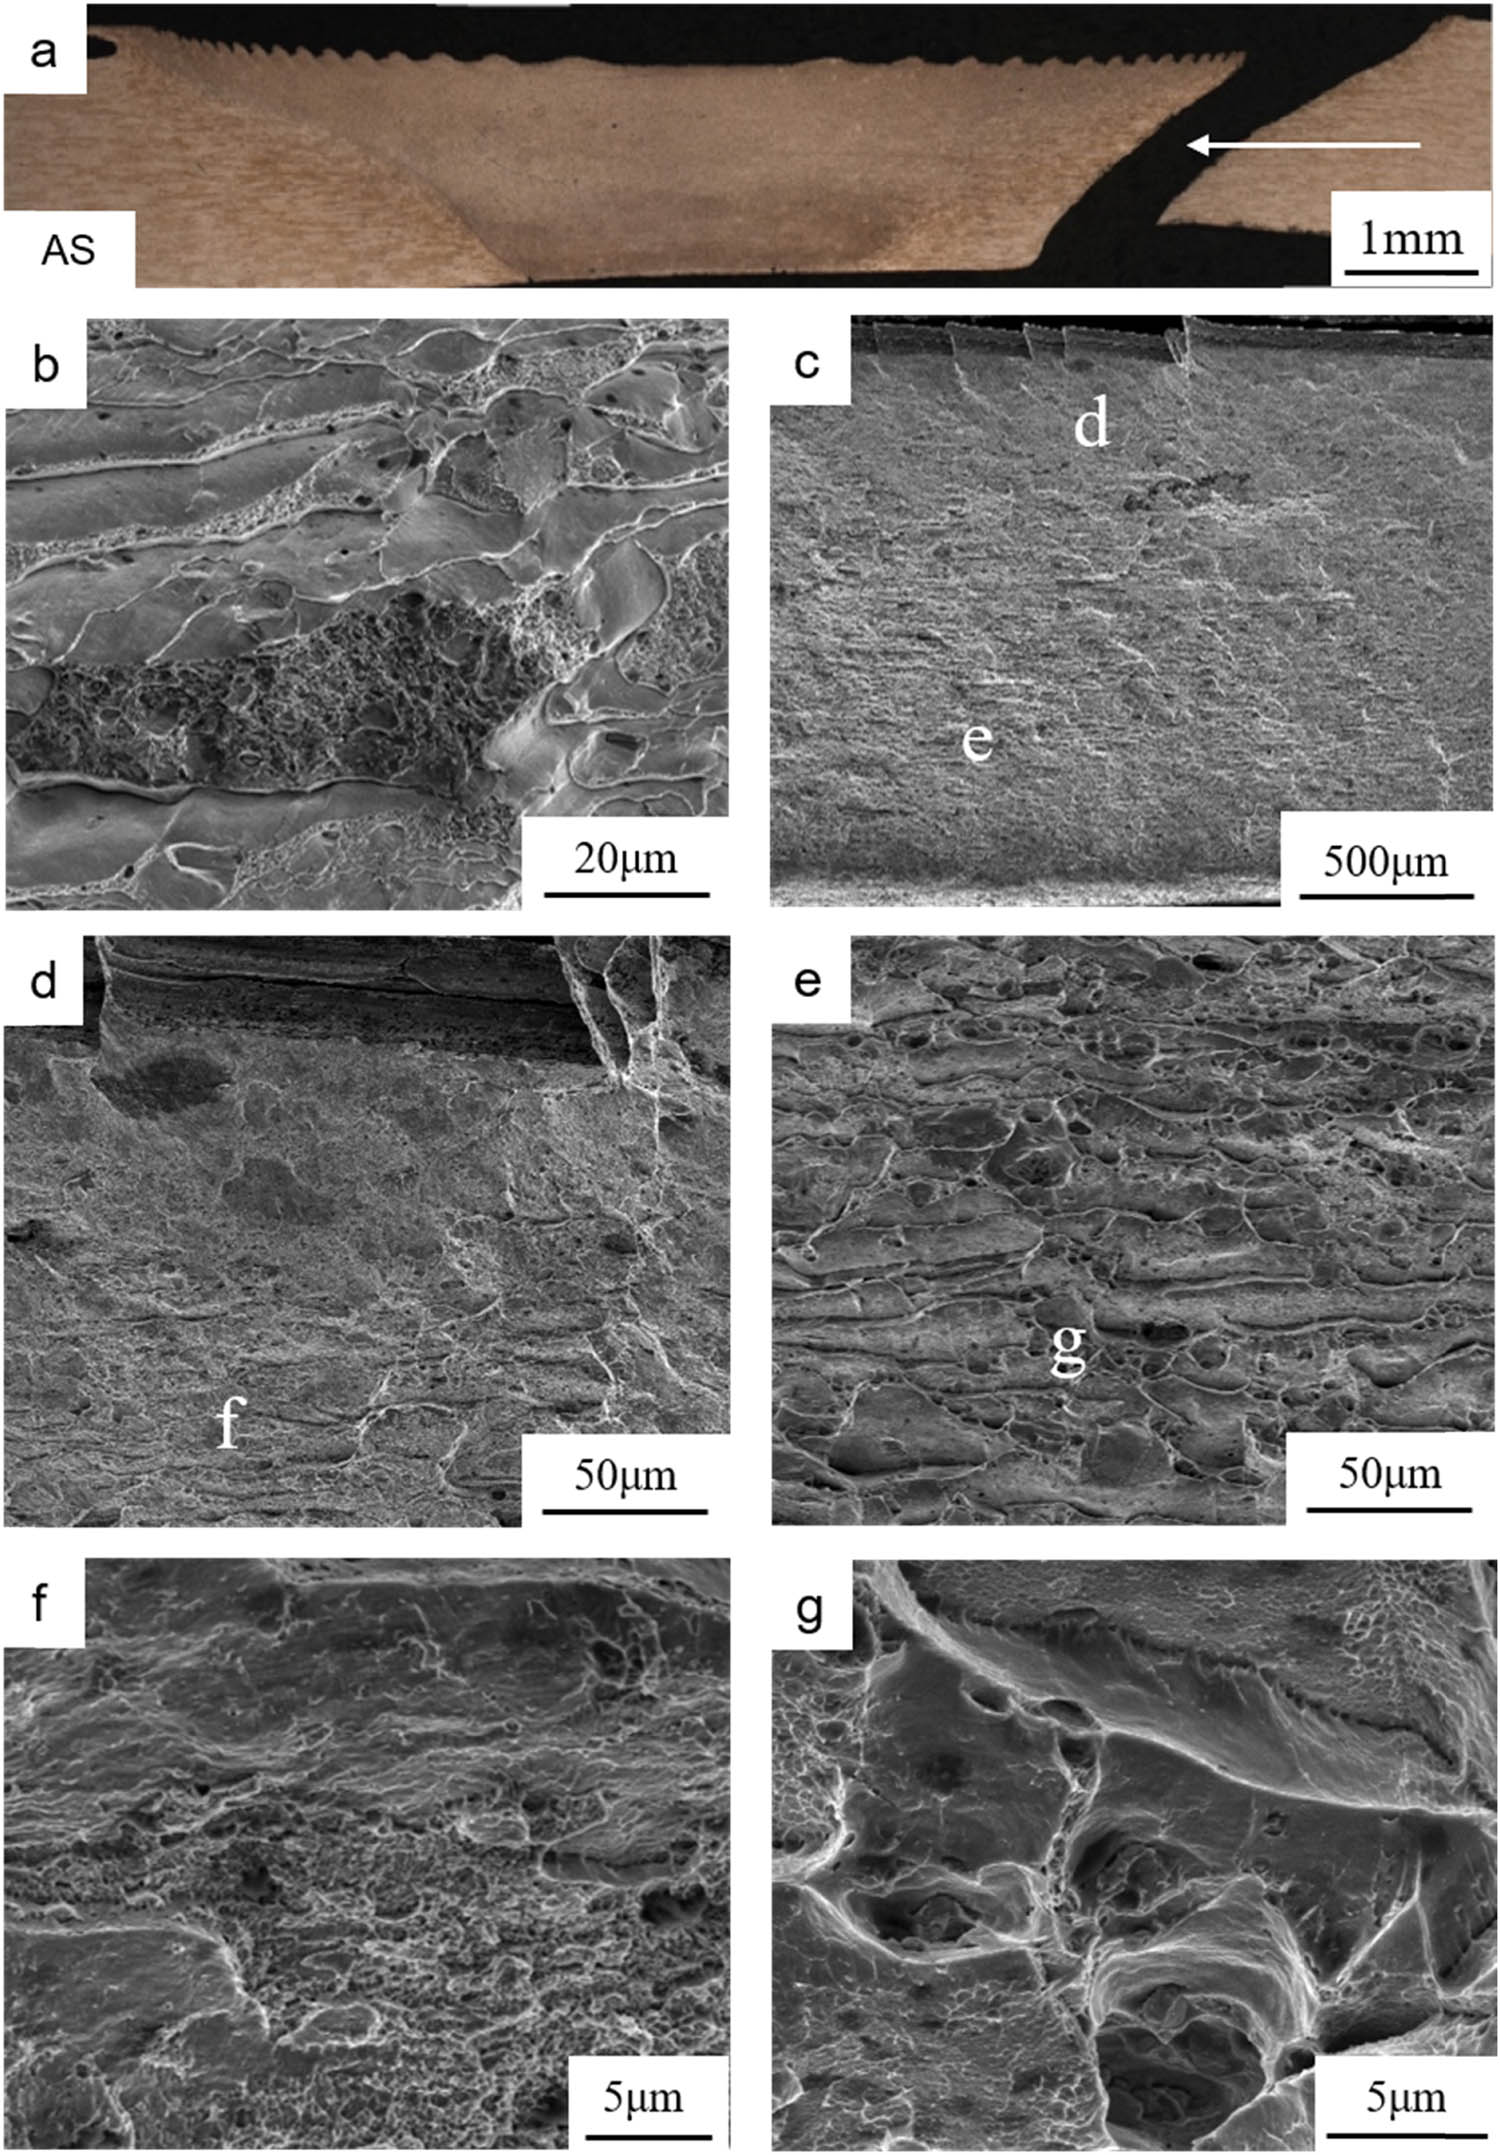
(a) OM of as-tested A2 specimen and observation direction of SEM indicated by white arrow; (b) SEM of the fracture surface of the as-tested base material specimen; SEM of (c) fracture surface of as-tested A2 specimen, (d and e) local zone in (c), (f) local zone in (d), and (g) local zone in (e).
Figure 11(a) shows a typical OM of cross-section of the as-tested B1 specimen with fracture mode M2. As shown in Figure 11(b), the upper part of the fracture surface displays 135° shear fracture (just like M1) and the bottom part displays a tear-like shape along the onion ring, which results in the relatively unstable properties of B1 specimens. At greater magnification (Figure 11(c) and (d)), it can be found that the surface is mainly composed of small dimples. Thus, it can be indicated that M2 also owns a mixed feature of dimple fracture and quasi-cleavage fracture.
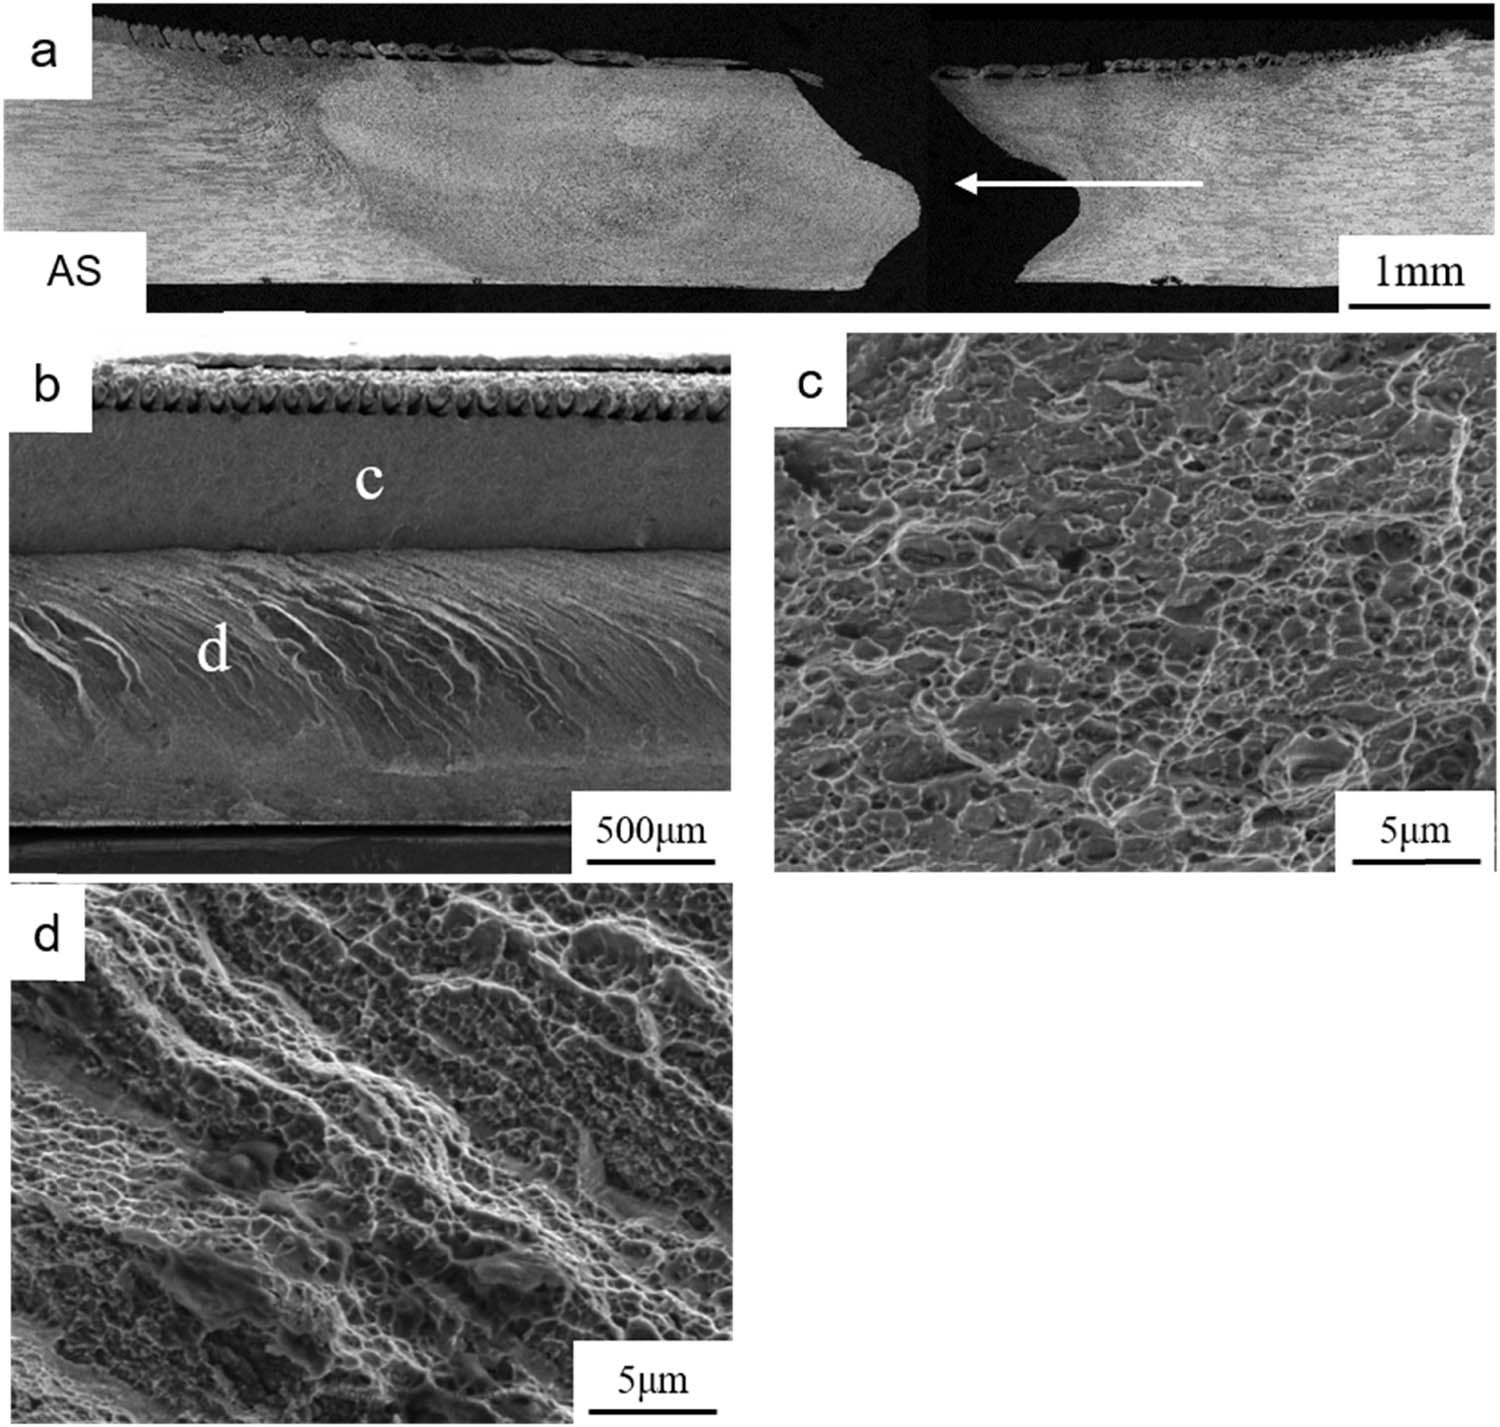
(a) OM of as-tested B1 specimen and observation direction of SEM indicated by white arrow; SEM of (b) fracture surface and (c) and (d) local zones in (b).
The cross-sections of as-tested A3 and B3 specimens were presented in Figure 12(a) and (b), respectively, showing both fracturing along JLR (fracture mode M3). Nearly no dimple was observed in fracture mode M3. The fracture morphologies of both as-tested A3 (Figure 12(e)) and B3 (Figure 12(f)) show that M3 is a typical cleavage fracture. Moreover, due to the difference in the JLR feature mentioned before (Figures 3 and 4), differences in fracture morphology between A3 and B3 were also observed. Compared with B3 (Figure 12(d)), there are deeper ditches between the ridges on the fracture surface of A3 (Figure 12(c)). Moreover, at the ridge of A3, the surface is composed of more cleavage steps (Figure 12(e)) than that of B3 (Figure 12(f)).
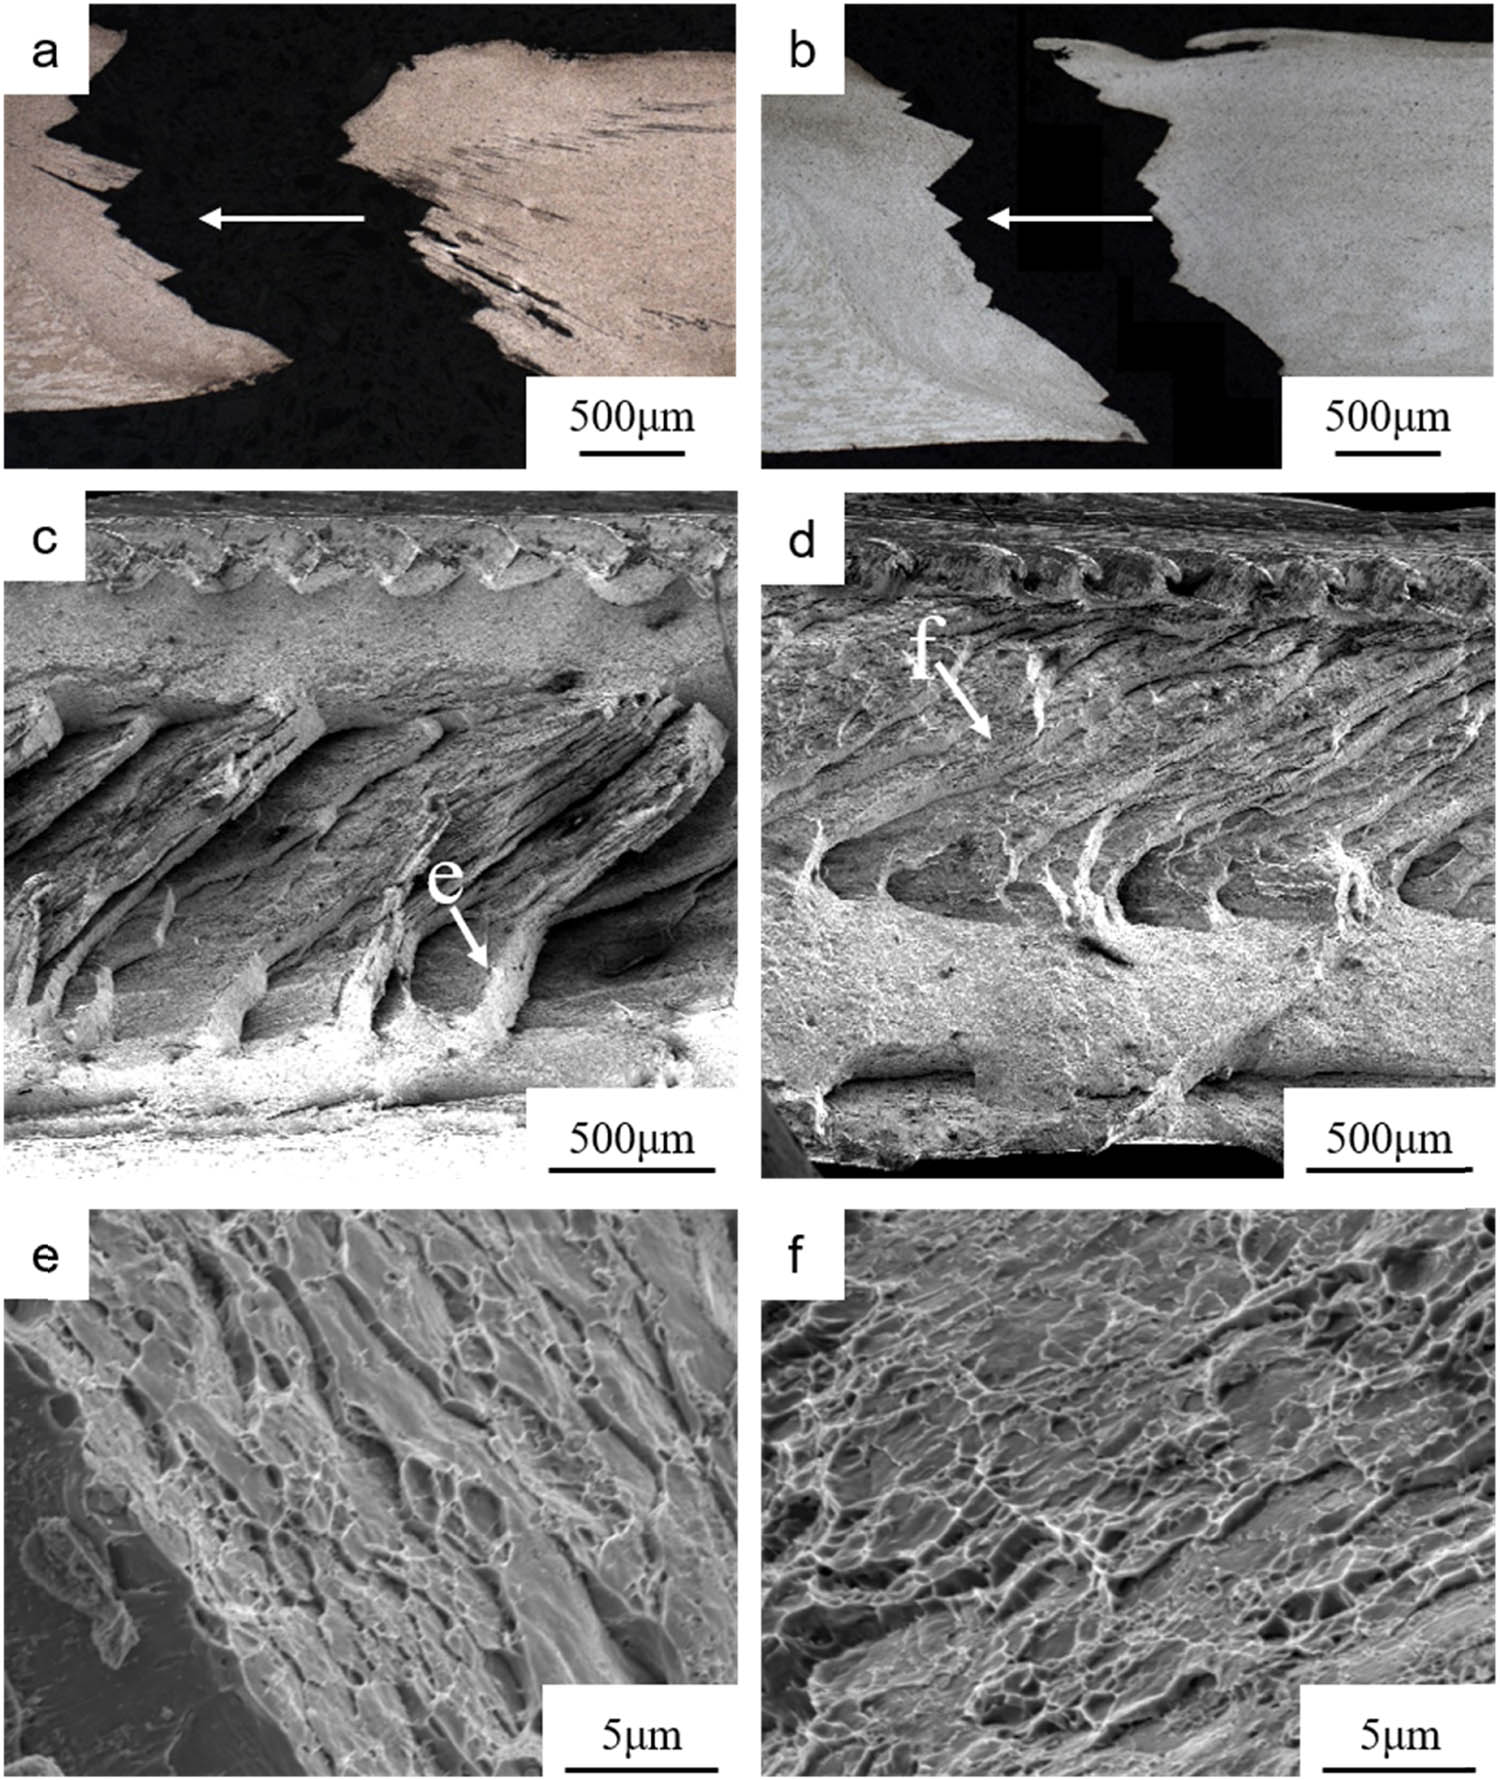
OM of as-tested (a) A3 and (b) B3 specimens and observation direction of SEM indicated by white arrow; SEM of fracture surface with M3: (c) A3 tensile specimen and (d) B3 tensile specimen; (e) local zone indicated by white arrow in (c) rotated counterclockwise about 70° for better observation; (f) local zone indicated by white arrow in (d).
4.3 Effect of heat input on JLR and mechanical properties
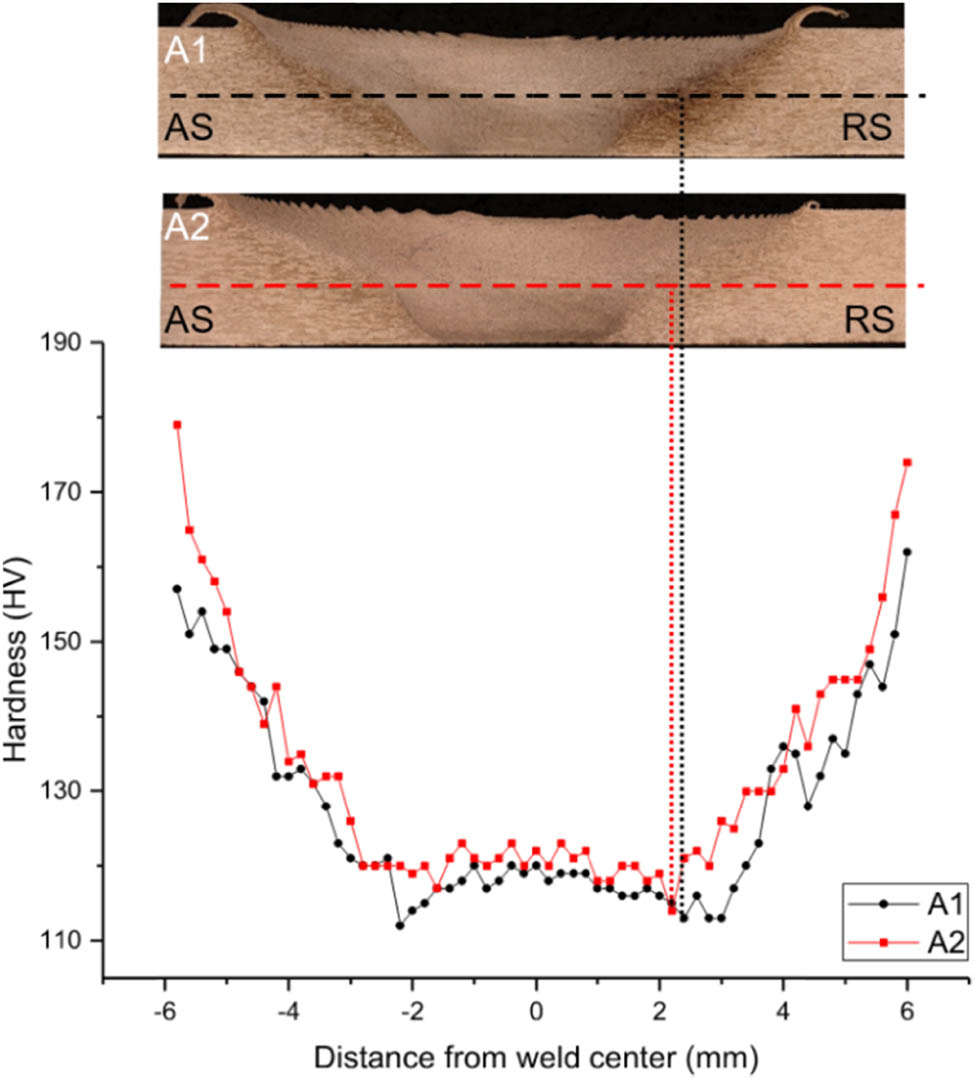
Since there is no butting surface in bead-on-plate FSW (i.e., C series), JLR did not exist in C series joints. Thus, C series could be the control group when discussing the effect of JLR on mechanical properties. 6 × 50 indentations with a horizontal spacing of 0.2 mm and vertical spacing of 0.3 mm (the distance between the bottom row and the bottom surface is 0.2 mm) were performed at the transverse cross-section of C2 (as shown in Figure 13(a)). Figure 13(b) shows the microhardness mapping of C2 with the legend on the right side indicating the hardness values for various colors. The region marked by the red circle has the lowest hardness and the white dash line going through this region along 135° direction is also a low hardness zone in addition to the TMAZ/HAZ boundary. The formation of the lowest hardness region is possibly because of the fact that there is a transition zone composed of lots of coarse elongated non-recrystallized grains. This transition zone is between the pin-affected zone and shoulder-affected zone and the crack initiated preferentially in the transition zone during tension [33]. During tension, all specimens of C series exhibited shear fracture at the retreating side with fracture paths connected to the boundary of TMAZ/HAZ, i.e., the lowest hardness zone (LHZ).
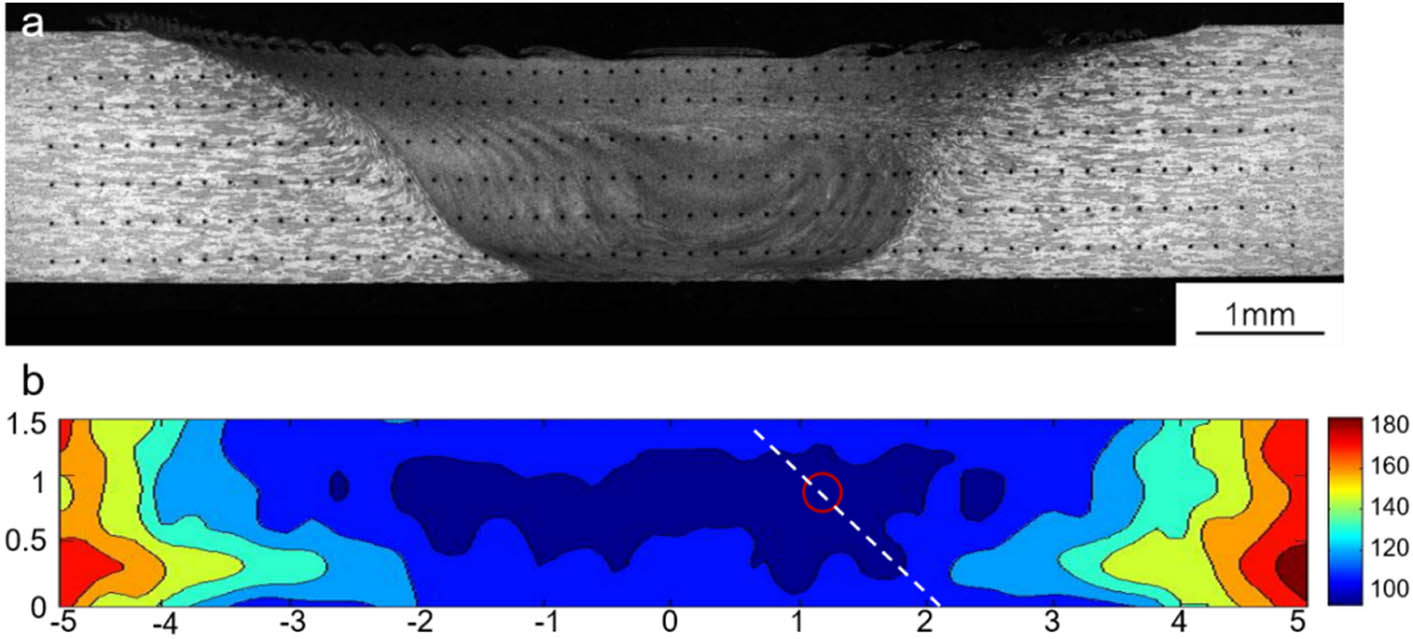
(a) Points of Vickers hardness test of C2; (b) Microhardness mapping of C2.
JLR was observed both in A (butt welded directly) and B series (with butting surface treatment), and JLR of the B series are less discernable than that of the A series. As mentioned before, when TS < 200 mm·min−1, specimens of A1 and B1 did not fracture along the JLR, which indicates the negligible effect of JLR on mechanical properties under this welding condition, whereas the fracture modes of A1 and B1 are also quite different. Specimens of A1 showed a shear fracture at the retreating side (M1), while specimens of B1 showed a shear fracture at the upper part and partially fractured along the onion ring at the bottom part (M2). Previous studies have found that the onion rings, consisting of different scales of grains, texture, and periodical microstructure with alternate precipitate-rich bands, could affect the macroscopic fracture process by leading to a fracture path along the onion rings [34,35,36]. Moreover, Krishnan [37] considered that the oxide particles distributed along onion rings have no obvious effect on the mechanical properties of the FSW Al alloy joints. Thus, the reason why fracture mode M2 occurred in the B1 specimen was considered related to differences in the grain size, texture, and precipitate density in the onion rings structure, while not related to the oxide particles from the original butting surface.
When TS > 200 mm·min−1, both specimens of A series and B series fractured along JLR, and there is a significant decrease in both UTS and elongation (comparing with C series), which together indicate that the JLR deteriorated mechanical properties significantly. Comparing A series with C series when TS > 200 mm·min−1, the UTS exhibited a significant decrease of ∼85 MPa. While comparing B series with A series when TS > 200 mm·min−1, butting surface treatment did improve the mechanical properties. B3 specimens have better mechanical properties than A3 specimens. Similarly, the properties of B4 specimens are better than those of A4. In addition, the property of B2 with fracture mode M3 does not decrease too much while compared to that of A2 with the same fracture mode (Figure 7(c) and (d)). These indicate that butting surface treatment prior to welding can weaken the influence of JLR on mechanical property under higher TS (lower heat input condition). Compared with the joints welded directly, the tensile strength of the joints with butting surface treatment is significantly improved (an increase of ∼54 MPa in UTS) when TS > 200 mm·min−1. However, specimens under high heat input conditions did not fracture due to JLR. From fracture modes in the present work, the bonding strength of JLR (S JLR) and strength of LHZ (S LHZ) are in a state of competition.
The effect of process condition on welding heat input can be characterized by heat index, HI, as follows: HI = RS2/TS. The higher the HI-value, the higher the welding heat input [38]. Figure 14 shows a schematic diagram of the general trend of S JLR and S LHZ with the change of heat input (HI) according to mechanical properties and fracture location of welds under different welding conditions. With the increase of TS, on the one hand, JLR becomes more serrate to make more crack initiation sites so that S JLR decreases. On the other hand, the decrease of heat input makes less dissolution of precipitates [28], which results in the increase of S LHZ. When S JLR is higher than S LHZ, the weld will fracture at LHZ; otherwise, the weld will fracture along JLR. When S JLR is close to S LHZ, the weld could fracture at LHZ or along JLR. These three conditions all exist in our study. In addition, butting surface treatment prior to welding can improve S JLR because less oxide weakens the influence of JLR on S JLR, so the property of B3 and B4 is better than A3 and A4.
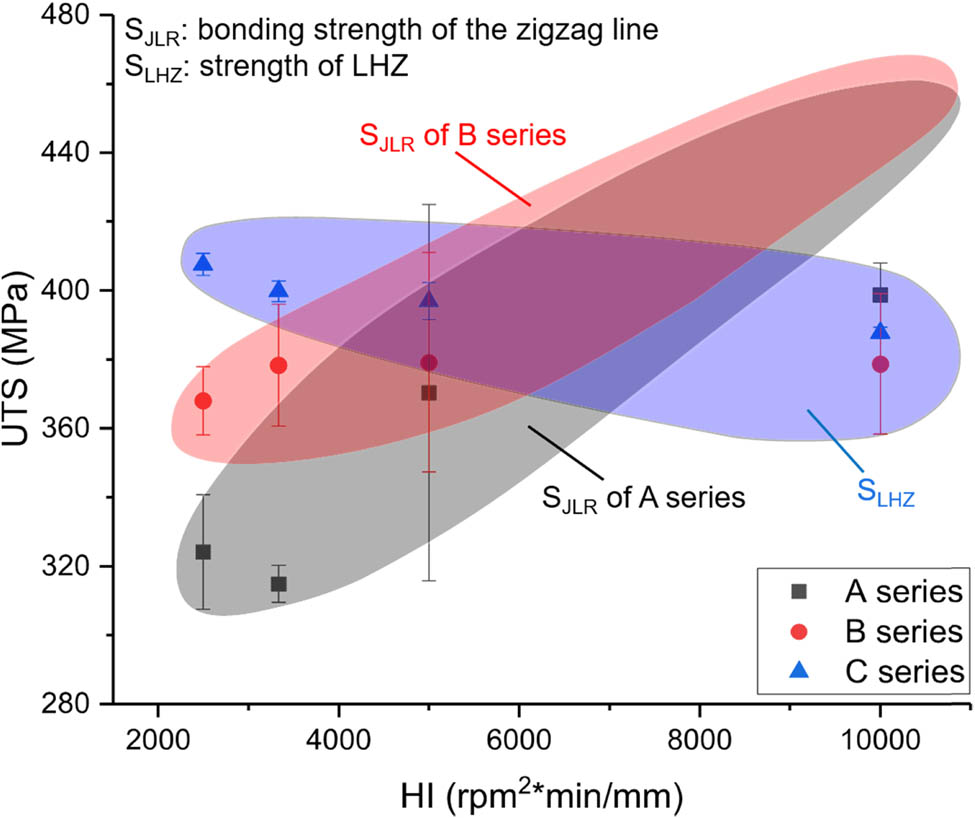
Schematic diagram of the general trend of S JLR and S LHZ with the change of heat input (HI).
5 Conclusions
In the stir zone of 2195-T8 FSW joints, there exists JLR composed of alumina-particle arrays and microcracks generated from the initial butting surface. As TS increases (i.e., the welding heat input decreases), the morphology of JLR in the 2195-T8 FSW joints would evolve from smooth to serrate.
At lower TS (TS < 200 mm·min−1), all tensile specimens under three different butting surface conditions did not fracture along JLR and exhibited similar tensile properties.
As TS increases (i.e., the welding heat input decreases), JLR deteriorates the tensile strength of the 2195-T8 FSW joint, with the joint prematurely fracturing along JLR. TS of 200 mm·min−1 is a turning point. When TS > 200 mm·min−1, tensile strength deteriorated significantly (a decrease of ∼85 MPa in UTS) with specimens fracturing along JLR.
The fracture mode of 2195-T8 FSW joints is determined by the lower one between S JLR and S LHZ. As the welding heat input decreases (i.e., the TS increases), S JLR would decrease because the JLR becomes more serrate to make more crack initiation sites, while S LHZ would increase because of the existence of more precipitates. Thus, JLR tends to be the fracture path at lower welding heat input.
Butting surface treatment by milling off the oxide layer prior to welding could make the JLR in the 2195-T8 FSW joints less distinct and thus improve S JLR, while fracture along JLR could not be avoided. When TS > 200 mm·min−1, the tensile strength of the joints with butting surface treatment is significantly improved (an increase of ∼54 MPa in UTS), but still lower than that of the bead-on-plate, and tensile specimens with butting surface treatment still fractured along JLR.
Acknowledgments
This work was supported by the National Natural Science Foundation of China (Grant No. 52075330), the Research Foundation of Shanghai Academy of Spaceflight Technology-Shanghai Jiao Tong University Joint Research Center for Advanced Spaceflight Technology (Grant No. USCAST2012-12), and the Project of Science and Technology in Inner Mongolia – Action Plan of Shanghai Jiao Tong University (2021PT0045-02-06).
-
Funding information: National Natural Science Foundation of China (Grant No. 52075330), the Research Foundation of Shanghai Academy of Spaceflight Technology-Shanghai Jiao Tong University Joint Research Center for Advanced Spaceflight Technology (Grant No. USCAST2012-12), the Project of Science and Technology in Inner Mongolia – Action Plan of Shanghai Jiao Tong University (2021PT0045-02-06).
-
Author contributions: Qingsong Zhang: methodology, investigation, data curation, writing-original draft; An Yan: methodology, investigation, data curation, writing-original draft; Ke Chen: conceptualization, methodology, resources, writing-review & editing, supervision, project administration, funding acquisition; Fengbo Dong: resources, supervision; Hongde Jia: resources, supervision; Min Wang: resources, supervision.
-
Conflict of interest: The authors state no conflict of interest.
References
[1] Lavernia, E. J., T. S. Srivatsan, and F. A. Mohamed. Strength, deformation, fracture behaviour and ductility of aluminium-lithium alloys. Journal of Materials Science, Vol. 25, 1990, pp. 1137–1158.10.1007/BF00585420Suche in Google Scholar
[2] Qin, H., H. Zhang, and H. Wu. The evolution of precipitation and microstructure in friction stir welded 2195-T8 Al–Li alloy. Materials Science and Engineering A, Vol. 626, 2015, pp. 322–329.10.1016/j.msea.2014.12.026Suche in Google Scholar
[3] Pickens, J. R. Recent developments in the weldability of lithium-containing aluminium alloys. Journal of Materials and Science, Vol. 25, 1990, pp. 3035–3047.10.1007/BF00587647Suche in Google Scholar
[4] Yang, M., J. Lu, H. Wang, Y. Liu, H. Yang, W. Zhang, et al. Effect of the laser power on the microstructure and mechanical properties of the laser-MIG hybrid welding joints of the 2195 Al–Li alloy. Science and Technology of Welding and Joining, Vol. 26, No. 1, 2020, pp. 75–83.10.1080/13621718.2020.1837482Suche in Google Scholar
[5] Wu, S., Z. Lei, B. Li, J. Liang, and Y. Chen. Hot cracking evolution and formation mechanism in 2195 Al-Li alloy printed by laser powder bed fusion. Additive Manufacturing, Vol. 54, 2022, id. 102762.10.1016/j.addma.2022.102762Suche in Google Scholar
[6] Mishra, R. S. and Z. Y. Ma. Friction stir welding and processing. Materials Science and Engineering R, Vol. 50, 2005, pp. 1–78.10.1007/978-3-319-07043-8Suche in Google Scholar
[7] Thomas, W. M., E. D. Nicholas, J. C. Needham, M. G. Murch, P. Templesmith, and C. J. Dawes. Great Britain Patent Application No. 9125978.8, Dec. 1991.Suche in Google Scholar
[8] Zhang, J., X. S. Feng, J. S. Gao, H. Huang, Z. Q. Ma, and L. J. Guo. Effects of welding parameters and post-heat treatment on mechanical properties of friction stir welded AA2195-T8 Al-Li alloy. Journal of Materials Science & Technology, Vol. 34, No. 1, 2018, pp. 219–227.10.1016/j.jmst.2017.11.033Suche in Google Scholar
[9] Chen, P., S. Zou, J. Chen, S. Qin, Q. Yang, Z. Zhang, et al. Effect of rotation speed on microstructure evolution and mechanical properties of nugget zone in 2195-T8 Al-Li alloy friction stir welding joints. Materials Characterization, Vol. 176, 2021, id. 111079.10.1016/j.matchar.2021.111079Suche in Google Scholar
[10] Chen, P., J. Chen, S. Qin, S. Zou, S. Song, T. Jiang, et al. Friction stir welding joints of 2195-T8 Al–Li alloys: Correlation of temperature evolution, microstructure and mechanical properties. Materials Science and Engineering A, Vol. 823, 2021, id. 141501.10.1016/j.msea.2021.141501Suche in Google Scholar
[11] Sato, Y. S., F. Yamashita, Y. Sugiura, S. H. Park, and H. Kokawa. TEM study of an oxide array in the root of a friction stir welded aluminium alloy. Scripta Materialia, Vol. 50, No. 3, 2004, pp. 365–369.10.1016/j.scriptamat.2003.10.008Suche in Google Scholar
[12] Sato, Y. S., H. Takauchi, S. H. C. Park, and H. Kokawa. Characteristics of the kissing-bond in friction stir welded Al alloy 1050. Materials Science and Engineering A, Vol. 405, No. 1–2, 2005, pp. 333–338.10.1016/j.msea.2005.06.008Suche in Google Scholar
[13] Chen, H. B., K. Yan, T. Lin, S. B. Chen, C. Y. Jiang, and Y. Zhao. The investigation of typical welding defects for 5456 aluminum alloy friction stir welds. Materials Science and Engineering A, Vol. 433, No. 1–2, 2006, pp. 64–69.10.1016/j.msea.2006.06.056Suche in Google Scholar
[14] Di, S., X. Yang, G. Luan, and B. Jian. Comparative study on fatigue properties between AA2024-T4 friction stir welds and base materials. Materials Science and Engineering: A, Vol. 435–436, 2006, pp. 389–395.10.1016/j.msea.2006.07.009Suche in Google Scholar
[15] Liu, H. J., Y. C. Chen, and J. C. Feng. Effect of zigzag line on the mechanical properties of friction stir welded joints of an Al–Cu alloy. Scripta Materialia, Vol. 55, No. 3, 2006, pp. 231–234.10.1016/j.scriptamat.2006.04.013Suche in Google Scholar
[16] Zhang, H., S. Luo, and W. Xu. Influence of Welding Speed on Zigzag Line Feature and Tensile Property of a Friction-Stir-Welded Al-Zn-Mg Aluminum Alloy. Journal of Materials Engineering and Performance, Vol. 28, No. 3, 2019, pp. 1790–1800.10.1007/s11665-019-03888-5Suche in Google Scholar
[17] Liang, Z., X. Wang, C. Cai, and D. Wang. Microstructure and mechanical properties of thick plate friction stir welds for 6082-T6 aluminum alloy. High Temperature Materials and Processes, Vol. 38, 2019, pp. 525–532.10.1515/htmp-2018-0074Suche in Google Scholar
[18] Di, S., X. Yang, D. Fang, and G. Luan. The influence of zigzag-curve defect on the fatigue properties of friction stir welds in 7075-T6 Al alloy. Materials Chemistry and Physics, Vol. 104, No. 2–3, 2007, pp. 244–248.10.1016/j.matchemphys.2007.01.023Suche in Google Scholar
[19] Niu, P., W. Li, Z. Zhang, F. Wang, Y. Feng, and M. Fu. Significant effect of oxide on mechanical properties of friction-stir-welded AA2024 joints. Science and Technology of Welding and Joining, Vol. 22, No. 1, 2016, pp. 66–70.10.1080/13621718.2016.1188514Suche in Google Scholar
[20] Chen, H. B., J. F. Wang, G. D. Zhen, S. B. Chen, and T. Lin. Effects of initial oxide on microstructural and mechanical properties of friction stir welded AA2219 alloy. Materials & Design, Vol. 86, 2015, pp. 49–54.10.1016/j.matdes.2015.06.179Suche in Google Scholar
[21] Tao, Y., Z. Zhang, D. R. Ni, D. Wang, B. L. Xiao, and Z. Y. Ma. Influence of welding parameter on mechanical properties and fracture behavior of friction stir welded Al–Mg–Sc joints. Materials Science and Engineering: A, Vol. 612, 2014, pp. 236–245.10.1016/j.msea.2014.06.051Suche in Google Scholar
[22] Ren, S. R., Z. Y. Ma, and L. Q. Chen. Effect of initial butt surface on tensile properties and fracture behavior of friction stir welded Al–Zn–Mg–Cu alloy. Materials Science and Engineering A, Vol. 479, No. 1–2, 2008, pp. 293–299.10.1016/j.msea.2007.06.047Suche in Google Scholar
[23] Zhou, C., X. Yang, and G. Luan. Effect of oxide array on the fatigue property of friction stir welds. Scripta Materialia, Vol. 54, No. 8, 2006, pp. 1515–1520.10.1016/j.scriptamat.2005.12.036Suche in Google Scholar
[24] Le Jolu, T., T. F. Morgeneyer, A. Denquin, and A. F. Gourgues-Lorenzon. Fatigue lifetime and tearing resistance of AA2198 Al–Cu–Li alloy friction stir welds: Effect of defects. International Journal of Fatigue, Vol. 70, 2015, pp. 463–472.10.1016/j.ijfatigue.2014.07.001Suche in Google Scholar
[25] Besel, Y., M. Besel, U. Alfaro Mercado, T. Kakiuchi, T. Hirata, and Y. Uematsu. Influence of local fatigue damage evolution on crack initiation behavior in a friction stir welded Al-Mg-Sc alloy. International Journal of Fatigue, Vol. 99, 2017, pp. 151–162.10.1016/j.ijfatigue.2017.02.024Suche in Google Scholar
[26] Sharma, C., D. K. Dwivedi, and P. Kumar. Effect of welding parameters on microstructure and mechanical properties of friction stir welded joints of AA7039 aluminum alloy. Materials & Design (1980-2015), Vol. 36, 2012, pp. 379–390.10.1016/j.matdes.2011.10.054Suche in Google Scholar
[27] Zhou, N., D. Song, W. Qi, X. Li, J. Zou, and M. M. Attallah. Influence of the kissing bond on the mechanical properties and fracture behaviour of AA5083-H112 friction stir welds. Materials Science and Engineering A, Vol. 719, 2018, pp. 12–20.10.1016/j.msea.2018.02.011Suche in Google Scholar
[28] Fonda, R. W. and J. F. Bingert. Precipitation and grain refinement in a 2195 Al friction stir weld. Metallurgical and Materials Transactions A, Vol. 37A, 2006, pp. 3593–3604.10.1007/s11661-006-1054-2Suche in Google Scholar
[29] Balzarotti, A., A. Bianconi, and E. Burattini. Role of the density of conduction states on theL2,3absorption spectrum of aluminum. Physical Review B, Vol. 9, No. 12, 1974, pp. 5003–5007.10.1103/PhysRevB.9.5003Suche in Google Scholar
[30] Xie, D. G., Z. J. Wang, J. Sun, J. Li, E. Ma, and Z. W. Shan. In situ study of the initiation of hydrogen bubbles at the aluminium metal/oxide interface. Nat Mater, Vol. 14, No. 9, 2015, pp. 899–903.10.1038/nmat4336Suche in Google Scholar PubMed
[31] Li, S. H., W. Z. Han, J. Li, E. Ma, and Z. W. Shan. Small-volume aluminum alloys with native oxide shell deliver unprecedented strength and toughness. Acta Materialia, Vol. 126, 2017, pp. 202–209.10.1016/j.actamat.2016.12.055Suche in Google Scholar
[32] Schneider, J., P. Chen, and A. C. Nunes. Entrapped oxide formation in the friction stir weld (FSW) process. Metallurgical and Materials Transactions A, Vol. 50, No. 1, 2018, pp. 257–270.10.1007/s11661-018-4974-8Suche in Google Scholar
[33] Tao, Y., D. R. Ni, B. L. Xiao, Z. Y. Ma, W. Wu, R. X. Zhang, et al. Origin of unusual fracture in stirred zone for friction stir welded 2198-T8 Al-Li alloy joints. Materials Science and Engineering: A, Vol. 693, 2017, pp. 1–13.10.1016/j.msea.2017.03.079Suche in Google Scholar
[34] Sutton, M. A., B. Yang, A. P. Reynolds, and R. Taylor. Microstructural studies of friction stir welds in 2024-T3 aluminum. Materials Science and Engineering: A, Vol. 323, 2002, pp. 160–166.10.1016/S0921-5093(01)01358-2Suche in Google Scholar
[35] Prangnell, P. B. and C. P. Heason. Grain structure formation during friction stir welding observed by the ‘stop action technique’. Acta Materialia, Vol. 53, 2005, pp. 3179–3192.10.1016/j.actamat.2005.03.044Suche in Google Scholar
[36] Cui, G. R., Z. Y. Ma, and S. X. Li. The origin of non-uniform microstructure and its effects on the mechanical properties of a friction stir processed Al–Mg alloy. Acta Materialia, Vol. 57, No. 19, 2009, pp. 5718–5729.10.1016/j.actamat.2009.07.065Suche in Google Scholar
[37] Krishnan, K. N. On the formation of onion rings in friction stir welds. Materials Science and Engineering: A, Vol. 327, 2002, pp. 246–251.10.1016/S0921-5093(01)01474-5Suche in Google Scholar
[38] Yang, Q., X. Li, K. Chen, and Y. J. Shi. Effect of tool geometry and process condition on static strength of a magnesium friction stir lap linear weld. Materials Science and Engineering: A, Vol. 528, No. 6, 2011, pp. 2463–2478.10.1016/j.msea.2010.12.030Suche in Google Scholar
© 2023 the author(s), published by De Gruyter
This work is licensed under the Creative Commons Attribution 4.0 International License.
Artikel in diesem Heft
- Research Articles
- First-principles investigation of phase stability and elastic properties of Laves phase TaCr2 by ruthenium alloying
- Improvement and prediction on high temperature melting characteristics of coal ash
- First-principles calculations to investigate the thermal response of the ZrC(1−x)Nx ceramics at extreme conditions
- Study on the cladding path during the solidification process of multi-layer cladding of large steel ingots
- Thermodynamic analysis of vanadium distribution behavior in blast furnaces and basic oxygen furnaces
- Comparison of data-driven prediction methods for comprehensive coke ratio of blast furnace
- Effect of different isothermal times on the microstructure and mechanical properties of high-strength rebar
- Analysis of the evolution law of oxide inclusions in U75V heavy rail steel during the LF–RH refining process
- Simultaneous extraction of uranium and niobium from a low-grade natural betafite ore
- Transfer and transformation mechanism of chromium in stainless steel slag in pedosphere
- Effect of tool traverse speed on joint line remnant and mechanical properties of friction stir welded 2195-T8 Al–Li alloy joints
- Technology and analysis of 08Cr9W3Co3VNbCuBN steel large diameter thick wall pipe welding process
- Influence of shielding gas on machining and wear aspects of AISI 310–AISI 2205 dissimilar stainless steel joints
- Effect of post-weld heat treatment on 6156 aluminum alloy joint formed by electron beam welding
- Ash melting behavior and mechanism of high-calcium bituminous coal in the process of blast furnace pulverized coal injection
- Effect of high temperature tempering on the phase composition and structure of steelmaking slag
- Numerical simulation of shrinkage porosity defect in billet continuous casting
- Influence of submerged entry nozzle on funnel mold surface velocity
- Effect of cold-rolling deformation and rare earth yttrium on microstructure and texture of oriented silicon steel
- Investigation of microstructure, machinability, and mechanical properties of new-generation hybrid lead-free brass alloys
- Soft sensor method of multimode BOF steelmaking endpoint carbon content and temperature based on vMF-WSAE dynamic deep learning
- Mechanical properties and nugget evolution in resistance spot welding of Zn–Al–Mg galvanized DC51D steel
- Research on the behaviour and mechanism of void welding based on multiple scales
- Preparation of CaO–SiO2–Al2O3 inorganic fibers from melting-separated red mud
- Study on diffusion kinetics of chromium and nickel electrochemical co-deposition in a NaCl–KCl–NaF–Cr2O3–NiO molten salt
- Enhancing the efficiency of polytetrafluoroethylene-modified silica hydrosols coated solar panels by using artificial neural network and response surface methodology
- High-temperature corrosion behaviours of nickel–iron-based alloys with different molybdenum and tungsten contents in a coal ash/flue gas environment
- Characteristics and purification of Himalayan salt by high temperature melting
- Temperature uniformity optimization with power-frequency coordinated variation in multi-source microwave based on sequential quadratic programming
- A novel method for CO2 injection direct smelting vanadium steel: Dephosphorization and vanadium retention
- A study of the void surface healing mechanism in 316LN steel
- Effect of chemical composition and heat treatment on intergranular corrosion and strength of AlMgSiCu alloys
- Soft sensor method for endpoint carbon content and temperature of BOF based on multi-cluster dynamic adaptive selection ensemble learning
- Evaluating thermal properties and activation energy of phthalonitrile using sulfur-containing curing agents
- Investigation of the liquidus temperature calculation method for medium manganese steel
- High-temperature corrosion model of Incoloy 800H alloy connected with Ni-201 in MgCl2–KCl heat transfer fluid
- Investigation of the microstructure and mechanical properties of Mg–Al–Zn alloy joints formed by different laser welding processes
- Effect of refining slag compositions on its melting property and desulphurization
- Effect of P and Ti on the agglomeration behavior of Al2O3 inclusions in Fe–P–Ti alloys
- Cation-doping effects on the conductivities of the mayenite Ca12Al14O33
- Modification of Al2O3 inclusions in SWRH82B steel by La/Y rare-earth element treatment
- Possibility of metallic cobalt formation in the oxide scale during high-temperature oxidation of Co-27Cr-6Mo alloy in air
- Multi-source microwave heating temperature uniformity study based on adaptive dynamic programming
- Round-robin measurement of surface tension of high-temperature liquid platinum free of oxygen adsorption by oscillating droplet method using levitation techniques
- High-temperature production of AlN in Mg alloys with ammonia gas
- Review Article
- Advances in ultrasonic welding of lightweight alloys: A review
- Topical Issue on High-temperature Phase Change Materials for Energy Storage
- Compositional and thermophysical study of Al–Si- and Zn–Al–Mg-based eutectic alloys for latent heat storage
- Corrosion behavior of a Co−Cr−Mo−Si alloy in pure Al and Al−Si melt
- Al–Si–Fe alloy-based phase change material for high-temperature thermal energy storage
- Density and surface tension measurements of molten Al–Si based alloys
- Graphite crucible interaction with Fe–Si–B phase change material in pilot-scale experiments
- Topical Issue on Nuclear Energy Application Materials
- Dry synthesis of brannerite (UTi2O6) by mechanochemical treatment
- Special Issue on Polymer and Composite Materials (PCM) and Graphene and Novel Nanomaterials - Part I
- Heat management of LED-based Cu2O deposits on the optimal structure of heat sink
- Special Issue on Recent Developments in 3D Printed Carbon Materials - Part I
- Porous metal foam flow field and heat evaluation in PEMFC: A review
- Special Issue on Advancements in Solar Energy Technologies and Systems
- Research on electric energy measurement system based on intelligent sensor data in artificial intelligence environment
- Study of photovoltaic integrated prefabricated components for assembled buildings based on sensing technology supported by solar energy
- Topical Issue on Focus of Hot Deformation of Metaland High Entropy Alloys - Part I
- Performance optimization and investigation of metal-cored filler wires for high-strength steel during gas metal arc welding
- Three-dimensional transient heat transfer analysis of micro-plasma arc welding process using volumetric heat source models