Effect of cold-rolling deformation and rare earth yttrium on microstructure and texture of oriented silicon steel
-
Zhihong Guo
 ,
Liguang Zhu
,
Yuanxiang Zhang
,
Liguang Zhu
,
Yuanxiang Zhang

Abstract
In order to study the effect of cold-rolling deformation and rare earth Y on the microstructure and texture of 3.0% Si-oriented silicon steel, the microstructure and texture of cold-rolled oriented silicon steel with 60, 72, and 86% deformation are analyzed using electron backscatter diffraction and image analysis software. The experimental results show that the deformation band becomes narrower and the distribution of shear bands becomes denser with increasing cold-rolling deformation. Compared to the Y-free steel, cold-rolled sheet containing rare earth Y has greater shear bands. The pinning effect of rare earth Y hinders the dislocation movement, which leads to the increase of kernel average misorientation value and shear bands. With the increase of cold-rolling deformation, the texture concentrates on α and λ. This is mainly due to the change from {100} 〈001〉 to {001} 〈110〉, intensifying λ texture, and the change from {111} 〈112〉 to {111} 〈110〉, thus strengthening the α texture. The texture strength of cold-rolled sheets can be decreased by rare earth Y. But the γ texture strength in cold-rolled sheets containing Y is significantly higher than in those without Y. The γ texture strength can reach up to 7.3, and the strong points are mainly {111} 〈112〉. This is because the number of inclusions in steel increases with the addition of rare earth Y. In the process of grain nucleation, the {111} oriented grains nucleate heterogeneously on the inclusions. It forms a large number of {111} oriented grains and improves the γ texture strength.
1 Introduction
The quality of oriented silicon steel is often regarded as an important symbol to measure the manufacturing technology level of a country’s special steel, because of its various manufacturing processes. The performance of silicon steel is affected by many production parameters of complex processes. Cold rolling is a key process during the production of silicon steel. The cold-rolling parameters have an influence on the development of primary and secondary recrystallization microstructure and texture [1,2]. The {111} 〈112〉 component of the cold-rolled texture is strongest when a suitable cold-rolled depression is selected [3]. The Goss grains can be nucleated in shear zones and grain boundaries. The Goss nuclei formed in the {111} 〈112〉 matrix shear zone are highly oriented and can be used as effective “seeds” for secondary recrystallization [4]. When the reduction rate is lower than 90%, it is beneficial to the formation of the Goss texture after primary recrystallization [5]. However, the excessive reduction will lead to a decrease in Goss texture [6]. Under the same reduction, the less cold rolling passes and the greater rolling force causes the greater surface shear strain. With the same cold rolling passes, the greater the reduction rate of the first pass, the greater the surface shear strain at the initial stage of deformation. The texture evolution behavior during cold rolling is affected by the surface shear strain at the initial stage of deformation [7]. The production of oriented silicon steel generally adopts one-time or two-time cold rolling. The two-time cold rolling with MnS as the main inhibitor usually has a reduction rate of 60–70% during the first cold rolling with 3–4 passes. Then, the silicon steel sheet is treated with intermediate annealing. The reduction of second cold rolling with 2–3 passes is 50–55% [8].
Rare earth plays a crucial role in the production of oriented silicon steel [9]. It segregates at the grain boundary and reduces the grain boundary energy and the driving force of grain growth. Rare earth hinders grain growth and refines the primary recrystallized grains [10]. In addition, rare earth promotes grain growth during high-temperature annealing. It also plays the role of purifying molten steel and forming inclusions to pin the grain boundary, providing good conditions for Goss grain growth during high-temperature annealing [11,12]. The research results show that Ce can expand the austenite phase zone. Rare-earth-oriented electrical steels were also found to have a coarser and more homogeneous fiber organization after rolling, with the inhibitors being fine, diffuse, and uniformly distributed [13]. Zhou et al. [14] added different contents of rare earth Y to high silicon steel. The results showed that the grain size gradually decreased with the increase of Y content. It indicates that Y had the effect of refining grains.
Based on the above research studies, Y free and 0.075 wt% Y oriented silicon steel are studied in this article. The main aims are (1) to investigate how the microstructure and texture of orientated silicon steel change under various cold-rolled reduction rates, to further investigate acceptable cold-rolled processes, and to establish the experimental basis for the ensuing decarburization and high-temperature annealing processes; (2) to analyze the evolution of shear bands and various types of texture in cold-rolled sheets under the action of rare earth inclusions, and to investigate the mechanism of the influence of rare earth Y on the microstructure and texture of cold-rolled oriented silicon steel sheets, so as to provide theoretical support and practical guidance for the application of rare earth Y in silicon steel and the development of oriented silicon steel with excellent performance.
2 Materials and methods
A 2.5 mm hot-rolled silicon steel sheet was used as cold-rolling raw material in the experiment, and the main chemical composition is shown in Table 1.
Chemical composition of oriented silicon steel (mass fraction, %)
| composition (%) | C | Si | Mn | P | S | Al | N | O | Y |
|---|---|---|---|---|---|---|---|---|---|
| Y-free | 0.050 | 2.98 | 0.22 | 0.01 | 0.018 | 0.028 | 0.0043 | 0.0021 | 0 |
| 0.075 wt% Y | 0.014 | 2.97 | 0.22 | 0.01 | 0.011 | 0.035 | 0.0045 | 0.0020 | 0.078 |
The sheets were cold rolled to 1, 0.7, and 0.35 mm, respectively. Cold-rolling reduction rates for the normalized sheet were 60, 72, and 86%. The cold-rolling temperature was 300℃. Taking the specimens with a size of 12(RD) mm × 10(TD) mm to study the microstructure. the specimens were corroded with a 4% nitric acid alcohol solution for around 10 s after mechanical polishing.
The scanning electron microscopy and electron probe microanalysis were used to analyze the shape, amount, size, distribution, and composition of inclusions in the steel. The optical microscope and electron backscatter diffraction were used to analyze the microstructure and texture of a cold-rolled sheet. CHANNEL 5 software was used to analyze the experimental data, and the orientation line was created from the test results. The longitudinal segment of the specimen served as the observation surface for structure and texture (RD-ND surface).
3 Results and analysis
3.1 Influence of rare earth Y on inclusions in hot-rolled sheets
The morphology and chemical composition of inclusions in hot-rolled sheets of orientated silicon steel are shown in Figure 1. The inclusions in Y-free steel are mainly long strips of MnS and irregular MnS–Al2O3. With the addition of rare earth Y, the inclusions in the hot-rolled sheet are mainly spherical or elliptical Y2O2S. However, silicon steel with Y does not contain MnS or MnS–Al2O3-type inclusions. The element distribution of inclusions is analyzed, as shown in Figures 2–4. Al2O3 makes up the core of the MnS–Al2O3 inclusions in Figure 3. MnS makes up the outer layer. In Figure 4, the O, S, and Y elements in Y2O2S inclusions are evenly distributed. This is because the rare earth Y easily combines with oxygen and sulfur in the steel to form spherical yttrium sulfides, yttrium sulfur oxides, or yttrium composite inclusions, effectively inhibiting the formation of long strips of MnS inclusions in the steel. Al2O3 inclusions in steel are changed into rare earth sulfur oxides due to the great deoxidization capacity of rare earth Y. Spherical or elliptical rare earth sulfides keep their original shape during hot rolling [3].

Morphology and chemical composition of inclusions in hot-rolled sheets of oriented silicon steel: (a)–(c) Y-free steel; (d)–(f) Y-bearing steel.
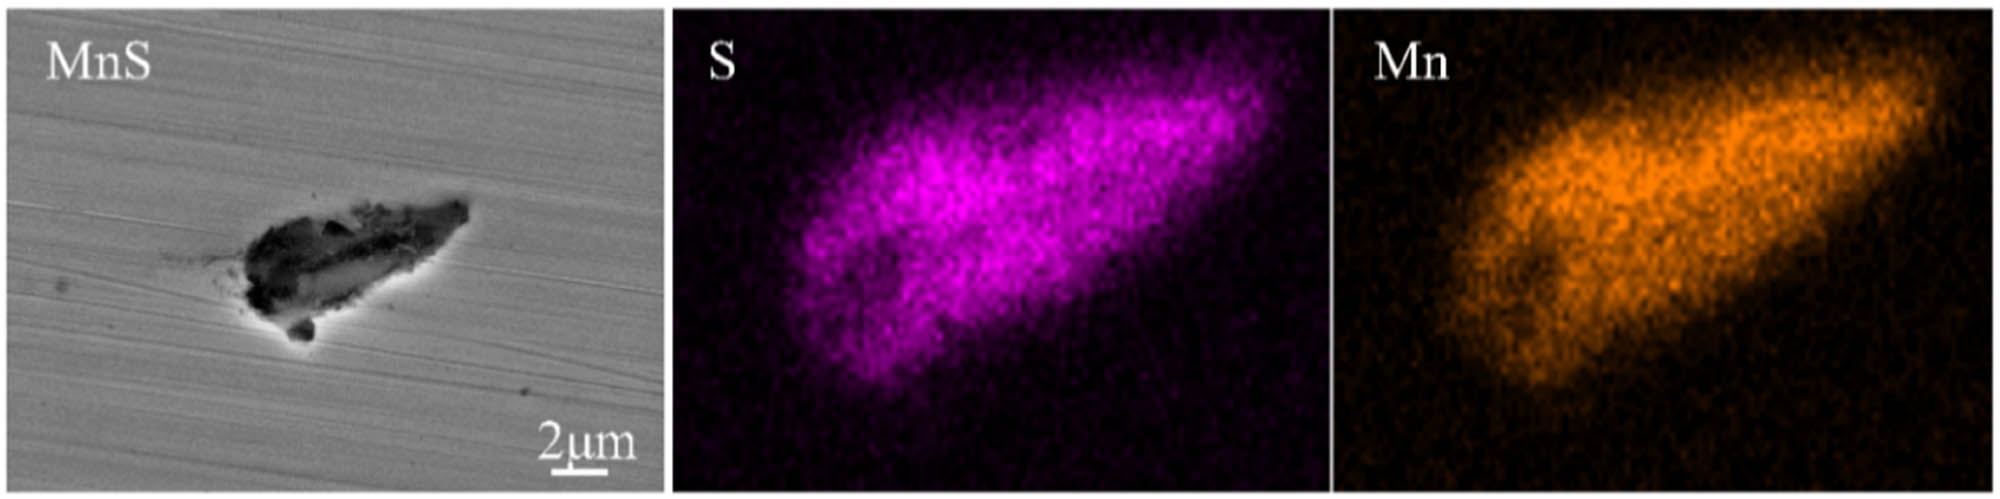
Element distribution of MnS inclusions in hot-rolled Y-free steel.

Element distribution of MnS–Al2O3 inclusions in hot-rolled Y-free steel.

Element distribution of Y2O2S in hot-rolled Y-bearing steel.
3.2 Effect of deformation and rare earth Y on the microstructure of cold-rolled sheet
The deformation structure of orientated silicon steel with various cold-rolling reduction rates is shown in Figure 5. As the reduction rate increases, both Y-free and Y-bearing oriented silicon steel show narrower deformation zones and a more dense distribution of shear zones within the steel. This phenomenon is more obvious in the 0.075 wt% Y oriented silicon steel. The deformation band narrows due to the combined effects of great positive pressure and shear force, which may be caused by an increased deformation and rolling force. The shear bands are widely spaced because of the constant buildup of strain. Further shear deformation will be introduced by the pinning effect brought by the inclusions of rare earth Y, leading to more severe plastic deformation.

Corresponding KAM distribution diagram of different deformations: (a) 86% Y-free; (b) 86% Y-bearing; (c) 72% Y-free; (d) 72% Y-bearing; (e) 60% Y-free; (f) 60% Y-bearing.
Some studies have shown that the formation of shear bands is also related to the obstruction of dislocation slip [15]. The material will undergo plastic deformation in the form of amorphous shear band deformation when the normal dislocation slip is suppressed. Therefore, in order to further quantitatively explain the effect of rare earth Y on the formation of shear bands in the rolling process of oriented silicon steel, the distribution of local misorientation (kernel average misorientation [KAM]) in the corresponding region is shown in Figure 5. By computing the average orientation difference between consecutive scanning locations in the grain, KAM quantitatively depicts the level of plastic deformation. Although the dislocation density created in grains with various orientations during the deformation of polycrystalline metals varies substantially, the deformation variable controls the material’s average dislocation density. The larger the deformation, the higher the average dislocation density in the material. As a result, the KAM value is indirectly positively connected with the average level of dislocation density; specifically, the KAM value increases with increasing global dislocation density. As shown in the picture, the area with a low KAM value is represented by dark blue, which qualitatively indicates that this area has a reduced dislocation density. On the other hand, the KAM value and the dislocation density increase when it is close to the green or even red zone.
The comparison of KAM statistical values of Y-free and 0.075 wt% Y silicon steel with different reduction rates is shown in Figure 6. It is not obvious to notice that KAM statistical values are more frequently distributed between 1.5° and 2.5°. In comparison to the 60% specimens, the 72% specimens have a higher KAM statistic. In comparison to 72% specimens, the KAM statistic for 86% specimens is lower.

KAM statistical chart of cold-rolled plate: (a) 86% Y-free; (b) 86% Y-bearing; (c) 72% Y-free; (d) 72% Y-bearing; (e) 60% Y-free; (f) 60% Y-bearing.
While the distribution of KAM values in specimens with and without rare earth Y is more unequal, it is more consistent in specimens containing Y. Therefore, the KAM value and dislocation density are both increased by the addition of 0.075 wt% Y. This may be due to the fact that rare earth Y hinders the dislocation movement during the plastic deformation of oriented silicon steel, resulting in the increase of dislocation density. This phenomenon has been verified by the influence of rare earth Y on inclusions in hot-rolled plates. Compared with the specimen without Y, Y2O2S has a strong pinning force, which further hinders the dislocation movement. Dislocations cannot achieve the instantaneous large strain forced by external loading in time. And ferrite polycrystals choose to deform plastically by instantaneous collapse [16]. The pinning action of rare earth Y leads to the obstruction of dislocation movement, which intensifies this process. This process leads to the increase of KAM value and further leads to coarser shear bands.
3.3 Effect of deformation and rare earth Y on texture of cold-rolled sheet
The IPF (image processing facility) diagram and ODF diagram of the first cold rolling of orientated silicon steel are shown in Figures 7–9 (φ 2 = 45° and φ 2 = 0°). It can be seen that in the 1 mm cold-rolled sheet, there is a strong λ texture near the {100} 〈100〉 texture and {100} 〈110〉 texture in the Y-free specimen. The strength of the λ texture is 4. There are {114} 〈110〉 texture and {112} 〈110〉 texture in 0.075 wt% Y, the strength of both textures is 4. For the 0.7 mm cold-rolled sheet, the specimen without Y has strong α texture and γ texture, and the strength of both textures is 6. The strength of α texture in 0.075 wt% Y specimen is 6. In the 0.35 mm cold-rolled sheet without Y, there are α texture and λ texture near the {100} 〈110〉 texture. And the strength of both textures is 10. The specimen containing 0.075 wt% Y has α texture and λ texture near the {100} 〈110〉 texture. The strength of both textures is 6.

IPF diagram of different cold-rolling deformation of grain-oriented silicon steel: (a) 86% Y-free; (b) 86% Y-bearing; (c) 72% Y-free; (d) 72% Y-bearing; (e) 60% Y-free; (f) 60% Y-bearing.

ODF diagram of different cold-rolling deformation of grain-oriented silicon steel: (a) 86% Y-free φ 2 = 0°; (b) 86% Y-free φ 2 = 45°; (c) 86% Y-bearing φ 2 = 0°; (d) 86% Y-bearing φ 2 = 45°; (e) 72% Y-free φ 2 = 0°; (f) 72% Y-free φ 2 = 45°.

ODF diagram of different cold-rolling deformation of grain-oriented silicon steel: (a) 72% Y-bearing φ 2 = 0°; (b) 72% Y-bearing φ 2 = 45°; (c) 60% Y-free φ 2 = 0°; (d) 60% Y-free φ 2 = 45°; (e) 60% Y-bearing φ 2 = 0°; (f) 60% Y-bearing φ 2 = 45°.
It can be seen that there are high-strength α texture and γ texture in the cold-rolled sheet. This is because during the cold-rolling process, the normalized sheet texture is affected by the rolling force and will wrap around the 〈110〉//RD axis and 〈111〉//ND axis rotation, resulting in strong α texture and γ texture [17].
Figures 10–12 provide the orientation line of Y-free specimens and 0.075 wt% Y specimens in order to more clearly assess the impact of deformation and rare earth Y on the texture of oriented silicon steel cold-rolled sheet. When the cold-rolling deformation is 60%, the texture is mainly α texture, {100} 〈001〉, {111} 〈110〉, {001} 〈110〉. The α texture is the strongest of the several types of weaves. With the cold-rolling deformation increasing to 72%, the main texture components are still α texture, {100} 〈001〉, {111} 〈110〉, {001} 〈110〉, and the strength has been enhanced to varying degrees. The cold-rolling deformation continues to increase to 82%, the component strength of {100} 〈001〉, {111} 〈110〉 decreases compared with that of 60%. And the strength of {001} 〈110〉 and α texture increase. It can be seen that the cold-rolling texture of oriented silicon steel gradually changes from {100} 〈001〉, {111} 〈110〉 to {001} 〈110〉 and α texture. When the deformation is large, the texture is concentrated in α and λ texture.

Distribution diagram of orientation lines of Y-free specimen: (a) η orientation line; (b) γ orientation line; (c) λ orientation line.

Distribution diagram of orientation lines of Y-bearing specimen: (a) η orientation line; (b) γ orientation line; (c) λ orientation line.

Distribution diagram of α orientation line of two cold-rolled sheets: (a) Y-free; (b) Y-bearing.
This is mostly due to the grains progressively rotating from their original orientation to a stable orientation throughout the rolling process. During the rolling process, the crystal orientation will change in two ways [18].
(A) {001} 〈100〉 → {001} 〈110〉 → {112} 〈110〉 → {223} 〈110〉
(B) {110} 〈100〉 → {554} 〈225〉 → {111} 〈112〉 → {111} 〈110〉 → {223} 〈110〉
{100} 〈001〉 changes to {001} 〈110〉 along route A, thereby strengthening λ texture. And {111} 〈110〉 is γ texture, also α fiber texture. Part of γ texture {111} 〈112〉 turns to {111} 〈110〉 along route B, strengthening {111} 〈110〉 components of α texture.
When comparing the γ orientation lines in Figures 10 and 11, it is clear that the γ texture strength of the 0.075 wt% Y specimens is greater than the specimens without Y. The γ texture of the specimens containing Y can reach up to 7.5. The cold-rolling texture of 0.075 wt% Y specimen is mainly formed γ texture with {111} 〈112〉 as the strong point. Studies have shown that during annealing, Goss texture will nucleate first in the shear band of {111} 〈112〉 texture, and there is a 35°orientation difference angle between {111} 〈112〉 texture and Goss texture. Between them, there is a large angle grain boundary, which belongs to the category of high-energy grain boundary, and the diffusion rate is high. So Goss texture grains can swallow the nearby {111} 〈112〉 texture and grow up [19]. As can be seen from the (c) λ orientation in Figures 10 and 11, the λ texture strength of 0.075 wt% Y specimen is lower than that of the specimen without Y, but the strongest points of the two specimens are almost the same.
There is a little difference in the texture orientation of the two steels, as can be observed from the α orientation line in Figure 12. The strength of α texture with 60% deformation of Y bearing plates is higher. The highest value is 6.7, and the peak value changes from {001} 〈110〉 to {112} 〈110〉. The strength point of cold-rolled plate with 72% deformation changes from {111} 〈110〉 to {223} 〈110〉. The α texture strength of the specimens with rare earth Y decreases gradually with the increase of the reduction rate. In conclusion, the η texture strength of 0.075 wt% Y specimens is almost unchanged, the strength of λ texture decreases, and the overall strength of γ texture increases. The reason is that the amount of inclusions in steel increases with the addition of rare earth Y. In the process of grain nucleation, the grains with {111} orientation preferentially nucleate on the inclusions, thus forming a large number of grains with {111} orientation and improving the γ texture strength.
4 Conclusion
The distribution of the shear zone gets denser and the deformation zone gets smaller as the cold-rolling reduction rate rises. This is because the shape variable and rolling force have increased, and the shear force and increased positive pressure together have caused the deformation zone to contract. Due to the continuous accumulation of strain, the distribution of shear bands is dense.
Cold-rolled sheets with rare earth Y have a smaller and a denser dispersion of shear bands than cold-rolled sheets without Y. And the KAM value of the specimens is more evenly distributed, which improves the dislocation density. This is probably due to the combination of rare earth Y with the oxygen and sulfur in the steel to form an oxygen sulfide. This kind of inclusion has a strong pinning effect. This action causes dislocation movement to be blocked and the ferrite polycrystals will choose to deform plastically in a transient collapse, further leading to wider shear bands.
The three essential components of texture are α texture, λ texture, and γ texture. When the cold-rolling reduction rate increases from 60 to 72%, the texture is mainly α texture, {100} 〈001〉, {111} 〈110〉, {001} 〈110〉. The strength of these textures increases to varying degrees. As the cold-rolled reduction rate continues to increase to 82%, the strength of {100} 〈001〉 and {111} 〈110〉 components decreases, and the texture of {001} 〈110〉 and α increases. This is because in the rolling process, {100} 〈001〉 changes to {001} 〈110〉 along route A, thus strengthening the λ texture. However, {111} 〈110〉 is both γ texture and α fiber texture. A part of γ texture {111} 〈112〉 is transferred to {111} 〈110〉 along route B, strengthening {111} 〈110〉 components of α texture.
With the addition of rare earth Y, the texture strength of η is almost unchanged, the texture strength of λ is decreased, while the overall strength of γ is increased, and the orientation deviation of α is large. This is because a high number of grains with {111} orientation appear when the {111} oriented grains preferentially nucleate inhomogeneously on the inclusions. The grains with {111} orientation strengthen the γ texture.
Acknowledgments
The work is financial supported by National Nature Science Foundation of China under grant Nos. 51974102, 52204341, 52204342 and 51974103, Hebei Provincial Foundation under grant Nos. E2021208006, E2021208017 and E2019208308, Key R & D projects in Hebei Province Nos. QN2019029, 20311003D and 19211009D.
-
Funding information: The work is financially supported by the National Nature Science Foundation of China under grant Nos. 51974102, 52204341, 52204342, and 51974103; Hebei Provincial Foundation under grant Nos. E2021208006, E2021208017, and E2019208308; Key R & D projects in Hebei Province Nos. QN2019029, 20311003D, and 19211009D.
-
Author contributions: Yaxu Zheng and Zhihong Guo conceived the work, Liguang Zhu and Pengjun Liu performed the experiment and analyzed the data. Zhihong Guo and Pengjun Liu wrote the manuscript with help from all the other authors. Yaxu Zheng supervised the whole project.
-
Conflict of interest: The authors state no conflict of interest.
References
[1] Tang, S. Q., S. Q. Bao, J. H. Chen, G. Zhao, L. Peng, and J. X. Guo. Effect of cold rolling reduction rate on primary and secondary recrystallization of Hi-B steel. Heat Treatment of Metals, Vol. 41, No. 9, 2016, pp. 78–81.Search in Google Scholar
[2] Wang, Y., Y. B. Xu, Y. X. Zhang, and G. D. Wang. Effect of cold rolling process on initial recrystallization texture of oriented silicon steel. Journal of Northeastern University (natural science edition), Vol. 35, No. 2, 2014, pp. 217–222.Search in Google Scholar
[3] Wang, L. M., Q. Lin, J. W. Ji, and D. N. Lan. New study concerning development of application of rare earth metals in steels. Journal of Alloys and Compounds, Vol. 408, 2006, pp. 384–386.10.1016/j.jallcom.2005.04.090Search in Google Scholar
[4] Park, J. T. and J. A. Szpunar. Evolution of recrystallization texture in nonoriented electrical steels. Acta Materialia, Vol. 51, No. 11, 2003, pp. 3037–3051.10.4028/0-87849-434-0.533Search in Google Scholar
[5] Feng, F. Microstructure evolution and texture regulation mechanism of electrical steel fabricated by strip casting, Northeastern University, Shenyang, Liaoning Province, 2019.Search in Google Scholar
[6] Lin, X. F., J. Liu, C. Y. Cheng, R. W. Wang, W. S. Chen, and J. Zhang. Effect of cold rolling amount on microstructure of oriented silicon steel very thin strip. Heat Treatment of Metals, Vol. 37, No. 11, 2012, pp. 76–78.Search in Google Scholar
[7] Zhang, B. Research on Microstructure and texture evolution behavior and influencing factors of ultra-thin oriented silicon steel, China Iron and Steel Research Institute, Haidian District, Beijing, 2021.Search in Google Scholar
[8] He, Z. Z., Y. Zhao, and H. W. Luo. Electrical steel, Metallurgical Industry Press, Beijing, 2012.Search in Google Scholar
[9] Liu, D. F. Study on toughening and molding mechanism of rare earth y microalloyed 6.5%si high silicon steel and microstructure and texture evolution during hot rolling, Jiangxi University of Science and Technology, Ganzhou, Jiangxi Province, 2020.Search in Google Scholar
[10] Liu, L. Z., Z. L. Jin, H. P. Ren, P. Y. Gao, and M. Y. Dong. Effect of rare earth on primary recrystallization structure and texture of oriented silicon steel. Rare Earth, Vol. 36, No. 6, 2015, pp. 1–6.Search in Google Scholar
[11] Gao, P. Y., H. P. Ren, Z. L. Jin, L. Z. Liu, C. J. Shi, and M. Y. Dong. Effect of Ce on high temperature annealing microstructure and texture of oriented silicon steel. Rare Earth, Vol. 36, No. 1, 2015, pp. 59–63.Search in Google Scholar
[12] Liu, L. Z. Effect of rare earth on Microstructure and texture evolution of oriented silicon steel, Inner Mongolia University of Science and Technology, Baotou, Inner Mongolia, 2014.Search in Google Scholar
[13] Qu, M. Q., H. P. Ren, Z. L. Jin, J. Yang, and Y. H. Li. Effect of rare earth Ce on Microstructure and inhibitor evolution of 3% oriented silicon steel. Heat Treatment of Metals, Vol. 42, No. 7, 2017, pp. 26–30.Search in Google Scholar
[14] Zhou, Q. Y., J. Qin, H. B. Zhao, and X. X. Xu. Effect of Yttrium on microstructure, texture and magnetic properties of cold rolled high silicon steel sheet. Electrical Steel, Vol. 2, No. 3, 2020, pp. 9–13.Search in Google Scholar
[15] Zhou, Q. Y. Study on the effect of rare earth Y on the microstructure, texture and magnetic properties of 6.5wt% Si high silicon steel sheet and strip, Jiangxi University of Science and Technology, Ganzhou, Jiangxi Province, 2021.Search in Google Scholar
[16] Mao, W. M. and P. Yang. Material science principle of electrical steel, Higher Education Press, Xicheng District, Beijing, 2013.Search in Google Scholar
[17] Meng, R. R., Y. H. Duan, Y. L. Feng, and J. Li. Effect of niobium on cold rolling texture of oriented silicon steel. Heat Treatment of Metals, Vol. 45, No. 6, 2020, pp. 178–184.Search in Google Scholar
[18] Lv, K., J. Li, Y. Zhao, and B. Li. Effect of cold rolling reduction rate on primary recrystallization annealing of non inhibitor oriented silicon steel. Journal of Iron and Steel Research, Vol. 28, No. 4, 2016, id. 5.Search in Google Scholar
[19] Yan, M. Q., P. Yang, W. Jiang Qi, Y. J. Fu, and W. M. Mao. Effect of rolling direction on texture evolution of Fe-3% Si alloy. Acta Metallurgica Sinica, Vol. 47, No. 1, 2011, pp. 25–33.Search in Google Scholar
© 2023 the author(s), published by De Gruyter
This work is licensed under the Creative Commons Attribution 4.0 International License.
Articles in the same Issue
- Research Articles
- First-principles investigation of phase stability and elastic properties of Laves phase TaCr2 by ruthenium alloying
- Improvement and prediction on high temperature melting characteristics of coal ash
- First-principles calculations to investigate the thermal response of the ZrC(1−x)Nx ceramics at extreme conditions
- Study on the cladding path during the solidification process of multi-layer cladding of large steel ingots
- Thermodynamic analysis of vanadium distribution behavior in blast furnaces and basic oxygen furnaces
- Comparison of data-driven prediction methods for comprehensive coke ratio of blast furnace
- Effect of different isothermal times on the microstructure and mechanical properties of high-strength rebar
- Analysis of the evolution law of oxide inclusions in U75V heavy rail steel during the LF–RH refining process
- Simultaneous extraction of uranium and niobium from a low-grade natural betafite ore
- Transfer and transformation mechanism of chromium in stainless steel slag in pedosphere
- Effect of tool traverse speed on joint line remnant and mechanical properties of friction stir welded 2195-T8 Al–Li alloy joints
- Technology and analysis of 08Cr9W3Co3VNbCuBN steel large diameter thick wall pipe welding process
- Influence of shielding gas on machining and wear aspects of AISI 310–AISI 2205 dissimilar stainless steel joints
- Effect of post-weld heat treatment on 6156 aluminum alloy joint formed by electron beam welding
- Ash melting behavior and mechanism of high-calcium bituminous coal in the process of blast furnace pulverized coal injection
- Effect of high temperature tempering on the phase composition and structure of steelmaking slag
- Numerical simulation of shrinkage porosity defect in billet continuous casting
- Influence of submerged entry nozzle on funnel mold surface velocity
- Effect of cold-rolling deformation and rare earth yttrium on microstructure and texture of oriented silicon steel
- Investigation of microstructure, machinability, and mechanical properties of new-generation hybrid lead-free brass alloys
- Soft sensor method of multimode BOF steelmaking endpoint carbon content and temperature based on vMF-WSAE dynamic deep learning
- Mechanical properties and nugget evolution in resistance spot welding of Zn–Al–Mg galvanized DC51D steel
- Research on the behaviour and mechanism of void welding based on multiple scales
- Preparation of CaO–SiO2–Al2O3 inorganic fibers from melting-separated red mud
- Study on diffusion kinetics of chromium and nickel electrochemical co-deposition in a NaCl–KCl–NaF–Cr2O3–NiO molten salt
- Enhancing the efficiency of polytetrafluoroethylene-modified silica hydrosols coated solar panels by using artificial neural network and response surface methodology
- High-temperature corrosion behaviours of nickel–iron-based alloys with different molybdenum and tungsten contents in a coal ash/flue gas environment
- Characteristics and purification of Himalayan salt by high temperature melting
- Temperature uniformity optimization with power-frequency coordinated variation in multi-source microwave based on sequential quadratic programming
- A novel method for CO2 injection direct smelting vanadium steel: Dephosphorization and vanadium retention
- A study of the void surface healing mechanism in 316LN steel
- Effect of chemical composition and heat treatment on intergranular corrosion and strength of AlMgSiCu alloys
- Soft sensor method for endpoint carbon content and temperature of BOF based on multi-cluster dynamic adaptive selection ensemble learning
- Evaluating thermal properties and activation energy of phthalonitrile using sulfur-containing curing agents
- Investigation of the liquidus temperature calculation method for medium manganese steel
- High-temperature corrosion model of Incoloy 800H alloy connected with Ni-201 in MgCl2–KCl heat transfer fluid
- Investigation of the microstructure and mechanical properties of Mg–Al–Zn alloy joints formed by different laser welding processes
- Effect of refining slag compositions on its melting property and desulphurization
- Effect of P and Ti on the agglomeration behavior of Al2O3 inclusions in Fe–P–Ti alloys
- Cation-doping effects on the conductivities of the mayenite Ca12Al14O33
- Modification of Al2O3 inclusions in SWRH82B steel by La/Y rare-earth element treatment
- Possibility of metallic cobalt formation in the oxide scale during high-temperature oxidation of Co-27Cr-6Mo alloy in air
- Multi-source microwave heating temperature uniformity study based on adaptive dynamic programming
- Round-robin measurement of surface tension of high-temperature liquid platinum free of oxygen adsorption by oscillating droplet method using levitation techniques
- High-temperature production of AlN in Mg alloys with ammonia gas
- Review Article
- Advances in ultrasonic welding of lightweight alloys: A review
- Topical Issue on High-temperature Phase Change Materials for Energy Storage
- Compositional and thermophysical study of Al–Si- and Zn–Al–Mg-based eutectic alloys for latent heat storage
- Corrosion behavior of a Co−Cr−Mo−Si alloy in pure Al and Al−Si melt
- Al–Si–Fe alloy-based phase change material for high-temperature thermal energy storage
- Density and surface tension measurements of molten Al–Si based alloys
- Graphite crucible interaction with Fe–Si–B phase change material in pilot-scale experiments
- Topical Issue on Nuclear Energy Application Materials
- Dry synthesis of brannerite (UTi2O6) by mechanochemical treatment
- Special Issue on Polymer and Composite Materials (PCM) and Graphene and Novel Nanomaterials - Part I
- Heat management of LED-based Cu2O deposits on the optimal structure of heat sink
- Special Issue on Recent Developments in 3D Printed Carbon Materials - Part I
- Porous metal foam flow field and heat evaluation in PEMFC: A review
- Special Issue on Advancements in Solar Energy Technologies and Systems
- Research on electric energy measurement system based on intelligent sensor data in artificial intelligence environment
- Study of photovoltaic integrated prefabricated components for assembled buildings based on sensing technology supported by solar energy
- Topical Issue on Focus of Hot Deformation of Metaland High Entropy Alloys - Part I
- Performance optimization and investigation of metal-cored filler wires for high-strength steel during gas metal arc welding
- Three-dimensional transient heat transfer analysis of micro-plasma arc welding process using volumetric heat source models