Temperature uniformity optimization with power-frequency coordinated variation in multi-source microwave based on sequential quadratic programming
-
 ,
,

Abstract
The focus of this study is to regulate the variation in the input parameters of multiple microwave sources in a high-frequency multimode resonant heating system to achieve uniform heating. First, this study deeply expands the theoretical process of frequency change and proposes a frequency-shifting strategy with hot spot alternation to ensure that the temperature difference range of each hot spot does not continuously expand during the heating process. Then, a sequential quadratic programming algorithm is introduced to reconstruct the input power values to improve the heating efficiency according to the different microwave absorption efficiencies of the heated material at different frequencies. Finally, a numerical calculation model for multi-source microwave power-frequency cooperative heating is established based on the finite-element method, and the temperature uniformity index is effectively calculated. Numerical calculations show that the proposed method can improve the uniformity in single-material heating and multi-material heating cases by 56.8–94.3% and 44.4–76.6%, respectively, over that of fixed-frequency heating while achieving improved heating efficiency on the basis of frequency conversion.
1 Introduction
In the face of global energy shortages and continuous environmental degradation, microwave heating is a promising new, clean, and pollution-free energy source [1] that has become widely used in industry, metallurgy, medicine, and other fields [2,3,4]. However, the uncertainty of the electromagnetic field strength distribution in a heated cavity during microwave heating leads to different electric dipole moments for polar molecules within various subregions of the heated material [5], resulting in inconsistent internal energy conversion for the material and hot and cold regional distributions. In severe cases, thermal runaway can occur [6], which directly affects the safety of the material heating process.
Many efforts have been taken to study the problem of uneven temperature distribution of heated materials in the microwave heating process. Such research ideas are often divided into “external” and “internal” approaches. From the “external” point of view, the microwave heating equipment is modified to optimize or change the state of motion of the object, and the mechanical physical changes in the distribution of electromagnetic field is used to improve the uniformity of the purpose. Wang et al. proposed a mode stirrer with a double pendulum structure and performed a multi-physics field-coupled simulation of the microwave heating process to study and analyze heating under nine stirring cases [7]. He et al. designed two microwave sources that rotated around an axis to heat a material, analyzed the effects of different rotation angles on the heating efficiency using the finite element method (FEM), and optimized the heating time at selected angles using the gradient descent method [8]. Zhang et al. combined the rotating spiral flow pattern with microwave heating under falling film evaporation to increase the residence time of the fluid in a cavity, disperse the superheated region of fluid, and overcome inhomogeneous heating [9]. Ye et al. designed a rotating and lifting turntable in a microwave cavity to allow the heating material to rotate and lift so as to analyze the effects of different motion patterns on heating [10]. Zhao et al. introduced a gas-lift reactor by injecting bubbles into a reactor (instead of using a mechanical stirring device), which cleverly improved the turbulence intensity of the liquid and thus improved the temperature uniformity and energy utilization rate of the microwave-assisted reactor [11].
From the “internal” point of view, it is necessary to first consider the microwave parameters, including the power, frequency, and other characteristics of the microwave source, so that the temperature distribution of the heated material is more uniform and to optimize and expand its change mode. Lim et al. performed microwave heating on lunar soil simulants with different input power levels to study the effects of power on the structural properties and triggering of thermal runaway, which is important for the future development of microwave-based heating on the Moon [12]. Yang et al. studied the group consistency algorithm to coordinate the state information of the output power of multiple microwave sources and improved the temperature distribution using the temperature self-organization property [13]. Hong et al. used FEM to numerically simulate the effects of microwave power, microwave frequency, and material location on temperature distribution [14]. Du et al. heated several pieces of chicken at different frequency shift rates and demonstrated that specific shift rates could improve microwave heating performance [15]. Dinani et al. compared the effect of fixed and scanning frequencies on homogeneity in a solid-state microwave system, combining the Maillard reaction and infrared thermography to more accurately identify the heating pattern and temperature distribution of the samples [16]. Yang et al. evaluated the effect of a fixed frequency on heating performance and developed a complementary frequency-shifting strategy using a thermal imaging camera to capture the profile temperature; their method obtained better results than the swept-frequency strategy [17].
When heating materials with microwaves, the magnitude of the input power determines the electric field strength, and the distribution of the electromagnetic field often requires the microwave frequencies to change. Prior efforts [14,15,16,17] have demonstrated that frequency changes can improve the uniformity of microwave heating, but the research on the theoretical processes underlying frequency changes needs to be further extended. Inspired by these considerations, this work analyzes and calculates the effects of different frequencies on the electromagnetic field distribution in a cavity and proposes a hot spot alternation algorithm to determine the order of frequency changes. This new frequency shifting method can reverse the nonuniform temperature distribution of a material, neutralizing the hot and cold spots between material regions and therefore reducing the temperature difference between such regions.
Sequential quadratic programming (SQP) offers a strong boundary search capability [18,19], can effectively handle nonlinear constrained optimization problems [20,21], and is widely used in various fields. de Oliveira Alvarães et al. used a multidimensional SQP algorithm to optimize the biodiesel production process and reduce plant energy losses, using a minimum biodiesel purity of 99 wt% as a constraint [22]. Xia et al. used the SQP algorithm to optimize the propeller control thrust under an output saturation constraint to produce a more rational energy distribution [23]. Ren and Feng combined the SQP algorithm with a congruence algorithm by using the SOP component to optimally solve the congruence step and evaluate non-smooth integration problems with frequent switching to save fuel [24].
In order to solve the problem of optimizing the temperature uniformity of multi-source microwave heating, a coordinated output strategy of multi-source microwave dynamic parameters is proposed in this study. First, the given material is divided into regions to measure their temperatures, and the hot spot alternation algorithm is used to determine the frequency shifting sequence so that the temperature in each region of the material gradually converges during the microwave heating process. Second, the microwave absorption efficiency of various materials differs across input frequencies, a heating uniformity index (UI) is calculated and used as a constraint to allocate the power to the corresponding optimally arranged frequencies according to the SQP algorithm. A chain relationship is formed between power and frequency, which improves the heating efficiency. Finally, by simulating the multi-source microwave power–frequency synergy heating process from the perspectives of single-material heating and multi-material heating, it is demonstrated that the proposed method can effectively improve the temperature distribution produced during microwave heating.
2 Microwave heating control equation
In microwave heating, the time-varying electric and magnetic fields are mutually excited to form oscillating electromagnetic waves. The Maxwell equation system describes the relationship between the electromagnetic field of the cavity inside the microwave applicator and the space-time, which is expressed in the following form:
where
The electric field distribution in the microwave heating reaction cavity can be obtained by solving the system of Maxwell’s equations [10].
where
In the microwave heating process, heating is realized by converting the dielectric loss
where
The sum of the two losses is the electromagnetic power
The temperature field distribution of the material during the heating process is solved by the heat conduction equation as follows:
where
For silicon carbide heating specimens used in the microwave heating process with no clear magnetization phenomenon, the hysteresis loss can be ignored; thus,
From equation (6), the electromagnetic wave frequency and electric field strength play key roles in the material temperature distribution. Moreover, the electric field strength is proportional to the input power, so the material temperature distribution can be optimized by changing the electromagnetic wave frequency and input power.
When heating in a cavity with multiple microwave sources, the electromagnetic wave input among multiple microwave sources will generate coupling, which is extremely complex and difficult to determine. In order to reduce the energy coupling among multiple microwave sources and enhance the energy utilization efficiency, the opposing microwave sources are to be made perpendicular to each other so that the electromagnetic wave polarization directions are orthogonal to each other [26,27]. At the same time, two microwave sources located on the same side also need to be perpendicular to each other to reduce the coupling power [28]. According to the above principles, the heating model shown in Figure 1 is designed in this study.

3D geometry model of multi-source microwave (unit: mm).
In this study, six microwave sources are designed in the microwave cavity for studying the case of heating silicon carbide (SiC) blocks. The waveguide uses a WR340 standard model, the medium in the cavity is air, the material is located in the center of the cavity, the material is supported by polycrystalline mullite matting below, the feed microwave mode is TE10, and the specific dimensions of the components in the model are shown in Figure 1.
3 Strategy for dynamic changes in frequency and power
3.1 Frequency shifting strategy with hot spot alternation
The heating UI is introduced to evaluate the volume uniformity of the heated material [29]; the smaller the UI is, the better the heating uniformity, UI = 0 is considered completely uniform. The UI is defined as follows:
where
The material exists in a completely homogeneous state before heating. After heating, the material develops cold and hot spots. With fixed-frequency heating, the hot and cold areas do not change as the heating time increases. Additionally, if the frequency is changed, the material develops a different temperature distribution, indicating that each frequency results in fixed hot and cold regions for a given material. According to these theories, a regional hot spot alternation method is proposed in this work to study the microwave heating of both single-material systems and multi-material systems.
The two studies considered here are as follows. Single-material study: A single SiC material was divided into four regions, and each region was numbered as shown in Figure 2(a). Multi-material study: The aforementioned SiC block was increased to four SiC blocks of equal size, and the four materials were numbered as shown in Figure 2(b).

Zoning of SiC materials: (a) single-material zoning and (b) multi-material zoning (unit: mm).
The flow chart of the regional hot spot alternation algorithm is shown in Figure 3. The input power is fixed at P = 200 W, and 2.41 GHz, 2.42 GHz, and so on till 2.50 GHz are used as the input frequency values. These ten frequencies are used to heat the SiC for 30 s each, and the numbering of the temperature regions is recorded in ascending order as L n (n = 2.41, 2.42…,2.50). The index “n” in L n represents the frequency; for example, L 2.41 represents the temperatures of the four numbers in ascending order after heating at a fixed frequency of 2.41 GHz. If L2.41 = [3 1 4 2], it means that the temperature of region 2 is the highest, followed by region 4, then region 1, and finally region 3, after heating at a fixed frequency of 2.41 GHz. We start by using the common frequency of 2.45 GHz as the initial frequency f 1, with a heating time step of t s = 2 s. After heating for 2 s at frequency f 1, we record the temperatures of the four zones of the material in ascending order and denote the result as L 1 (index 1 in L 1 represents the first frequency). If L 1 = [4 2 3 1], L 1 is assigned to L next, and the descending order of L next is L d = [1 3 2 4]. Then, the similarity matching factor J between L d and the ten sequences of L 2.41, L 2.42,…,L 2.50 is calculated, and the frequency f m corresponding to the sequence with the highest similarity matching rate is determined as the next heating frequency f next. Assuming that L 2.42 = [1 3 2 4], and its similarity matching rate J is 100%, if this is the only sequence with the highest matching rate, then f next = f m = 2.42 GHz (if there are multiple sequences that share the highest matching rate, then the frequency with the smallest UI is selected as the next heating frequency). Then, 2.42 GHz is used as the second heating frequency to heat for 2 s (f 2 = 2.42 GHz), and the temperatures obtained for the regions in ascending order are assigned to L next. The above steps are repeated, and the best frequency change order can be selected.

Hot spot alternation frequency flow chart.
3.2 SQP algorithm
While the hot spot alternation algorithm determines the order of frequency shifting, different frequencies correspond to different microwave absorption efficiencies. To improve the microwave heating efficiency, the power needs to be accordingly reallocated. Additionally, the power is proportional to the UI, and to guarantee the uniformity of heating, the relative UI loss power is used as a constraint. The expression of the objective function to be optimized is as follows:
where
Furthermore, to ensure that the total power does not change during frequency shifting, the following constraints are imposed:
The SQP algorithm is widely used to solve nonlinear constrained optimization problems because of its superlinear convergence characteristics. For convenience, the above power optimization problems are henceforth converted into the following nonlinear constrained problems:
where
where
where
A line search is used to determine the step size, which satisfies the strong Wolfe condition [31].
After determining
The Hessian matrix of the Lagrange function is calculated using the BGFS update formula (Newton-like method) as follows:
where
4 Numerical calculation and analysis
4.1 Model parameters and boundary conditions
The initial temperature of the system T 0 = 20°C, the heated material is a SiC block, the rest of the interior area of the cavity is set up as an air domain, the mat and support column are made of polycrystalline mullite, the heating time is 30 s, and the reaction cavity and WR340 waveguide are copper media. The microwave frequency change order is the order of the frequencies arranged as determined by the hot spot alternation algorithm (the time step for frequency changes t s = 2 s). The parameters in the model are set as shown in Table 1, and the expressions for the temperature change parameters in SiC are as follows:
The cavity wall and the metallic waveguide wall are considered ideal electrical conductors with the electromagnetic boundary conditions shown below [5,10]:
where
Parameter settings
| Material properties | SiCa | Coppera,c | Aira,b,c | Unit |
|---|---|---|---|---|
| Relative dielectric constant (real part) |
|
1 | 1 | 1 |
| Loss tangent angle |
|
— | — | 1 |
| Relative magnetic permeability | 1 | 1 | 1 | 1 |
| Electrical conductivity | — | 5.998 × 10⁷ | 0 | S·m−1 |
| Thermal conductivity |
|
400 | 0 | W·(m·K)−1 |
| Density | 3,100 | 8,700 | — | kg·m−3 |
| Constant pressure heat capacity |
|
3,640 | — | J·(kg·K)−1 |
The SiC heating material exchanges heat with the surrounding air through convection, and its heat conduction boundary conditions are as follows [8,33,34]:
where
The grid size has an important impact on the computational accuracy and computational time of the method. Meshing too coarsely leads to inaccurate calculation accuracy, yet meshing too finely leads to a long calculation time. The selection of the appropriate number of grid cells is thus a critical step in the numerical simulation process. In this study, the normalized absorption rate (NPA) is used to establish the number of grid cells [5,10,34], which is expressed as follows:
where

Mesh independence study.
4.2 Numerical calculation results and analysis
4.2.1 Model validation
To verify the accuracy of the numerical model, we compared the actual experimental heating results with the numerical calculation model. Heating material: 50 mm × 50 mm × 20 mm SiC, the experimental equipment is as shown in Figure 5(a), top view of SiC block and location of sampling points are as shown in Figure 5(b).

Microwave reactor and heated specimen: (a) microwave reactor and (b) SiC specimen.
We input a fixed power to heat SiC, and the experiment compared the center temperature variation curve with time and the temperature of nine sampling points at 30 s. Five sets of replicate experiments were conducted with arithmetic means as measurements and using standard deviation as the error line variable. A comparison of the experimental results with the numerical calculation results is shown in Figure 6, and the center point in Figure 6(a) is the sampling point 5.

Experimental comparison results: (a) central temperature variation and (b) temperature of each sampling point.
As shown in Figure 6, the experimental results deviated slightly from the numerical calculation, but the overall trend was the same. The reasons for the deviations are: (1) the parameters and conditions of the numerical simulation model are idealized, and there are differences between the actual experiment (including material purity, characteristic parameters, insulation conditions, heat transfer conditions, etc.). (2) The temperature measurement using infrared thermometer requires opening of the cavity, which leads to heat loss. (3) Measurement and instrumentation errors. The results show that the numerical model results are reliable within a certain error tolerance.
4.2.2 Single-material numerical calculation results and analysis
A single 50 mm × 50 mm × 20 mm SiC block is heated, and the frequency conversion sequence of the single material is obtained using the regional hot spot alternation method presented in Section 3.1, as shown in Figure 7(a). Simultaneously, the values of

Single material power–frequency synergy curves: (a) frequency variation curve and (b) power variation curve.
Single material factor
| Factor | Frequency (GHz) | ||||||
|---|---|---|---|---|---|---|---|
| 2.42 | 2.43 | 2.44 | 2.45 | 2.47 | 2.49 | 2.50 | |
| a i | −4.02 × 10⁻⁹ | −6.31 × 10⁻⁹ | −4.59 × 10⁻⁹ | −9.74 × 10⁻⁹ | −9.27 × 10⁻⁹ | −7.28 × 10⁻⁹ | −1.17 × 10⁻⁹ |
| b i | 1.11 × 10⁻⁵ | 1.63 × 10⁻⁵ | 1.22 × 10⁻⁵ | 3.89 × 10⁻⁵ | 2.42 × 10⁻⁵ | 3.79 × 10⁻⁵ | 2.40 × 10⁻⁵ |
| c i | 2.61 × 10⁻³ | 3.45 × 10⁻³ | 1.92 × 10⁻³ | 5.97 × 10⁻³ | 3.42 × 10⁻³ | 6.76 × 10⁻³ | 2.94 × 10⁻³ |
| UI i | 4.60 × 10⁻³ | 6.40 × 10⁻³ | 4.10 × 10⁻³ | 1.39 × 10⁻³ | 8.00 × 10⁻³ | 1.38 × 10⁻³ | 7.10 × 10⁻³ |
Under these conditions, frequency and power form a one-to-one correspondence, where a specific time corresponds to specific frequency and power values. Power and frequency controls together improve the distribution of the temperature field in the material and the cavity. To qualitatively compare the effects of the three main heating methods (fixed frequency, hot spot alternating frequency, and power–frequency synergistic variation), the silicon carbide block is simulated with COMSOL software using the three heating methods for a heating duration of 30 s. The resulting temperature distributions are shown in Figure 8.
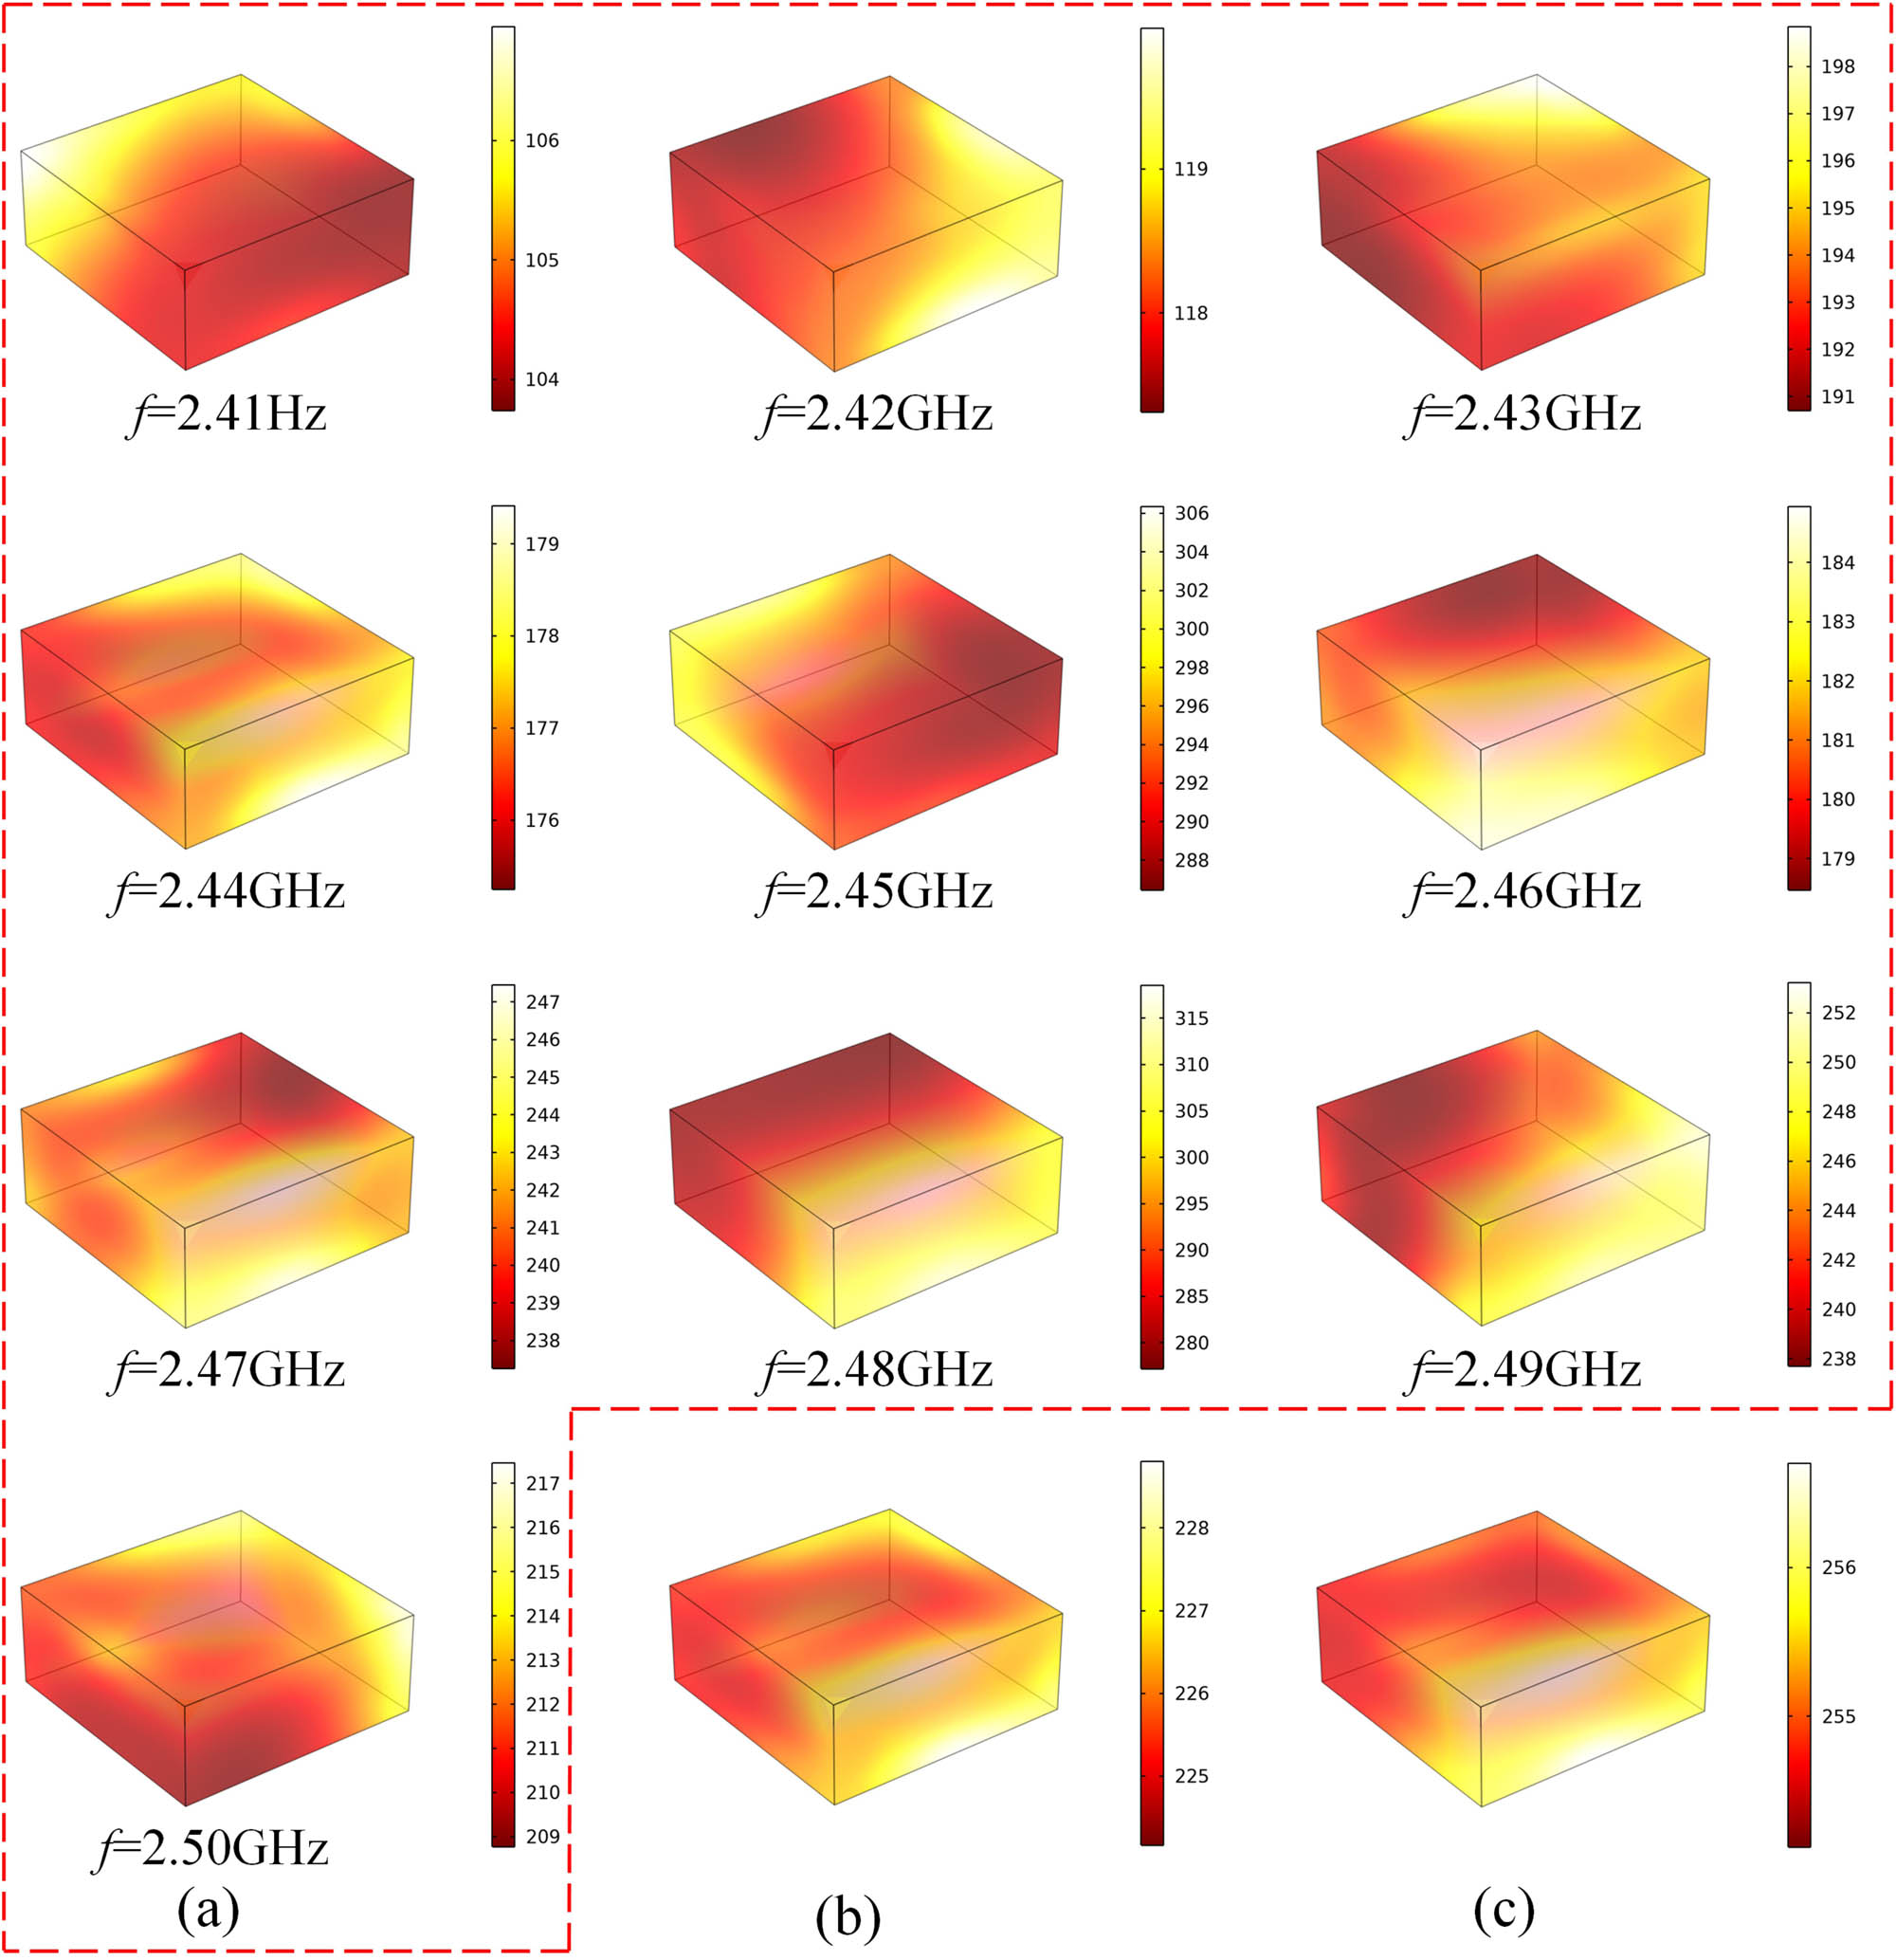
Single material temperature distribution: (a) fixed-frequency heating; (b) hot spot alternating frequency heating; and (c) power–frequency synergistic heating (unit: °C).
As shown in Figure 8, the temperature distributions of SiC under different heating frequencies are different, and frequency shift heating based on hot spot alternation can significantly improve the temperature uniformity of the material compared with fixed-frequency heating. However, the hot spot alternation method affects the heating efficiency when compared with some fixed frequencies. Yet considering the power conversion efficiency, power–frequency cooperative heating produces not only a more uniform temperature but also an improved heating efficiency level. To quantitatively analyze the three heating modes, the UI is used to measure the uniformity of each heating strategy, and the average temperature (T av) is used to measure the heating efficiency. A data comparison is shown in Table 3.
Single material heating performance index
| Heating strategy | Frequency (GHz) | T av (°C) | UI |
|---|---|---|---|
| Fixed frequency | 2.41 | 104.66 | 0.0061 |
| 2.42 | 118.25 | 0.0050 | |
| 2.43 | 193.16 | 0.0067 | |
| 2.44 | 176.60 | 0.0044 | |
| 2.45 | 291.97 | 0.0130 | |
| 2.46 | 180.80 | 0.0083 | |
| 2.47 | 240.45 | 0.0079 | |
| 2.48 | 289.46 | 0.0332 | |
| 2.49 | 242.66 | 0.0144 | |
| 2.50 | 211.42 | 0.0075 | |
| Hot spot alternation frequency | — | 225.57 | 0.0035 |
| Power–frequency synergy | — | 254.92 | 0.0019 |
As seen from the data in Table 3, hot spot alternating frequency conversion obtains UI data that are better than those of fixed-frequency heating (2.41–2.50 GHz), and the uniformity improves by 20.5–89.5% compared with that of fixed-frequency heating, which proves that hot spot alternation-based frequency conversion helps achieve improved heating uniformity. However, the heating temperature produced under the hot spot alternation method is still reduced compared with that of the fixed-frequency method possessing the best heating efficiency. The proposed multisource microwave power–frequency cooperative heating approach based on SQP not only improves the heating uniformity by 58.5% compared with the optimal value of UI at a fixed frequency but also increases the average heating temperature by 29.35°C compared with the hot spot alternating frequency, which proves that the proposed method can improve the heating uniformity more effectively without considerably affecting the heating efficiency.
Therefore, cooperatively heating multiple microwave sources using power-frequency controls based on SQP, as proposed in this study, can effectively improve heating uniformity. In addition, the hot spot alternation frequency conversion method can neutralize the hot and cold regions while benefitting from the self-organizing property of temperature. Power changes accelerate the conduction of temperature from high-temperature regions to relatively low-temperature regions, and the temperature distribution within the material constantly converges under the influence of both forces. As a result, the temperature differences between the regions decrease, and the uniformity of the heated material is enhanced. The SQP algorithm is used to allocate as much power as possible to the frequencies with high heating efficiency levels under the conditions of constant total power and no uniformity compromise, resulting in a heating temperature increase.
4.2.3 Multi-material numerical calculation results and analysis
To further investigate the effectiveness of the method of this study, it is applied to multi-material heating by simultaneously heating four 50 mm × 50 mm × 20 mm SiC blocks with spacing intervals of 10 mm. The multi-material frequency conversion sequence is obtained according to the hot spot alternation algorithm, as shown in Figure 9(a). The unknown coefficients in the SQP algorithm are shown in Table 4, and redistributed power values are obtained, as shown in Figure 9(b).

Multi material power–frequency synergy curve: (a) frequency variation curve and (b) power variation curve.
Multi material factor
| Factor | Frequency (GHz) | |||||||
|---|---|---|---|---|---|---|---|---|
| 2.42 | 2.43 | 2.44 | 2.45 | 2.47 | 2.48 | 2.49 | 2.50 | |
| a i | −6.22 × 10⁻⁹ | −7.31 × 10⁻⁹ | −1.04 × 10⁻⁹ | −6.83 × 10⁻⁹ | −8.82 × 10⁻⁹ | −6.64 × 10⁻⁹ | −4.50 × 10⁻⁹ | −8.42 × 10⁻⁹ |
| b i | 1.62 × 10⁻⁵ | 1.42 × 10⁻⁵ | 1.82 × 10⁻⁵ | 1.44 × 10⁻⁵ | 2.27 × 10⁻⁵ | 1.63 × 10⁻⁵ | 1.19 × 10⁻⁵ | 2.28 × 10⁻⁵ |
| c i | 5.18 × 10⁻³ | 4.30 × 10⁻³ | 4.54 × 10⁻³ | 3.56 × 10⁻³ | 4.45 × 10⁻³ | 4.65 × 10⁻³ | 2.28 × 10⁻³ | 6.39 × 10⁻³ |
| UI i | 8.20 × 10⁻³ | 6.90 × 10⁻³ | 7.80 × 10⁻³ | 6.20 × 10⁻³ | 8.60 × 10⁻³ | 7.70 × 10⁻³ | 4.50 × 10⁻³ | 1.07 × 10⁻² |
COMSOL software is used to simulate the heating of multi-material using three heating methods: fixed-frequency heating, hot spot alternating frequency-based heating and power–frequency cooperative heating, with a heating time of 30 s. A comparison among the heating effects of the three methods is shown in Figure 10. As shown, the temperature differences between the four materials are very significant after heating them with a fixed frequency. The use of hot spot alternation frequency-based heating effectively improves the temperature distribution of each material and reduces the temperature difference range across the four materials, which better serves the integrity demands of multi-material heating. Power–frequency synergistic heating not only further improves the uniformity but also increases the overall heating temperature. In the quantitative multi-material analysis, the average UI (UIav) and the maximum mean temperature difference (MTDmax) among the four materials are used to measure the overall uniformity, and their average temperature (T av) is used to measure the overall heating efficiency. A data comparison is shown in Table 5.

Multi material temperature distribution: (a) fixed-frequency heating; (b) hot spot alternation frequency heating; and (c) power–frequency synergistic heating (unit: °C).
Multi material heating performance indicators
| Heating strategy | Frequency (GHz) | T av (°C) | UIav | MTDmax (°C) |
|---|---|---|---|---|
| Fixed frequency | 2.41 | 107.08 | 0.0096 | 17.22 |
| 2.42 | 106.94 | 0.0082 | 16.61 | |
| 2.43 | 129.91 | 0.0069 | 35.72 | |
| 2.44 | 144.01 | 0.0078 | 16.11 | |
| 2.45 | 144.04 | 0.0062 | 50.98 | |
| 2.46 | 125.52 | 0.0058 | 19.98 | |
| 2.47 | 143.11 | 0.0086 | 17.51 | |
| 2.48 | 122.18 | 0.0077 | 38.31 | |
| 2.49 | 138.99 | 0.0045 | 28.79 | |
| 2.50 | 150.31 | 0.0107 | 32.70 | |
| Hot spot alternation frequency | — | 142.03 | 0.0043 | 1.88 |
| Power–frequency synergy | — | 146.68 | 0.0025 | 2.29 |
Table 5 shows that the method proposed in this work achieves the minimum average UI and the maximum mean temperature difference data in comparison with fixed-frequency heating. The average UI is improved by 44.4–76.6% over that of fixed-frequency heating, which indicates that the method in this study can continue to improve heating uniformity even when applied to multi-material heating. In particular, considering the maximum mean temperature difference, hot spot alternating frequency conversion and power–frequency synergy achieve values of 1.88 and 2.29°C, respectively, which proves that these two methods can allow the average temperature difference among the four materials to remain in a low range after the heating process completes; this enables the heating system to satisfy the demand of consistent heating temperature across multiple materials. Furthermore, the power–frequency cooperative heating method improves the temperature uniformity of each material (the average UI of the four materials improves by 41.9%) and enhances the heating efficiency (the average temperature of the four materials is raised by 4.65°C) on the basis of alternate hot spot frequency conversion, which fully verifies the feasibility of the method proposed in this work.
5 Conclusion
To optimize the temperature uniformity of multisource microwave heating, this study proposes a coordinated output strategy with multisource microwave dynamic parameters and establishes a numerical calculation model with multisource microwave power–frequency synergy. The relevant conclusions are as follows.
According to the effect of microwave frequencies on the electromagnetic field distribution in a cavity, a hot spot alternation algorithm is proposed to determine the order of frequency shifting, which changes the distribution of hot and cold regions during the heating process and reduces the temperature differences between different hot spots of the material.
On this basis, the SQP algorithm is introduced to optimize the power distribution values and combine the power variation with the frequency variation to enhance the microwave energy conversion.
From single-material heating to multi-material heating, the effects of three heating methods on temperature uniformity are analyzed and compared: fixed-frequency, hot spot alternating frequency, and power–frequency synergy. The results show that the power–frequency synergistic method can significantly improve the temperature uniformity of the material.
The method proposed in this study provides new design ideas and computational schemes for research on the use of microwave parameters to optimize temperature uniformity. In the subsequent study, we will build a new intelligent microwave reaction device and conduct more experimental studies to further validate the conclusions and contributions of this study.
Acknowledgments
The authors gratefully acknowledge the financial supports from the National Natural Science Foundation of China (61863020).
-
Funding information: National Natural Science Foundation of China (61863020).
-
Author contributions: Biao Yang: conceptualization, methodology, formal analysis, writing – original draft, writing – review and editing, and funding acquisition. Zemin Han: conceptualization, methodology, formal analysis, writing – original draft, and writing – review and editing. Cheng Cheng: formal analysis and writing – review and editing. Hao Gao and Zhaogang Wu: writing – review and editing.
-
Conflict of interest: Authors state no conflict of interest.
-
Data availability statement: All authors confirm that all data used in this article can be published in High Temperature Materials and Processes.
References
[1] Dang, X. D., S. J. Shi, L. J. Li, F. Luo, and Z. Ding. Mullite reinforced SiC/Al2O3 composites prepared by microwave sintering based on green manufacturing. Mathematical Problems in Engineering, Vol. 2022, 2022, id. 7782595.10.1155/2022/7782595Search in Google Scholar
[2] Cheng, C., B. Yang, B. H. Li, Q. Y. Xiao, and H. Gao. Double-layered model predictive optimization control strategy for temperature uniformity of microwave heating process. Case Studies in Thermal Engineering, Vol. 40, 2022, id. 102544.10.1016/j.csite.2022.102544Search in Google Scholar
[3] Yin, S. H., G. Lin, S. W. Li, J. H. Peng, and L. B. Zhang. Application of response surface methodology for optimization of parameters for microwave heating of rare earth carbonates. High Temperature Materials and Processes, Vol. 35, No. 8, 2016, pp. 813–820.10.1515/htmp-2015-0038Search in Google Scholar
[4] Gartshore, A., M. Kidd, and L. T. Joshi. Applications of microwave energy in medicine. Biosensors, Vol. 11, No. 4, 2021, id. 96.10.3390/bios11040096Search in Google Scholar PubMed PubMed Central
[5] Xiong, G. C., H. C. Zhu, K. M. Huang, Y. Yang, Z. P. Fan, and J. H. Ye. The impact of pins on dual-port microwave heating uniformity and efficiency with dual frequency. Journal of Microwave Power and Electromagnetic Energy, Vol. 54, No. 2, 2020, pp. 83–98.10.1080/08327823.2020.1755481Search in Google Scholar
[6] Zhang, R. J., Y. F. Wang, X. C. Wang, and D. L. Luan. Study of heating characteristics for a continuous 915 MHz pilot scale microwave thawing system. Food Control, Vol. 104, 2019, pp. 105–114.10.1016/j.foodcont.2019.04.030Search in Google Scholar
[7] Wang, Y., X. Q. Yang, and Y. F. Qiu. Double pendulum mode stirrer for improved multimode microwave heating performance. International Journal of RF and Microwave Computer-Aided Engineering, Vol. 31, No. 11, 2021, id. e22866.10.1002/mmce.22866Search in Google Scholar
[8] He, J. L., Y. Yang, H. C. Zhu, K. Li, W. Yao, and K. M. Huang. Microwave heating based on two rotary waveguides to improve efficiency and uniformity by gradient descent method. Applied Thermal Engineering, Vol. 178, 2020, id. 115594.10.1016/j.applthermaleng.2020.115594Search in Google Scholar
[9] Zhang, Y. S., Z. Y. Zhao, H. Li, X. G. Li, and X. Gao. Numerical modeling and optimal design of microwave-heating falling film evaporation. Chemical Engineering Science, Vol. 240, 2021, id. 116681.10.1016/j.ces.2021.116681Search in Google Scholar
[10] Ye, J. H., Y. Xia, Q. Y. Yi, H. C. Zhu, Y. Yang, and K. M. Huang. Multiphysics modeling of microwave heating of solid samples in rotary lifting motion in a rectangular multi-mode cavity. Innovative Food Science & Emerging Technologies, Vol. 73, 2021, id. 102767.10.1016/j.ifset.2021.102767Search in Google Scholar
[11] Zhao, H. F., H. Li, X. G. Li, and X. Gao. Process intensification for improving the uniformity and efficiency of microwave heating reactor by bubbles-enhanced flow method. Applied Thermal Engineering, Vol. 197, 2021, id. 117346.10.1016/j.applthermaleng.2021.117346Search in Google Scholar
[12] Lim, S., J. Bowen, G. Degli-Alessandrini, M. Anand, A. Cowley, and V. Levin Prabhu. Investigating the microwave heating behaviour of lunar soil simulant JSC-1A at different input powers. Scientific Reports, Vol. 11, No. 1, 2021, id. 2133.10.1038/s41598-021-81691-wSearch in Google Scholar PubMed PubMed Central
[13] Yang, B., Z. G. Wu, H. Gao, L. X. Zhou, and J. Sun. Research on the optimisation of the temperature field distribution of a multi microwave source agent system based on group consistency. High Temperature Materials and Processes, Vol. 41, No. 1, 2022, pp. 650–668.10.1515/htmp-2022-0250Search in Google Scholar
[14] Hong, Y. D., B. Q. Lin, H. Li, H. M. Dai, C. J. Zhu, and H. Yao. Three-dimensional simulation of microwave heating coal sample with varying parameters. Applied Thermal Engineering, Vol. 93, 2016, pp. 1145–1154.10.1016/j.applthermaleng.2015.10.041Search in Google Scholar
[15] Du, Z. L., Z. Wu, W. W. Gan, G. Liu, X. F. Zhang, J. L. Liu, et al. Multi-physics modeling and process simulation for a frequency-shifted solid-state source microwave oven. IEEE Access, Vol. 7, 2019, pp. 184726–184733.10.1109/ACCESS.2019.2960317Search in Google Scholar
[16] Dinani, S. T., E. Feldmann, and U. Kulozik. Effect of heating by solid-state microwave technology at fixed frequencies or by frequency sweep loops on heating profiles in model food samples. Food and Bioproducts Processing, Vol. 127, 2021, pp. 328–337.10.1016/j.fbp.2021.03.018Search in Google Scholar
[17] Yang, R., A. E. Fathy, M. T. Morgan, and J. J. Chen. Development of a complementary-frequency strategy to improve microwave heating of gellan gel in a solid-state system. Journal of Food Engineering, Vol. 314, 2022, id. 110763.10.1016/j.jfoodeng.2021.110763Search in Google Scholar
[18] Plevris, V. and M. Papadrakakis. A hybrid particle swarm–gradient algorithm for global structural optimization. Computer‐Aided Civil and Infrastructure Engineering, Vol. 26, No. 1, 2011, pp. 48–68.10.1111/j.1467-8667.2010.00664.xSearch in Google Scholar
[19] Liu, Z., Z. Y. Li, P. Zhu, and W. Chen. A parallel boundary search particle swarm optimization algorithm for constrained optimization problems. Structural and Multidisciplinary Optimization, Vol. 58, 2018, pp. 1505–1522.10.1007/s00158-018-1978-3Search in Google Scholar
[20] Sun, Z. B., Y. Y. Sun, L. Li, and K. P. Liu. A new trust region–sequential quadratic programming approach for nonlinear systems based on nonlinear model predictive control. Engineering Optimization, Vol. 51, No. 6, 2019, pp. 1071–1096.10.1080/0305215X.2018.1509960Search in Google Scholar
[21] Liao, H. T., W. W. Wu, and D. Fang. The reduced space Sequential Quadratic Programming (SQP) method for calculating the worst resonance response of nonlinear systems. Journal of Sound and Vibration, Vol. 425, 2018, pp. 301–323.10.1016/j.jsv.2017.12.020Search in Google Scholar
[22] de Oliveira Alvarães, A., D. Martinez Prata, and L. de Sousa Santos. Simulation and optimization of a continuous biodiesel plant using nonlinear programming. Energy, Vol. 189, 2019, id. 116305.10.1016/j.energy.2019.116305Search in Google Scholar
[23] Xia, S. Y., D. L. Xu, H. C. Zhang, Q. J. Shi, G. L. Wen, and Y. S. Wu. Motion mitigation of hinged floating structures by adaptive control. Ocean Engineering, Vol. 216, 2020, id. 107700.10.1016/j.oceaneng.2020.107700Search in Google Scholar
[24] Ren, F. and W. Feng. Homotopy-SQP coupled method for optimal control of far-distance nonplanar rapid cooperative rendezvous with multiple specific-direction thrusts. Advances in Space Research, Vol. 68, No. 8, 2021, pp. 3176–3190.10.1016/j.asr.2021.06.019Search in Google Scholar
[25] Li, W. X., J. H. Ye, Y. Yang, and H. C. Zhu. Double-ridged waveguide for efficiently heating ultrafine filament fibers. International Journal of Heat and Mass Transfer, Vol. 200, 2023, id. 123543.10.1016/j.ijheatmasstransfer.2022.123543Search in Google Scholar
[26] Ahn, S. H. and W. S. Lee. Uniform microwave heating system design and evaluation with an orthogonally slot‐loaded array waveguide. Microwave and Optical Technology Letters, Vol. 62, No. 11, 2020, pp. 3419–3424.10.1002/mop.32467Search in Google Scholar
[27] Boonthum, D., S. Chanprateep, C. Ruttanapun, and N. Mudtorlep. Development of high-temperature multi-magnetron microwave furnace for material processing. Songklanakarin Journal of Science & Technology, Vol. 41, No. 3, 2019, pp. 494–500.Search in Google Scholar
[28] Song, K. R., F. J. Zhang, W. Yang, S. G. Li, D. Hao, and B. Yao. Simulation and verification on the double feeder position and heating efficiency of rectangular microwave cavity. Journal of Kunming University of Science and Technology (Natural Science Edition), Vol. 42, No. 6, 2017, pp. 51–57.Search in Google Scholar
[29] Alfaifi, B., J. Tang, Y. Jiao, S. Wang., B. Rasco, S. Jiao, and S. Sablani. Radio frequency disinfestation treatments for dried fruit: Model development and validation. Journal of Food Engineering, Vol. 120, 2014, pp. 268–276.10.1016/j.jfoodeng.2013.07.015Search in Google Scholar
[30] He, X. and F. V. Lima. A modified SQP-based model predictive control algorithm: application to supercritical coal-fired power plant cycling. Industrial & Engineering Chemistry Research, Vol. 59, No. 35, 2020, pp. 15671–15681.10.1021/acs.iecr.0c01843Search in Google Scholar
[31] Yao, S. W., Q. L. Feng, L. Li, and J. Q. Xu. A class of globally convergent three-term Dai-Liao conjugate gradient methods. Applied Numerical Mathematics, Vol. 151, 2020, pp. 354–366.10.1016/j.apnum.2019.12.026Search in Google Scholar
[32] Tamang, S. and S. Aravindan. 3D numerical modelling of microwave heating of SiC susceptor. Applied Thermal Engineering, Vol. 162, 2019, id. 114250.10.1016/j.applthermaleng.2019.114250Search in Google Scholar
[33] Liao, Y. H., J. Q. Lan, C. Zhang, T. Hong, Y. Yang, K. M. Huang, et al. A phase-shifting method for improving the heating uniformity of microwave processing materials. Materials, Vol. 9, No. 5, 2016, id. 309.10.3390/ma9050309Search in Google Scholar PubMed PubMed Central
[34] Zhang, M., X. B. Jia, Z. X. Tang, Y. X. Zeng, X. J. Wang, Y. Liu, et al. A fast and accurate method for computing the microwave heating of moving objects. Applied Sciences, Vol. 10, No. 8, 2020, id. 2985.10.3390/app10082985Search in Google Scholar
© 2023 the author(s), published by De Gruyter
This work is licensed under the Creative Commons Attribution 4.0 International License.
Articles in the same Issue
- Research Articles
- First-principles investigation of phase stability and elastic properties of Laves phase TaCr2 by ruthenium alloying
- Improvement and prediction on high temperature melting characteristics of coal ash
- First-principles calculations to investigate the thermal response of the ZrC(1−x)Nx ceramics at extreme conditions
- Study on the cladding path during the solidification process of multi-layer cladding of large steel ingots
- Thermodynamic analysis of vanadium distribution behavior in blast furnaces and basic oxygen furnaces
- Comparison of data-driven prediction methods for comprehensive coke ratio of blast furnace
- Effect of different isothermal times on the microstructure and mechanical properties of high-strength rebar
- Analysis of the evolution law of oxide inclusions in U75V heavy rail steel during the LF–RH refining process
- Simultaneous extraction of uranium and niobium from a low-grade natural betafite ore
- Transfer and transformation mechanism of chromium in stainless steel slag in pedosphere
- Effect of tool traverse speed on joint line remnant and mechanical properties of friction stir welded 2195-T8 Al–Li alloy joints
- Technology and analysis of 08Cr9W3Co3VNbCuBN steel large diameter thick wall pipe welding process
- Influence of shielding gas on machining and wear aspects of AISI 310–AISI 2205 dissimilar stainless steel joints
- Effect of post-weld heat treatment on 6156 aluminum alloy joint formed by electron beam welding
- Ash melting behavior and mechanism of high-calcium bituminous coal in the process of blast furnace pulverized coal injection
- Effect of high temperature tempering on the phase composition and structure of steelmaking slag
- Numerical simulation of shrinkage porosity defect in billet continuous casting
- Influence of submerged entry nozzle on funnel mold surface velocity
- Effect of cold-rolling deformation and rare earth yttrium on microstructure and texture of oriented silicon steel
- Investigation of microstructure, machinability, and mechanical properties of new-generation hybrid lead-free brass alloys
- Soft sensor method of multimode BOF steelmaking endpoint carbon content and temperature based on vMF-WSAE dynamic deep learning
- Mechanical properties and nugget evolution in resistance spot welding of Zn–Al–Mg galvanized DC51D steel
- Research on the behaviour and mechanism of void welding based on multiple scales
- Preparation of CaO–SiO2–Al2O3 inorganic fibers from melting-separated red mud
- Study on diffusion kinetics of chromium and nickel electrochemical co-deposition in a NaCl–KCl–NaF–Cr2O3–NiO molten salt
- Enhancing the efficiency of polytetrafluoroethylene-modified silica hydrosols coated solar panels by using artificial neural network and response surface methodology
- High-temperature corrosion behaviours of nickel–iron-based alloys with different molybdenum and tungsten contents in a coal ash/flue gas environment
- Characteristics and purification of Himalayan salt by high temperature melting
- Temperature uniformity optimization with power-frequency coordinated variation in multi-source microwave based on sequential quadratic programming
- A novel method for CO2 injection direct smelting vanadium steel: Dephosphorization and vanadium retention
- A study of the void surface healing mechanism in 316LN steel
- Effect of chemical composition and heat treatment on intergranular corrosion and strength of AlMgSiCu alloys
- Soft sensor method for endpoint carbon content and temperature of BOF based on multi-cluster dynamic adaptive selection ensemble learning
- Evaluating thermal properties and activation energy of phthalonitrile using sulfur-containing curing agents
- Investigation of the liquidus temperature calculation method for medium manganese steel
- High-temperature corrosion model of Incoloy 800H alloy connected with Ni-201 in MgCl2–KCl heat transfer fluid
- Investigation of the microstructure and mechanical properties of Mg–Al–Zn alloy joints formed by different laser welding processes
- Effect of refining slag compositions on its melting property and desulphurization
- Effect of P and Ti on the agglomeration behavior of Al2O3 inclusions in Fe–P–Ti alloys
- Cation-doping effects on the conductivities of the mayenite Ca12Al14O33
- Modification of Al2O3 inclusions in SWRH82B steel by La/Y rare-earth element treatment
- Possibility of metallic cobalt formation in the oxide scale during high-temperature oxidation of Co-27Cr-6Mo alloy in air
- Multi-source microwave heating temperature uniformity study based on adaptive dynamic programming
- Round-robin measurement of surface tension of high-temperature liquid platinum free of oxygen adsorption by oscillating droplet method using levitation techniques
- High-temperature production of AlN in Mg alloys with ammonia gas
- Review Article
- Advances in ultrasonic welding of lightweight alloys: A review
- Topical Issue on High-temperature Phase Change Materials for Energy Storage
- Compositional and thermophysical study of Al–Si- and Zn–Al–Mg-based eutectic alloys for latent heat storage
- Corrosion behavior of a Co−Cr−Mo−Si alloy in pure Al and Al−Si melt
- Al–Si–Fe alloy-based phase change material for high-temperature thermal energy storage
- Density and surface tension measurements of molten Al–Si based alloys
- Graphite crucible interaction with Fe–Si–B phase change material in pilot-scale experiments
- Topical Issue on Nuclear Energy Application Materials
- Dry synthesis of brannerite (UTi2O6) by mechanochemical treatment
- Special Issue on Polymer and Composite Materials (PCM) and Graphene and Novel Nanomaterials - Part I
- Heat management of LED-based Cu2O deposits on the optimal structure of heat sink
- Special Issue on Recent Developments in 3D Printed Carbon Materials - Part I
- Porous metal foam flow field and heat evaluation in PEMFC: A review
- Special Issue on Advancements in Solar Energy Technologies and Systems
- Research on electric energy measurement system based on intelligent sensor data in artificial intelligence environment
- Study of photovoltaic integrated prefabricated components for assembled buildings based on sensing technology supported by solar energy
- Topical Issue on Focus of Hot Deformation of Metaland High Entropy Alloys - Part I
- Performance optimization and investigation of metal-cored filler wires for high-strength steel during gas metal arc welding
- Three-dimensional transient heat transfer analysis of micro-plasma arc welding process using volumetric heat source models