High-temperature corrosion model of Incoloy 800H alloy connected with Ni-201 in MgCl2–KCl heat transfer fluid
-
Yuxiang Peng


Abstract
Long-term dipping corrosion experiments on Incoloy 800H (800H) in molten eutectic MgCl2–KCl salt at 1,073 K with and without connection with Ni-201 alloy were carried out. While connecting with Ni-201 alloy, the corrosion rate of 800H was 4.47 ± 0.26 mg·cm−2·day−1 (10−3.55±0.02 A·cm−2). However, the corrosion rate for the 800H that was not connected to the Ni-201 alloy was 3.00 ± 0.27 mg·cm−2·day−1 (10−3.71±0.04 A·cm−2). Therefore, Ni-201 alloy accelerates the corrosion rate of 800H in the molten MgCl2–KCl salt while connecting to each other. In addition, based on the calculation of Gibbs energy of Ni–Fe–Cr alloy and exchange current density of 800H in MgCl2–KCl salt, a new Tafel model was developed to predict the corrosion rate of 800H alloys. The corrosion rate calculated by the new model is 10−3.74 A·cm−2, which agrees with the experimental data.
1 Introduction
Global warming has been recognized as one of the serious environmental problems in the world, and renewable energy sources are playing a vital role in our daily lives. Therefore, solar energy is emphasized as one of the promising energy sources to satisfy the large requirements in both industry and daily life [1]. In addition, solar energy collection systems such as concentrated solar power plants, parabolic troughs, linear Fresnel, and central receiver towers have gained popularity in recent years [2]. In these systems, thermal energy storage plays an essential role in collecting solar energy and transferring the heat to the steam generator. Some limitations like relatively low energy conversion efficiency and no solar energy collection in the night can be overcome by optimizing the energy collection method and thermal energy storage system and using proper heat transfer fluid (HTF).
The molten salt may be one of the proper HTFs flowing through the storage for charging and discharging because of its better thermal properties and higher energy-transferring efficiency [3]. The most current one is the molten mixture of alkali nitrates because of its low melting point and stability for long-time serving [4,5,6,7,8]. However, the next generation of solar power conversion systems is serving at a higher temperature, and the temperature at the solar energy receiver may reach above 1,473 K [9]. And that high temperature exceeds the nitrate stability range [10]. The high vapor pressure of carbonate salts as HTF is the limitation [11]. In addition, fluoride salt has strong corrosiveness to the alloy structure [12]. It is clearly understood that renewable energy technologies need to be competitive with traditional energy sources, and lower cost should be emphasized as a significant factor. Therefore, chloride salt seems to be a possible candidate in the solar energy system, especially for the eutectic MgCl2–KCl salt [12]. In addition, MgCl2–KCl salt has comparable thermal properties such as heat capacity, thermal conductivity, and low melting point [12].
In fact, MgCl2–KCl was the first to serve as the HTF in the nuclear industry [13]. However, the widespread applicability of MgCl2–KCl is still limited because of its corrosive properties. The passive oxide films formed by adding Cr, Al, or Si to shield the alloy material from corrosion in the environment are unstable in the molten salt [12]. For the construction material, a prime consideration is its corrosion resistance to the molten salts. According to Brookhaven National Laboratory, Ni is the most stable element in chloride salts, followed by Fe, Cr, and Al [14]. Therefore, Fe-based alloy like stainless steel is not stable in molten salt [15]. In addition, because Ni-based alloy has a face-centered cubic crystal structure, their ductility and toughness can meet the high-temperature applications [16]. To minimize the corrosion damage in the air at higher temperatures, a material designed for holding the molten chloride salt was alloyed with at least 6 atom% of Cr [17]. Hence, Incoloy 800H, an Ni–Fe–Cr-based alloy, was selected for the long-term static corrosion studies in MgCl2–KCl in the present research. Moreover, 800H shows excellent structural properties at high temperatures [18].
Because quartz, nickel, or alumina crucibles are particularly stable in molten chloride salt, they are utilized in static corrosion tests [12]. However, the crucible may have an effect on the corrosion of tested samples. Olson et al. [19] and Qiu et al. [20] found that a Cr-rich film formed not only on the graphite crucible but also on the Ni crucible during corrosion studies in LiF–NaF–KF (FLiNaK). In fact, the crucible may hasten the corrosion rate in the MgCl2–KCl salt, and the quartz crucible resulted in a more significant weight loss of alloys in the MgCl2–KCl molten salt than the nickel and alumina crucible [12]. The corrosion of alloys within the crucible has been suggested to be a non-electron transferring process [21]. However, as the alloy was in contact with the Ni crucible, the corrosion model can also be constructed based on the electron-transferring process and Cr3+ and Fe3+ ion-diffusion process.
As few results with sufficient credibility on the corrosion mechanism of alloy corrosion in molten salt within an Ni crucible have yet to be obtained, a fundamental approach needs to be studied. In the present work, long-term dipping corrosion experiments of 800H in MgCl2–KCl in an Al2O3 crucible were carried out under an argon gas atmosphere for 100 h. The 800H plate was connected with and without the Ni plate to investigate the influence of Ni on the corrosion mechanism of 800H in MgCl2–KCl. The corrosion rate of 800H in MgCl2–KCl was evaluated with known weight loss after corrosion. A corrosion simulation model of 800H corrosion in MgCl2–KCl with the Ni crucible was built based on the calculation of Gibbs energy of the Ni–Cr–Fe alloy and the exchange current density of the 800H alloy.
2 Experimental
2.1 Materials
The MgCl2 and KCl single salts with high-purity grades were purchased from VWR International. The salts were weighed in a proper ratio and then mixed in the jar milling machine for 12 h in a glove box with dry ultra high purity (UHP) argon gas. The mixed salts were heated in a vacuum furnace at 423 K for at least 24 h before conducting a long-term dipping corrosion experiment. The alloys used in the present research are Incoloy 800H and Ni-201. Table 1 shows the composition of 800H in mole percentage, which is calculated from the composition in mass percentage [22].
Chemical composition of Incoloy 800H in mole%
| Alloy | Cr | Fe | Ni | Al | C | Mn | Ti | Co | Si |
|---|---|---|---|---|---|---|---|---|---|
| 800H | 22.1 | 45.8 | 28.9 | 1.1 | 0.3 | 0.5 | 0.6 | 0.1 | 0.6 |
2.2 Methods
The 800H alloy was machined into samples with dimensions of about 10 mm × 12 mm × 1.2 mm. The samples were ground with 600, 800, and 1,200 grit SiC abrasive paper progressively to remove the oxidized surface. The samples were cleaned with deionized (DI) water, followed by acetone, and air dried. The weight of samples was carefully measured prior to the corrosion experiment to calculate the corrosion rate in terms of weight change. The dimensions and weights of 800H and Ni-201 samples before corrosion are listed in Table 2.
Dimensions and weight of 800H and Ni-201 samples
| Experiments | Sample | Length (mm) | Width (mm) | Thickness(mm) | Weight (g) |
|---|---|---|---|---|---|
| Set 1 | 800H (C1) | 11.25 | 9.40 | 1.40 | 1.213 |
| Ni-201 (C1) | 11.70 | 7.80 | 0.25 | 0.200 | |
| 800H (C2) | 11.66 | 9.60 | 1.44 | 1.247 | |
| Ni-201 (C2) | 12.36 | 10.06 | 0.25 | 0.235 | |
| 800H (C3) | 11.25 | 10.56 | 1.42 | 1.406 | |
| Ni-201 (C3) | 11.90 | 11.10 | 0.25 | 0.278 | |
| Set 2 | 800H (N1) | 11.35 | 9.60 | 1.45 | 1.264 |
| Ni-201 (N1) | 11.90 | 8.10 | 0.25 | 0.211 | |
| 800H (N2) | 11.68 | 9.86 | 1.46 | 1.283 | |
| Ni-201 (N2) | 11.08 | 9.60 | 0.25 | 0.225 | |
| 800H (N3) | 11.30 | 9.40 | 1.44 | 1.262 | |
| Ni-201 (N3) | 11.54 | 9.86 | 0.25 | 0.244 |
C means during corrosion, 800H and Ni-201 were connected with Ni wire, and N means that they were not connected.
The actual experimental setup is shown in Figure 1.

Schematic of experimental setup: (a) is set 1 and (b) is set 2 (Table 2), 1 (a) – alumina single bore tube, 1 (b) – double bore tube, 2 – short alumina tube, 3 – Ni cover, 4 – Ni wire, 5 – Al2O3 crucible, 6 – 800H sample, and 7 – Ni-201 sample.
As seen from Table 2 and Figure 1, in set 1, 800H (C) alloy and Ni-201 (C) alloy were combined with an Ni wire. In set 2, the Ni wires in the alumina double bore tube were not contacted; thus, 800H (N) and Ni-201 (N) were not connected. Both set 1 and set 2 used the alumina tube or the double bore tube to protect the Ni wire from touching the Ni cover. Samples with the Ni cover were placed on the Al2O3 crucible, and salt was loaded into the crucible. All the processes were carried out inside a glove box under the UHP argon atmosphere. The crucible was placed inside a vertical furnace tube, which was tightly sealed in the glove box. The tube was later transferred to the high-temperature corrosion cell containing high-purity argon.
Following the corrosion test, the salt was removed from the crucible using DI water in the ultrasonic cleaner (CODY CD-2800). Samples were removed from the crucible and rinsed with DI water several times to remove possible residual salt. Samples were dried with air, and their dimensions and weight were carefully measured to calculate the corrosion rate. Then, the corroded specimens were analyzed by scanning electron microscopy (SEM) and energy-dispersive X-ray spectroscopy (EDS).
2.3 High-temperature corrosion cell
Corrosion tests were carried out in a high-temperature corrosion cell, as shown in Figure 2.

Schematic of high-temperature corrosion cell for corrosion test (1 – pressure gauge, 2 – vacuum valve, 3 – argon valve, 4 – needle valve, 5 – stainless steel cap, 6 – rubber O-rings, 7 – one-end-closed alumina tube, 8 – insulation cover, 9 – furnace with insulation material, 10 – heating elements, 11 – test samples in the alumina tube, and 12 – thermocouple).
Figure 2 shows the schematic diagram of the high-temperature corrosion cell used in the present work. Wang et al. [15] previously illustrated the entire experimental setup design for the corrosion test. The corrosion cell was in a long, one-end-closed alumina tube. This alumina tube was placed in a vertical resistance furnace, and the temperature was monitored via a thermocouple inserted into the chamber. The entire furnace was well insulated to decrease the thermal gradient, especially at the bottom of the alumina tube. The alumina tube (part 7 in Figure 2) was covered by a stainless steel cap, and three rubber O-rings were placed inside the cap to seal the whole system. Swagelok tube fitting connectors were used for the gas purging system on the top of the corrosion cell. Two valves connected with Swagelok tubes were used to adjust the vacuum and enter the argon gas. The needle valve was designed to eliminate the possible leak due to the damage of those two valves.
Before the corrosion experiment, the temperature was calibrated for the corrosion cell. The furnace was evacuated using a vacuum pump and flushed with UHP argon gas at least two times to eliminate the possible air or moisture inside the system. The furnace was then heated and held at 673 K for 1 h to remove the moisture from the salt or hydrated water with the salt. The furnace was again evacuated and flushed with argon gas before being maintained at a steady pressure slightly higher than atmospheric pressure. Eventually, the furnace was heated to 1,073 K and maintained for 100 h.
3 Results and discussion
3.1 Weight loss and EDS analysis
The results of the weight change of the 800H and Ni-201 samples after corrosion in molten MgCl2–KCl at 1,073 K for 100 h are shown in Table 3. Based on the weight loss of the samples, the corrosion rate can be calculated, as shown in Table 3.
Weight change of 800H and Ni-201 after corrosion in MgCl2–KCl at 1,073 K (negative value is weight gain of the sample, and a positive value is weight loss)
| Sample | Weight before corrosion (g) | Weight after corrosion (g) | Weight loss (g) | Corrosion rate (mg·cm−2·day−1) |
|---|---|---|---|---|
| 800H (C1) | 1.213 | 1.16 | 0.053 | 4.723 |
| Ni-201 (C1) | 0.200 | 0.205 | −0.005 | N.A. |
| 800H (C2) | 1.247 | 1.197 | 0.050 | 4.209 |
| Ni-201 (C2) | 0.235 | 0.245 | −0.010 | N.A. |
| 800H (C3) | 1.406 | 1.344 | 0.056 | 4.487 |
| Ni-201 (C3) | 0.278 | 0.292 | −0.014 | N.A. |
| 800H (N1) | 1.264 | 1.226 | 0.038 | 3.273 |
| Ni-201 (N1) | 0.211 | 0.204 | 0.007 | 0.828 |
| 800H (N2) | 1.283 | 1.243 | 0.040 | 3.274 |
| Ni-201 (N2) | 0.225 | 0.218 | 0.007 | 0.753 |
| 800H (N3) | 1.262 | 1.231 | 0.031 | 2.735 |
| Ni-201 (N3) | 0.244 | 0.236 | 0.008 | 0.806 |
As seen from Table 3, the Fe- and Cr-containing 800H alloy shed more weight than the Ni-201 alloy. In fact, Cr and Fe have been proven to be more susceptible than Ni in molten salt [13]. In addition, the average corrosion rate of 800H (C) was 4.47 ± 0.26 mg·cm−2·day−1, while the rate of 800H (N) was 3.00 ± 0.27 mg·cm−2·day−1. The result is reasonable and lower than the corrosion rates at 1,123 K (4.84 ± 0.133 mg·cm−2·day−1) and 1,273 K (6.68 mg·cm−2·day−1) [22,23]. As shown in Table 3, there is no significant difference between the corrosion rates of 800H (C) and 800H (N). However, the corrosion mechanism was varied while 800H (C) and Ni-201 (C) were connected. When 800H (N) and Ni-201 (N) were not connected, the corrosion process was only intrinsic during the corrosion process, and Cr and Fe were dissolved into the salt, which could not be recovered. When 800H (C) and Ni-201 (C) were connected, galvanic corrosion occurred between salt and 800H (C) alloy. The dissolved Cr and Fe ions were reduced and deposited on Ni-201 (C). In addition, the corrosion rate can be controlled by varying the surface area of 800H (C) or Ni-201 (C) alloys. Therefore, the weight of Ni-201 (C) was increased due to the deposition of Cr and Fe from 800H (C) alloy, which was confirmed by elemental analysis (EDS). However, for the Ni-201 (N) sample, the weight was decreased after corrosion.
After the corrosion test, the surface morphology of corroded samples was examined with SEM, and the SEM images of 800H (C) and 800H (N) are shown in Figure 3.

Scanning electron microscopy images of 800H after corrosion testing in MgCl2–KCl at 1,073 K for 100 h. (a) 800H (C) connected with Ni-201 and (b) 800H (N) not connected with Ni-201.
As seen from Figure 3, the pitting corrosion was more severe for 800H (C) alloy, resulting in a more porous microstructure on the surface (Figure 3a) than 800H (N) alloy (Figure 3b). In Figure 3b, grain boundaries were more distinct in 800H (N), which agrees with the previous literature [22]. While pitting corrosion was strong on the surface of 800H (C) (Figure 3a), grain boundaries were not visible in the SEM image. The elements on the surface of 800H (C) and 800H (N) were confirmed using EDS analysis, as shown in Figures 4 and 5.

EDS results of the surface of 800H (C) after the corrosion test in MgCl2–KCl at 1,023 K.

EDS results of the surface of 800H (N) after the corrosion test in MgCl2–KCl at 1,023 K.
Following corrosion, the corroded 800H sample presents considerable Cr depletion, resulting in a significant increase in the Ni element (atom%) compared to the pre-corrosion sample (Table 1). This phenomenon was observed in both sets of the experiments. A minor quantity of Fe was also dissolved in the MgCl2–KCl salt as the molar ratio of Fe to Ni fell after the corrosion test. Similar to our previous result [22], Al and Ti were found on the surface of 800H (C) and in the EDS analysis of 800H (N). The EDS analysis of Ni-201 (C) and Ni-201 (N) was also carried out to investigate the deposition of Fe and Cr on the Ni-201 plate, and results are shown in Figures 6 and 7.
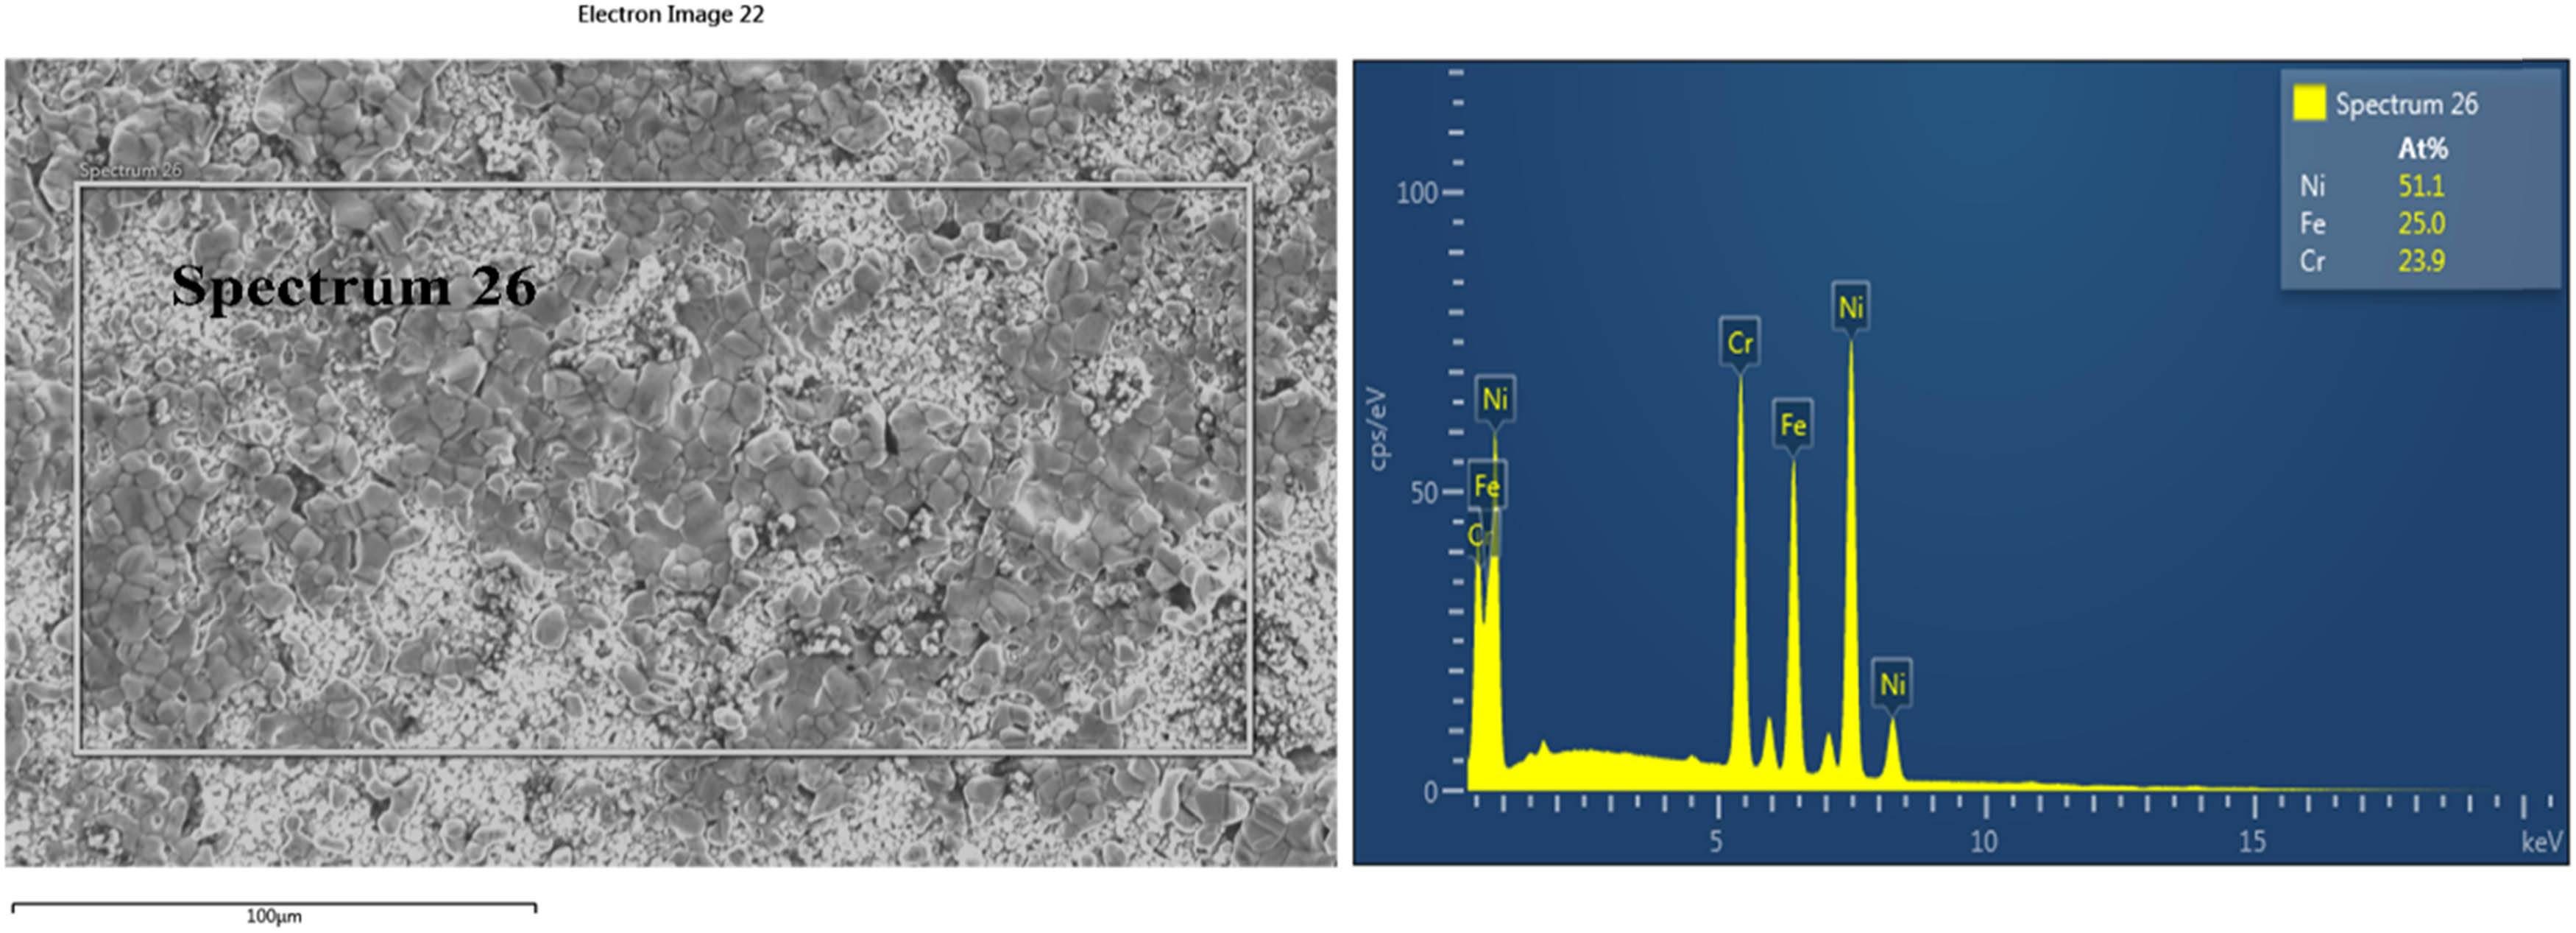
EDS results of the surface of Ni-201 (C) after the corrosion test in MgCl2–KCl at 1,073 K.

EDS results of the surface of Ni-201 (N) after the corrosion test in MgCl2–KCl at 1,073 K.
As mentioned in Table 3, Ni-201 (C) gained weight, while Ni-201 (N) lost weight after the corrosion test. As illustrated in Figure 6, some depositions were detected on the surface of Ni-201 (C). In Figure 7, grain boundaries of Ni-201 (N) were attacked due to intergranular corrosion, which is comparable with the observation found by Olson et al. [24]. From the EDS analysis, the weight gain of Ni-201 (C) is due to Fe and Cr deposition. For Ni-201 (N), traces of Fe and Cr were detected on the surface. According to Ozeryanaya [21], Fe and Cr from 800H (N) underwent the non-electrochemical transfer process and deposited on Ni-201 (N) despite the fact that 800H (N) and Ni-201 (N) were not contacted. The details of transferring process are listed in the following equations:
As a result of Cr3+ and Fe3+ entering the molten salt, Fe and Cr in 800H (N) were further corroded. However, this minor amount of Cr and Fe deposition had no effect on the weight gain of the Ni-201 (N) alloy. The surface composition of 800H and Ni-201 alloys after the corrosion test is summarized in Table 4.
EDS results of the surface of 800H and Ni-201 alloys after the corrosion test in MgCl2–KCl at 1,023 K
| Sample (at.%) | Ni | Fe | Cr | Al | Ti |
|---|---|---|---|---|---|
| 800H (C) | 39.2 | 50.0 | 3.0 | 5.8 | 2.0 |
| 800H (N) | 42.8 | 54.0 | 3.2 | — | — |
| Ni-201 (C) | 51.1 | 25.0 | 23.9 | ||
| Ni-201 (N) | 94.4 | 5.1 | 0.5 |
3.2 Thermodynamic calculation of Ni–Fe–Cr alloy
As seen from Table 3, Ni-201 (C) enhanced the corrosion rate of 800H (C) alloy when they are not connected. In addition, Fe and Cr were deposited on the Ni-201 (C) plate to generate the Ni–Fe–Cr alloy. It is a safe assumption that the driving force of the elements depositing on Ni-201 (C) is the Gibbs energy of Cr and Fe alloying with Ni. According to the phase diagram of Ni–Fe–Cr, Ni0.511Fe0.250Cr0.239 is an fcc structure at 1,073 K [25]. The calculation of the Gibbs energy of Ni–Fe–Cr (fcc structure) solution is shown in the following equations [26,27]:
where
The Gibbs energy of Ni, Fe, and Cr at 1,073 K was calculated using HSC 5.1 software [29], and the values were −50,074, −47,321, and −40,862 J, respectively. Therefore, the Gibbs energy of the formation of Ni0.511Fe0.25Cr0.239 alloy was calculated, as shown in the following equation:
The negative Gibbs energy of the reaction indicates that Cr, Fe, and Ni were spontaneously formed as Ni0.511Fe0.25Cr0.239 alloys at 1,073 K.
3.3 Galvanic corrosion with Cr(iii) and Fe(iii) ion diffusion
As the 800H (C) alloy and Ni-201 (C) alloy were connected with Ni wire in the molten MgCl2–KCl electrolyte in the corrosion test, the galvanic corrosion model was constructed. It was assumed that Cr3+ and Fe3+ ions diffused in the electrolyte from 800H (C) alloy to Ni-201 (C) alloy. The theoretical potential of the selective dissolution of the element (Cr and Fe) from the 800H (C) alloy was calculated using the Nernst equation given by the following equation [30]:
where E o is the standard potential calculated from the standard Gibbs energy data (∆G o = −nFE o ), n is the number of transferred electrons, F is the Faraday constant, R is the universal gas constant, T is the temperature in K, J is the ratio of the activity of the oxidized state to the activity of the reduced state. J is calculated considering a(Cl−) = 1 and a(Malloy,s) is the activity of Cr or Fe in the initial 800H (C) alloy before the corrosion test. The initial 800H (C) alloy was assumed as a ternary alloy to calculate the activity of Cr and Fe, ignoring the minor elements. The assumed alloys with maximum and minimum activity values of Cr and Fe are listed in Table 5.
Assumed ternary alloys based on the initial composition and the activities of Cr and Fe at 1,073 K
| Alloys | Assumed ternary alloy | Activity of Cr | Activity of Fe |
|---|---|---|---|
| 800H (C) | 0.253Cr–0.289Ni–0.458Fe | 0.32 | 0.47 |
| 0.221Cr–0.321Ni–0.458Fe | 0.28 | 0.47 | |
| 0.221Cr–0.289Ni–0.490Fe | 0.28 | 0.51 |
Therefore, the galvanic reactions are listed in equations (21)–(23), and an equilibrium quotient, the J value of anode, is shown in the following equation:
Activities of CrCl3 and FeCl3 were assumed to be 1 for simplification. Therefore, the potential of the anode and cathode was calculated based on the known standard potentials [29] and activities [31] of Fe and Cr in 800H (C). The upper limit and the lower limit of the potentials are listed in Table 6.
Anode and cathode potentials of 800H alloy in MgCl2–KCl at 1,073 K
| Samples | Activity of Fe | Activity of Cr | Anode potential (V) | Cathode potential (V) | Total potential (V) |
|---|---|---|---|---|---|
| 800H (L) | 0.47 | 0.28 | 4.348 | −4.285 | 0.063 |
| 800H (U) | 0.51 | 0.32 | 4.349 | −4.285 | 0.064 |
L means the lower limit and U means the upper limit of the variation of total potential.
The different assumed activities of Cr and Fe lead to the different anode potentials. However, the potential difference between 800H (L) and 800H (U) is insignificant (Table 6). Therefore, the upper limit of the variation was ignored in the following calculation. To better compare with experimental data, potentials vs SHE were converted to potentials vs Li/LiCl, and the results are listed in Table 7.
Anode and cathode potentials vs Pt of 800H alloy in MgCl2–KCl at 1,073 K
| Samples | Activity of Fe | Activity of Cr | Anode potential vs Li/LiCl (V) | Cathode potential vs Li/LiCl(V) | Total potential (V) |
|---|---|---|---|---|---|
| 800H | 0.47 | 0.28 | −2.437 | 2.500 | 0.063 |
3.4 Calculation of corrosion potential and corrosion rate
Corrosion potential and corrosion rate were investigated using the Tafel curve model. The Tafel slope is calculated by the following equation:
where R is the universal gas constant, T is the temperature in K, n is the transferred electron number, F is the Faraday constant, and the parameter alpha is assumed to be 0.5. Thus, the calculated Tafel slope is
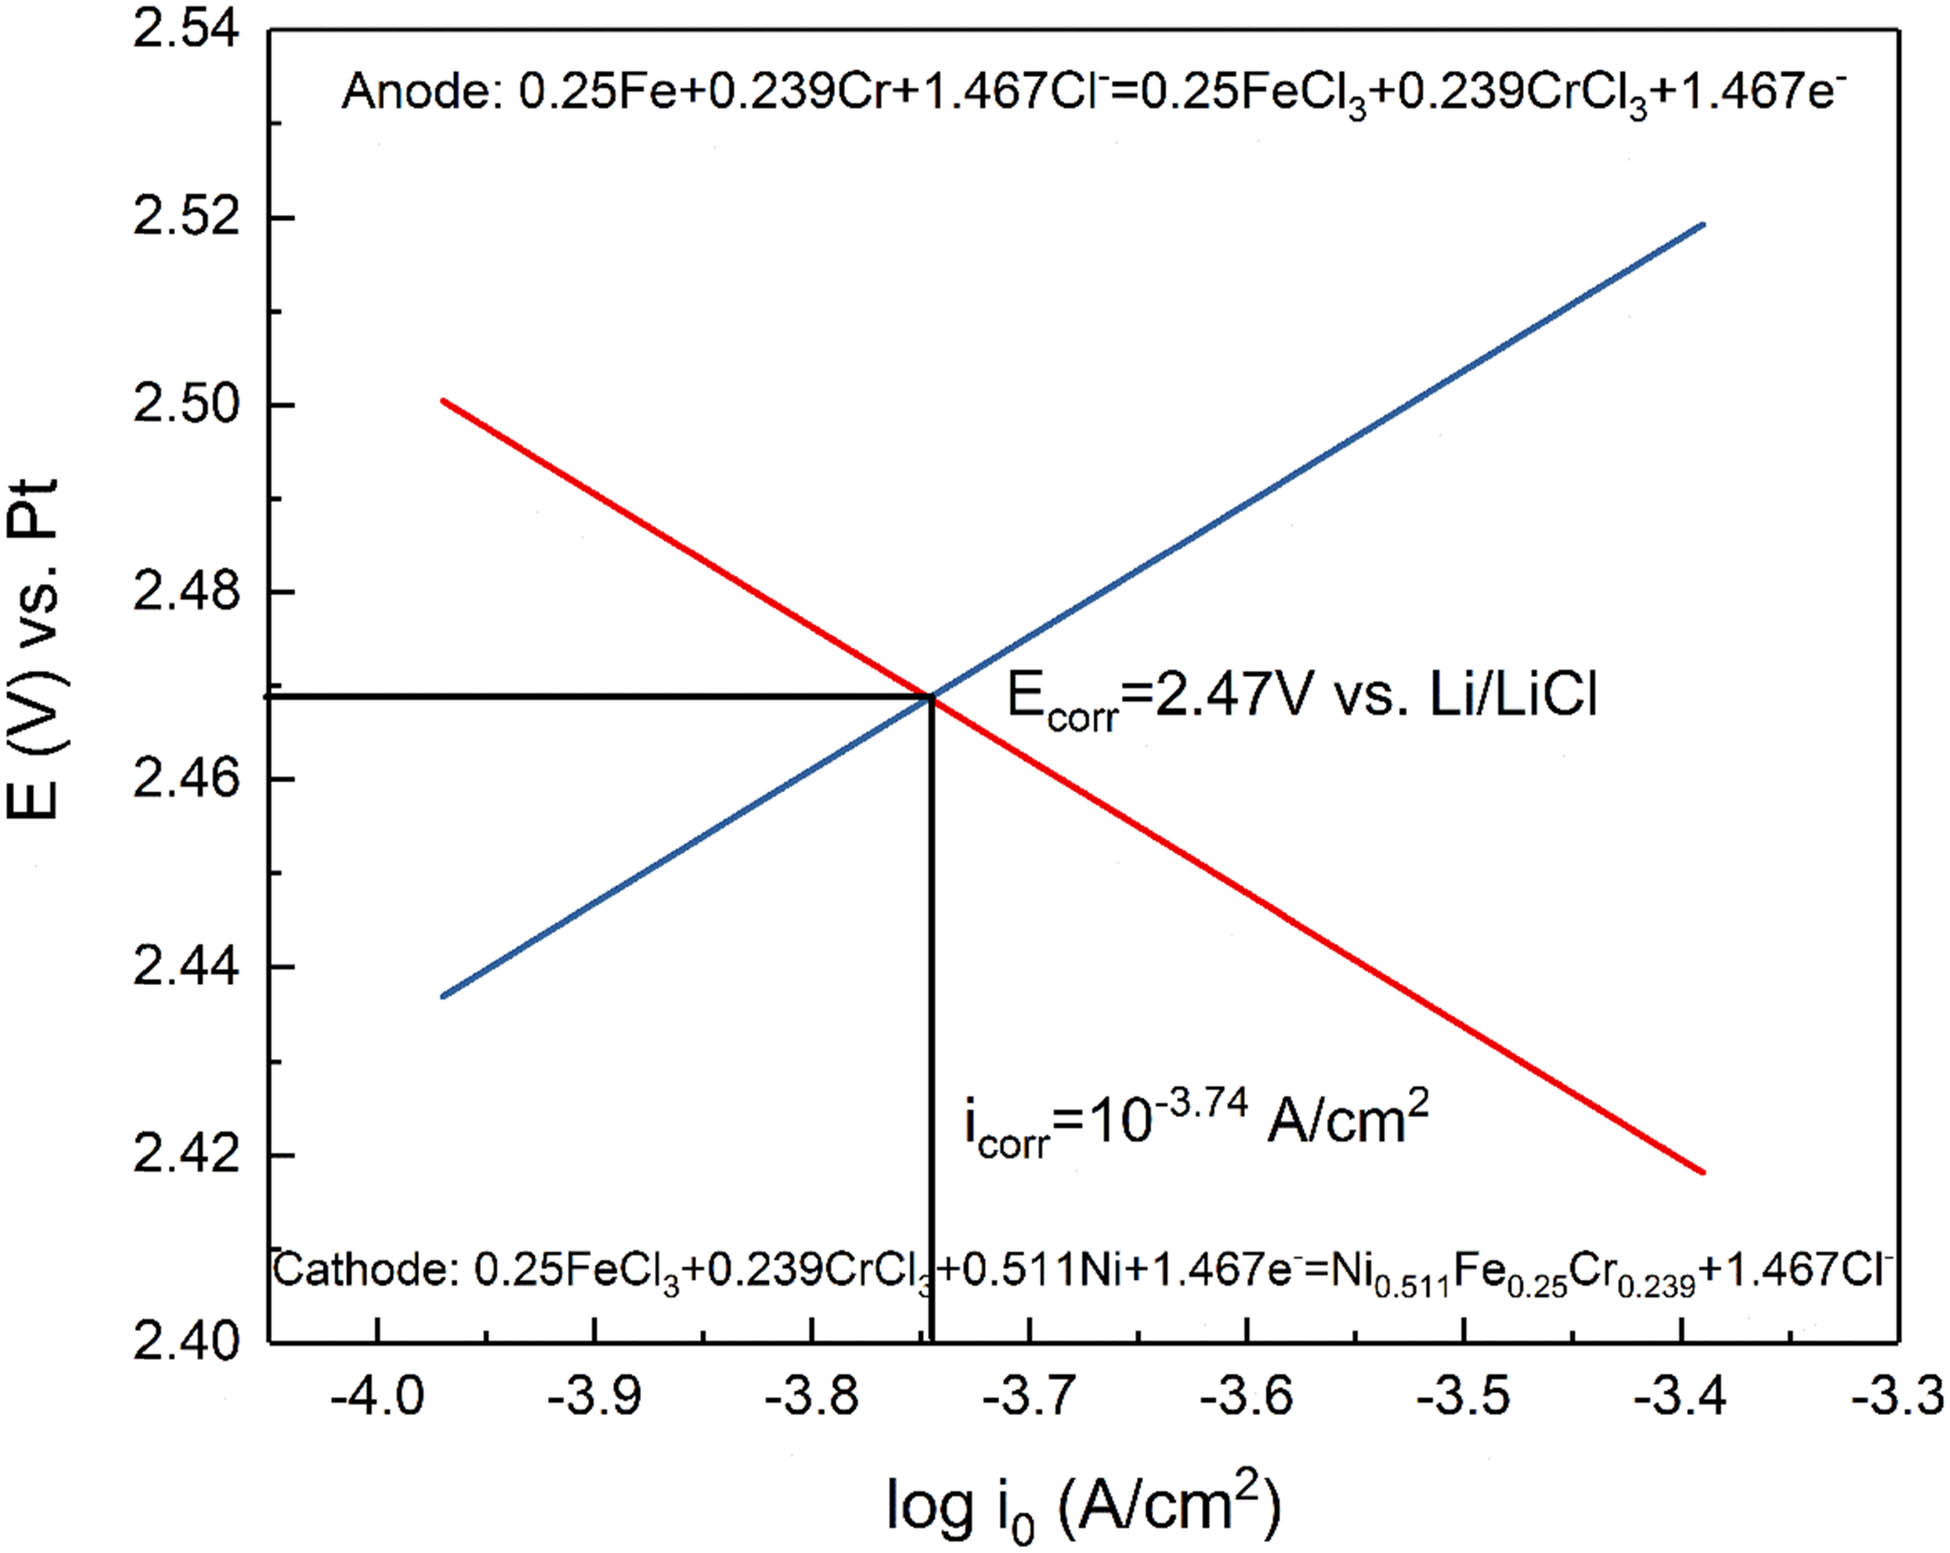
Predicted Tafel curve of 800H (C) connected with Ni-201 (C) corrosion in KCl-MgCl2 at 1,073 K.
As seen in Figure 8, the corrosion potential (E corr) was 2.47 V vs Li/LiCl, and the corrosion rate (i corr) was 10−3.74 A·cm−2. The corrosion potential seems to be reasonable compared to the potential in MgCl2–KCl at 1,123 K, which is 2.32 V vs Li/LiCl [23]. Weight loss of 800H (C) was due to the depletion of Cr and Fe and finally deposited on the Ni-201 (C). Therefore, weight loss can be converted to the corrosion rate in current density by using the following equation:
where n is the transferred electrons, and M is the average atomic weight of Cr and Fe (54 g·mol−1). Therefore, the corrosion rate calculated from the experiment and simulation model is shown in Table 8.
Experimental and calculated corrosion rates of 800H (C) in MgCl2–KCl at 1,023 K
| Sample | Corrosion rate (mg·cm−2·day−1) | Corrosion rate (A·cm−2) | Calculated corrosion rate (A·cm−2) |
|---|---|---|---|
| 800H (C) | 4.466 ± 0.257 | 10−3.55 ± 0.03 | 10−3.74 |
The intrinsic corrosion (elements dissolved without galvanic influence) is ignored in the Tafel model to calculate the corrosion rate, which results in a lower corrosion rate than the experimental corrosion rate. However, corrosion of alloys in molten salt was contributed by galvanic and intrinsic corrosion. All the elements depleted from 800H alloy should be considered in the corrosion rate calculations, but the dissolving rate was hard to estimate technically. However, this Tafel model still explains the driving force of the deposition and predicts corrosion rate, and a very good agreement between them was observed. This new model might contribute to predicting the corrosion rate and ranking the corrosion resistance of different alloys.
4 Conclusions
The 800H alloys connected with and without Ni-201 alloys were evaluated for corrosion in molten MgCl2–KCl salt at 1,073 K for 100 h. After the corrosion test, there was no significant difference between the weight loss of the 800H alloy connected with the Ni-201 alloy and that was not connected. However, the corrosion mechanism was changed when the Ni-201 or Ni crucible was connected with 800H alloy in MgCl2–KCl salt. During the analysis of SEM-EDS, the depletion of Cr and Fe was observed on the surface of the 800H alloy. In addition, Cr and Fe deposition was detected on the surface of the Ni-201 sample that was connected with the 800H alloy. However, only a trace amount of Fe and Cr were observed on the surface of the other Ni-201 sample, which was not connected with 800H alloy. The driving force of the deposition of Cr and Fe is the Gibbs energy of the formation of Ni–Fe–Cr alloy when the 800H alloy was connected with the Ni-201 alloy. Moreover, the negative Gibbs energy of reaction confirms that Fe and Cr were spontaneously transferring to the Ni and depositing on it. Thus, deposition of Cr and Fe on Ni can be explained as galvanic corrosion according to the negative Gibbs energy of formation. The anode and cathode potentials were calculated using the known standard potentials and activities of Fe and Cr in the 800H alloy. Therefore, a new Tafel model of 800H alloy corrosion in MgCl2–KCl with Ni-201 was developed. The corrosion rate and corrosion potential predicted by the new model were comparable with the experimental data. The small variation in the corrosion rate is due to the intrinsic corrosion, which was ignored during the model calculation.
Acknowledgments
The authors are pleased to acknowledge the financial support from the Department of Energy and the ACIPCO for this research project. We also thank the Department of Metallurgical and Materials Engineering at the University of Alabama for providing the experimental and analytical facilities.
-
Funding information: The authors are pleased to acknowledge the financial support from Department of Energy and the ACIPCO for this research project.
-
Author contributions: Yuxiang Peng: Conceptualization, Investigation and analysis, Writing – original draft, review and editing. Muhammad A. Imam: Formal analysis, Writing – review and editing. Ramana G. Reddy: Conceptualization, Investigation, Formal analysis, Supervision, Writing – original draft, review and editing.
-
Conflict of interest: Authors state no conflict of interest.
-
Data availability statement: The data that support the findings of this study are available from the corresponding author, [R. G. Reddy], upon reasonable request.
References
[1] Sabharwall, P., M. Ebner, M. Sohal, and P. Sharpe, INL/EXT-10-18090, Idaho National Laboratory (INL), 2010.Search in Google Scholar
[2] Fernández-García, A., E. Zarza, L. Valenzuela, and M. Pérez. Parabolic-trough solar collectors and their applications. Renewable and Sustainable Energy Review, Vol. 14, 2010, pp. 1695–1721.10.1016/j.rser.2010.03.012Search in Google Scholar
[3] Gomez-Vidal, J. C. and R. Tirawat. Corrosion of alloys in a chloride molten salt (NaCl-LiCl) for solar thermal technologies. Solar Energy Materials & Solar Cells, Vol. 157, 2016, pp. 234–244.10.1016/j.solmat.2016.05.052Search in Google Scholar
[4] Reddy, R. G., T. Wang, and D. Mantha. Effect of general anesthetics on the developing brain. Thermochimica Acta, Vol. 531, 2012, pp. 6–11.10.1016/j.tca.2011.12.010Search in Google Scholar
[5] Mantha, D., T. Wang, and R. G. Reddy. Thermodynamic Modeling of Eutectic Point in the LiNO3-NaNO3-KNO3 Ternary System. Journal of Phase Equilibria and Diffusion, Vol. 33, 2012, pp. 110–114.10.1007/s11669-012-0005-4Search in Google Scholar
[6] Wang, T., D. Mantha, and R. G. Reddy. Thermal stability of the eutectic composition in LiNO3–NaNO3–KNO3 ternary system used for thermal energy storage. Solar Energy Materials & Solar Cells, Vol. 100, 2012, pp. 162–168.10.1016/j.solmat.2012.01.009Search in Google Scholar
[7] Wang, T., S. Viswanathan, D. Mantha, and R. G. Reddy. Thermal conductivity of the ternary eutectic LiNO3–NaNO3–KNO3 salt mixture in the solid state using a simple inverse method. Solar Energy Materials & Solar Cells, Vol. 102, 2012, pp. 201–207.10.1016/j.solmat.2012.02.030Search in Google Scholar
[8] Wang, T., D. Mantha, and R. G. Reddy. High thermal energy storage density LiNO3–NaNO3–KNO3–KNO2 quaternary molten salt for parabolic trough solar power generation. Energy Technology, Vol. 73, 2012, pp. 73–84.10.1002/9781118365038.ch10Search in Google Scholar
[9] Alexopoulos, S. and B. Hoffschmidt. Solar tower power plant in Germany and future perspectives of the development of the technology in Greece and Cyprus. Renewable Energy, Vol. 35, 2010, pp. 1352–1356.10.1016/j.renene.2009.11.003Search in Google Scholar
[10] Reilly, H. and G. Kolb, SAND-2001-3674 Sandia National Laboratories, 2001.10.1016/S1471-3918(01)80059-9Search in Google Scholar
[11] Passerini, S. Optical and chemical properties of molten salt mixtures for use in high temperature power systems. Ph.D. Dissertation, Massachusetts Institute of Technology, 2010.Search in Google Scholar
[12] Sridharan, K., M. Anderson, T. Allen, and M. Corradini, DOE/ID 14826, University of Wisconsin: 2012.Search in Google Scholar
[13] Williams, D. ORNL/TM-2006/69, Oak Ridge National Laboratory (ORNL), 2006.Search in Google Scholar
[14] Susskind, H., F. Hill, L. Green, S. Kalish, L. Kukacka, and W. McNulty, BNL-585, Brookhaven National Laboratory, 1960.Search in Google Scholar
[15] Wang, T., D. Mantha, and R. G. Reddy. The corrosion behavior of stainless steel 316L in novel quaternary eutectic molten salt system. High Temperature Materials and Processes, Vol. 36, 2017, pp. 257–265.10.1515/htmp-2015-0202Search in Google Scholar
[16] Zahrani, E. M. and A. Alfantazi. Molten salt induced corrosion of Inconel 625 superalloy in PbSO4–Pb3O4–PbCl2–Fe2O3–ZnO environment. Corrosion Science, Vol. 65, 2012, pp. 340–359.10.1016/j.corsci.2012.08.035Search in Google Scholar
[17] Anderson, M., K. Sridhara, T. Allen, and P. Peterson, NEUP-Project-09-777, University of Wisconsin, 2012.Search in Google Scholar
[18] Sadananda, K. and P. Shahinian. Creep crack growth behavior of several structural alloys. Metallurgical Transactions A: Physical Metallurgy and Materials Science, Vol. 14, 1983, pp. 1467–1480.10.1007/BF02664831Search in Google Scholar
[19] Olson, L. C., R. E. Fuentes, M. J. Martinez-Rodriguez, J. W. Ambrosek, K. Sridharan, and M. H. Anderson. Impact of corrosion test container material in molten fluorides. Journal of Solar Energy Engineering, Vol. 137, 2015, id. 061007.10.1115/1.4031682Search in Google Scholar
[20] Qiu, J., Y. Zou, G. Yu, H. Liu, Y. Jia, Z. Li, et al. Compatibility of container materials with Cr in molten FLiNaK salt. Journal of Fluorine Chemistry, Vol. 168, 2014, pp. 69–74.10.1016/j.jfluchem.2014.09.010Search in Google Scholar
[21] Ozeryanaya, I. Corrosion of metals by molten salts in heat-treatment processes. Metal Science and Heat Treatment, Vol. 27, 1985, pp. 184–188.10.1007/BF00699649Search in Google Scholar
[22] Wang, T. and R. G. Reddy. Corrosion of nickel-based alloys in ultra-high temperature heat transfer fluid. High Temperature Materials and Processes, Vol. 36, 2017, pp. 267–277.10.1515/htmp-2016-0017Search in Google Scholar
[23] Olson, L. C., D. B. Garcia, R. Fuentes, R. M. Marinez, R. G. Reddy, and J. Gray, SRNL-STI-2013-00507, Savannah River National Laboratory, 2013.Search in Google Scholar
[24] Olson, L. C., J. W. Ambrosek, K. Sridharan, M. H. Anderson, and T. R. Allen. Materials corrosion in molten LiF–NaF–KF salt. Journal of Fluorine Chemistry, Vol. 130, 2009, pp. 67–73.10.1016/j.jfluchem.2008.05.008Search in Google Scholar
[25] Yen, Y. W., J. W. Su, and D. P. Huang. Phase equilibria of the Fe–Cr–Ni ternary systems and interfacial reactions in Fe–Cr alloys with Ni substrate. Journal of Alloys and Compounds, Vol. 457, 2008, pp. 270–278.10.1016/j.jallcom.2007.03.053Search in Google Scholar
[26] Kjellqvist, L., M. Selleby, and B. Sundman. Thermodynamic modelling of the Cr–Fe–Ni–O system. Calphad, Vol. 32, 2008, pp. 577–592.10.1016/j.calphad.2008.04.005Search in Google Scholar
[27] Huang, W. and Y. Chang. Thermodynamic properties of the Ni–Al–Cr system. Intermetallics, Vol. 7, 1999, pp. 863–874.10.1016/S0966-9795(98)00138-1Search in Google Scholar
[28] Sundman, B. Modification of the two-sublattice model for liquids. Calphad, Vol. 15, 1991, pp. 109–119.10.1016/0364-5916(91)90010-HSearch in Google Scholar
[29] Roine, A., HSC Chemistry ver. 5.1, Outo Kumpu. 2002.Search in Google Scholar
[30] Gokcen, N. A. and R. G. Reddy. Thermodynamics, Plenum Press, New York, 1996.10.1007/978-1-4899-1373-9Search in Google Scholar
[31] Bale, C. W., P. Chartrand, S. A. Degterov, G. Eriksson, K. Hack, R. Ben Mahfoud, et al. FactS age thermochemical software and databases. Calphad, Vol. 26, 2002, pp. 189–228.10.1016/S0364-5916(02)00035-4Search in Google Scholar
© 2023 the author(s), published by De Gruyter
This work is licensed under the Creative Commons Attribution 4.0 International License.
Articles in the same Issue
- Research Articles
- First-principles investigation of phase stability and elastic properties of Laves phase TaCr2 by ruthenium alloying
- Improvement and prediction on high temperature melting characteristics of coal ash
- First-principles calculations to investigate the thermal response of the ZrC(1−x)Nx ceramics at extreme conditions
- Study on the cladding path during the solidification process of multi-layer cladding of large steel ingots
- Thermodynamic analysis of vanadium distribution behavior in blast furnaces and basic oxygen furnaces
- Comparison of data-driven prediction methods for comprehensive coke ratio of blast furnace
- Effect of different isothermal times on the microstructure and mechanical properties of high-strength rebar
- Analysis of the evolution law of oxide inclusions in U75V heavy rail steel during the LF–RH refining process
- Simultaneous extraction of uranium and niobium from a low-grade natural betafite ore
- Transfer and transformation mechanism of chromium in stainless steel slag in pedosphere
- Effect of tool traverse speed on joint line remnant and mechanical properties of friction stir welded 2195-T8 Al–Li alloy joints
- Technology and analysis of 08Cr9W3Co3VNbCuBN steel large diameter thick wall pipe welding process
- Influence of shielding gas on machining and wear aspects of AISI 310–AISI 2205 dissimilar stainless steel joints
- Effect of post-weld heat treatment on 6156 aluminum alloy joint formed by electron beam welding
- Ash melting behavior and mechanism of high-calcium bituminous coal in the process of blast furnace pulverized coal injection
- Effect of high temperature tempering on the phase composition and structure of steelmaking slag
- Numerical simulation of shrinkage porosity defect in billet continuous casting
- Influence of submerged entry nozzle on funnel mold surface velocity
- Effect of cold-rolling deformation and rare earth yttrium on microstructure and texture of oriented silicon steel
- Investigation of microstructure, machinability, and mechanical properties of new-generation hybrid lead-free brass alloys
- Soft sensor method of multimode BOF steelmaking endpoint carbon content and temperature based on vMF-WSAE dynamic deep learning
- Mechanical properties and nugget evolution in resistance spot welding of Zn–Al–Mg galvanized DC51D steel
- Research on the behaviour and mechanism of void welding based on multiple scales
- Preparation of CaO–SiO2–Al2O3 inorganic fibers from melting-separated red mud
- Study on diffusion kinetics of chromium and nickel electrochemical co-deposition in a NaCl–KCl–NaF–Cr2O3–NiO molten salt
- Enhancing the efficiency of polytetrafluoroethylene-modified silica hydrosols coated solar panels by using artificial neural network and response surface methodology
- High-temperature corrosion behaviours of nickel–iron-based alloys with different molybdenum and tungsten contents in a coal ash/flue gas environment
- Characteristics and purification of Himalayan salt by high temperature melting
- Temperature uniformity optimization with power-frequency coordinated variation in multi-source microwave based on sequential quadratic programming
- A novel method for CO2 injection direct smelting vanadium steel: Dephosphorization and vanadium retention
- A study of the void surface healing mechanism in 316LN steel
- Effect of chemical composition and heat treatment on intergranular corrosion and strength of AlMgSiCu alloys
- Soft sensor method for endpoint carbon content and temperature of BOF based on multi-cluster dynamic adaptive selection ensemble learning
- Evaluating thermal properties and activation energy of phthalonitrile using sulfur-containing curing agents
- Investigation of the liquidus temperature calculation method for medium manganese steel
- High-temperature corrosion model of Incoloy 800H alloy connected with Ni-201 in MgCl2–KCl heat transfer fluid
- Investigation of the microstructure and mechanical properties of Mg–Al–Zn alloy joints formed by different laser welding processes
- Effect of refining slag compositions on its melting property and desulphurization
- Effect of P and Ti on the agglomeration behavior of Al2O3 inclusions in Fe–P–Ti alloys
- Cation-doping effects on the conductivities of the mayenite Ca12Al14O33
- Modification of Al2O3 inclusions in SWRH82B steel by La/Y rare-earth element treatment
- Possibility of metallic cobalt formation in the oxide scale during high-temperature oxidation of Co-27Cr-6Mo alloy in air
- Multi-source microwave heating temperature uniformity study based on adaptive dynamic programming
- Round-robin measurement of surface tension of high-temperature liquid platinum free of oxygen adsorption by oscillating droplet method using levitation techniques
- High-temperature production of AlN in Mg alloys with ammonia gas
- Review Article
- Advances in ultrasonic welding of lightweight alloys: A review
- Topical Issue on High-temperature Phase Change Materials for Energy Storage
- Compositional and thermophysical study of Al–Si- and Zn–Al–Mg-based eutectic alloys for latent heat storage
- Corrosion behavior of a Co−Cr−Mo−Si alloy in pure Al and Al−Si melt
- Al–Si–Fe alloy-based phase change material for high-temperature thermal energy storage
- Density and surface tension measurements of molten Al–Si based alloys
- Graphite crucible interaction with Fe–Si–B phase change material in pilot-scale experiments
- Topical Issue on Nuclear Energy Application Materials
- Dry synthesis of brannerite (UTi2O6) by mechanochemical treatment
- Special Issue on Polymer and Composite Materials (PCM) and Graphene and Novel Nanomaterials - Part I
- Heat management of LED-based Cu2O deposits on the optimal structure of heat sink
- Special Issue on Recent Developments in 3D Printed Carbon Materials - Part I
- Porous metal foam flow field and heat evaluation in PEMFC: A review
- Special Issue on Advancements in Solar Energy Technologies and Systems
- Research on electric energy measurement system based on intelligent sensor data in artificial intelligence environment
- Study of photovoltaic integrated prefabricated components for assembled buildings based on sensing technology supported by solar energy
- Topical Issue on Focus of Hot Deformation of Metaland High Entropy Alloys - Part I
- Performance optimization and investigation of metal-cored filler wires for high-strength steel during gas metal arc welding
- Three-dimensional transient heat transfer analysis of micro-plasma arc welding process using volumetric heat source models