Effect of bonding time on the microstructure and mechanical properties of graphite/Cu-bonded joints
-
Bin Chen
 and
Xiaoguo Song
and
Xiaoguo Song

Abstract
The increasing serious heat dissipation problem faced by electronic equipment used in airplanes makes studies on new heat dissipation components urgent. The diffusion bonding of graphite and Cu was successfully realized by a Ti/Ag/Nb interlayer at the bonding conditions applied (850°C, 4 MPa with bonding time varying from 30 to 90 min). The influence of bonding time on the microstructure and mechanical properties of the joints was studied. When the bonding time was 30 min, the typical microstructure of the joints was as follows: graphite/TiC reaction layer/residual Ti layer/Ti2Ag layer/TiAg/Ti[Ag,Nb]/Cu. As the bonding time increased, the thickness of the residual Ti layer decreased, whereas the thickness of the Ti[Ag,Cu] layer increased. When the bonding time was extended to 90 min, Ti–Cu intermetallic compounds were detected adjacent to the Cu. The shear strength showed an increasing trend with the extension of the bonding time. When the bonding time was 90 min, the maximum shear strength of the joints was 13.4 MPa.
Graphical abstract

1 Introduction
In recent years, with the continuous development of aviation technology, the data and commands that an airplane’s electronic equipment need to process have become more and more complex [1]. This promotes the rapid development of semiconductor and microelectronic technology, miniaturization, weight reduction, high integration, and high frequency which have gradually become the trend in the development of microprocessor chips [2]. However, while the operating frequency of electronic equipment continues to increase, power density and heat generation are getting higher and higher [3]. Due its high thermal conductivity, excellent thermal shock resistance, and fatigue resistance, graphite has been used in the radiator components of electronic equipment [4]. Generally, graphite needs to be bonded with metals (Cu, Al) to form a radiator.
As we all know, graphite has a high melting point (3,550°C) and cannot be solid-solved with Cu or form any stable carbides with Cu. Therefore, in this case, fusion welding and direct diffusion bonding methods have been abandoned. Recently, various bonding techniques have been used to bond graphite and metal, such as brazing [5,6], solid-state diffusion bonding [7], and transient liquid phase diffusion bonding [8]. Among these joining methods, solid-state joining has attracted extensive attention due to its advantages such as no solidification structure in the bonding area, no pores, narrow joint interface, and large-area plate bonding [9]. Due to the large difference in the thermal expansion coefficient between graphite and Cu, the high residual stress at the joint deteriorated the performance of the joint. It is necessary to use metal materials with good plasticity as the stress release area to improve reliability of the joint.
In this study, a novel Nb/Ag/Ti composite interlayer was designed to join Cu and graphite. In the composite interlayer, Ti is the strong carbide-forming element, which is the key to realize the bonding between Cu and graphite. Ag has excellent ductility and can be used to relieve the stress caused by the large difference in the coefficient of thermal expansion between Cu and graphite. According to the Cu–Ag binary phase diagram [10], the eutectic reaction of Cu and Ag occurs at 775°C. So a large amount of the liquid phase will be formed above 800°C. However, large amounts of Ti dissolves in the AgCu eutectic liquid phase and reacts with Cu to generate a large number of brittle Ti–Cu intermetallic compounds [11]. This is harmful to the mechanical properties of the joint. Nb has a body-centered cubic structure, while Cu and Ag are face-centered cubic structures. Due to the difference in the crystal structure, the solubility between Nb and Ag or Cu is limited [12]. Hence, Nb is introduced as a barrier layer into the composite interlayer to avoid the generation of AgCu eutectic liquid phase and Ti–Cu intermetallic compounds.
In this study, the Ti/Ag/Nb composite interlayer was used to bond graphite and Cu at 850°C for different bonding time. The microstructure, interface evolution mechanism, and shear strength were investigated to clarify the bonding between the microstructure and mechanical properties of the joint during different bonding times.
2 Materials and experimental procedures
The high-strength graphite used in the experiment was obtained from the Beijing Jinglong Special Carbon Technology Co., Ltd. The commercially available Cu was provided by the State Key Laboratory for Advanced Metals and Materials, Beijing, China (99.9 wt%). The graphite was cut into the samples with sizes of 3.5 mm × 3.5 mm × 3 mm for shear strength test and 10 mm × 10 mm × 3 mm for observation of the microstructure, and the dimensions of Cu were 15 mm × 10 mm × 2 mm. The surface to be bonded was ground by SiC papers with grit sizes of 800#, 1,200#, and 2,000# sequentially. Then it was polished using 1 μm diamond pastes and cleaned ultrasonically for 20 min in acetone.
The composite interlayer was composed of Ti (8 μm)/Ag (6 μm)/Nb (4.8 μm), in which Ti and Ag were prepared by commercial foil and Nb was obtained by magnetron sputtering. The Ti and Ag foils were sandwiched between the graphite and Cu coated with Nb layer, as shown in Figure 1(a), and then the assembly was placed in a graphite fixture. A pressure of 5 MPa was applied to the bonding assembly to make the interlayer come in close contact with the substrate. The bonding process was performed using a vacuum furnace, and the vacuum atmosphere of 3 × 10⁻³ to 5 × 10⁻³ Pa was maintained during the bonding process. At first, the furnace was heated to 800°C at a rate of 20°C·min−1 and kept for 20 min to homogenize the temperature in the furnace chamber. Then the temperature was increased to the bonding temperature at a rate of 5°C·min−1, and isothermally soaked for 30, 60, and 90 min. Finally, the bonding sample was cooled down to 400°C at the rate of 5°C·min−1 and then cooled in a furnace.

Schematic diagram: (a) assembling bonding parts and (b) shear test experiment.
In order to characterize the microstructure of the joint, a scanning electron microscope (MERLIN Compact, ZEISS) equipped with an energy dispersive spectrometer (EDS) was used to observe the cross-sections of the joints. X-ray diffraction (XRD, D8-ADVANCE) was used to identify the phases in the joints. The specimens of the XRD test were cut parallel to the joint surface and then ground to expose the joint interface to be tested. The shear strength of the joints was measured by the Instron-5967 universal material testing machine. The bonded samples were assembled according to Figure 1(b), and then the shear test was carried out by applying pressure on Cu through the pressure head of the Instron-5967 universal material testing machine. The samples were loaded by the testing machine at a constant speed of 0.5 mm·min−1. At least four samples were used to average each set of experimental data.
3 Results and discussion
3.1 Microstructure characterization of the bonded joints
Figure 2 shows the microstructure and elemental distribution of the graphite/Cu joint bonded with Ti/Ag/Nb composite interlayer at 850°C for 30 min. As shown in Figure 2(a) and (c–f), a joint without any cracks or pores was obtained. The joint could be divided into six zones. Zone I consisted of a continuous reaction layer close to the graphite. Zones II and IV were composed of dark gray phase and light gray phase respectively, while Zone III was the diffusion transition region between Zones II and IV. Zone V was made up of irregular dark gray phases, in which a small amount of white phase was dispersed. Zone VI was composed of the light gray phase, which was preliminarily inferred to be the Nb layer. The results of the EDS line scanning of the graphite/Cu joint are shown in Figure 2(b). It could be seen from the figure that the scanning results of Ti and C presented an X-shaped cross line, indicating that the Ti had diffused into the graphite as an active element and had reacted with the graphite at the interface. An obvious inter-diffusion process occurred between Ti and Ag. The atomic ratio of Ti and Ag in Zone IV was 1:1, and Ti was enriched between the TiAg and Nb layers. The Ti and Cu contents dropped sharply in Zone VI, indicating that the Nb element effectively weakened the diffusion of Ti and Cu. Figure 2(g)–(k) also confirmed this phenomenon.
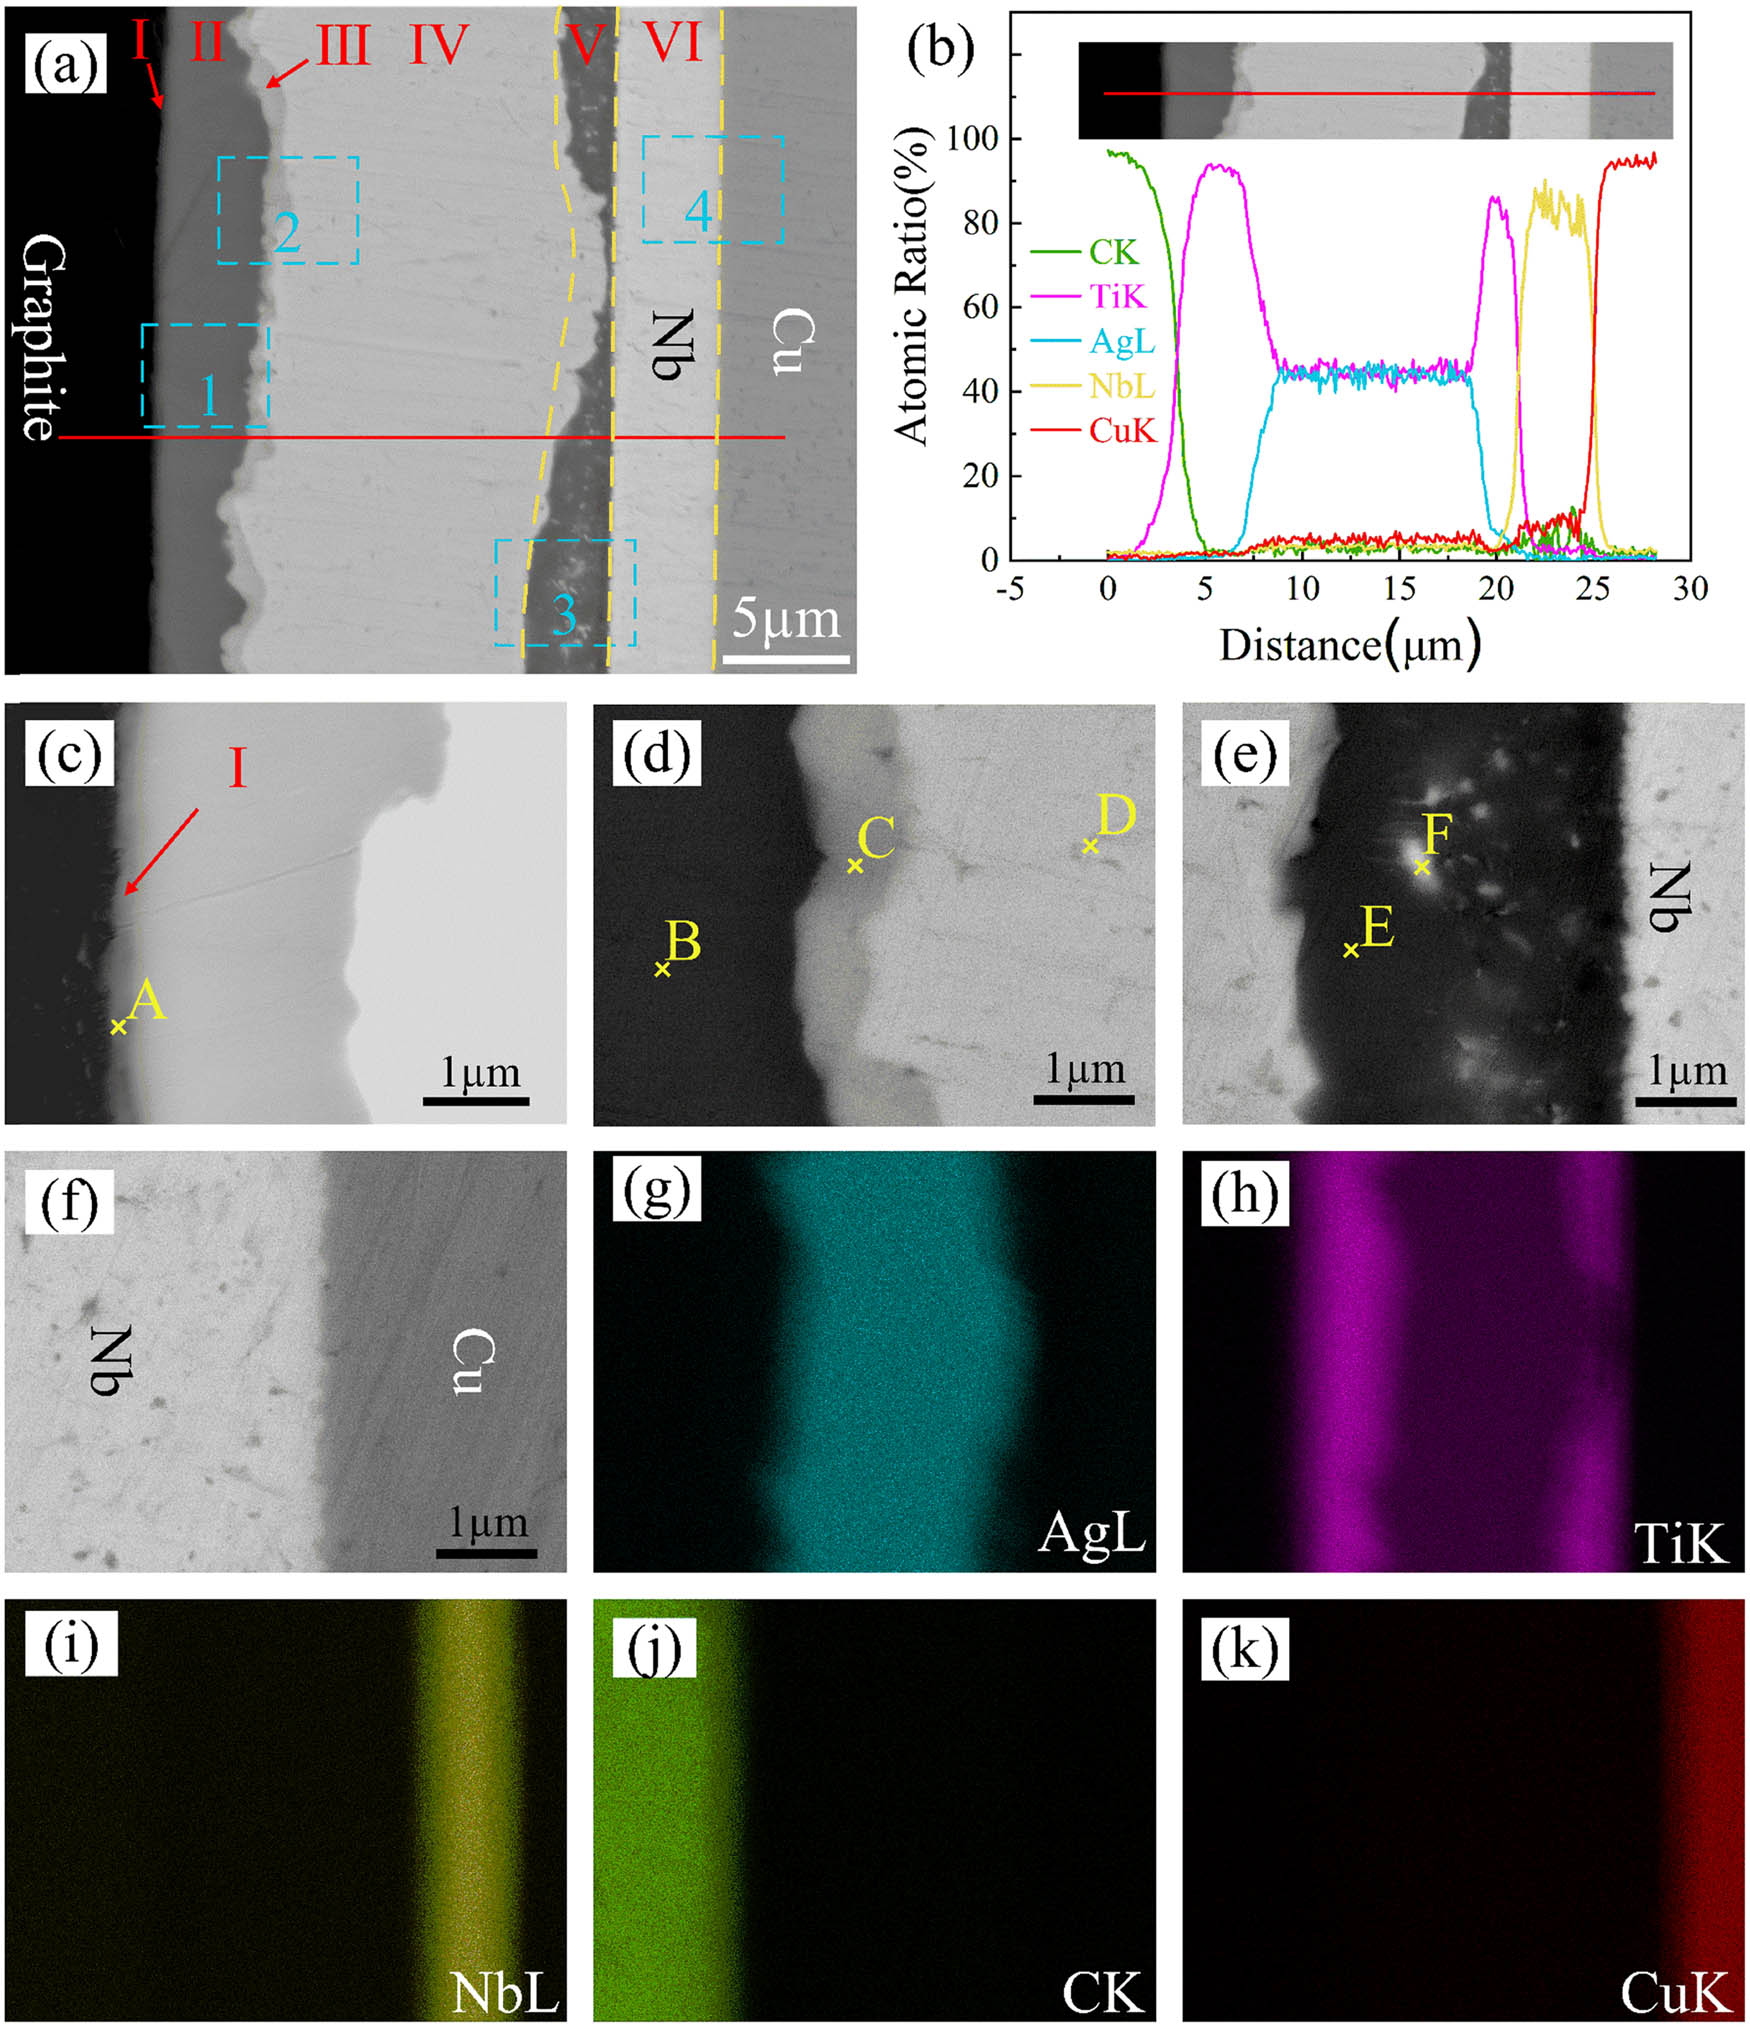
Microstructure (a), enlarged view of blue box 1–4 (c–f), and elemental analysis results (b, g–k) of the graphite/Cu joint bonded with Nb/Ag/Ti composite interlayer at 850°C for 30 min.
The EDS results of each point in Figure 2 are shown in Table 1. XRD was carried out to further analyze the phases in the joint. The graphite near the joint interface was cut off and then ground until two positions were exposed (as shown in Figure 3(a)). Figure 3(b) and (c) shows the corresponding XRD patterns of different positions. Phase A is mainly composed of C and Ti, which was speculated to be TiC. From the XRD results of the graphite/composite interlayer (Plane A), TiC can be discovered. The dark phase with 99.73 at% Ti was the residual Ti layer. The TiAg phase detected in the XRD results of Plane B in Figure 3(c) also confirmed this result. Around 73.35 at% Ti and 23.61 at% Ag were detected in phase C, and it may be Ti2Ag or Ti + TiAg. The EDS result of the off-white phase D showed that the ratio of the Ti content and Ag content in Zone IV was close to 1:1, which was inferred to be composed of the TiAg phase. The dispersive white phase E was composed of 16.94 at% Ag and 83.05 at% Nb, indicating that it was an Ag or Nb precipitated phase. The charcoal gray phase F was mainly composed of Ti, with a small amount of Ag and Nb, indicating that phase F is the Ti[Ag,Nb] solid solution. Therefore, it can be concluded that the typical microstructure of the joint is graphite/TiC/residual Ti layer/Ti + TiAg/TiAg/Ti[Ag,Nb]/Nb/Cu.
Results of EDS at different positions shown in Figure 2 (at%)
| Point | C | Ti | Ag | Nb | Cu | Possible phase |
|---|---|---|---|---|---|---|
| A | 22.56 | 77.44 | — | — | — | TiC |
| B | — | 99.73 | 0.27 | — | — | Ti |
| C | — | 73.35 | 23.61 | 2.65 | 0.39 | Ti + TiAg/Ti2Ag |
| D | — | 53.43 | 42.58 | 3.19 | 0.80 | TiAg/Ti(Ag) |
| E | — | 87.92 | 4.51 | 6.90 | 0.67 | Ti[Ag,Nb] |
| F | — | — | 16.94 | 83.06 | — | Nb or Ag |

Schematic of the positions of graphite/Cu joints (a) and the corresponding XRD analysis: (b) Plane A and (c) Plane B.
3.2 Effect of bonding time on the microstructure of graphite/Cu joints
Figure 4 displays backscattered electron images of the graphite/Cu joints bonded by Ti/Ag/Nb composite interlayer at 850°C for 60 and 90 min, respectively.
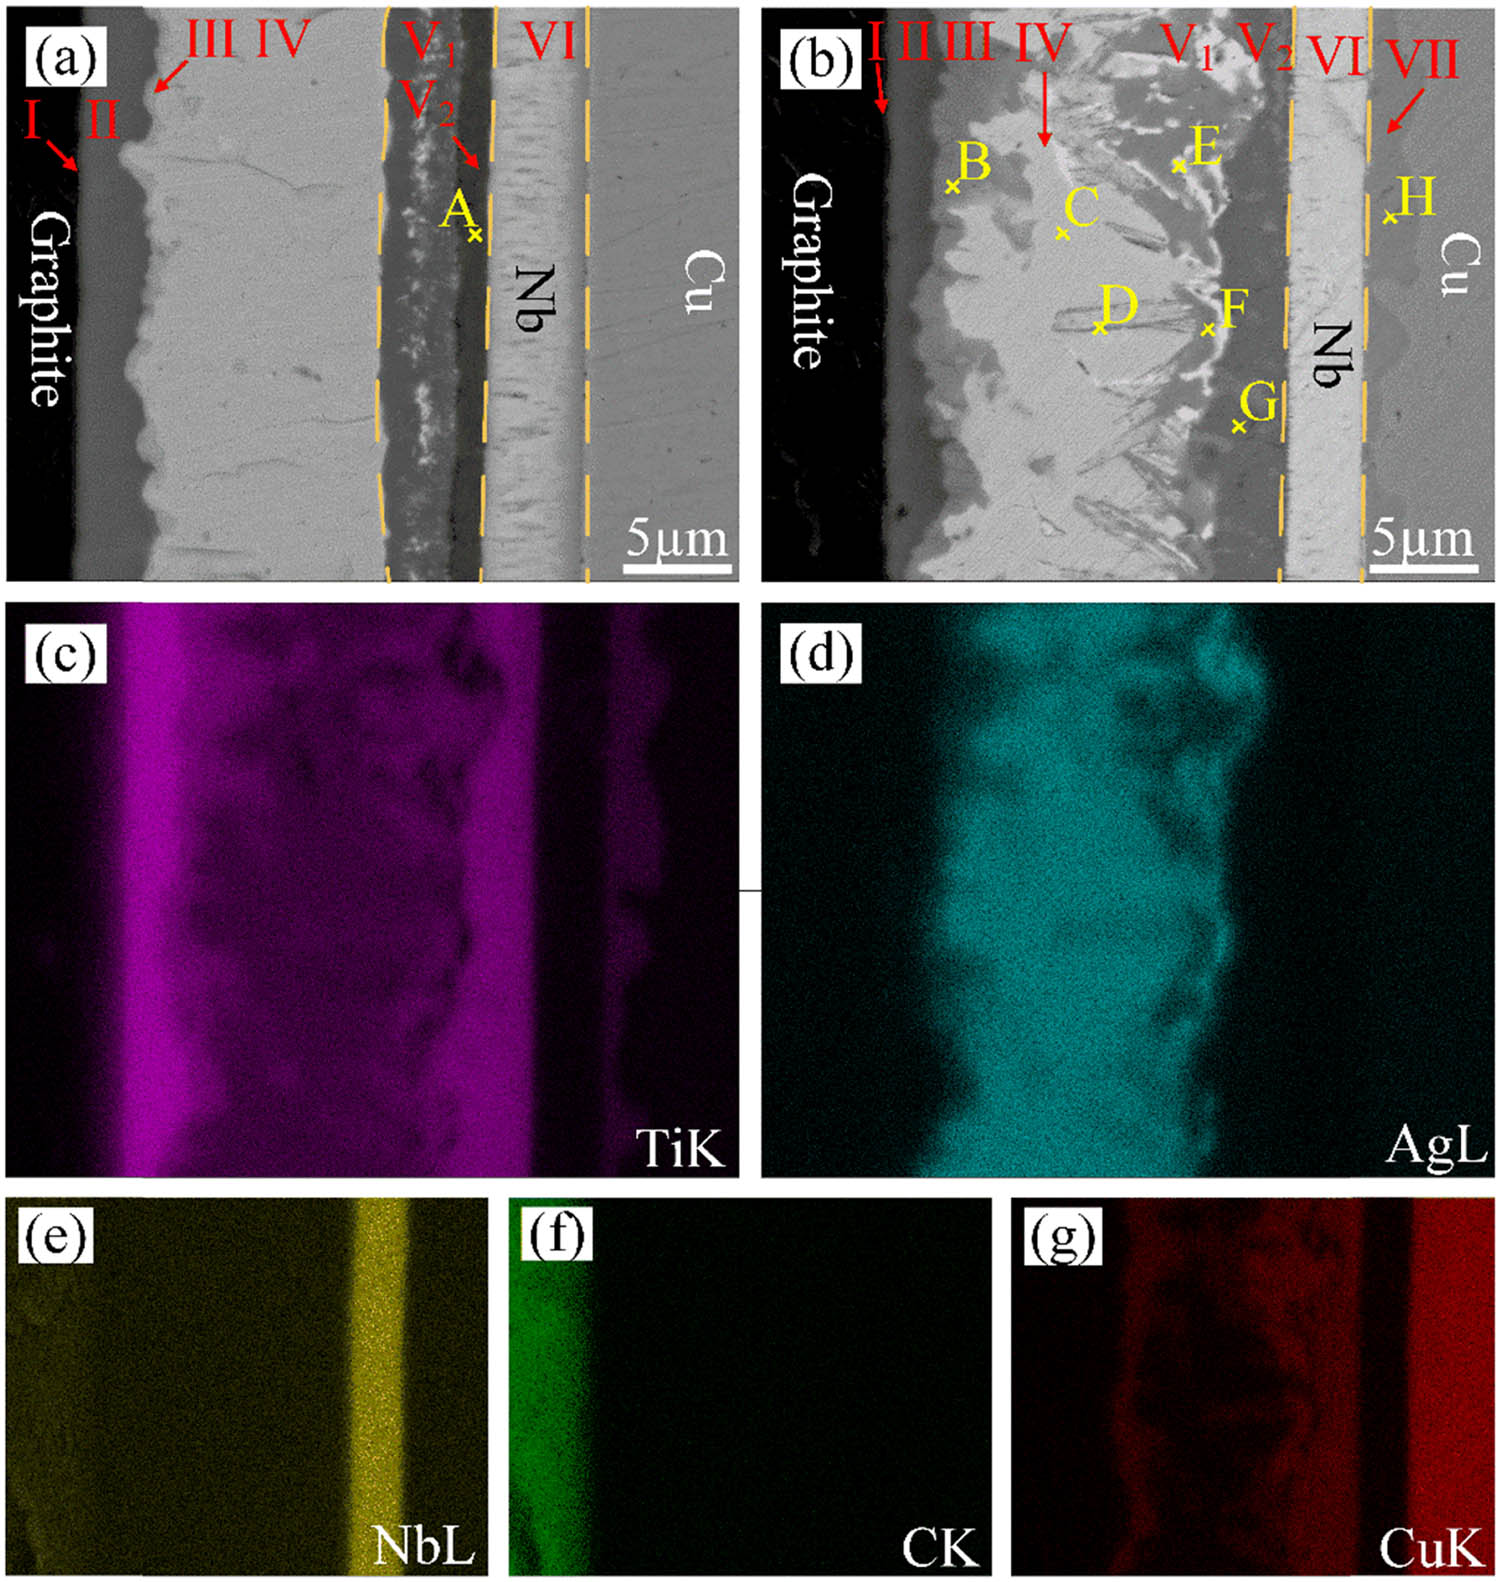
Microstructure of the graphite/Cu joint bonded with Ti/Ag/Nb composite interlayer at 850°C: (a) 60 min, (b) 90 min, and elemental analysis results (b–g) of the joint for 90 min.
It can be observed that the thickness of the residual Ti layer (Zone II) got reduced while the thickness of the enriched Ti layer (Zone V) increased with the increase in bonding time. Moreover, for the bonding time of 60 min, it was found that the widely distributed white phase in the Ti-enrichment layer had increased (Figure 4(a)). A new dark phase layer (Zone V2) was observed at the position between Zone V1 and Zone VI, and the compositions of phase A showed that it consisted of 55.64 at% Ti, 0.13 at% Ag, 42.28 at% Nb, and 1.95 at% Cu. From this, it was estimated that phase A is a Ti[Nb] solid solution.
When the bonding time was increased to 90 min, Zone III was obviously widened and its composition had changed. In Zone V, the white phase appeared agglomerated, and a large number of lamellar white phases were observed at the interface. Between Zones V and IV, continuous dendrites appeared and grew from Zone V1 to Zone IV gradually. A significant diffusion layer appeared between the Nb layer and Cu. The element distribution was shown in Figure 4(c)–(g). From Figure 4(g), it can be clearly observed that Cu was mainly distributed in Zones III and V. Figure 4(c) shows that the Ti diffused through the Nb layer to Cu, thus forming Zone VII.
An EDS analysis was performed on each phase in the joint, and the results are shown in Table 2. The dark gray phase B in Figure 4(b) was consistent with phase B in Figure 2(d), both of which were residual Ti interlayers. The light gray phase C in the joint was composed of 63.03 at% Ti, 11.35 at% Ag, 18.69 at% Nb, and 6.93 at% Cu, which was speculated to be Ti[Ag,Nb] + Ti–Cu. The light gray phase D in the dendrite structure was mainly composed of Ti, Ag, and Cu. It was speculated that the dendrite structure was composed of the Ti–Cu compound. Combined with the element distribution and EDS analysis, it can be inferred that white phase E was an Ag precipitated phase. The light gray phase F and dark gray phase G in Zone V (V1 + V2) were mainly composed of Ti and Cu, and the atomic ratios of Ti and Cu were 1:1 and 2:1, respectively. According to the Ti–Cu phase diagram [13], it can be inferred that the TiCu phase and the Ti2Cu phase were formed. The light gray phase H in Zone VII was composed of Ti and Cu. The atomic ratio of Ti to Cu was close to 1:4, and it was speculated that the phase was TiCu4.
Results of EDS at different positions shown in Figure 4 (at%)
| Point | Ti | Ag | Nb | Cu | Possible phase |
|---|---|---|---|---|---|
| A | 55.64 | 0.13 | 42.28 | 1.95 | Ti(Nb) |
| B | 63.03 | 11.35 | 18.69 | 6.93 | Ti[Ag,Nb] + Ti–Cu |
| C | 49.04 | 38.57 | 10.13 | 2.26 | TiAg |
| D | 46.28 | 28.39 | 7.53 | 17.80 | TiAg + Ti–Cu |
| E | — | 58.75 | 15.86 | 25.39 | Ag solid solution (Ag(s, s)) |
| F | 44.22 | 9.51 | 6.04 | 40.23 | Ti–Cu |
| G | 61.03 | 0.32 | 7.33 | 31.32 | Ti2Cu |
| H | 15.70 | 0.02 | 9.15 | 75.13 | TiCu4 |
3.3 Effect of bonding time on the mechanical properties of graphite/Cu joints
Figure 5 shows the shear strength of the graphite/Cu joints at different bonding times. It can be clearly seen that as the bonding time increased, the strength of the joint showed an upward trend. When the bonding times were 30 and 60 min, the shear strength of the joints were 10.7 and 11.9 MPa, respectively. When the bonding time was increased to 90 min, the joint strength reached the maximum value of 13.4 MPa.

Effect of bonding time on the shear strength of graphite/Cu joints.
By observing the fracture surface of the different bonding times, as shown in Figure 6, three types of failure modes were observed after the shear strength test. The first type is shown in Figure 6(a) and (a1) (t = 30 min), which was cracking along the area between the Ti-rich layer (Zone V) and the Nb layer, indicating that this area was relatively weak. It can be observed from Figure 6(b) and (b1) that the phenomenon of interlayer peeling was found at the fracture position of the composite interlayer, indicating that the interface strength between the interface layers was weak. When the bonding time increased to 60 min, the fracture began near the TiC reaction layer between the graphite and the residual Ti layer, and then extended to the Cu side, forming a bowed fracture mode. When the bonding time reached 90 min (Figure 6(c) and (c1)), the fracture process occurred inside the graphite base material. This fracture type indicated strong interfacial strength between each interface layer.

The fractography of the graphite/Cu joints at 850°C: (a) 30 min, (b) 60 min, (c) 90 min; (a1–c1): enlarged view of the blue box in (a–c).
3.4 Microstructure formation and evolution mechanism of graphite/Cu joints
During the bonding process, C in the graphite diffused outward and reacted with the carbide forming Ti as follows [14,15,16,17]:
The TiC layer was formed at the interface. The formed TiC layer would be densely and metallurgical-wise bonded to the base materials on both sides, which was the key to realize the bonding between the carbon material and the metal material. In the Ti–Ag diffusion couple, Ti and Ag underwent inter-diffusion processes at different speeds. According to the diffusion theory, in reactive diffusion, the first phase was not formed immediately between the Ti–Ag diffusion couples but went through an inoculation period [18,19]. During the inoculation period, a certain degree of mutual diffusion and dissolution would occur between the diffusion couples in the area where the interface was extremely thin. Ag[Ti] saturated solid solution had formed around the defects of the Ag crystal structure. In the lattice defects with high Ti content, excessive Ti promoted the transformation of the Ag lattice-type to form a new phase crystal nuclei [20,21]. The crystal nuclei of the intermetallic compound grew laterally along with the joint interface, and the grown intermetallic compound formed a whole and turned to normal longitudinal growth. In this study, based on the interface (Figure 2(a)), it can be inferred that Zone II was the first intermetallic compound phase zone, and its phase was Ti2Ag. When the Ti2Ag layer grew to a certain thickness, the second phase TiAg would nucleate and grow.
After all the Ag was transformed, Ti continued to diffuse to the Nb side driven by the concentration gradient, passing through the TiAg and getting collected on the Nb side. This may be related to the supersaturated precipitation of Ti in the Ag phase and the hindering effect of Nb on Ti diffusion. According to the Ti–Nb phase diagram [22], the Ti–Nb system displays considerable mutual solubility and no formation of intermetallic compounds. So Ti[Nb] gets formed in the Ti-rich layer near the Nb side. As the bonding time increased (t = 60 min), the Ti[Nb] layer continued to thicken to form Zone V2 in Figure 4(a). Although the formation of harmful intermetallic compounds (Ti–Cu compounds) was avoided, the Nb–Cu system is actually immiscible and its solubility is negligible, resulting in weak binding between the Nb–Cu interface. The Ag/Nb double interlayers reasonably regulated the diffusion path of Ti. For the joints with bonding time of 30 min, the mutual diffusion degree of Ti and Nb was insufficient, and no continuous Ti [NB] layer was formed. In the shear test, the interface between the rich-Ti layer and Nb layer was a weak interface, resulting in the fracture process at this interface. When the bonding time was extended to 60 min, the obvious Ti[Nb] layer was formed, which strengthened the bonding between the Ti-rich layer and the Nb layer. The strength of each interface layer in the joint was equivalent, which caused the joint to fracture from the graphite matrix to the Cu matrix.
In addition, when the bonding time reached 90 min, the effect of Nb on Ti and Cu diffusion was reduced, and long-distance diffusion of Cu occurred. Due to the negative mixing enthalpy between Cu and Ti, the two had a tendency to form intermetallic compounds [23,24]. Therefore, when Cu diffused into the Ti-rich layer and exceeded its saturated solid solubility in Ti, the lattice transformation of Ti would be induced. It caused part of the Ti in the Ti-rich layer to transform into Ti–Cu intermetallic compounds.
At the same time, Cu could even pass through the TiAg layer, transforming part of the Ti in Zone III into Ti–Cu intermetallic compounds. In the meantime, Ti passed through the Nb layer and reacted with part of the Cu to form a scallop-like Ti–Cu intermetallic compounds layer. Therefore, three continuous Ti–Cu intermetallic compound layers were observed in joints. The formation of Ti–Cu compounds can be expressed by the following equation [25]:
According to the equations, four kinds of compounds (Ti2Cu, Ti3Cu4, TiCu, TiCu4) are present, and the free energies of formation of these Ti–Cu compounds at 850°C are all negative, which indicates that all the four compounds are thermodynamically favorable. The generated Ti–Cu intermetallic compound had a pinning effect at the interface and enhanced the interface bonding between various interfaces. The shear strength of the joint was improved, causing the fracture to occur inside the graphite.
4 Conclusion
Graphite and Cu were successfully bonded by using the Ti/Ag/Nb interlayer at 850°C for different holding times. The following conclusions can be drawn:
A continuous TiC reaction layer was formed at the graphite/interlayer interface. During the bonding time of 30 min, the typical microstructure of the joints was as follows: graphite/TiC reaction layer/residual Ti layer/Ti–Ag diffusion layer/TiAg/Ti[Ag,Nb]/Cu.
As the bonding time increased, the thickness of the remaining Ti layer decreased, while the thickness of Ti[Nb] increased. However, when the holding time was increased to 90 min, Ti–Cu intermetallic compounds were detected in multiple interface layers of the graphite/Cu joint.
The shear strength increased nolinearly with the extension of the bonding time. The maximum shear strength of the joint reached 13.4 MPa during the bonding time of 90 min, and the fracture position is inside the graphite matrix.
Acknowledgments
This project is supported by National Natural Science Foundation of China (grant Nos. 51875130 and 51775138), the Taishan Scholars Foundation of Shandong Province (No. tsqn201812128) and Shandong Provincial Natural Science Foundation of China (No. ZR2019MEE091).
-
Funding information: This project is supported by the National Natural Science Foundation of China (Grant Nos. 51875130 and 51775138), the Taishan Scholars Foundation of Shandong Province (Grant No. tsqn201812128) and the Shandong Provincial Natural Science Foundation of China (Grant No. ZR2019MEE091).
-
Author contributions: Bin Chen: Conceptualization, data curation, investigation, methodology, writing – original draft; Haitao Zhu: methodology, writing – review & editing; Kehan Zhao: supervision, writing – review & editing; Yanyu Song: data curation, investigation; Duo Liu: conceptualization, supervision, funding acquisition, writing – review & editing; Xiaoguo Song: conceptualization, supervision, funding acquisition.
-
Conflict of interest: Authors state no conflict of interest.
-
Data availability statement: The raw/processed data required to reproduce these findings cannot be shared at this time as the data also forms part of an ongoing study.
References
[1] Zhuang, Y.-T., F. Wu, C. Chen, and Y.-h. Pan. Challenges and opportunities: From big data to knowledge in AI 2.0. Frontiers of Information Technology & Electronic Engineering, Vol. 18, No. 1, 2017, pp. 3–14.10.1631/FITEE.1601883Search in Google Scholar
[2] Phillips, M. R., C. E. Green, and B. A. Cola. Numerical and experimental investigation of vertically aligned carbon nanotube-phase change material composites for thermal management of electronics. In Proceedings of the 17th IEEE Intersociety Conference on Thermal and Thermomechanical Phenomena in Electronic Systems, 2018. pp. 141–146.10.1109/ITHERM.2018.8419561Search in Google Scholar
[3] Waldrop, M. M. The chips are down for Moore’s law. Nature, Vol. 530, No. 7589, 2016, pp. 144–147.10.1038/530144aSearch in Google Scholar PubMed
[4] Wang, J. X., S. L. Yan, and D. S. Yu. Material based structure design: numerical analysis thermodynamic response of thermal pyrolytic graphite/AL sandwich composites. Applied Composite Materials, Vol. 23, No. 6, 2016, pp. 1167–1176.10.1007/s10443-016-9506-3Search in Google Scholar
[5] Fedotov, I. V., C. E. Richman, O. N. Sevryukov, A. N. Suchkov, J. Li, B. A. Kalin, et al. Brazing molybdenum and graphite with a titanium-based powder filler metal. Welding Journal, Vol. 95, No. 9, 2016, pp. 357S–361S.Search in Google Scholar
[6] Li, C., X. Si, J. Cao, J. Qi, Z. Dong, and J. Feng. Residual stress distribution as a function of depth in graphite/copper brazing joints via X-ray diffraction. Journal of Materials Science & Technology, Vol. 35, No. 11, 2019, pp. 2470–2476.10.1016/j.jmst.2019.07.023Search in Google Scholar
[7] Wu, A., G. Zou, X. Ma, and J. Ren. Diffusion bonding of Mo and graphite. Rare Metal Materials and Engineering, Vol. 35, No. 9, 2006, pp. 1492–1496.Search in Google Scholar
[8] Lin, J. C., M. Huang, W. Q. Yang, and L. L. Xing. Degradation kinetics of Ti–Cu compound layer in transient liquid phase bonded graphite/copper joints. Scientific Reports, Vol. 8, 2018, id. 11.10.1038/s41598-018-33446-3Search in Google Scholar PubMed PubMed Central
[9] Tsakiris, V., M. Lucaci, L. Leonat, and G. Alecu. Influence factors on bonding materials by solid state diffusion. Revista Romana De Materiale-Romanian Journal of Materials, Vol. 38, No. 2, 2008, pp. 152–156.Search in Google Scholar
[10] Tim Van, R., R. Peter, and M. Materials Science International Team. The Ag–Cu system at 0.1 MPa (bold solid lines [1994Sub]), at 5 GPa (dotted.: Datasheet from MSI Eureka in SpringerMaterials. MSI, Materials Science International Services GmbH, Stuttgart.Search in Google Scholar
[11] Song, X., Y. Zhao, S. Hu, J. Cao, W. Fu, and J. Feng. Wetting of AgCu–Ti filler on porous Si3N4 ceramic and brazing of the ceramic to TiAl alloy. Ceramics International, Vol. 44, No. 5, 2018, pp. 4622–4629.10.1016/j.ceramint.2017.11.212Search in Google Scholar
[12] Van Rompaey, T. and M. Materials Science International Team. Cu–Nb binary phase diagram evaluation phase diagrams, crystallographic and thermodynamic data: Datasheet from MSI Eureka in SpringerMaterials. Materials Science International Services GmbH, Stuttgart. https://materials.springer.com/msi/docs/sm_msi_r_20_012479_01.Search in Google Scholar
[13] Predel, B. Cu–Ti (copper–titanium): Datasheet from Landolt-Börnstein – Group IV physical chemistry, Volume 12B: “B–Ba … Cu–Zr” in SpringerMaterials. Springer-Verlag, Berlin Heidelberg. https://doi.org/10.1007/978-3-540-44756-6_19410.1007/978-3-540-44756-6_194Search in Google Scholar
[14] Fu, W., S. P. Hu, X. G. Song, J. X. Li, J. Cao, J. C. Feng, et al. Wettability and bonding of graphite by Sn0.3Ag0.7Cu–Ti alloys. Carbon, Vol. 121, 2017, pp. 536–543.10.1016/j.carbon.2017.06.030Search in Google Scholar
[15] Pouraliakbar, H., G. Khalaj, L. Gomidželović, M.-J. Khalaj, and M. Nazerfakhari. Duplex ceramic coating produced by low temperature thermo-reactive deposition and diffusion on the cold work tool steel substrate: Thermodynamics, kinetics and modeling. Ceramics International, Vol. 41, No. 8, 2015, pp. 9350–9360.10.1016/j.ceramint.2015.03.306Search in Google Scholar
[16] Khalaj, G. and H. Pouraliakbar. Computer-aided modeling for predicting layer thickness of a duplex treated ceramic coating on tool steels. Ceramics International, Vol. 40, No. 4, 2014, pp. 5515–5522.10.1016/j.ceramint.2013.10.141Search in Google Scholar
[17] Khalaj, G. Artificial neural network to predict the effects of coating parameters on layer thickness of chromium carbonitride coating on pre-nitrided steels. Neural Computing and Applications, Vol. 23, No. 3, 2013, pp. 779–786.10.1007/s00521-012-0994-2Search in Google Scholar
[18] Kim, H. Y., D. S. Chung, and S. H. Hong. Reaction synthesis and microstructures of NiAl/Ni micro-laminated composites. Materials Science and Engineering: A, Vol. 396, No. 1, 2005, pp. 376–384.10.1016/j.msea.2005.01.044Search in Google Scholar
[19] He, P. and D. Liu. Mechanism of forming interfacial intermetallic compounds at interface for solid state diffusion bonding of dissimilar materials. Materials Science and Engineering: A, Vol. 437, No. 2, 2006, pp. 430–435.10.1016/j.msea.2006.08.019Search in Google Scholar
[20] Yamada, T., K. Miura, M. Kajihara, N. Kurokawa, and K. Sakamoto. Kinetics of reactive diffusion between Au and Sn during annealing at solid-state temperatures. Materials Science and Engineering: A, Vol. 390, No. 1, 2005, pp. 118–126.10.1016/j.msea.2004.08.053Search in Google Scholar
[21] Takenaka, T., M. Kajihara, N. Kurokawa, and K. Sakamoto. Reactive diffusion between Pd and Sn at solid-state temperatures. Materials Science and Engineering: A, Vol. 406, No. 1, 2005, pp. 134–141.10.1016/j.msea.2005.06.054Search in Google Scholar
[22] Materials Science International Team, M. Nb–Ti phase system bibliography report · collection of relevant references: Datasheet from MSI Eureka in SpringerMaterials. MSI Materials Science International Services GmbH, Stuttgart. https://materials.springer.com/msi/literature/docs/sm_msi_l_60_012723_171.Search in Google Scholar
[23] Guo, S., Q. Zhou, Y. Peng, X. Xu, C. Diao, J. Kong, et al. Study on strengthening mechanism of Ti/Cu electron beam welding. Materials & Design, Vol. 121, 2017, pp. 51–60.10.1016/j.matdes.2017.02.054Search in Google Scholar
[24] Chen, G.-Q., B.-G. Zhang, W. Liu, and J.-C. Feng. Influence of electron-beam superposition welding on intermetallic layer of Cu/Ti joint. Transactions of Nonferrous Metals Society of China, Vol. 22, No. 10, 2012, pp. 2416–2420.10.1016/S1003-6326(11)61479-9Search in Google Scholar
[25] Liang, Y. H., H. Y. Wang, Y. F. Yang, Y. Y. Wang, and Q. C. Jiang. Evolution process of the synthesis of TiC in the Cu–Ti–C system. Journal of Alloys and Compounds, Vol. 452, No. 2, 2008, pp. 298–303.10.1016/j.jallcom.2006.11.024Search in Google Scholar
© 2021 Bin Chen et al., published by De Gruyter
This work is licensed under the Creative Commons Attribution 4.0 International License.
Articles in the same Issue
- Review Articles
- A review on filler materials for brazing of carbon-carbon composites
- Nanotechnology-based materials as emerging trends for dental applications
- A review on allotropes of carbon and natural filler-reinforced thermomechanical properties of upgraded epoxy hybrid composite
- High-temperature tribological properties of diamond-like carbon films: A review
- A review of current physical techniques for dispersion of cellulose nanomaterials in polymer matrices
- Review on structural damage rehabilitation and performance assessment of asphalt pavements
- Recent development in graphene-reinforced aluminium matrix composite: A review
- Mechanical behaviour of precast prestressed reinforced concrete beam–column joints in elevated station platforms subjected to vertical cyclic loading
- Effect of polythiophene thickness on hybrid sensor sensitivity
- Investigation on the relationship between CT numbers and marble failure under different confining pressures
- Finite element analysis on the bond behavior of steel bar in salt–frost-damaged recycled coarse aggregate concrete
- From passive to active sorting in microfluidics: A review
- Research Articles
- Revealing grain coarsening and detwinning in bimodal Cu under tension
- Mesoporous silica nanoparticles functionalized with folic acid for targeted release Cis-Pt to glioblastoma cells
- Magnetic behavior of Fe-doped of multicomponent bismuth niobate pyrochlore
- Study of surfaces, produced with the use of granite and titanium, for applications with solar thermal collectors
- Magnetic moment centers in titanium dioxide photocatalysts loaded on reduced graphene oxide flakes
- Mechanical model and contact properties of double row slewing ball bearing for wind turbine
- Sandwich panel with in-plane honeycombs in different Poisson's ratio under low to medium impact loads
- Effects of load types and critical molar ratios on strength properties and geopolymerization mechanism
- Nanoparticles in enhancing microwave imaging and microwave Hyperthermia effect for liver cancer treatment
- FEM micromechanical modeling of nanocomposites with carbon nanotubes
- Effect of fiber breakage position on the mechanical performance of unidirectional carbon fiber/epoxy composites
- Removal of cadmium and lead from aqueous solutions using iron phosphate-modified pollen microspheres as adsorbents
- Load identification and fatigue evaluation via wind-induced attitude decoupling of railway catenary
- Residual compression property and response of honeycomb sandwich structures subjected to single and repeated quasi-static indentation
- Experimental and modeling investigations of the behaviors of syntactic foam sandwich panels with lattice webs under crushing loads
- Effect of storage time and temperature on dissolved state of cellulose in TBAH-based solvents and mechanical property of regenerated films
- Thermal analysis of postcured aramid fiber/epoxy composites
- The energy absorption behavior of novel composite sandwich structures reinforced with trapezoidal latticed webs
- Experimental study on square hollow stainless steel tube trusses with three joint types and different brace widths under vertical loads
- Thermally stimulated artificial muscles: Bio-inspired approach to reduce thermal deformation of ball screws based on inner-embedded CFRP
- Abnormal structure and properties of copper–silver bar billet by cold casting
- Dynamic characteristics of tailings dam with geotextile tubes under seismic load
- Study on impact resistance of composite rocket launcher
- Effects of TVSR process on the dimensional stability and residual stress of 7075 aluminum alloy parts
- Dynamics of a rotating hollow FGM beam in the temperature field
- Development and characterization of bioglass incorporated plasma electrolytic oxidation layer on titanium substrate for biomedical application
- Effect of laser-assisted ultrasonic vibration dressing parameters of a cubic boron nitride grinding wheel on grinding force, surface quality, and particle morphology
- Vibration characteristics analysis of composite floating rafts for marine structure based on modal superposition theory
- Trajectory planning of the nursing robot based on the center of gravity for aluminum alloy structure
- Effect of scan speed on grain and microstructural morphology for laser additive manufacturing of 304 stainless steel
- Influence of coupling effects on analytical solutions of functionally graded (FG) spherical shells of revolution
- Improving the precision of micro-EDM for blind holes in titanium alloy by fixed reference axial compensation
- Electrolytic production and characterization of nickel–rhenium alloy coatings
- DC magnetization of titania supported on reduced graphene oxide flakes
- Analytical bond behavior of cold drawn SMA crimped fibers considering embedded length and fiber wave depth
- Structural and hydrogen storage characterization of nanocrystalline magnesium synthesized by ECAP and catalyzed by different nanotube additives
- Mechanical property of octahedron Ti6Al4V fabricated by selective laser melting
- Physical analysis of TiO2 and bentonite nanocomposite as adsorbent materials
- The optimization of friction disc gear-shaping process aiming at residual stress and machining deformation
- Optimization of EI961 steel spheroidization process for subsequent use in additive manufacturing: Effect of plasma treatment on the properties of EI961 powder
- Effect of ultrasonic field on the microstructure and mechanical properties of sand-casting AlSi7Mg0.3 alloy
- Influence of different material parameters on nonlinear vibration of the cylindrical skeleton supported prestressed fabric composite membrane
- Investigations of polyamide nano-composites containing bentonite and organo-modified clays: Mechanical, thermal, structural and processing performances
- Conductive thermoplastic vulcanizates based on carbon black-filled bromo-isobutylene-isoprene rubber (BIIR)/polypropylene (PP)
- Effect of bonding time on the microstructure and mechanical properties of graphite/Cu-bonded joints
- Study on underwater vibro-acoustic characteristics of carbon/glass hybrid composite laminates
- A numerical study on the low-velocity impact behavior of the Twaron® fabric subjected to oblique impact
- Erratum
- Erratum to “Effect of PVA fiber on mechanical properties of fly ash-based geopolymer concrete”
- Topical Issue on Advances in Infrastructure or Construction Materials – Recycled Materials, Wood, and Concrete
- Structural performance of textile reinforced concrete sandwich panels under axial and transverse load
- An overview of bond behavior of recycled coarse aggregate concrete with steel bar
- Development of an innovative composite sandwich matting with GFRP facesheets and wood core
- Relationship between percolation mechanism and pore characteristics of recycled permeable bricks based on X-ray computed tomography
- Feasibility study of cement-stabilized materials using 100% mixed recycled aggregates from perspectives of mechanical properties and microstructure
- Effect of PVA fiber on mechanical properties of fly ash-based geopolymer concrete
- Research on nano-concrete-filled steel tubular columns with end plates after lateral impact
- Dynamic analysis of multilayer-reinforced concrete frame structures based on NewMark-β method
- Experimental study on mechanical properties and microstructures of steel fiber-reinforced fly ash-metakaolin geopolymer-recycled concrete
- Fractal characteristic of recycled aggregate and its influence on physical property of recycled aggregate concrete
- Properties of wood-based composites manufactured from densified beech wood in viscoelastic and plastic region of the force-deflection diagram (FDD)
- Durability of geopolymers and geopolymer concretes: A review
- Research progress on mechanical properties of geopolymer recycled aggregate concrete