Effect of scan speed on grain and microstructural morphology for laser additive manufacturing of 304 stainless steel
-
Rongxia Chai
 ,
Yapu Zhang
,
Yapu Zhang

Abstract
The laser scanning parameters used in laser additive manufacturing (LAM) can impact the growth direction of the columnar grains produced during rapid solidification. This growth direction affects the mechanical properties of the manufactured parts after cladding. The effective use of a high laser power and a rapid scanning speed for LAM requires an accurate analysis of the relationships between the laser scanning process parameters and the grain growth direction and microstructural morphology of the scanned material. An experimental study was conducted to determine the macromorphology, microstructural morphology, and grain growth direction of 304 stainless steel material obtained during the laser scanning process at different scan speeds. The impact of the scan speed on different regions in the cladding layer (the clad zone (CZ), the heat affected zone (HAZ), and the dilution zone (DZ)) was determined, as well as on the direction of grain growth, the grain morphology and the grain size (which are the microstructures of the cladded materials), the degree of elemental mixing during laser scanning (which are changes in material composition of cladded material), and the microscopic hardness of the CZ (which is one of the mechanical properties of cladded material). With increasing scan speed, the CZ, HAZ, DZ, and dilution rate (DR) of the material gradually decreased, and grain growth gradually oriented towards the building direction of the cladding layer. At a 16 mm·s−1 scan speed, the angle between the grain growth direction and the scan direction was 84°. Changing the scan speed from 4 to 16 mm·s−1 caused the columnar grain size to gradually decrease from 13.3 to 9.2 μm and the corresponding microhardness to gradually increase.
1 Introduction
Additive manufacturing (AM) is a rapidly evolving technology causing significant changes in rapid prototyping, freeform, and net-shape manufacturing. Comparing with traditional manufacturing technology such as casting and forging, AM is both technologically advantageous and economically competitive. AM is characterized by high temperatures gradients, high cooling rates and cycling reheating, causing large microstructures differences from traditional manufacturing routes [1,2]. The microstructures and mechanical properties of AM components are largely influenced by processing parameters, including laser power, scanning speed, powder feed rate, etc. Comparing to conventional welding, most of AM techniques have high solidification rate (R) and moderate temperature gradients, except for the first processed layers, which means that the cellular dendritic, columnar dendritic, and equiaxed dendritic are the most commonly observed structures. Furthermore, a high solidification rate means that the grain structure is generally very fine, making AM fabricated samples generally stronger but less ductile than their cast counterparts, provided that process defects, such as porosity and cracking, can be avoided [3]. The selection for the hatch distance should be performed to ensure that one deposited track is fully joined to the previous one in order to avoid detrimental production defects, such as lack of fusion and/or pores. In powder-bed systems, the heat conduction is not as effective as one in wire feed systems, owing to potential irregularities in the powder distribution that may prevent optimum heat flow during the interaction between the heat source and the material [4]. An interesting feature of fusion-based AM is its potential to obtain very small grain size due to the high cooling rates observed. The thermal cycle experienced by the as-built part may favour grain growth if there is sufficient residence time at critical temperatures for grain coarsening. Therefore, the building sequence can be optimized to minimize such potential undesirable effects [4]. Each location in the component being built is subjected to a complex thermal history as the material first undergoes a rapid solidification, and then is heated and cooled with each additional layer. These complex thermal cycles can create heterogeneous and anisotropic microstructures that are different from traditional wrought counterparts [5,6]. 18 Ni maraging steel powder was processed by selective laser melting and different heat treatments were applied to the built parts, aiming for homogenization, microstructural refinement, and martensite-to-austenite reversion. Thermodynamic simulations were used to assess a range of temperatures for the reversion heat treatments [7,8].
Austenitic stainless steels are widely used in modern industries such as chemistry production, steamship manufacture, high temperature bolt, and nuclear reactor due to their excellent corrosion resistance, adequate high temperature mechanical properties, good fabricability, and weldability [9]. The study of AM of austenitic stainless steel has also become one of the research topics of many scholars.
Zhang et al. [10] studied the effect of laser power and scanning speed on microstructure and mechanical properties by building stainless steel 316 components by directed energy deposition with laser powers ranging from 600 to 1,400 W and scanning speeds ranging from 2 to 10 mm·s−1. Results showed that yield and tensile strengths decrease with increasing laser power and decreasing scanning speed, as this combination results in slower cooling rates and therefore larger grains. Zhong et al. [11] discussed EBM fabricated 316L stainless steel for nuclear reactor applications and emphasizing non-equilibrium microstructures. These non-equilibrium microstructures, including columnar (and directional) grains, are generally available through conventional thermo-mechanical processing methods and AM methods. Segura et al. [12] compared the mechanical properties (hardness, yield and ultimate tensile strengths, and elongation) for 316L stainless steel electron beam melting claddings on wrought 316L stainless steel substrates. The yield strength and ultimate tensile strength values of roughly 76 and 29% were greater than wrought 316L stainless steel, respectively. Yadroitsev et al. [13] focused on the effects of preheating temperature and laser scanning speed on the microstructure and geometrical features of single tracks. Guan et al. [14] studied the effects of slicing thickness, building direction, overlapping rate, and hatch angle on the tensile properties of selective laser melted stainless steel in details. Guo et al. [15] studied the microstructure and the mechanical properties of the fabricated stainless steel through high-power direct laser deposition. The effect of building direction on the microstructure, mechanical properties, and machinability of the stainless steel was investigated. Laser metal deposition was used to repair grooves on 20 mm thickness 316L stainless steel plates using two different 316L stainless steel commercial powders, and the microstructure and mechanical properties of the repaired specimens were investigated [16]. Khodabakhshi et al. [17] evaluated the tensile flow properties of austenitic and martensitic stainless steel wall structures deposited by powder-fed laser additive manufacturing (LAM) process. The properties obtained by the LAM process are compared to commercial rolled sheets of these metals. Strain-rate sensitivity, work hardening, and fracture behaviours are assessed by conducting uniaxial tensile testing at different strain rates (0.001, 0.01, 0.1, and 1.0 s−1). The thermal behaviours and physical mechanisms of the molten pool are investigated as the evolutions of the TiC dispersion state and particle size and the TiC/316L nanocomposite grain size during SLM at various applied energy densities, and a simulation model is constructed to predict the thermal behaviours of the SLM processing [18]. AlMangour et al. [19] established the relationships among the SLM processing conditions, densification behaviour, microstructural evolution including phase and texture development, and mechanical properties of TiC/316L nanocomposite parts produced with different SLM energy densities. Larimian et al. [20] researched the effect of energy density and scanning strategy on densification, microstructure, and mechanical properties of 316L stainless steel processed via selective laser melting.
304 stainless steel has been widely used in various areas due to its excellent corrosion resistance, mechanical properties, and low price. All these characteristics make this type of metal alloy prevalent in automotive, aerospace, architecture, and nuclear industries. Other than fabricated with conventionally subtractive manufacturing methods [21], some 304 stainless steel parts are complex in shape with inner cavities, cooling channels, or mesh structures, such as injection mould and light-weight parts, which are difficult to fabricate with conventional manufacturing methods except additive manufacture process [22]. The pervasiveness usage and wide availability of 304 stainless steel and the relatively inexpensive feedstock for AM have led to many publications’ focus on the study on microstructures and properties. Wang et al. [23] investigated the effect of processing parameters on the microstructure and tensile mechanical properties of AISI type 304L stainless steel fabricated by laser-based directed energy deposition through both experimental characterization and the application of grain growth and grain size strengthening models. Ghayoor et al. [24] investigated the role of volumetric energy density on the microstructural evolution, texture, and mechanical properties of 304L stainless steel parts additively manufactured via selective laser melting process. The highest relative density of 99 ± 0.5% was achieved using a volumetric energy density of 1,400 J·mm−3. Both XRD analysis and simulation revealed the presence of a small trace of the delta ferrite phase, due to rapid solidification within the austenitic matrix of 304L. A fine cellular substructure ranging between 0.4 and 1.8 μm was detected across different energy density values. Hou et al. [25]. investigated the microstructure and mechanical properties of 304L stainless steel fabricated by selective laser melting. With the optimized laser processing parameters, a relative density of 99.9% is achieved with fine austenite grains and nanoscale cellular subgrains in size of approximately 0.5 μm. The presented numerical model solves the heat and mass transfer equations in the Laser Metal Deposition process and, based on the evolution of the thermal field, predicts the grainsize and the resulting hardness and evaluates the pores formation probability in AISI 304 stainless steel [26]. The properties, microstructures, and grain sizes of the Laser Metal Deposition SS304 specimens are compared with those of the traditional method [27]. Yu et al. [28] studied the near-fully dense Ti–6Al–4V and 304 steel parts using optimized SLM processing parameters, and the comparative studies on tensile and microhardness anisotropies of the two alloys were carried out. The compressive behaviour of honeycomb lattice structures manufactured using AM of 304L stainless steel has been studied, and the nonlinear material models of compressive behaviour and honeycomb structures were built [29].
Dilution is an important parameter for any AM process because it quantifies the relative amount of fusion of the deposited layer with the substrate as well as bonding between the different deposited layers. Higher value of dilution of deposition lowers corrosion resistance and mechanical properties of the coatings and increases the distortion, whereas very less value of dilution leads to poor bonding between two successive layers as well as the substrate [30]. Dilution in any additive layer manufacturing signifies fusion of a deposition layer with the substrate as well as between the successive deposited layers. It assumes importance because it affects metallurgical bonding and properties of the deposited layers. Mayur S. Sawant et al. constructed a generic theoretical model and FES to predict dilution of depositions by micro-plasma transferred arc additive manufacturing (MPTAAM) process. Results have shown very good agreement between model and FES predicted values of dilution with the corresponding experimental values [31]. Li et al. developed an improved three-dimensional model to study the temperature distribution, solidification characteristics, fluid flow, and concentration dilution during laser linear welding of SS and Ni [32]. A physics-based process model of laser powder-fed additive manufacturing (LPF-AM) can perform an efficient prediction of the melt pool dimension, wetting angle, dilution, process heating/cooling rates, and clad 3D profiles from single track to multitrack and multi-layer deposition and has the potential to be employed for the fast process optimization and controller design [33].
The microstructures’ structure of the melt pool has a strong influence on the mechanical properties of the AM processed parts. As we know, the molten pool shape is very significant because the heat flow is approximately perpendicular to the molten pool boarders where the direction of heat flow controls the grains’ growth orientation during the solidification [34].
In the past, a lot of researches have been done to study the rules of controlling microstructures and mechanical properties for various materials under different laser additive manufacture processing parameters. Most attention of these researches is paid to laser power and scanning speed of AM parameters [35]. A distinctive feature of solidification during SLM is cellular growth in many alloys, such as Co–29Cr–6Mo alloy [36], and cellular-dendritic growth in some alloys, such as IN718 [37]. Growth texture and cell size and how they are affected by SLM parameters and can possibly be controlled are thus fundamental to be understood [38]. G (the temperature gradient) had a significant contribution to the oriented growth of dendrites, which may affect the mechanical properties of the samples. Cellular growth is based on the well-known constitutional supercooling criterion and there is a critical value of G/R, below which cellular growth should prevail. Epitaxial growth and growth of a grain (a group of cells) over many layers have now been well-recognized [39].
A study revealed that the micro-hardness of the samples, fabricated by high-power selective laser melting, was directional-dependent, which was attributed to the anisotropy of the microstructure [40]. The heat transfer and columnar grains’ growth in the laser welding pool of 2A14 aluminium alloy under different welding parameters are investigated through macro-micro modelling and simulation. A macroscopic heat transfer model is proposed to calculate the temperature field in the laser welding pool under different welding parameters [41]. According to the solidification theory, there is an intense competitive grain epitaxial growth at the beginning of solidification in the SLM process. After nucleation, primary grains with different preferential growth orientations come into being. Grains with the most favourable orientations in line with the temperature gradient at the solid–liquid interface win the competition, while the less favourable grains are terminated [42].
Many researches about AM of 304 steel have been done, in this paper, through laser cladding. Laser cladding is a process of rapid heating and solidification. Columnar crystals grow in the direction of the temperature gradient (G), resulting in a solidified structure with a distinct directionality.
In this study, experiments on the directional solidification of the grain structure were used to investigate the micromorphology, microstructural morphology, and grain growth direction of 304 stainless steel under different laser scan speeds.
A bigger laser power of 2,500 W, with scanning speed of 2, 4, 7, 10, 13, 16 and 19 mm·s−1, has been selected in laser cladding of 304 stainless steel. The rationale for scanning speed and performance is studied through the relationship between the base and the cladding layer, the ratio of dilution and Fe/Cr at different cladding speed, and the analysis on hardness of cladding layer. This paper studied the grain shapes and growing status in three-dimensional from microstructure view. This paper also analysed the rules that the scanning speed affects the direction of grain growth.
2 Experimental methods
Figure 1 shows the laser additive scanning process used in this study. Scanning electron microscopy (SEM) images are shown in Figure 2, and the material chemical composition is shown in Table 1. The cladding material was 304 stainless steel powder with a particle size of 30–80 μm. It can be seen from Figure 2 that the powder particle size is approximately 50 μm. This powder particle size is conducive to the input of laser energy during the cladding process, resulting in good metallurgical bonding. The sizes of some typical powder particles are marked in the Figure 2. The SEM images shown are spherical or nearly spherical powder particles with smooth surfaces and no apparent defects. The satellite powder did not adhere to the particle surfaces, effectively meeting cladding requirements.

Schematic and actual photo of laser scanning process: (a) schematic diagram and (b) actual photo.
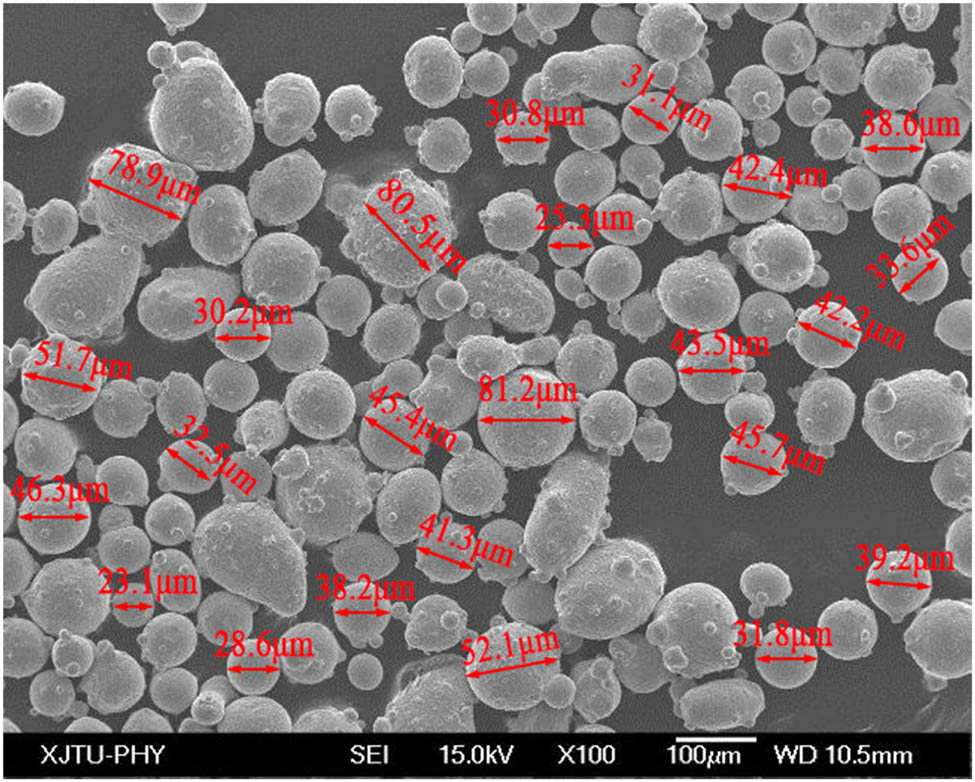
Morphology of 304 stainless steel powder particles.
Chemical composition of 304 stainless steel powder (mass fraction (%))
| Chemical composition | C | Mn | P | S | Si | Cr | Ni |
|---|---|---|---|---|---|---|---|
| Content | ≦0.08 | ≦2.00 | ≦0.045 | ≦0.030 | ≦1.00 | 18.0–20.0 | 8.0–11.0 |
3 Results and discussion
3.1 Effect of geometric characteristics and dilution
The morphology of the cladding layer significantly affects the geometric accuracy and forming quality of a cladding layer. The height (H) of the cladding layer controls the thickness of the cladding layer during manufacturing. The width (W) of the cladding layer critically affects the technique selected for forming a workpiece and the degree of overlap between one pass and another. The DZ affects the remelting ratio of the material in a multilayer manufacturing process. The HAZ directly affects the morphologies of the substrate structure and cladding layer, thereby affecting the material properties.
3.1.1 Macroscopic cross-sectional morphology and size
Figure 3 shows the macromorphology of a single-pass cladding layer obtained at different scan speeds. The single-pass cladding layer obtained at a 2 mm·s−1 scan speed had a relatively rough surface, and accretions appeared on both sides of the cladding layer. This burning phenomenon appeared after melting because of the long residence time and high temperature used in the process. Increasing the scan speed resulted in the gradual disappearance of the accretions. Gradually increasing the scan speeds (to 10, 13, and 16 mm·s−1) made the surface of the single-pass cladding layer smooth, and no sintering defects were apparent. When the scan speed increased to 19 and 22 mm·s−1, the single-pass cladding layer became discontinuous. The main reason for this result was that the scan was too rapid. Thus, there was a short laser residence time per unit scanning length, and low heat was absorbed by the powder. The small quantity of melted material was insufficient to create a continuous cladding layer, resulting in a variable cladding quality. Therefore, in subsequent analyses, the macro and microstructures and structural morphology were investigated at scan speeds of 4, 7, 10, 13, and 16 mm·s−1.
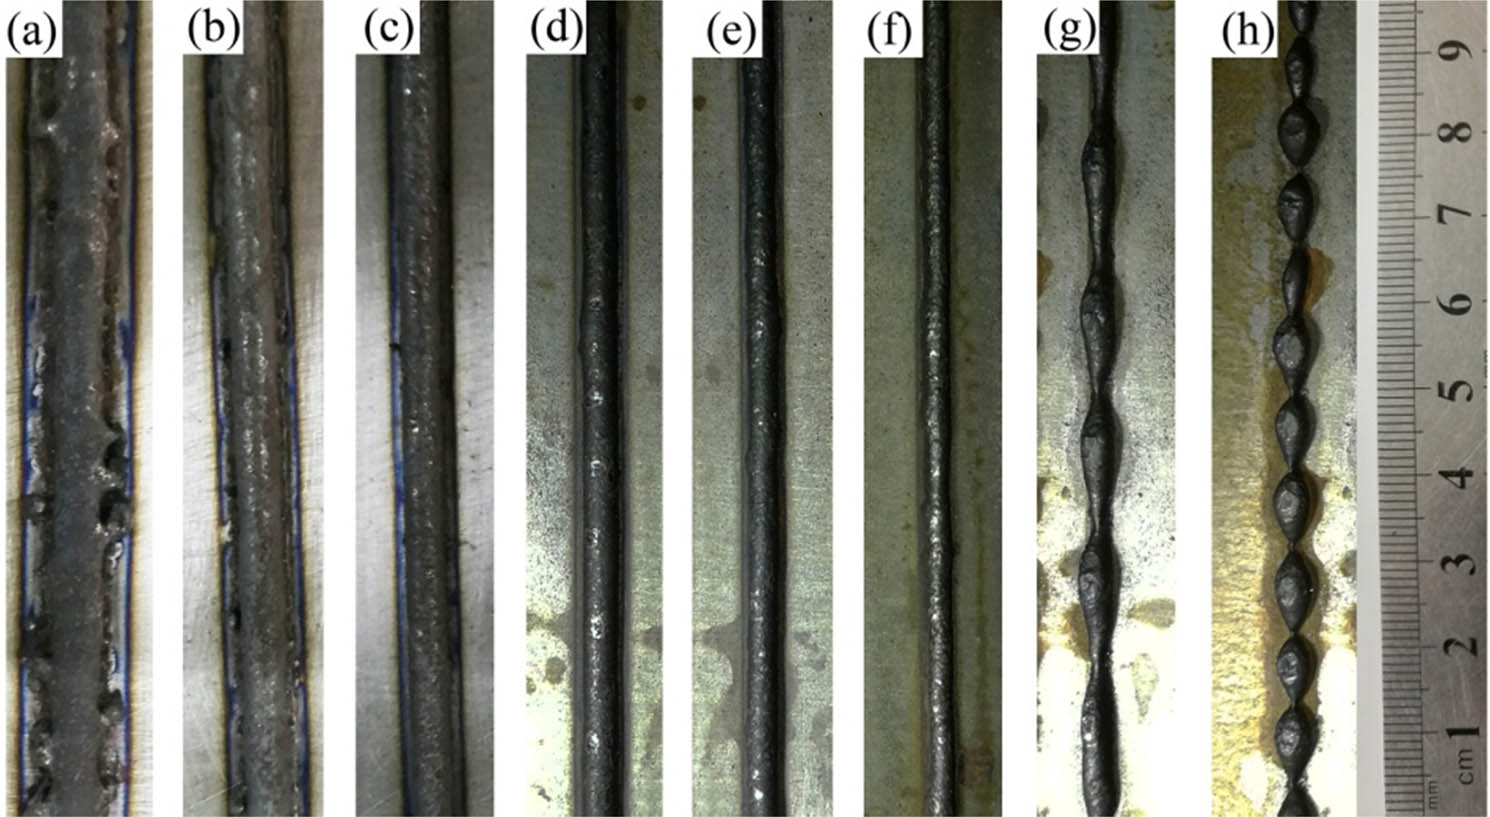
Schematic of macromorphology of a single-pass cladding layer obtained at different scan speeds. (a) 2 mm·s−1; (b) 4 mm·s−1; (c) 7 mm·s−1; (d) 10 mm·s−1; (e) 13 mm·s−1; (f) 16 mm·s−1; (g) 19 mm·s−1; and (h) 22 mm·s−1.
3.1.2 Cross-sectional geometric characteristics of cladding layer #1
Figure 4 shows a schematic cross-sectional view of the cladding layer, showing four-dimensional characteristic dimensional parameters. The width and thickness of different regions are denoted by W 1 and H 1, respectively, for the CZ; by W 2 and H 2, respectively, for the DZ; and by W 3 and H 3, respectively, for the HAZ. The effect of the geometric characteristic parameters was determined by observation of the cross-sectional morphologies of the cladding layer of the single-pass 304 stainless steel obtained at different scans speeds. The values of the geometric characteristic parameters are listed in Table 2.
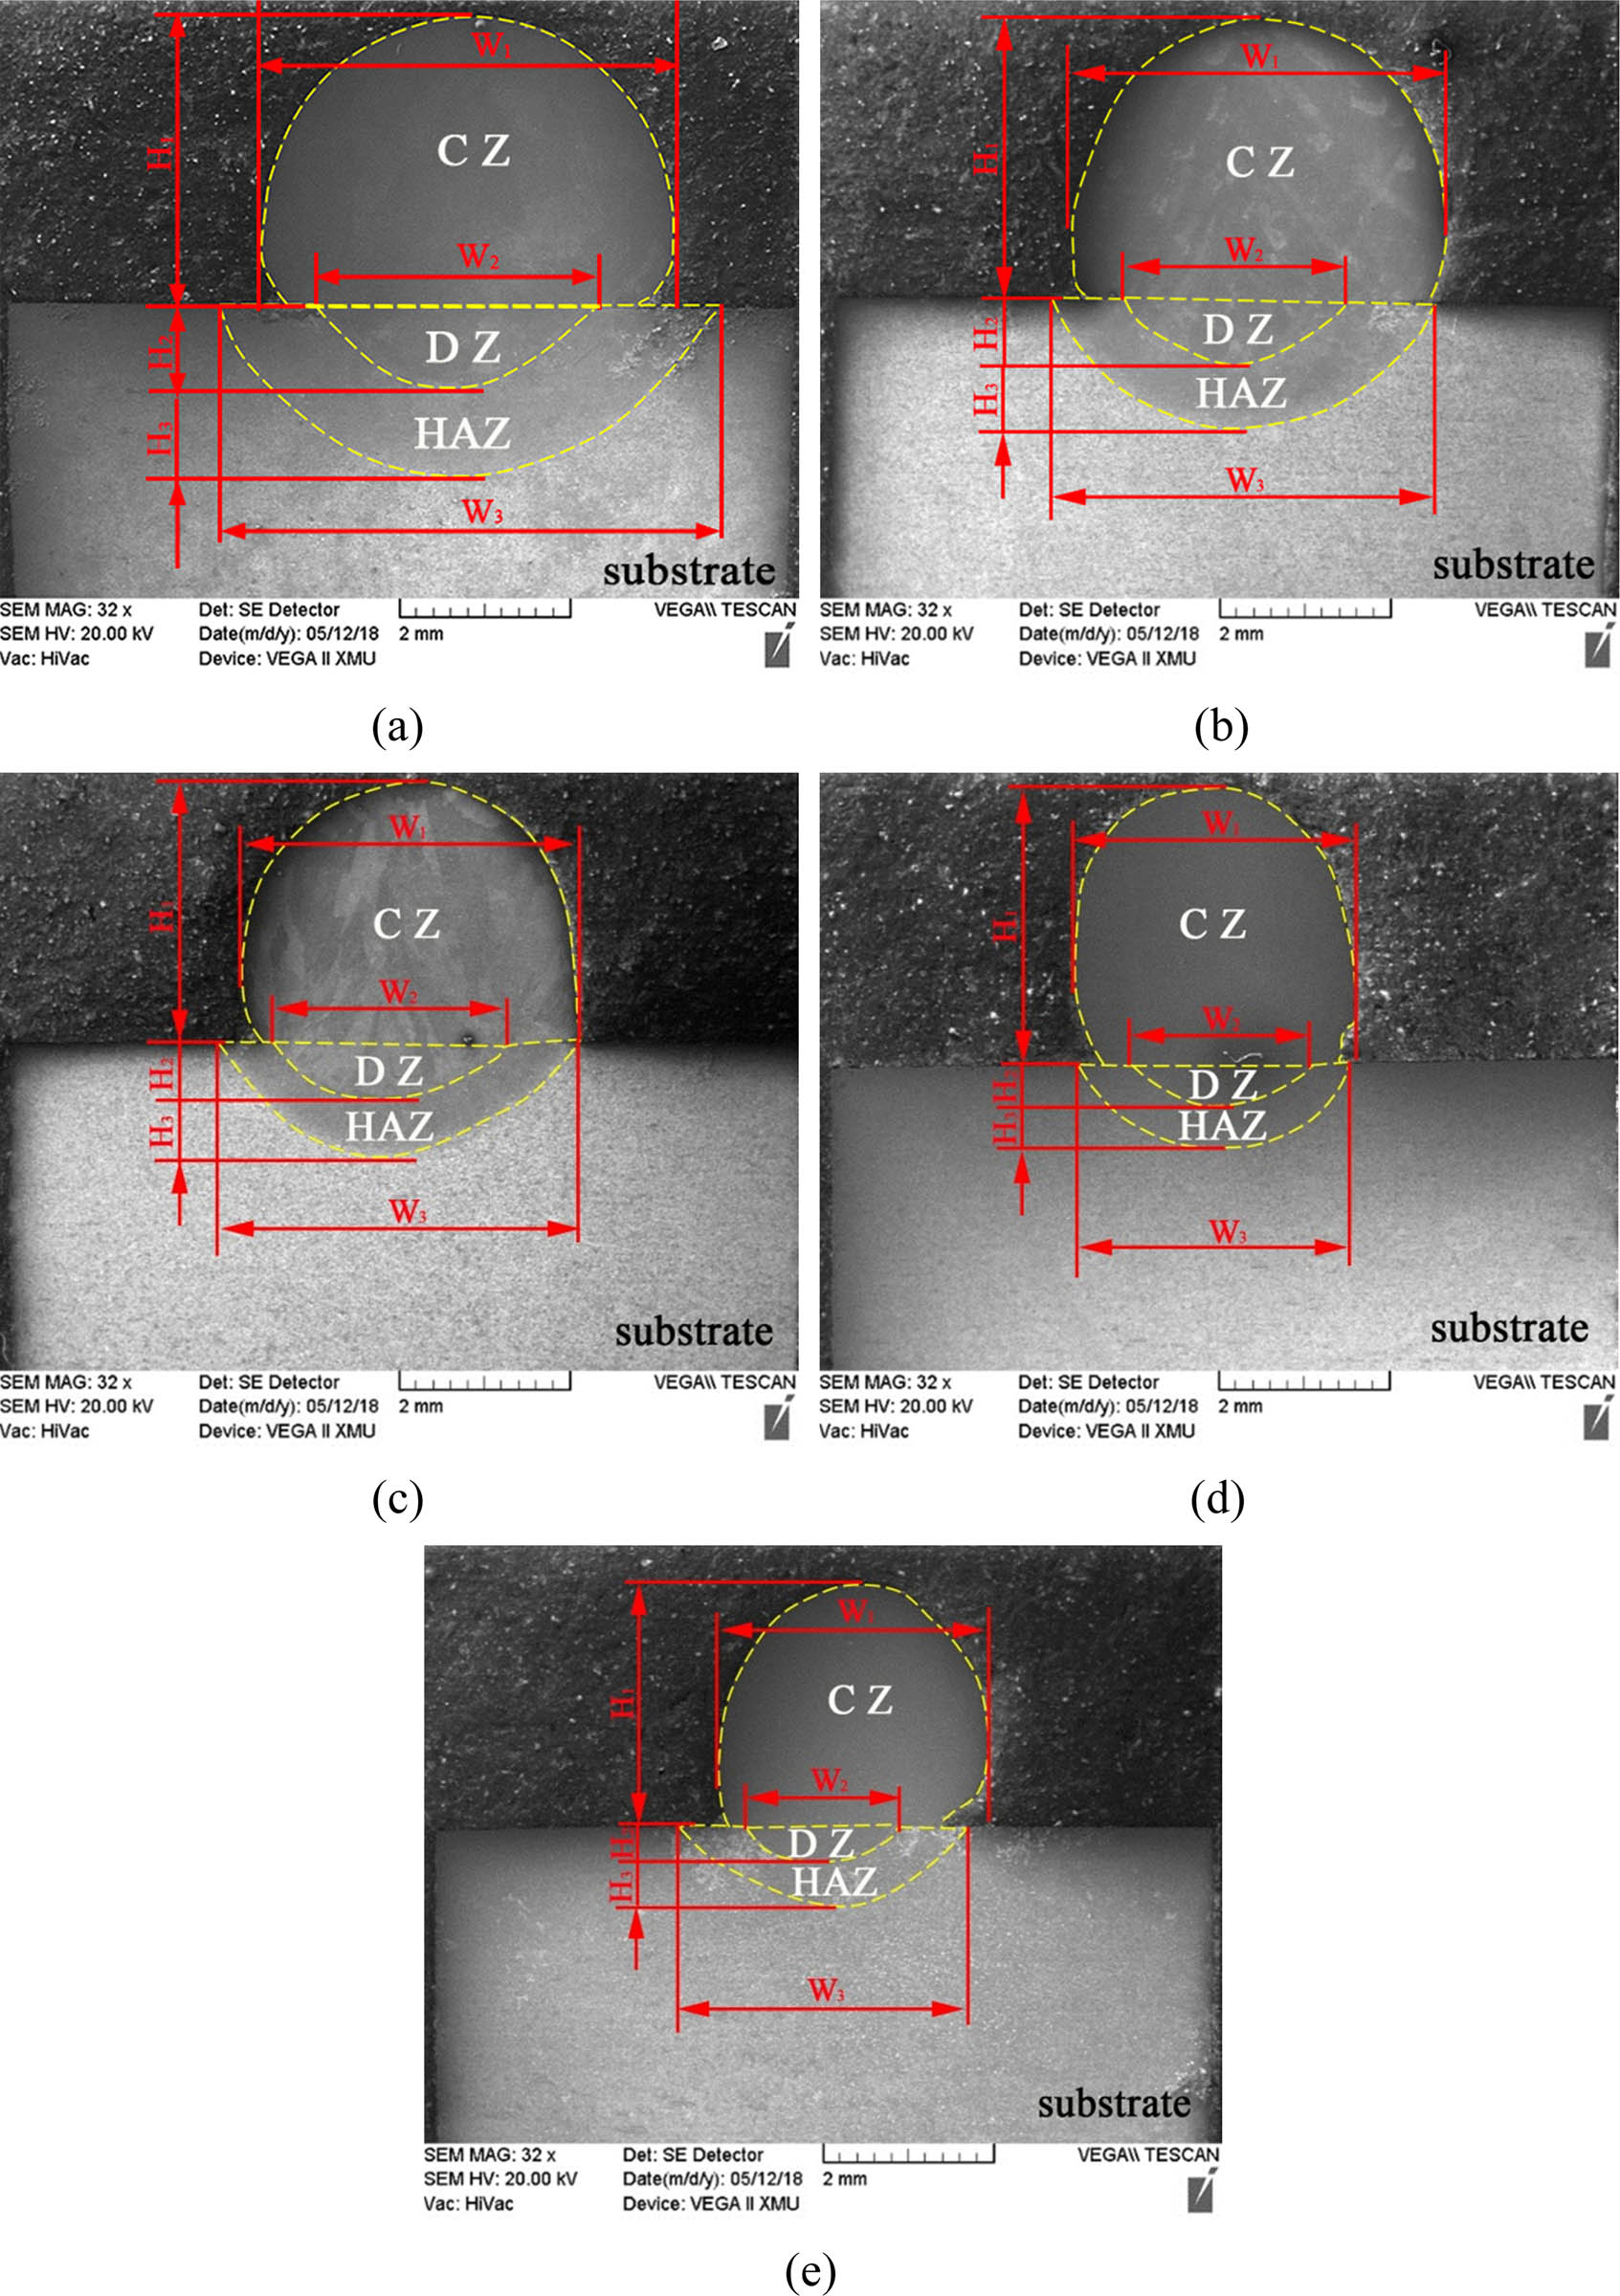
Cross-sectional morphologies of laser cladding layer of 304 steel obtained at different scan speeds V s: (a) 4 mm·s−1; (b) 7 mm·s−1; (c) 10 mm·s−1; (d) 13 mm·s−1; and (e) 16 mm·s−1.
The values of geometric characteristics at different scanning speed
| V (mm·s−1) | W 1 | H 1 | W 2 | H 2 | W 3 | H 3 | DR |
|---|---|---|---|---|---|---|---|
| 4 | 5.05 | 3.47 | 3.26 | 0.94 | 5.57 | 1.01 | 0.13 |
| 7 | 4.63 | 3.39 | 2.76 | 0.72 | 4.52 | 0.88 | 0.12 |
| 10 | 4.07 | 3.35 | 2.57 | 0.67 | 4.03 | 0.77 | 0.10 |
| 13 | 3.43 | 3.34 | 2.09 | 0.44 | 3.53 | 0.71 | 0.05 |
| 16 | 3.29 | 3.31 | 1.85 | 0.35 | 2.77 | 0.44 | 0.04 |
Figure 4 and Table 2 show that as the scan speed increased, the overall width W and height H of the cladding layer gradually decreased. This result was obtained because as the scan speed gradually increases, the laser action time of per unit scanning length gradually decreases. Thus, the heat absorbed by the substrate decreases, and the quantity of powder melted per unit length gradually decreases. Consequently, the cross-sectional size of a single-pass cladding layer gradually decreases. The depth H 2 of the DZ and the depth H 3 of the HAZ of the substrate also gradually decreased.
Increasing the scan speed to 13 mm·s−1 caused the cladding layer to separate from the substrate. After melting, the liquid is pulled into a spherical shape by the powder surface tension. The laser scanning process can destroy the intrinsic spherical shape of the molten liquid, resulting in a strong binding force between the cladding material and the substrate. As the scan speed increases, the action time is gradually reduced. This reduction in the impact of the laser scanning on the molten liquid creates a separation between the cladding layer and the substrate, weakening the bonding force thereof. Increasing the scan speed to 16 mm·s−1 produced obvious separation between the cladding layer and the substrate.
3.1.3 Dilution
An appropriate dilution rate (DR) is required to obtain a cladding layer with a high-quality surface and good integrity. The DR not only adjusts the chemical composition of the fusion zone, but also controls the segregation potential of the alloying elements[43]. A substrate cannot fully melt at an excessively low DR, and incomplete fusion between the coating and the substrate interface precludes the formation of a good metallurgical bonding layer. The substrate DR depends on the melting depth. The DR is given by the ratio of the cross-sectional area of the material in the CZ to the total cross-sectional area of the DZ between the cladding layer and the substrate (equation (1)); the relation between CZ and DZ is described in Figure 5.

Schematic of sampling areas used in energy spectrum analysis.
In the equation above, S CZ and S DZ represent the cross-sectional areas of the CZ and DZ, respectively. Table 2 shows the DRs calculated using equation (1) for different scan speeds. The DR gradually decreased as the laser scan speed increased.
An energy spectrum analysis was performed on different sampling areas in the cladding layer to investigate the dilution effect of the elemental composition in the cladding layer. Figure 5 schematizes five sampling areas (the area of A, B, C, D, and E) in the cladding layer used for the energy spectrum analysis. The sampling areas were separated by 1-mm intervals. The cladding powder-304 stainless steel powder used in this study had elemental Fe and Cr mass fractions of approximately 66 and 19%, respectively. The Fe/Cr elemental ratio was used to characterize the dilution effect of elements in the cladding layer. The Fe/Cr ratio (of approximately 3.5) in the 304 stainless steel cladding powder was used as a reference value.
Figure 6 shows the Fe/Cr ratio for different sampling areas in the cladding layer under different scan speeds and the corresponding positions of the sampling points on the x-axis. Figure 7 shows the microstructure and energy spectrum analysis results of the 5 sampling areas in the cladding layer under a 10 mm·s−1 scan speed.

Fe/Cr ratio for different sampling areas in cladding layer.
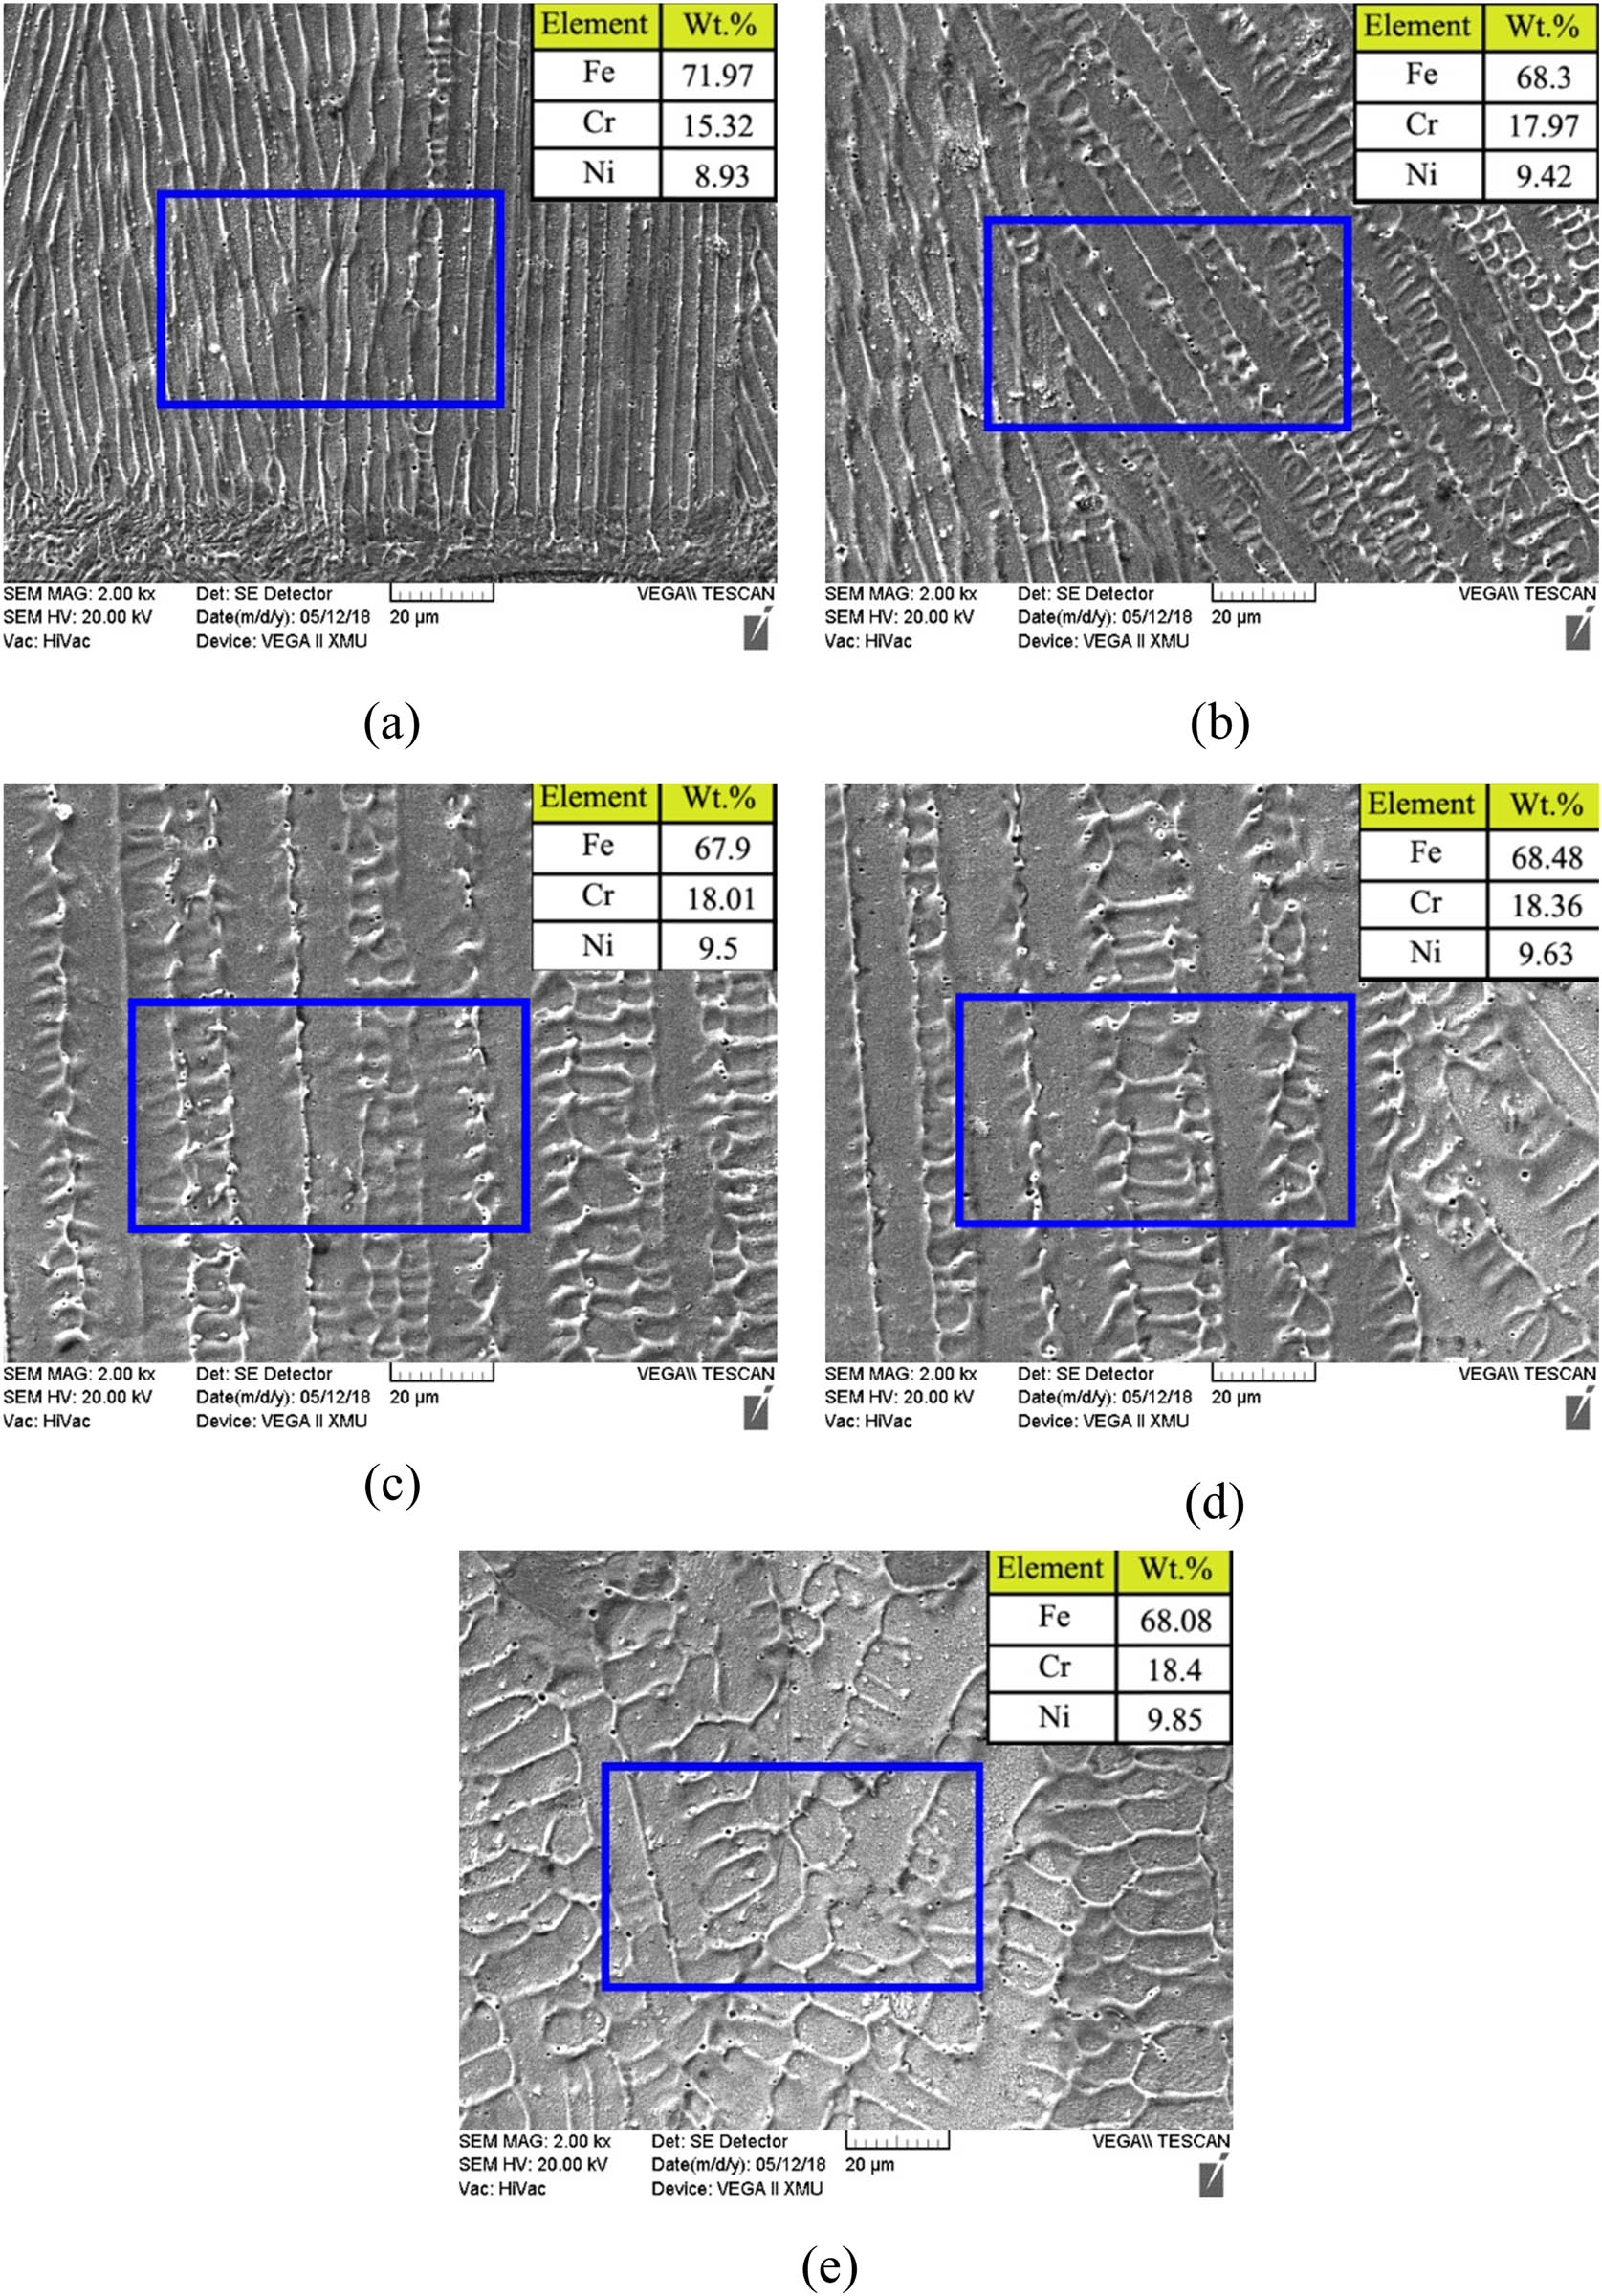
Energy spectrum analysis results for different sampling areas in the cladding layer obtained at 10 mm·s−1 scan speed: (a) the area of A; (b) the area of B; (c) the area of C; (d) the area of D; and (e) the area of E.
Figures 6 and 7 show that the Fe/Cr ratio in the area of A decreased after the initial increase in the scan speed. The maximum Fe/Cr ratio was reached to 5.22 at a 7 mm·s−1 scan speed.
The Fe/Cr ratio in the cladding layer is affected by both the laser energy input and the quantity of the melt substrate. At a low scan speed, laser stirring significantly affects the elemental distribution. The laser beam power plays a crucial role in the clad layer formation: the higher the laser power, the higher the amount of the melted powder particles. It should be noted that the control of the laser power is also of major importance as it will determine the heat transfer conditions [43] and elemental diffusion [44].
The laser energy input time is sufficient at a low scan speed, resulting in a uniform elemental distribution in the melt pool. Thus, the Fe/Cr ratio continued to increase up to 7 mm·s−1 scan speed. Increasing the scan speed beyond 7 mm·s−1 decreased the scan time per unit length. Although laser stirring remained uniformly, the decrease in the energy input resulted in insufficient material mixing, so the Fe/Cr mixing ratio gradually decreased.
The influence of element dilution gradually decreased for B, C, D, and E, which were relatively far from the substrate. The same trend in the Fe/Cr ratio was observed as the scan speed increased. As the scan speed increases, the laser action time per unit scanning length is reduced, and mixing of the substrate material in the melt pool gradually decreases. The decrease in the areas of the DZ and the decrease in HAZ do not affect mixing.
At a fixed scanning speed, the Fe/Cr ratio gradually decreased with increasing distance from the substrate for all sampling areas. Elemental mixing clearly occurred in the area of A, which lies within the DZ, resulting in a relatively large Fe/Cr ratio. As the distance from the substrate gradually increased to the highest point of the cladding layer (E), G gradually increased and there was no active motion of elements between the cladding layer and the substrate. Thus, the Fe/Cr ratio did not change after reaching a steady value.
3.2 Microstructure and influence on melt pool
The LAM process is highly complex and involves different physical mechanisms and multiple parameters. A laser beam is used to irradiate a substrate to form a melt pool. Powder addition and laser movement produce various physical and chemical changes on the surface and inside the melt pool. The morphology of the melt pool and internal heat transfer can affect the microstructure and the grain shape and size of the cladding layer. The laser cladding process parameters affect the surface and interior of the melt pool during LAM.
3.2.1 Melt pool morphology
Figure 8 shows the solid/liquid interface line between the melt pool and the solidified cladding layer. V s is the laser scan speed and V g is the grain growth rate. The V s is the laser cladding scan direction and the V g is the direction of grain growth, i.e., the normal direction of the solid/liquid interface line. The Z is the building direction of the cladding layer. θ is the angle between V s and V g.

Schematic of melt pool morphology.
Within solidification theory, the grain growth rate is given by the advancing speed of the melt pool interface along the normal direction. During LAM, the direction and rate of the grain growth depend on the direction and magnitude of the scan speed, as well as the angle between the grain growth direction and the interface direction.
Figure 9 shows typical microstructure in the longitudinal section (observation surface #2) of the cladding layer under different scan speeds. The cladding layer microstructure was dominated by columnar crystals with typical directional solidification characteristics and a diagonally upward length direction.

Microstructure of single-pass cladding layer at observation surface #2 obtained at different scan speeds V s: (a) 4 mm·s−1; (b) 7 mm·s−1; (c) 10 mm·s−1; (d) 13 mm·s−1; and (e) 16 mm·s−1.
Figure 9 shows that the angle θ between the length direction of the columnar crystal and the scan direction gradually increased with the scan speed. The angle between the scan direction and the grain growth direction was approximately 53° at a 4 mm·s−1 scan speed. The θ angle gradually increased with the scan angle. When the scan speed reached 16 mm·s−1, the angle between the scan speed and the grain growth direction was approximately 84°, which is close to a right angle. As the scan speed increases, the solid/liquid interface line between the melt pool and the solidified cladding layer gradually orients in the horizontal direction, and G in the melt pool is directed upwards. Thus, the solidification direction becomes almost vertical, i.e., orients in the positive Z direction.
The reason might be that the direction of grain solidification V g is along with the maximum temperature difference in the melting pot, i.e. vertical to the interface between the solid and the liquid. When the scanning speed V s increases, the interface between the solid and the liquid trends to horizontal, consequently the solidification direction V g trends to vertical, the angle θ becomes bigger and bigger.
Meanwhile, there are some layer boundaries in each picture of Figure 10, marked by dotted red lines, which are probably unmixed zones, and the major reason is probably the following: The governing mechanism for macro segregation during dissimilar welding/cladding is related to liquidus temperature differences between the fusion zone and the base materials; according to the fluid flow dynamics mechanisms, there is a “non-slip” boundary condition in which the velocity of liquid motion becomes zero at the solid/liquid interface, even with turbulent motion of the melt pool. Consequently, the fluid convection next to the fusion line is weakened, and therefore, a stagnant or laminar-flow layer of the liquid base metal can exist along the fusion boundary [44].
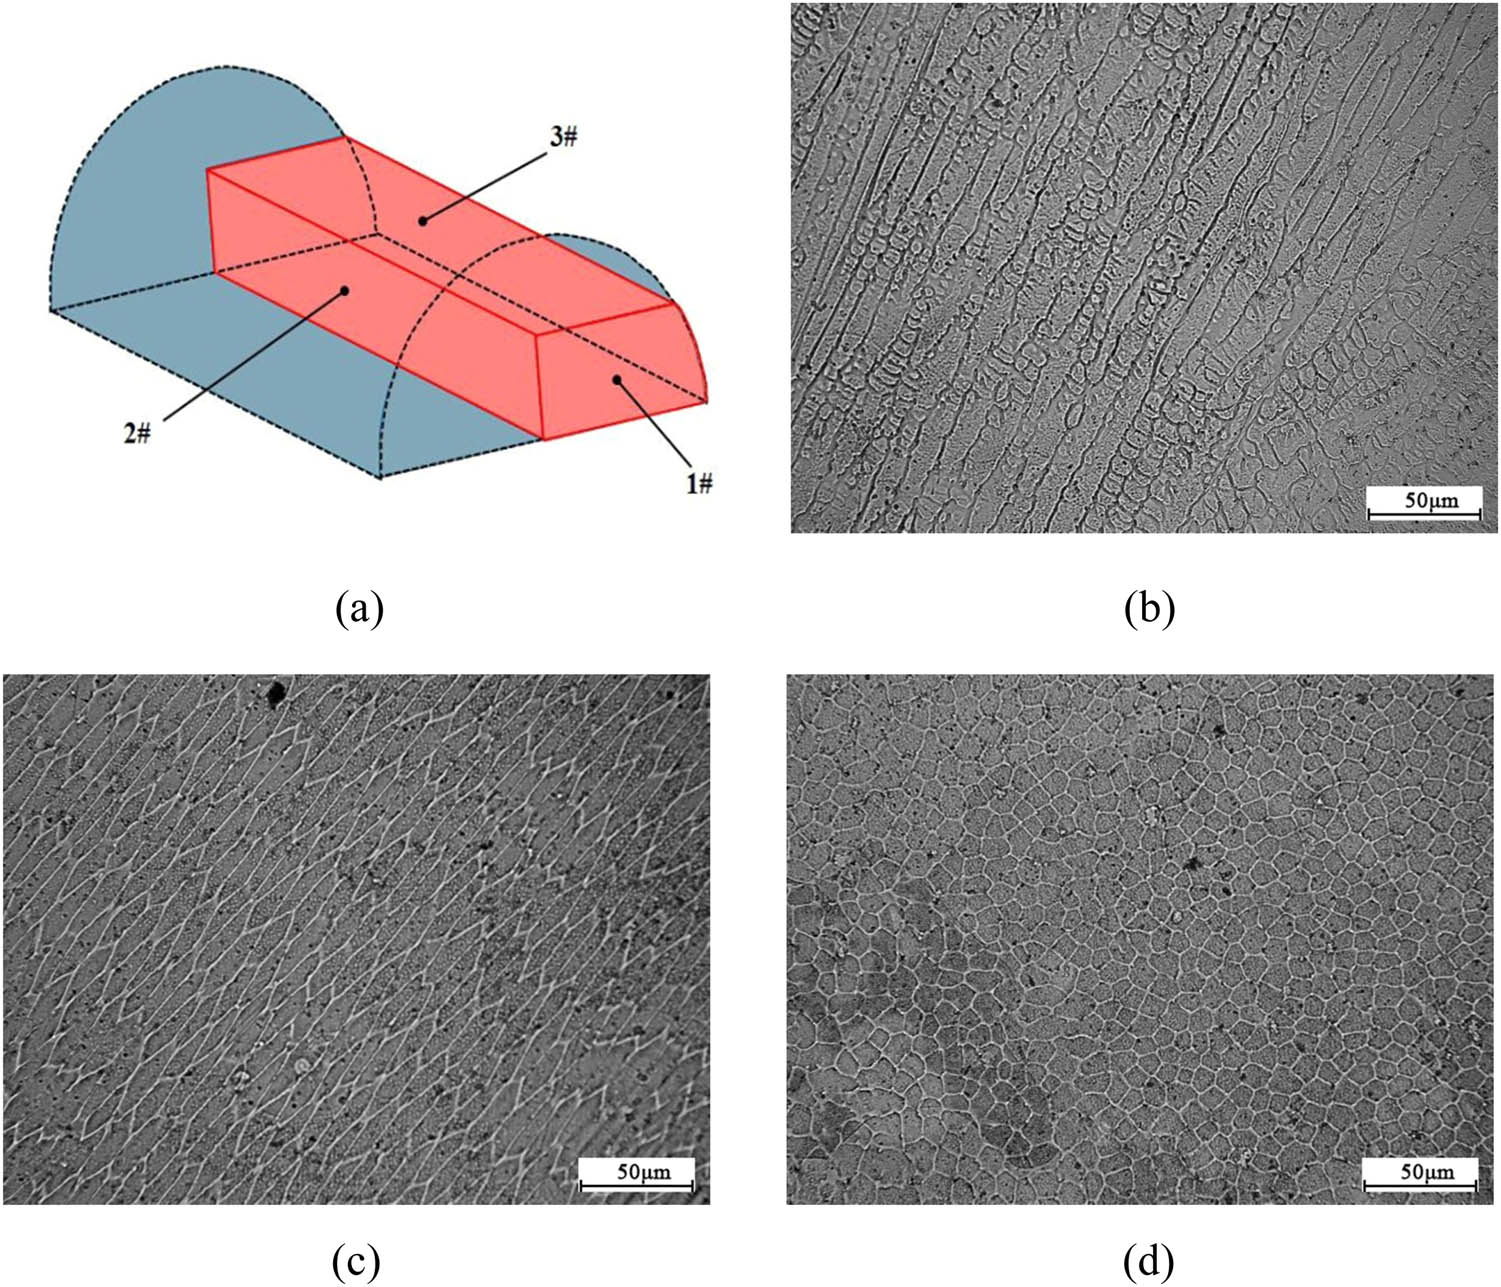
Microstructure of single-pass cladding layer on different observation surfaces: (a) sampling diagram; (b) observation surface #1; (c) observation surface #2; and (d) observation surface #3.
3.2.2 Microstructural morphology
A corroded microstructure was observed under an optical microscope. Figure 10 shows the microstructure in the cladding layer obtained at a laser power of 2,500 W and a 7 mm·s−1 scan speed. Three mutually perpendicular observation surfaces (#1, #2, and #3) were considered. Elongated crystal grains with typical directional solidification characteristics were the dominant microstructure on observation surfaces #1 and #2, whereas equiaxed crystal grains were the dominant microstructure on observation surface #3. Therefore, it was confirmed that the dominant structure in the cladding layer consisted of columnar crystals growing approximately perpendicular to the substrate surface. Figure 11 is a schematic of the growth direction of the columnar crystals. The X, Y, and Z directions correspond to the scan, width, and building directions of the cladding layer, respectively. As shown in Figure 12, the growth states of crystal grains in the length and width directions determine the growth trend of the columnar crystals, and the building direction determines the crystal grain size.

Schematic of growth direction of columnar crystals in cladding layer.
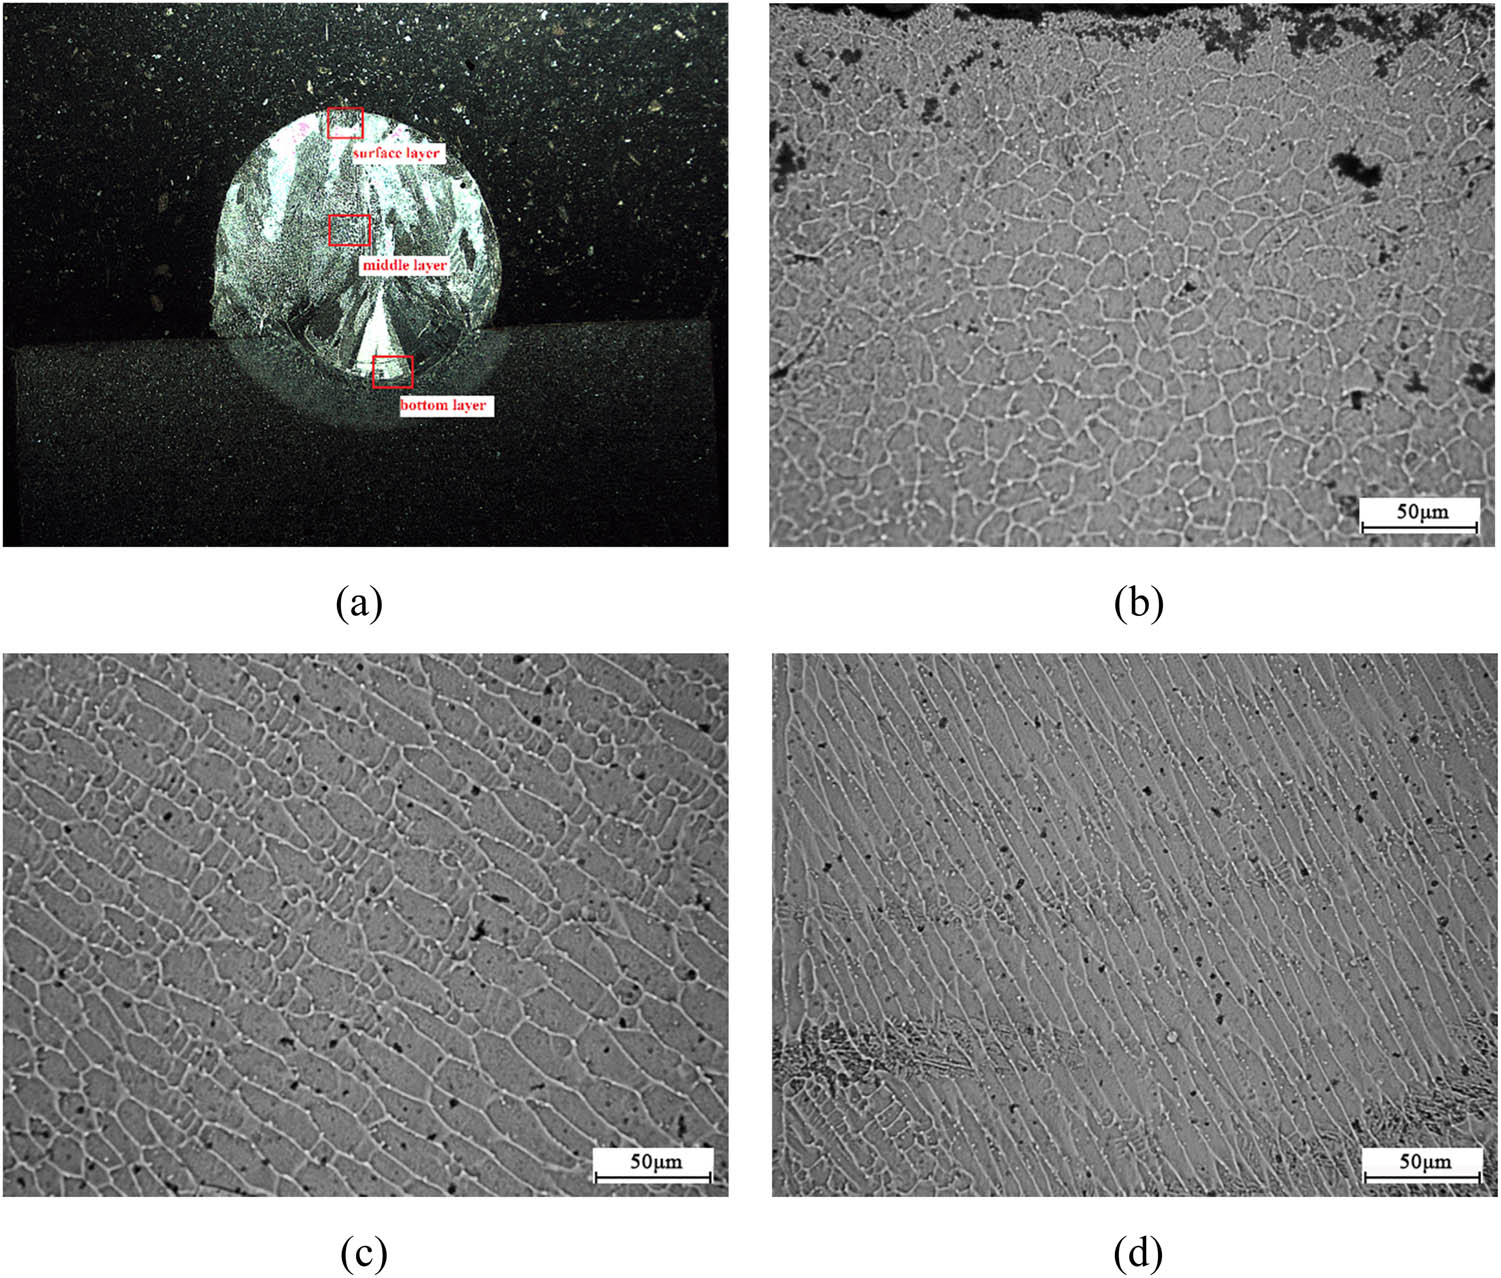
Microstructure of single-pass cladding layer on Observation surface #1: (a) macro image; (b) surface layer; (c) middle layer; and (d) bottom layer.
Figure 12 shows the typical microstructure of cross-section #1 of the single-pass cladding layer. The cross-section can be divided into surface, middle layer, and bottom layers. The shape and size of the crystal grains differ considerably across these layers, as shown in Figure 12(a). Figure 12(b) shows smaller crystal grains close to the surface layer with an equiaxed morphology. Figure 12(c) shows that the columnar crystals in the middle layer had typical directional solidification characteristics, and the direction was relatively regular. Figure 12(d) shows that the crystal grains in the bottom layer were also columnar crystals with typical directional solidification characteristics.
Within the theory of composition overcooling and structure solidification, grain morphology formation is mainly controlled by G and R. A high G/R ratio is conducive to the formation of columnar dendrites, whereas a low G/R ratio facilitates the formation of a overcooling zone consisting of a liquid phase with a broad composition, resulting in the formation of equiaxed crystals. During the laser cladding process, solidification always proceeds from the bottom to the top of the melt pool. In this direction, G gradually decreases, and R gradually increases, resulting in a small G/R ratio at the top of the pool. Therefore, solidification of the melt pool easily results in the transformation from columnar crystals to equiaxed crystals at the top of the sample.
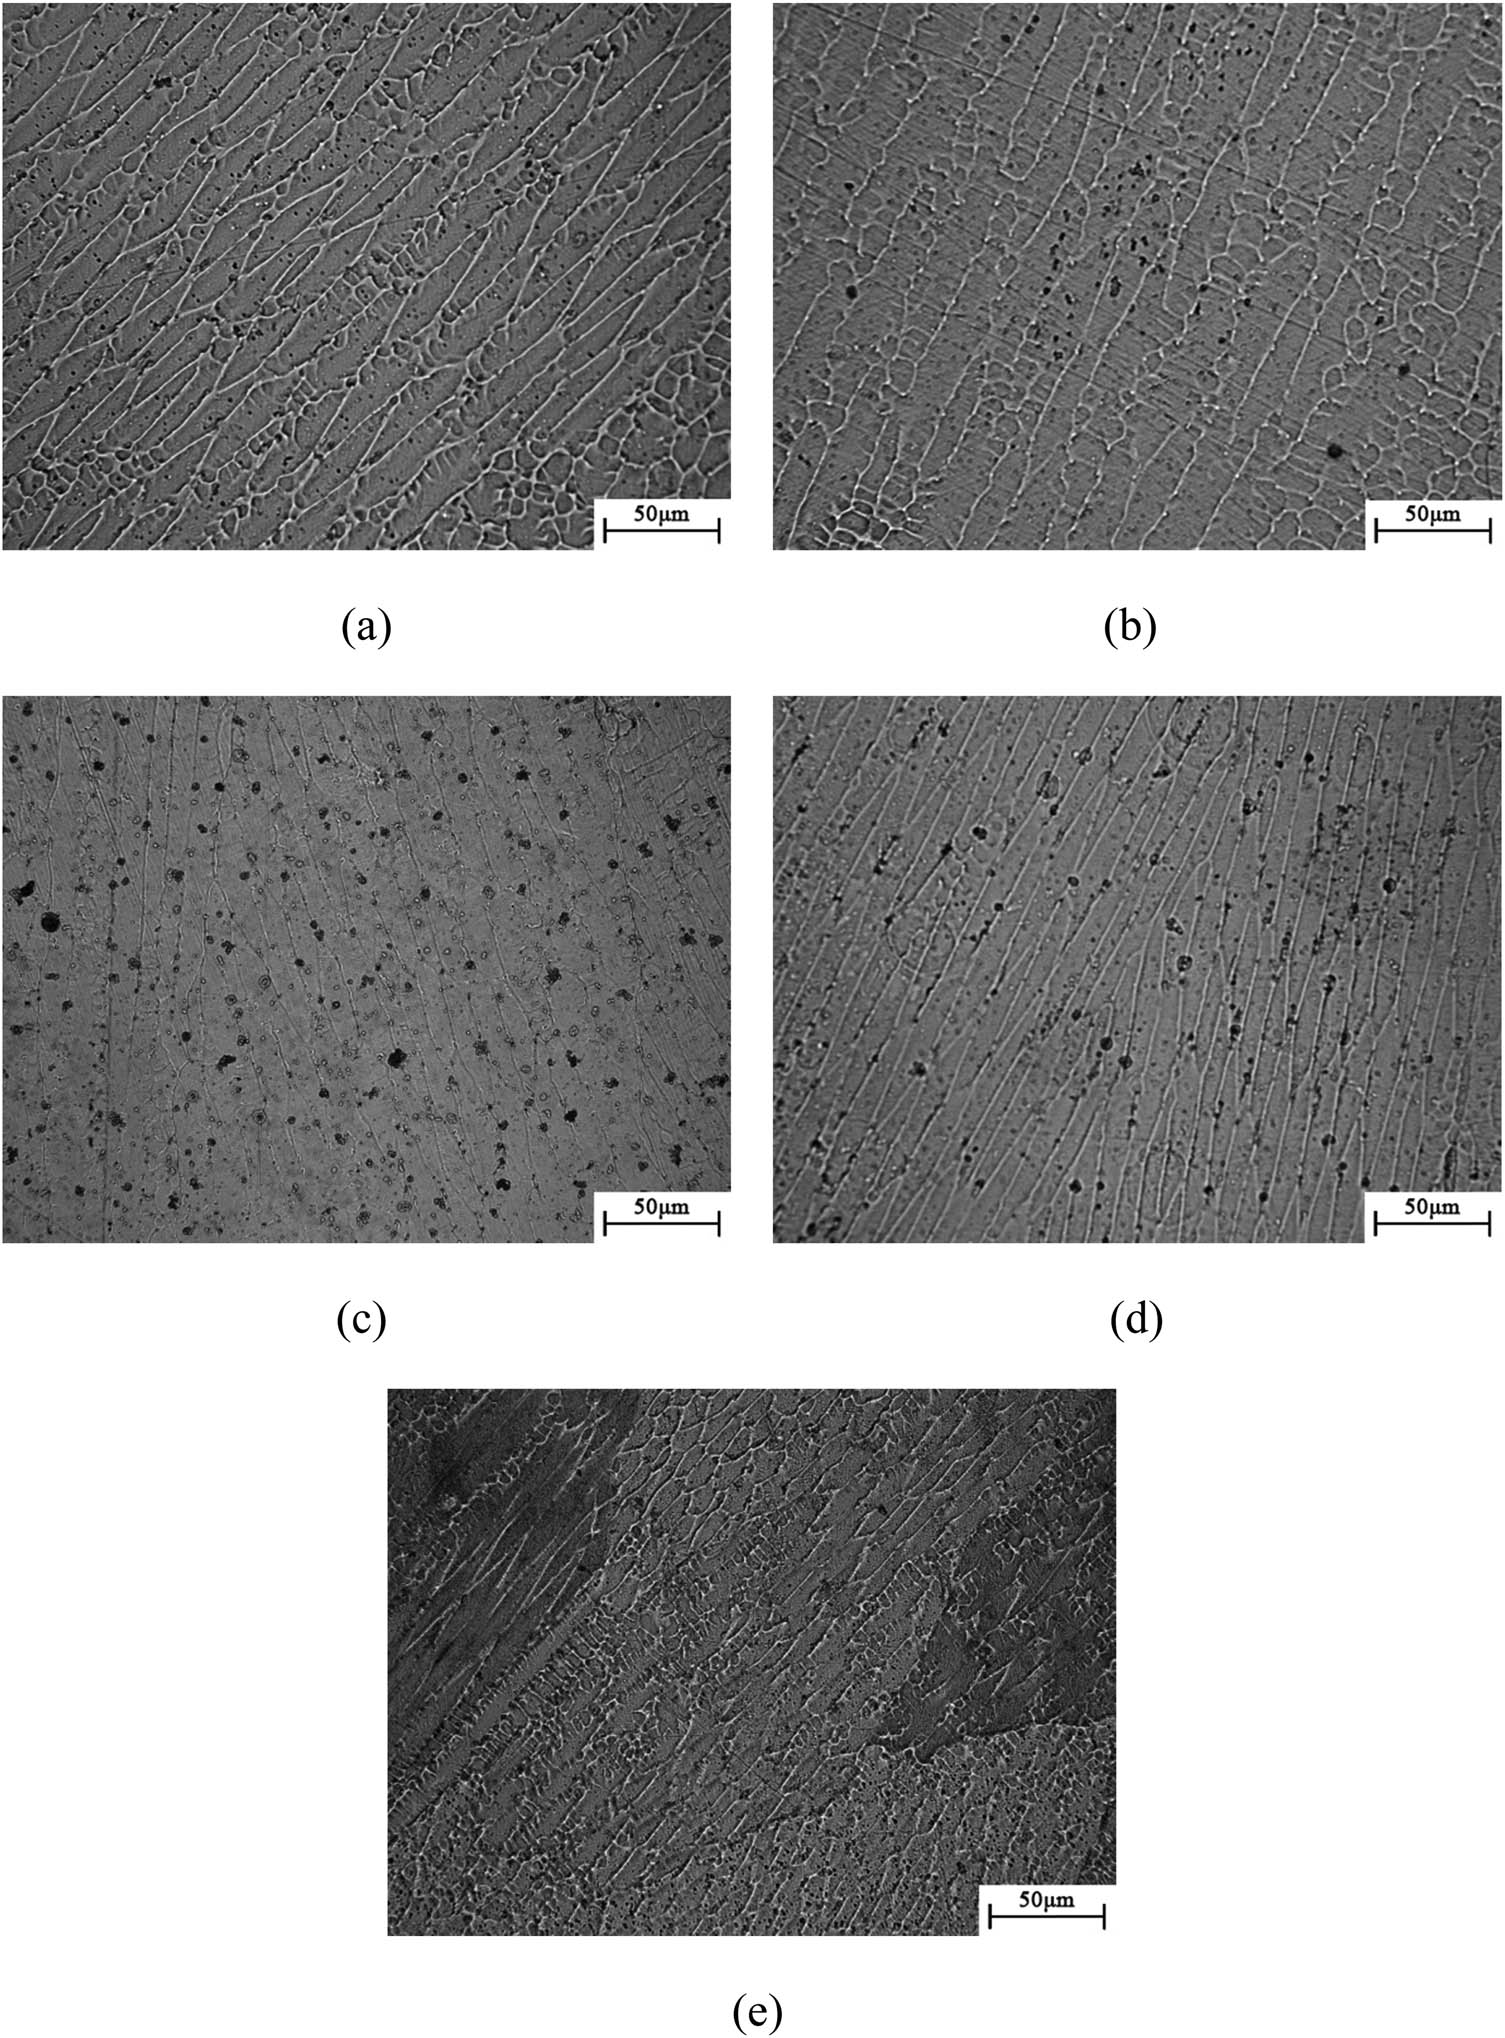
Figure 13 shows that a dendritic material morphology was obtained for a laser power of 2,500 W and scan speeds of 4, 7, 10, 13, and 16 mm·s−1. Changing the scan speed substantially affected the dendritic structure. Increasing the scan speed from 4 to 16 mm·s−1 resulted in a gradual decrease in the dendritic spacing from approximately 13.3 μm to approximately 9.2 μm. Increasing the scan speed reduces the action time between the laser and the melt pool. The reduction in the laser energy input to the melt pool gradually reduces the heat accumulation in the melt pool, which increases the cooling rate of the melt pool and affects the size of the columnar crystal grains. Consequently, the grain size is refined as the scan speed increases.
Dendritic morphology of material obtained at different scan speeds V s: (a) 4 mm·s−1; (b) 7 mm·s−1; (c) 10 mm·s−1; (d) 13 mm·s−1; and (e) 16 mm·s−1.
One of the critical issues during LAM is the formation of pores. It can be seen from Figures 12 and 13 that some samples present defects (pores) during the process of laser cladding, such as black spots in Figures 12(c and d) and 13(c and d). The existence of gases in between the powder particles makes it more prone for the development of porosity during the process. During laser cladding, the high energy density of the process can actively contribute to increase the possibility of pore formation [4]. For high laser energy densities, the material can be vaporized, and the heat will be transmitted into the material in depth. A capillary of metallic vapor will form and is surrounded by the molten material that solidifies above the vapor, thus trapping the vapor within the material as a pore [3].
In this paper, the distance between the cladding layer and the laser is farther in Figure 12(c and d), and the scanning speeds are higher in Figure 13(c and d), which are two reasons that result in low laser energy densities, thus easily presenting pores.
Insufficient melting of powder particles caused by low energy density can also result in more balling defect. Low-viscosity which is associated with lower energy density can cause disordered liquid solidification and consequently leads to balling defect and creation of pores inside the sample. Therefore, samples built under lower energy densities have more pores [21].
3.3 Hardness
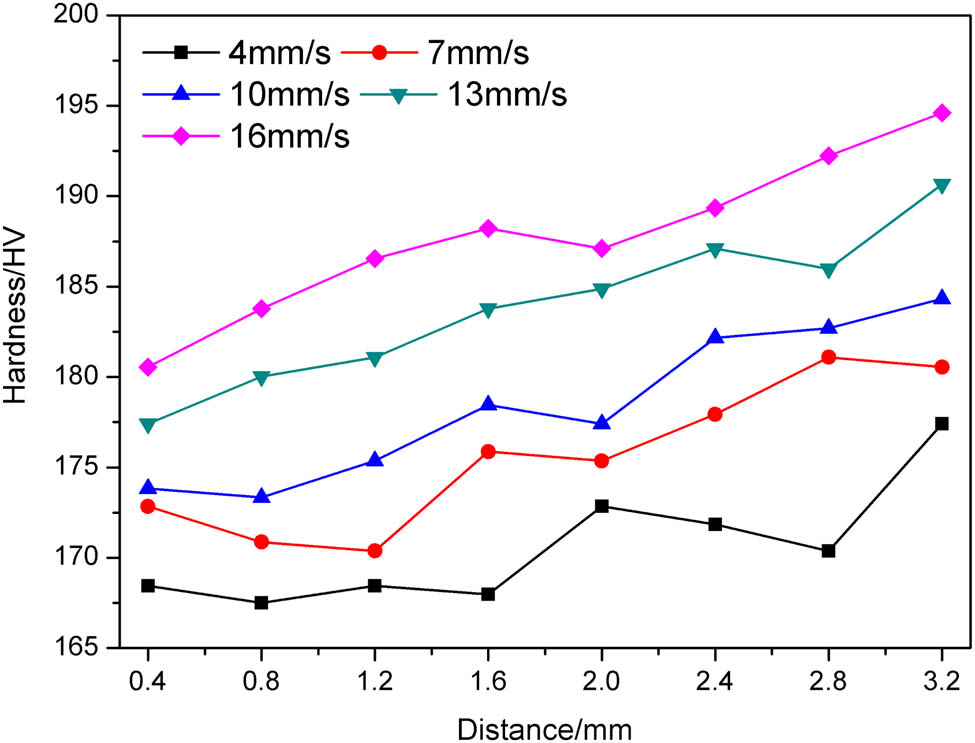
Figure 14 shows the measured Vickers hardness of the material in the CZ. The centre of the junction of the CZ and DZ was set as the starting point, the positive direction was along the surface of the cladding layer, and the hardness was measured at 0.4 mm intervals. Three sets of hardness values were collected for each position and averaged values were adopted. The centre of the junction of the CZ and DZ was set as the starting point, where the positive direction was along the surface of the cladding layer. The hardness was measured at 0.4-mm intervals. Three sets of hardness values were collected for each position and averaged. Figure 15 shows the hardness values of different positions in the CZ obtained at different scan speeds. The material hardness gradually increased with the decrease in the distance from the surface because the material grain size gradually decreased for the same factor. The hardness values are correlated with cooling rate, that is, the hardness values increase with the increases of the cooling rate from top to bottom of the cladding layer. At a fixed distance from the surface, the material hardness gradually increased with the scan speed. Increasing the scan speed decreases the laser residence time. Thus, the temperature of the melt pool decreases, and the cooling rate increases. The refined grains result in an increase in the number of grain boundaries, thereby enhancing the hardness, which is consistent with the change in the microstructure.

Schematic of CZ hardness.
Microhardness of CZ obtained at different scan speed.
4 Conclusion
In this study, laser-cladded 304 powder coatings were fabricated using a power of 2,500 W and different scan speeds. The morphologies, DR, micromorphology, grain morphology, and grain size in the cladding layer were investigated. The results obtained in this research are summarized below.
Scan speeds from 4 to 16 mm·s−1 produce smooth laser cladding surfaces with modest track widths/heights.
The DR gradually decreased as the laser scan speed increased. The Fe/Cr mixing degree reached a maximum with about 5.22 in the DZ area of the laser cladding layer for a 7 mm·s−1 scan speed, and at a fixed scanning speed, the Fe/Cr ratio gradually decreased with increasing distance from the substrate for all sampling areas; the Fe/Cr ratio did not change after reaching a steady value.
The 304 stainless steel cladding layer exhibited a partitioned microstructure. The CZ and DZ consisted mainly of columnar crystals and equiaxed crystals. The equiaxed crystals were mainly found at the cladding layer surface, and the columnar crystals were mainly found in the middle and bottom of the cladding layer. The growth direction of the columnar crystals was gradually oriented towards the building direction of the cladding layer as the scan speed increased. At a scan speed of 16 mm·s−1, the maximum angle between the scan speed and the grain growth direction was approximately 84°.
Increasing the scan speed from 4 to 16 mm·s−1 caused the crystal spacing of the columnar crystals in the middle and bottom of the cladding layer to gradually decrease from approximately 13.3 μm to approximately 9.2 μm. There are some pores in the cladding microstructure with the distance between the cladding layer and the laser farther for the middle and bottom cladding, and the scanning speeds are higher for the 13 and 16 mm·s−1, which results in low laser energy densities.
The hardness of the cladding layer gradually increased with the scan speed. At a fixed scan speed, the hardness gradually increased as the distance to the cladding layer surface decreased. As the distance to the surface of the cladding layer decreased, the faster the scan speed was, the higher G was. The resulting finer grains increased the hardness. The material hardness gradually increased with the decrease in the distance from the surface because the material grain size gradually decreased for the same factor.
Acknowledgement
This research was supported by Natural Science Foundation of Shaanxi Province, Shaanxi Provincial Key Laboratory of Special Energy Chemistry and Materials Open Fund Project and Natural Science Foundation of Shaanxi Province Shaanxi Coal Fund Project.
-
Funding information: This study was funded by Natural Science Foundation of Shaanxi Province (2020JM-529), Shaanxi Provincial Key Laboratory of Special Energy Chemistry and Materials Open Fund Project (SPCF-SKL-2020-0003), and Natural Science Foundation of Shaanxi Province Shaanxi Coal Joint Fund Project (2021JLM-08).
-
Author contributions: Four authors have made irreplaceable work on this paper. Rongxia Chai provided theoretical support and research ideas. Yapu Zhang analyzed the data and complete the corresponding chapter. Bin Zhong modified and improved the manuscript. Chuanwei Zhang provided necessary guidance.
-
Conflict of interest: Authors state no conflict of interest.
References
[1] Chen, X.-H., J. Li, X. Cheng, H.-M. Wang, and Z. Huang. Effect of heat treatment on microstructure, mechanical and corrosion properties of austenitic stainless steel 316L using arc additive manufacturing. Materials Science & Engineering A, Vol. 715, 2018, pp. 307–314.10.1016/j.msea.2017.10.002Search in Google Scholar
[2] Chen, J., H.-Y. Wei, X.-F. Zhang, Y. Peng, J. Kong, and K.-H. Wang. Flow behavior and microstructure evolution during dynamic deformation of 316 L stainless steel fabricated by wire and arc additive manufacturing. Materials and Design, Vol. 198, 2021, id. 109325.10.1016/j.matdes.2020.109325Search in Google Scholar
[3] Oliveira, J. P., A. D. LaLonde, and J. Ma. Processing parameters in laser powder bed fusion metal additive manufacturing. Materials and Design, Vol. 193, 2020, id. 108762.10.1016/j.matdes.2020.108762Search in Google Scholar
[4] Oliveira, J. P., T. G. Santos, and R. M. Miranda. Revisiting fundamental welding concepts to improve additive manufacturing: From theory to practice. Progress in Materials Science, Vol. 107, 2020, id. 100590.10.1016/j.pmatsci.2019.100590Search in Google Scholar
[5] Song, R.-B., J.-Y. Xiang, and D.-P. Hou. Characteristics of mechanical properties and microstructure for 316L austenitic stainless steel. Journal of Iron and Steel Research, Vol. 18, No. 11, 2011, pp. 53–59.10.1016/S1006-706X(11)60117-9Search in Google Scholar
[6] Ma, M.-M., Z.-M. Wang, D.-Z. Wang, and X.-Y. Zeng. Control of shape and performance for direct laser fabrication of precision large-scale metal parts with 316L stainless steel. Optics and Laser Technology, Vol. 45, 2013, pp. 209–216.10.1016/j.optlastec.2012.07.002Search in Google Scholar
[7] Conde, F. F., J. D. Escobar, J. P. Oliveira, A. L. Jardini, W. W. Bose, and J. A. Avila. Effect of thermal cycling and aging stages on the microstructure and bending strength of a selective laser melted 300-grade maraging steel. Materials Science & Engineering A, Vol. 758, 2019, pp. 192–201.10.1016/j.msea.2019.03.129Search in Google Scholar
[8] Conde, F. F., J. D. Escobar, J. P. Oliveira, A. L. Jardini, W. W. Bose Filho, and J. A. Avila. Austenite reversion kinetics and stability during tempering of an additively manufactured maraging 300 steel. Additive Manufacturing, Vol. 29, 2019, id. 100804.10.1016/j.addma.2019.100804Search in Google Scholar
[9] Xie, F.-X., X.-B. He, S.-L. Cao, and X.-H. Qu. Structural and mechanical characteristics of porous 316L stainless steel fabricated by indirect selective laser sintering. Journal of Materials Processing Technology, Vol. 213, 2013, pp. 838–843.10.1016/j.jmatprotec.2012.12.014Search in Google Scholar
[10] Zhang, K., S. Wang, W. Liu, and X. Shang. Characterization of stainless steel parts by laser metal deposition shaping. Materials & Design, Vol. 55, 2014, pp. 104–119.10.1016/j.matdes.2013.09.006Search in Google Scholar
[11] Zhong, Y., L. R. Cannar, L. Liu, A. Koptyug, S. Wikman, J. Olsen, et al. Additive manufacturing of 316L stainless steel by electron beam melting for nuclear fusion applications. Journal of Nuclear Materials, Vol. 486, 2017, pp. 234–245.10.1016/j.jnucmat.2016.12.042Search in Google Scholar
[12] Segura, I. A., J. Mireles, D. Bermudez, C.-A. Terrazas, L.-E. Murr, K. Li, et al. Characterization and mechanical properties of cladded stainless steel 316L with nuclear applications fabricated using electron beam melting. Journal of Nuclear Materials, Vol. 507, 2018, pp. 164–176.10.1016/j.jnucmat.2018.04.026Search in Google Scholar
[13] Yadroitsev, I., P. Krakhmalev, I. Yadroitsava, S. Johansson, and I. Smurov. Energy input effect on morphology and microstructure of selective laser melting single track from metallic powder. Journal of Materials Processing Technology, Vol. 213, 2013, pp. 606–613.10.1016/j.jmatprotec.2012.11.014Search in Google Scholar
[14] Guan, K., Z. Wang, M. Gao, X. Li, and X. Zeng. Effects of processing parameters on tensile properties of selective laser melted 304 stainless steel. Materials & Design, Vol. 50, 2013, pp. 581–586.10.1016/j.matdes.2013.03.056Search in Google Scholar
[15] Guo, P., B. Zou, C.-Z. Huang, and H.-B. Gao. Study on microstructure, mechanical properties and machinability of efficiently additive manufactured AISI 316L stainless steel by high-power direct laser deposition. Journal of Materials Processing Technology, Vol. 240, 2017, pp. 12–22.10.1016/j.jmatprotec.2016.09.005Search in Google Scholar
[16] Sun, G.-F., X.-T. Shen, Z.-D. Wang, M.-J. Zhan, S. Yao, R. Zhou, et al. Laser metal deposition as repair technology for 316L stainless steel: Influence of feeding powder compositions on microstructure and mechanical properties. Optics and Laser Technology, Vol. 109, 2019, pp. 71–83.10.1016/j.optlastec.2018.07.051Search in Google Scholar
[17] Khodabakhshi, F., M. H. Farshidianfar, A. P. Gerlichc, M. Nosko, V. Trembošová, and A. Khajepour. Microstructure, strain-rate sensitivity, work hardening, and fracture behaviour of laser additive manufactured austenitic and martensitic stainless steel structures. Materials Science & Engineering A, Vol. 756, 2019, pp. 545–561.10.1016/j.msea.2019.04.065Search in Google Scholar
[18] AlMangour, B., D. Grzesiak, J.-Q. Cheng, and Y. Ertas. Thermal behavior of the molten pool, microstructural evolution, and tribological performance during selective laser melting of TiC/316L stainless steel nanocomposites: Experimental and simulation methods. Journal of Materials Processing Technology, Vol. 257, 2018, pp. 288–301.10.1016/j.jmatprotec.2018.01.028Search in Google Scholar
[19] AlMangour, B., D. Grzesiak, T. Borkar, and J.-M. Yang. Densification behavior, microstructural evolution, and mechanical properties of TiC/316L nanocomposites fabricated by selective laser melting. Materials & Design, Vol. 138, 2018, pp. 119–128.10.1016/j.matdes.2017.10.039Search in Google Scholar
[20] Larimian, T., M. Kannan, D. Grzesiak, B. AlMangour, and T. Borkar. Effect of energy density and scanning strategy on densification, microstructure and mechanical properties of 316L stainless steel processed via selective laser melting. Materials Science & Engineering A, Vol. 770, 2020, id. 138455.10.1016/j.msea.2019.138455Search in Google Scholar
[21] Pan, T., S. Karnati, Y.-L. Zhang, X.-C. Zhang, C.-H. Hung, L. Li, et al. Experiment characterization and formulation estimation of tensile properties for selective laser melting manufactured 304L stainless steel. Materials Science & Engineering A, Vol. 798, 2020, id. 140086.10.1016/j.msea.2020.140086Search in Google Scholar
[22] Zhang, Y.-M. and W.-B. Huang. Comparisons of 304 austenitic stainless steel manufactured by laser metal deposition and selective laser melting. Journal of Manufacturing Processes, Vol. 57, 2020, pp. 324–333.10.1016/j.jmapro.2020.06.042Search in Google Scholar
[23] Wang, Z.-Q., T. A. Palmer, and M. B. Allison. Effect of processing parameters on microstructure and tensile properties of austenitic stainless steel 304L made by directed energy deposition additive manufacturing. Acta Materialia, Vol. 110, 2016, pp. 226–235.10.1016/j.actamat.2016.03.019Search in Google Scholar
[24] Ghayoor, M., K. Lee, Y.-J. He, C.-H. Chang, B.-K. Paul, and S. Pasebani. Selective laser melting of 304L stainless steel: Role of volumetric energy density on the microstructure, texture and mechanical properties. Additive Manufacturing, Vol. 32, 2020, id. 101011.10.1016/j.addma.2019.101011Search in Google Scholar
[25] Hou, J., W. Chen, Z.-E. Chen, K. Zhang, and A.-J. Huang. Microstructure, tensile properties and mechanical anisotropy of selective laser melted 304L stainless steel. Journal of Materials Science & Technology, Vol. 48, 2020, pp. 63–71.10.1016/j.jmst.2020.01.011Search in Google Scholar
[26] Arrizubieta, J.-I., A. Aitzol Lamikiza, M. Magdalena Cortinaa, E. Ukar, and A. Alberdi. Hardness, grainsize and porosity formation prediction on the Laser Metal Deposition of AISI 304 stainless steel. International Journal of Machine Tools and Manufacture, Vol. 135, 2018, pp. 53–64.10.1016/j.ijmachtools.2018.08.004Search in Google Scholar
[27] Huang, W.-B., Y.-M. Zhang, W.-B. Dai, and R.-S. Long. Mechanical properties of 304 austenite stainless steel manufactured by laser metal deposition. Materials Science & Engineering A, Vol. 758, 2019, pp. 60–70.10.1016/j.msea.2019.04.108Search in Google Scholar
[28] Yu, H.-C., J.-J. Yang, J. Yin, Z.-M. Zemin Wang, and X.-Y. Zeng. Comparison on mechanical anisotropies of selective laser melted Ti–6Al–4V alloy and 304 stainless steel. Materials Science & Engineering A, Vol. 695, No. 17, 2017, pp. 92–100.10.1016/j.msea.2017.04.031Search in Google Scholar
[29] Anandan, S., R. M. Hussein, M. Spratt, J. Joseph Newkirk, K. Chandrashekhara, H. Misak, et al. Failure in metal honeycombs manufactured by selective laser melting of 304 L stainless steel under compression. Virtual and Physical Prototyping, Vol. 14, No. 2, 2019, pp. 114–122. 10.1080/17452759.2018.1531336.Search in Google Scholar
[30] Sawant, M. S. and N. K. Jain. Characteristics of single-track and multi-track depositions of stellite by micro-plasma transferred arc powder deposition process. Journal of Materials Engineering and Performance, Vol. 26, 2017, pp. 4029–4039.10.1007/s11665-017-2828-ySearch in Google Scholar
[31] Sawant, M. S., N. K. Jain, H. Sagar, and K. Ni. Theoretical modelling and finite element simulation of dilution in micro-plasma transferred arc additive manufacturing of metallic materials. International Journal of Mechanical Sciences, Vol. 164, 2019, id. 105166.10.1016/j.ijmecsci.2019.105166Search in Google Scholar
[32] Li, Z.-Y., G. Yu, X.-L. He, S.-X. Li, and Z.-X. Li. Fluid flow and solute dilution in laser linear butt joining of 304SS and Ni. International Journal of Heat and Mass Transfer, Vol. 161, 2020, id. 120233.10.1016/j.ijheatmasstransfer.2020.120233Search in Google Scholar
[33] Huang, Y.-Z., M. B. Khamesee, and E. Toyserkani. A new physics-based model for laser directed energy deposition (powder-fed additive manufacturing): From single-track to multi-track and multi-layer. Optics and Laser Technology, Vol. 109, 2019, pp. 584–599.10.1016/j.optlastec.2018.08.015Search in Google Scholar
[34] Dezfoli, A. R., W. S. Hwang, W. C. Huang, and T. W. Tsai. Determination and controlling of grain structure of metals after laser incidence: theoretical approach. Scientific Reports, Vol. 7, 2017, id. 41527.10.1038/srep41527Search in Google Scholar PubMed PubMed Central
[35] Mohammad, N., S. R. Reza, and B. Masoud. An empirical-statistical model for laser cladding of Ti–6Al–4V powder on Ti–6Al–4V substrate. Optics and Laser Technology, Vol. 100, 2018, pp. 265–271.10.1016/j.optlastec.2017.10.015Search in Google Scholar
[36] Darvish, K., Z.-W. Chen, M. A. L. Phan, and T. Pasang. Selective laser melting of Co-29Cr-6Mo alloy with laser power 180–360 W: Cellular growth, intercellular spacing and the related thermal condition. Materials Characterization, Vol. 135, 2018, pp. 183–191.10.1016/j.matchar.2017.11.042Search in Google Scholar
[37] Tao, P., H. Li, B. Huang, Q. Hu, S. Gong, and Q. Xu. The crystal growth, intercellular spacing and microsegregation of selective laser melted Inconel 718 superalloy. Vacuum, Vol. 159, 2019, pp. 382–390.10.1016/j.vacuum.2018.10.074Search in Google Scholar
[38] Kurz, W. and R. Trivedi. Rapid solidification processing and microstructure development. Materials Science and Engineering A, Vol. 179/180, 1994, pp. 46–51.10.1016/0921-5093(94)90162-7Search in Google Scholar
[39] Darvish, K., Z.-W. Chen, M. A. Phan, and T. Pasang. Selective laser melting of Co-29Cr-6Mo alloy with laser power 180–360 W:Cellular growth, intercellular spacing and the related thermal condition. Materials Characterization, Vol. 135, 2018, pp. 183–191.10.1016/j.matchar.2017.11.042Search in Google Scholar
[40] Ma, M., Z. Wang, M. Gao, and X. Zeng. Layer thickness dependence of performance in high-power selective laser melting of 1Cr18Ni9Ti stainless steel. Journal of Materials Processing Technology, Vol. 215, 2015, pp. 142–150.10.1016/j.jmatprotec.2014.07.034Search in Google Scholar
[41] Wang, L., Y.-H. Wei, J.-C. Chen, and W.-Y. Zhao. Macro-micro modelling and simulation on columnar grains growth in the laser welding pool of aluminium alloy. International Journal of Heat and Mass Transfer, Vol. 123, 2018, pp. 826–838.10.1016/j.ijheatmasstransfer.2018.03.037Search in Google Scholar
[42] Yin, J., G.-Y. Peng, C.-P. Chen, J.-J. Yang, H.-H. Zhu, L.-D. Ke, et al. Thermal behavior and grain growth orientation during selective laser melting of Ti–6Al–4V alloy. Journal of Materials Processing Tech, Vol. 260, 2018, pp. 57–65.10.1016/j.jmatprotec.2018.04.035Search in Google Scholar
[43] Alizadeh-Sh, M., S. P. H. Marashi, E. Ranjbarnodeh, R. Shoja-Razavi, and J. P. Oliveira. Prediction of solidification cracking by an empirical-statistical analysis for laser cladding of Inconel 718 powder on a non-weldable substrate. Optics and Laser Technology, Vol. 128, 2020, id. 106244.10.1016/j.optlastec.2020.106244Search in Google Scholar
[44] Alizadeh-Sh, M., S. P. H. Marashi, E. Ranjbarnodeh, R. Shoja-Razavi, and J. P. Oliveira. Dissimilar laser cladding of Inconel 718 powder on A-286 substrate: Microstructural evolution. Journal of Laser Applications, Vol. 32, 2020, id. 022048.10.2351/1.5124932Search in Google Scholar
© 2021 Rongxia Chai et al., published by De Gruyter
This work is licensed under the Creative Commons Attribution 4.0 International License.
Articles in the same Issue
- Review Articles
- A review on filler materials for brazing of carbon-carbon composites
- Nanotechnology-based materials as emerging trends for dental applications
- A review on allotropes of carbon and natural filler-reinforced thermomechanical properties of upgraded epoxy hybrid composite
- High-temperature tribological properties of diamond-like carbon films: A review
- A review of current physical techniques for dispersion of cellulose nanomaterials in polymer matrices
- Review on structural damage rehabilitation and performance assessment of asphalt pavements
- Recent development in graphene-reinforced aluminium matrix composite: A review
- Mechanical behaviour of precast prestressed reinforced concrete beam–column joints in elevated station platforms subjected to vertical cyclic loading
- Effect of polythiophene thickness on hybrid sensor sensitivity
- Investigation on the relationship between CT numbers and marble failure under different confining pressures
- Finite element analysis on the bond behavior of steel bar in salt–frost-damaged recycled coarse aggregate concrete
- From passive to active sorting in microfluidics: A review
- Research Articles
- Revealing grain coarsening and detwinning in bimodal Cu under tension
- Mesoporous silica nanoparticles functionalized with folic acid for targeted release Cis-Pt to glioblastoma cells
- Magnetic behavior of Fe-doped of multicomponent bismuth niobate pyrochlore
- Study of surfaces, produced with the use of granite and titanium, for applications with solar thermal collectors
- Magnetic moment centers in titanium dioxide photocatalysts loaded on reduced graphene oxide flakes
- Mechanical model and contact properties of double row slewing ball bearing for wind turbine
- Sandwich panel with in-plane honeycombs in different Poisson's ratio under low to medium impact loads
- Effects of load types and critical molar ratios on strength properties and geopolymerization mechanism
- Nanoparticles in enhancing microwave imaging and microwave Hyperthermia effect for liver cancer treatment
- FEM micromechanical modeling of nanocomposites with carbon nanotubes
- Effect of fiber breakage position on the mechanical performance of unidirectional carbon fiber/epoxy composites
- Removal of cadmium and lead from aqueous solutions using iron phosphate-modified pollen microspheres as adsorbents
- Load identification and fatigue evaluation via wind-induced attitude decoupling of railway catenary
- Residual compression property and response of honeycomb sandwich structures subjected to single and repeated quasi-static indentation
- Experimental and modeling investigations of the behaviors of syntactic foam sandwich panels with lattice webs under crushing loads
- Effect of storage time and temperature on dissolved state of cellulose in TBAH-based solvents and mechanical property of regenerated films
- Thermal analysis of postcured aramid fiber/epoxy composites
- The energy absorption behavior of novel composite sandwich structures reinforced with trapezoidal latticed webs
- Experimental study on square hollow stainless steel tube trusses with three joint types and different brace widths under vertical loads
- Thermally stimulated artificial muscles: Bio-inspired approach to reduce thermal deformation of ball screws based on inner-embedded CFRP
- Abnormal structure and properties of copper–silver bar billet by cold casting
- Dynamic characteristics of tailings dam with geotextile tubes under seismic load
- Study on impact resistance of composite rocket launcher
- Effects of TVSR process on the dimensional stability and residual stress of 7075 aluminum alloy parts
- Dynamics of a rotating hollow FGM beam in the temperature field
- Development and characterization of bioglass incorporated plasma electrolytic oxidation layer on titanium substrate for biomedical application
- Effect of laser-assisted ultrasonic vibration dressing parameters of a cubic boron nitride grinding wheel on grinding force, surface quality, and particle morphology
- Vibration characteristics analysis of composite floating rafts for marine structure based on modal superposition theory
- Trajectory planning of the nursing robot based on the center of gravity for aluminum alloy structure
- Effect of scan speed on grain and microstructural morphology for laser additive manufacturing of 304 stainless steel
- Influence of coupling effects on analytical solutions of functionally graded (FG) spherical shells of revolution
- Improving the precision of micro-EDM for blind holes in titanium alloy by fixed reference axial compensation
- Electrolytic production and characterization of nickel–rhenium alloy coatings
- DC magnetization of titania supported on reduced graphene oxide flakes
- Analytical bond behavior of cold drawn SMA crimped fibers considering embedded length and fiber wave depth
- Structural and hydrogen storage characterization of nanocrystalline magnesium synthesized by ECAP and catalyzed by different nanotube additives
- Mechanical property of octahedron Ti6Al4V fabricated by selective laser melting
- Physical analysis of TiO2 and bentonite nanocomposite as adsorbent materials
- The optimization of friction disc gear-shaping process aiming at residual stress and machining deformation
- Optimization of EI961 steel spheroidization process for subsequent use in additive manufacturing: Effect of plasma treatment on the properties of EI961 powder
- Effect of ultrasonic field on the microstructure and mechanical properties of sand-casting AlSi7Mg0.3 alloy
- Influence of different material parameters on nonlinear vibration of the cylindrical skeleton supported prestressed fabric composite membrane
- Investigations of polyamide nano-composites containing bentonite and organo-modified clays: Mechanical, thermal, structural and processing performances
- Conductive thermoplastic vulcanizates based on carbon black-filled bromo-isobutylene-isoprene rubber (BIIR)/polypropylene (PP)
- Effect of bonding time on the microstructure and mechanical properties of graphite/Cu-bonded joints
- Study on underwater vibro-acoustic characteristics of carbon/glass hybrid composite laminates
- A numerical study on the low-velocity impact behavior of the Twaron® fabric subjected to oblique impact
- Erratum
- Erratum to “Effect of PVA fiber on mechanical properties of fly ash-based geopolymer concrete”
- Topical Issue on Advances in Infrastructure or Construction Materials – Recycled Materials, Wood, and Concrete
- Structural performance of textile reinforced concrete sandwich panels under axial and transverse load
- An overview of bond behavior of recycled coarse aggregate concrete with steel bar
- Development of an innovative composite sandwich matting with GFRP facesheets and wood core
- Relationship between percolation mechanism and pore characteristics of recycled permeable bricks based on X-ray computed tomography
- Feasibility study of cement-stabilized materials using 100% mixed recycled aggregates from perspectives of mechanical properties and microstructure
- Effect of PVA fiber on mechanical properties of fly ash-based geopolymer concrete
- Research on nano-concrete-filled steel tubular columns with end plates after lateral impact
- Dynamic analysis of multilayer-reinforced concrete frame structures based on NewMark-β method
- Experimental study on mechanical properties and microstructures of steel fiber-reinforced fly ash-metakaolin geopolymer-recycled concrete
- Fractal characteristic of recycled aggregate and its influence on physical property of recycled aggregate concrete
- Properties of wood-based composites manufactured from densified beech wood in viscoelastic and plastic region of the force-deflection diagram (FDD)
- Durability of geopolymers and geopolymer concretes: A review
- Research progress on mechanical properties of geopolymer recycled aggregate concrete