Machine-learning-assisted microstructure–property linkages of carbon nanotube-reinforced aluminum matrix nanocomposites produced by laser powder bed fusion
-
Tianyu Yu
 ,
Xuandong Mo
,
Xuandong Mo

Abstract
In this study, the cellular microstructural features in a subgrain size of carbon nanotube (CNT)-reinforced aluminum matrix nanocomposites produced by laser powder bed fusion (LPBF) (a size range between 0.5–1 μm) were quantitatively extracted and calculated from scanning electron microscopy images by applying a cell segmentation method and various image analysis techniques. Over 80 geometric features for each cellular cell were extracted and statistically analyzed using machine learning techniques to explore the structure–property linkages of carbon nanotube reinforced AlSi10Mg nanocomposites. Predictive models for hardness and relative mass density were established using these subgrain cellular microstructural features. Data dimension reduction using principal component analysis was conducted to reduce the feature number to 3. The results showed that even AlSi10Mg nanocomposite specimens produced using different laser parameters exhibited similar Al–Si eutectic microstructures, displaying a large difference in their mechanical properties including hardness and relative mass density due to cellular structure variance. For hardness prediction, the Extra Tress regression models showed a relative error of 2.47% for prediction accuracies. For the relative mass density prediction, the Decision Tress regression models showed a relative error of 1.42% for prediction accuracies. The results demonstrate that the developed models deliver satisfactory performance for hardness and relative mass density prediction of AlSi10Mg nanocomposites. The framework established in this study can be applied to the LPBF process optimization and mechanical properties manipulation of AlSi10Mg-based alloys and other additive manufacturing newly designed alloys or composites.
1 Introduction
AlSi10Mg as a near eutectic Al–Si alloy is one of the most popular aluminum that has been investigated in laser powder bed fusion (LPBF) [1,2,3,4,5]. AlSi10Mg is a typical casting alloy for thin walls and other complex geometries with superior properties such as high strength, hardness, and good dynamic properties subject to high loads. AlSi10Mg parts can be post-processed such as machining, spark-eroding, welding, shot-peening coating and polishing to meet certain requirements [1,2,3,4,5]. The LPBF of AlSi10Mg can produce small equiaxed grains with a fine pseudoeutectic cellular microstructure due to rapid cooling-induced recrystallization. For a larger AlSi10Mg melt pool, elongated columnar grains were formed [6]. Corse zones can be formed by reheating the base metal to a semi-solid state when the temperature of the alloy is at the mushy zone [7]. The unique near eutectic Al–Si microstructure of the alloy provides its unique properties. The relation between the microstructure and mechanical properties is yet to be determined.
For LBPF fabrication of alloys, a porosity-free highly dense material is usually obtained by tuning prominent process parameters (e.g., laser power and scan speed), which usually generates a high micro-hardness. Surface roughness is also a consideration and the origin of the vertical roughness in LPBF AlSi10Mg alloy components was investigated [8]. It was found that a contour-first strategy renders a lower vertical roughness compared to a bulk-first strategy. A relatively high level of track energy density should be used on the contours for a smooth surface. Roth et al. [9] compared plastic and fracture behavior of cast and LPBF-produced AlSi10Mg samples. About 10% higher yield strength and a 20% higher ultimate tensile strength for the LPBF-produced AlSi10Mg were found compared with cast samples. The LPBF-produced alloy contains much smaller and more ellipsoidal voids with an average radius of 10.7 μm. Laursen et al. [10] related porosity of LPBF-produced AlSi10Mg samples to their ductility, yield strength, ultimate tensile strength, and modulus using linear fit, defect susceptibility method and critical local strain method. They found that porosity and ductility are closely related. This study indicates that LPBF-produced macro properties of AlSi10Mg samples such as porosity and roughness could not be solely used to determine their mechanical properties such as yield strength, ultimate tensile strength and hardness. Other microstructure indicators should be explored regarding the microstructure–property linkages. The subgrain size cellular structure was found related to the mechanical behavior of AlSi10Mg. The fine cellular-dendritic solidification structure variance influences the hardness of the specimen and can be tuned using different energy inputs and heat treatment [11]. Liu et al. [12] defined two new morphology indices, named dimensional-scale index and the shape index, from scanning electron microscopy images, relating the subgrain size cellular structure of AlSi10Mg to their mechanical properties. They found that the subgrain cell size and cell boundary morphology of the LPBF-fabricated AlSi10Mg strongly alternated their mechanical properties. However, a higher resolution of the subgrain cellular structure representation has not been investigated. Metal matrix composites show superior dynamic behavior and mechanical properties with the addition of reinforcing phase [13,14]. Yu et al. [15] found that micro/nano metal matrix composites fabricated using LPBF can provide unique properties over nonreinforced material.
Machine learning as a powerful tool for data-driven modeling has been studied broadly on the process and quality control of smart manufacturing, as well as in performance prediction for additive manufacturing. For example, Zhang et al. [16] used extreme gradient boosting and long short-term memory (LSTM) to predict the melt pool temperature in directed energy deposition. It was found that the performance of LSTM is better than extreme gradient boosting where the temperature fluctuations are small. The computational efficiency of LSTM is found much lower than XGBoost. A hybrid Bayesian network has been used to predict the selective laser melting produced 316 L part quality [17]. It was found that after training just four parts from a machine that was not represented in the training data, the predicted mean hardness was within 0.41 predicted standard deviations of the true value, which shows a high prediction accuracy. A significant amount of training data in SLM is required for incorporating more process parameters in the prediction. Wang and Adachi [18] investigated MIPHA and rMIPHA machine learning tools for analyzing steel properties based on 2D/3D microstructural features such as area fraction, circularity, solidity, ferret’s diameter/angle, count fraction, volume fraction, surface area, Gauss curvature, ferret’s diameter, sphericity, genus, etc. The microstructures corresponding to a target stress–strain curve, target tensile strength and total elongation were inversely explored by MIPHA successfully. Fan et al. [19] described the complex amorphous structure of metallic glass using a single flexibility-orientated structural quantity, coupled with the pair distribution function of individual atoms through a weighting function. Structure–property correlations are demonstrated including vibrational, diffusional, as well as elastic and plastic relaxation responses. However, high-fidelity data-driven modeling for microstructure–mechanical property linkages of LPBF-produced AlSi10Mg-based composites is yet to be developed.
This study aims to fill the research gap on the subgrain microstructure and mechanical properties linkages of LPBF-produced AlSi10Mg nanocomposites. The effect of laser parameters (laser power and scanning speed) on the produced melt pool morphology and subgrain texture are investigated. The laser parameters influence the porosity formation, as well as the microstructure of the nanocomposites. Machine-learning-based prediction on mechanical properties of AlSi10Mg nanocomposites using microstructural texture features was investigated. This article focuses on developing a characterization and calculation framework for linking microstructural texture variance produced by different laser parameters to the variance of hardness and relative mass density of CNTs/AlSi10Mg nanocomposites. The developed model can be used for material design or process optimization. Principal component analysis was used to assist in detecting the fine microstructure of the nanocomposites and could be modified for other alloys in the future. It shed light on relating the subgrain cellular microstructure of LPBF-produced CNT-reinforced aluminum matrix nanocomposites due to rapid cooling to their mechanical properties.
2 Material and methodology
2.1 Material and the LPBF process
Commercial gas atomized AlSi10Mg powder (a particle size ranges from 25 to 112 μm) and multiwalled carbon nanotubes (MWCNTs with an outer diameter of 3–15 nm, a length of 15–30 μm) without any surface treatment were used as raw materials for carbon nanotube (CNT)-reinforced aluminum matrix nanocomposites (MWCNTs with a mass fraction of 0.5 wt%). An XQM-4 planetary ball milling machine (Changsha Tianchuang Powder Tech Co., China) was used to homogenously deposit MWCNTs on the surfaces of AlSi10Mg powders. The powder mixture was sealed in stainless steel bowls with a steel ball-to-powder ratio of 1:1. The rotation speed was set at 200 rpm with a total milling time of 4 h. After each 15 min of milling, a 5 min rest was set to avoid overheating of the powder mixture. The milled powder was dried in a vacuum chamber for 4 h at a temperature of 80°C and sealed in an aluminum bottle.
The LPBF process was conducted on a commercial SLM system (FS271, Farsoon Tech, Changsha, China) with a 275 mm × 275 mm × 340 mm build volume, consisting of an MFSC-500W ytterbium fiber laser with a maximum power of ∼500 W, a spot size of ∼90 μm and a continuous wavelength of 1,080 nm. A total of 16 samples fabricated using different scan speeds (1.8–2.4 m/s) and laser powers (350–450 W) were analyzed in this study as shown in Table 1. The detailed material characterization and mechanical testing results of the CNTs/AlSi10Mg nanocomposites were reported elsewhere [20]. Our previous study found that the addition of CNTs can enhance the mechanical properties (e.g., more than 10% yield strength increase) of the nanocomposites compared with AlSi10Mg without the CNT reinforce.
Laser parameters, measured hardness, and relative density of CNT-reinforced aluminum matrix nanocomposites fabricated by the LPBF process
| Sample number | Laser power (W) | Laser scan speed (m/s) | Hardness (HV) | Relative density (%) |
|---|---|---|---|---|
| 1 | 450 | 2.4 | 126.70 | 96.19 |
| 2 | 450 | 2.2 | 123.23 | 97.94 |
| 3 | 450 | 2.0 | 124.29 | 99.19 |
| 4 | 450 | 1.8 | 123.52 | 98.29 |
| 5 | 416.6 | 2.4 | 118.89 | 95.68 |
| 6 | 416.6 | 2.2 | 121.88 | 96.46 |
| 7 | 416.6 | 2.0 | 122.11 | 98.02 |
| 8 | 416.6 | 1.8 | 122.24 | 97.63 |
| 9 | 383.3 | 2.4 | 96.51 | 93.83 |
| 10 | 383.3 | 2.2 | 102.77 | 95.92 |
| 11 | 383.3 | 2.0 | 121.01 | 98.54 |
| 12 | 383.3 | 1.8 | 122.08 | 98.47 |
| 13 | 350 | 2.4 | 99.52 | 92.02 |
| 14 | 350 | 2.2 | 119.97 | 93.22 |
| 15 | 350 | 2.0 | 122.56 | 96.17 |
| 16 | 350 | 1.8 | 119.07 | 94.71 |
This article aims to build a high fidelity experimental-computational framework for subgrain cellular structure characterization of the CNTs/AlSi10Mg nanocomposites, relating the subgrain microstructure with their mechanical properties in a feature dimension of sub-micrometer to several micrometers.
The relative density of the CNTs/AlSi10Mg nanocomposites is measured using the Archimedes density principle. In addition, the areal density and void identification of micropores were measured using optical images and processed using the algorithm in ImageJ. These two density methods have similar measured values for different samples. Hardness tests were conducted using a Vickers hardness tester (HVS-30, Shanghai Testermachine Co., China) operated at a load of 10 kg and a duration of 5 s. The scanning electron microscopes (SEMs) used in this study are the Zeiss Evo 25 and Phenom ProX (Eindhoven, Netherlands). The SEM images of the subgrain cellular microstructure were taken in 13,000× and 26,000× magnitude. The sample microstructures and melt pool morphology were characterized by optical microscopy (Keyence VH-1000).
2.2 Cellular structure image processing scheme
Different melt pool microstructures of about several hundred micrometers size of the as-built CNTs/AlSi10Mg nanocomposites are shown in Figure 1. Figure 1(a) shows the melt pool morphology of the sample top surface with a nearly 45° texture along with the laser scan pattern. Figure 1(b) shows the melt pool morphology of the sample cross-section, showing melt layers formed along the build direction with no apparent micropores or defects. For the top surface melt pool morphology, the melt pool overlaps with each other, making it difficult to quantitively distinguish the melt pool morphology of different laser parameters (e.g., laser power and scanning speed). The nonuniformity of the macro-scale melt pool microstructure may consist of micro-pores as well observed from our previous study, making it further impossible for relating the melt pool morphology to their mechanical properties such as hardness and relative density.
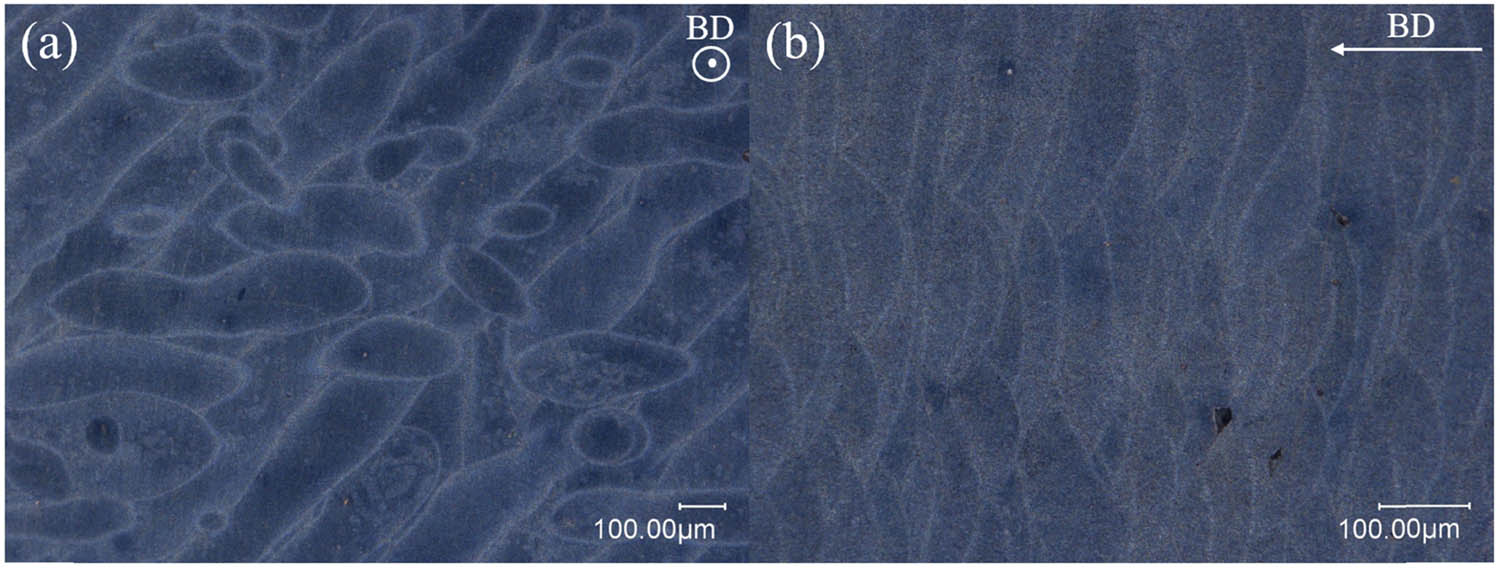
Microscopy of CNTs/AlSi10Mg nanocomposites (the highly dense sample no. 3 with a relative density of 99.3%) showing melt pool morphology: (a) dark field microscopy of the top surface and (b) the cross-section showing melt layers along the build direction with no apparent micropores or defects.
To address the issue of correlating the microstructure to mechanical properties, SEM images of the CNTs/AlSi10Mg nanocomposite specimens were processed and characterized to expose their subgrain cellular eutectic structure as shown in Figure 2. The subgrain structure of CNTs/AlSi10Mg nanocomposites exhibits a eutectic and subcellular Al–Si microstructure in a plane perpendicular to the build direction. It can be seen that for sample no.s 1 and 15, laser parameters have a significant effect on the geometry and size of the subgrain cellular microstructure. Most subcells in the fine region have a size range within 0.5–1 μm, while the cell size in the coarse region is about 1–2 μm. α-Al matrix (dark color) is surrounded by a network of Si precipitates (white color) for the fine subgrain region. Discontinuous Si precipitates can be seen in the heat-affected zone (HAZ). The majority phase is fine subgrain instead of the HAZ/coarse subgrain region. Thus, this study is focused on investigating the effect of fine subgrain texture features on the hardness and relative density of CNTs/AlSi10Mg nanocomposites. A total of 96 SEM images of the fine cellular structure were used in this study with six images of each sample. More than 2,000 cells can be detected for each image, so in this study, six images for each sample are assumed adequate to represent the geometry characteristics in the fine cellular zone.
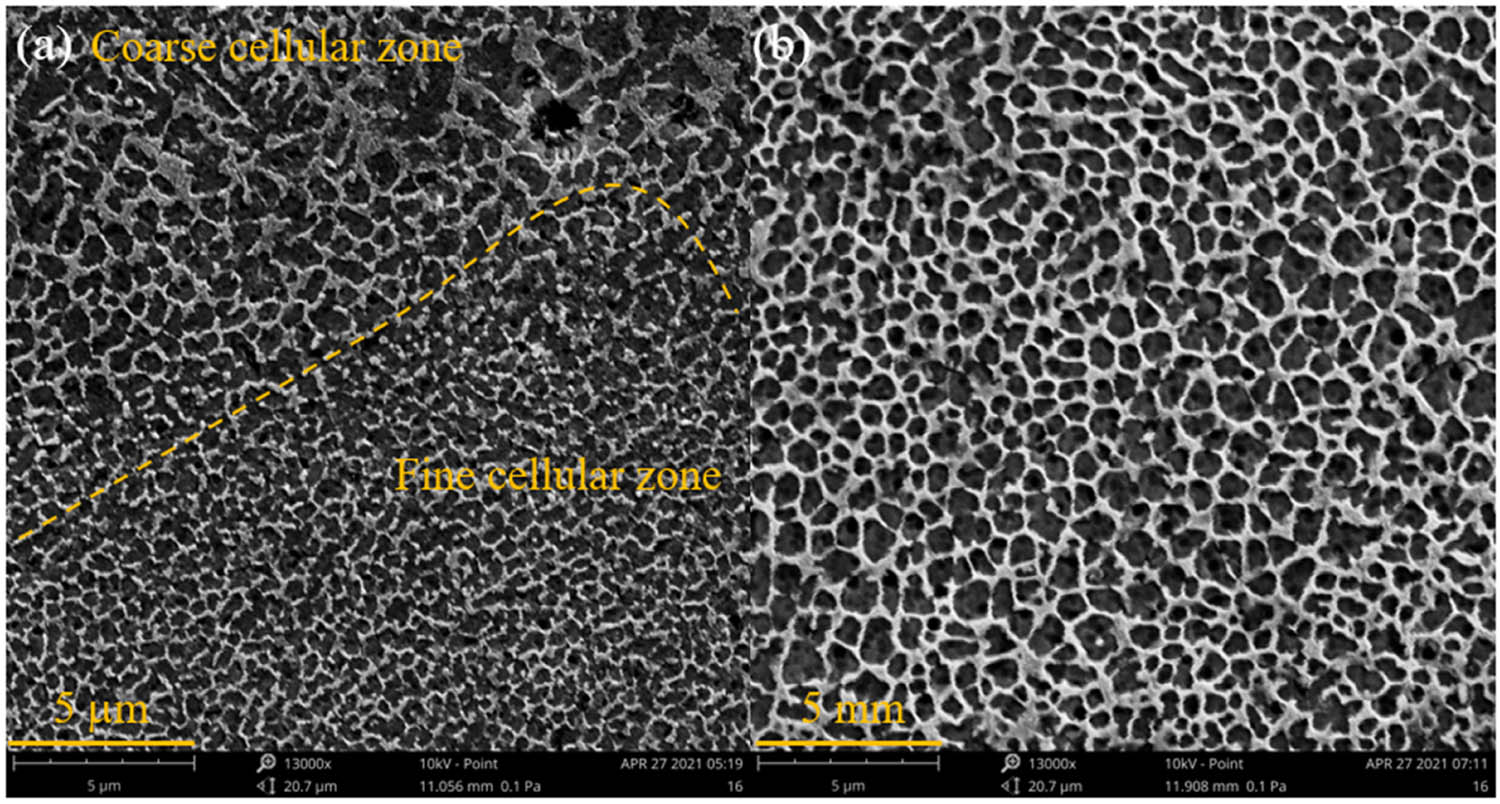
The subgrain textures of CNTs/AlSi10Mg nanocomposites exhibit a eutectic and subcellular Al–Si microstructure in a plane perpendicular to the build direction for (a) sample no. 1 with a laser power of 450 W and a laser scan speed of 2.4 m/s showing fine and coarse cellular microstructure, and (b) sample no. 15 with a laser power of 350 W and a laser scan speed of 2.0 m/s showing a nonuniform fine cell distribution.
The mechanical properties of the nanocomposites such as surface hardness are related to both bulk properties such as porosity, as well as their unique Al–Si eutectic microstructure. To separate each cell and get their geometric features in an SEM image, cell segmentation software CellProfiler 4.1.3 [21] was used. Several image processing steps were taken to get high-quality cell segmentation features as shown in Figure 3(d):
the original SEM image has been black/white-inversed into a gray image to have a better color contrast;
the cell nuclei size is set to a range of 0.15–0.4 μm and then Otsu thresholds [22,23] were used to detect the nuclei of each cellular structure in an SEM image. The Otsu approach is used to calculate and establish optimum threshold separating two classes of pixels (foreground and background) by minimizing the variance within each class by Eq. (1),
(1)where
Based on the nuclei information generated for each cellular structure, the cell geometry and coordination were calculated and are shown in Figure 3(d). The propagation method is used to delineate the boundary between neighboring cells. The minimum cross-entropy is calculated between the foreground and background distributions (Eq. (2)) and the lowest cross-entropy value is chosen as the final threshold:
(2)where
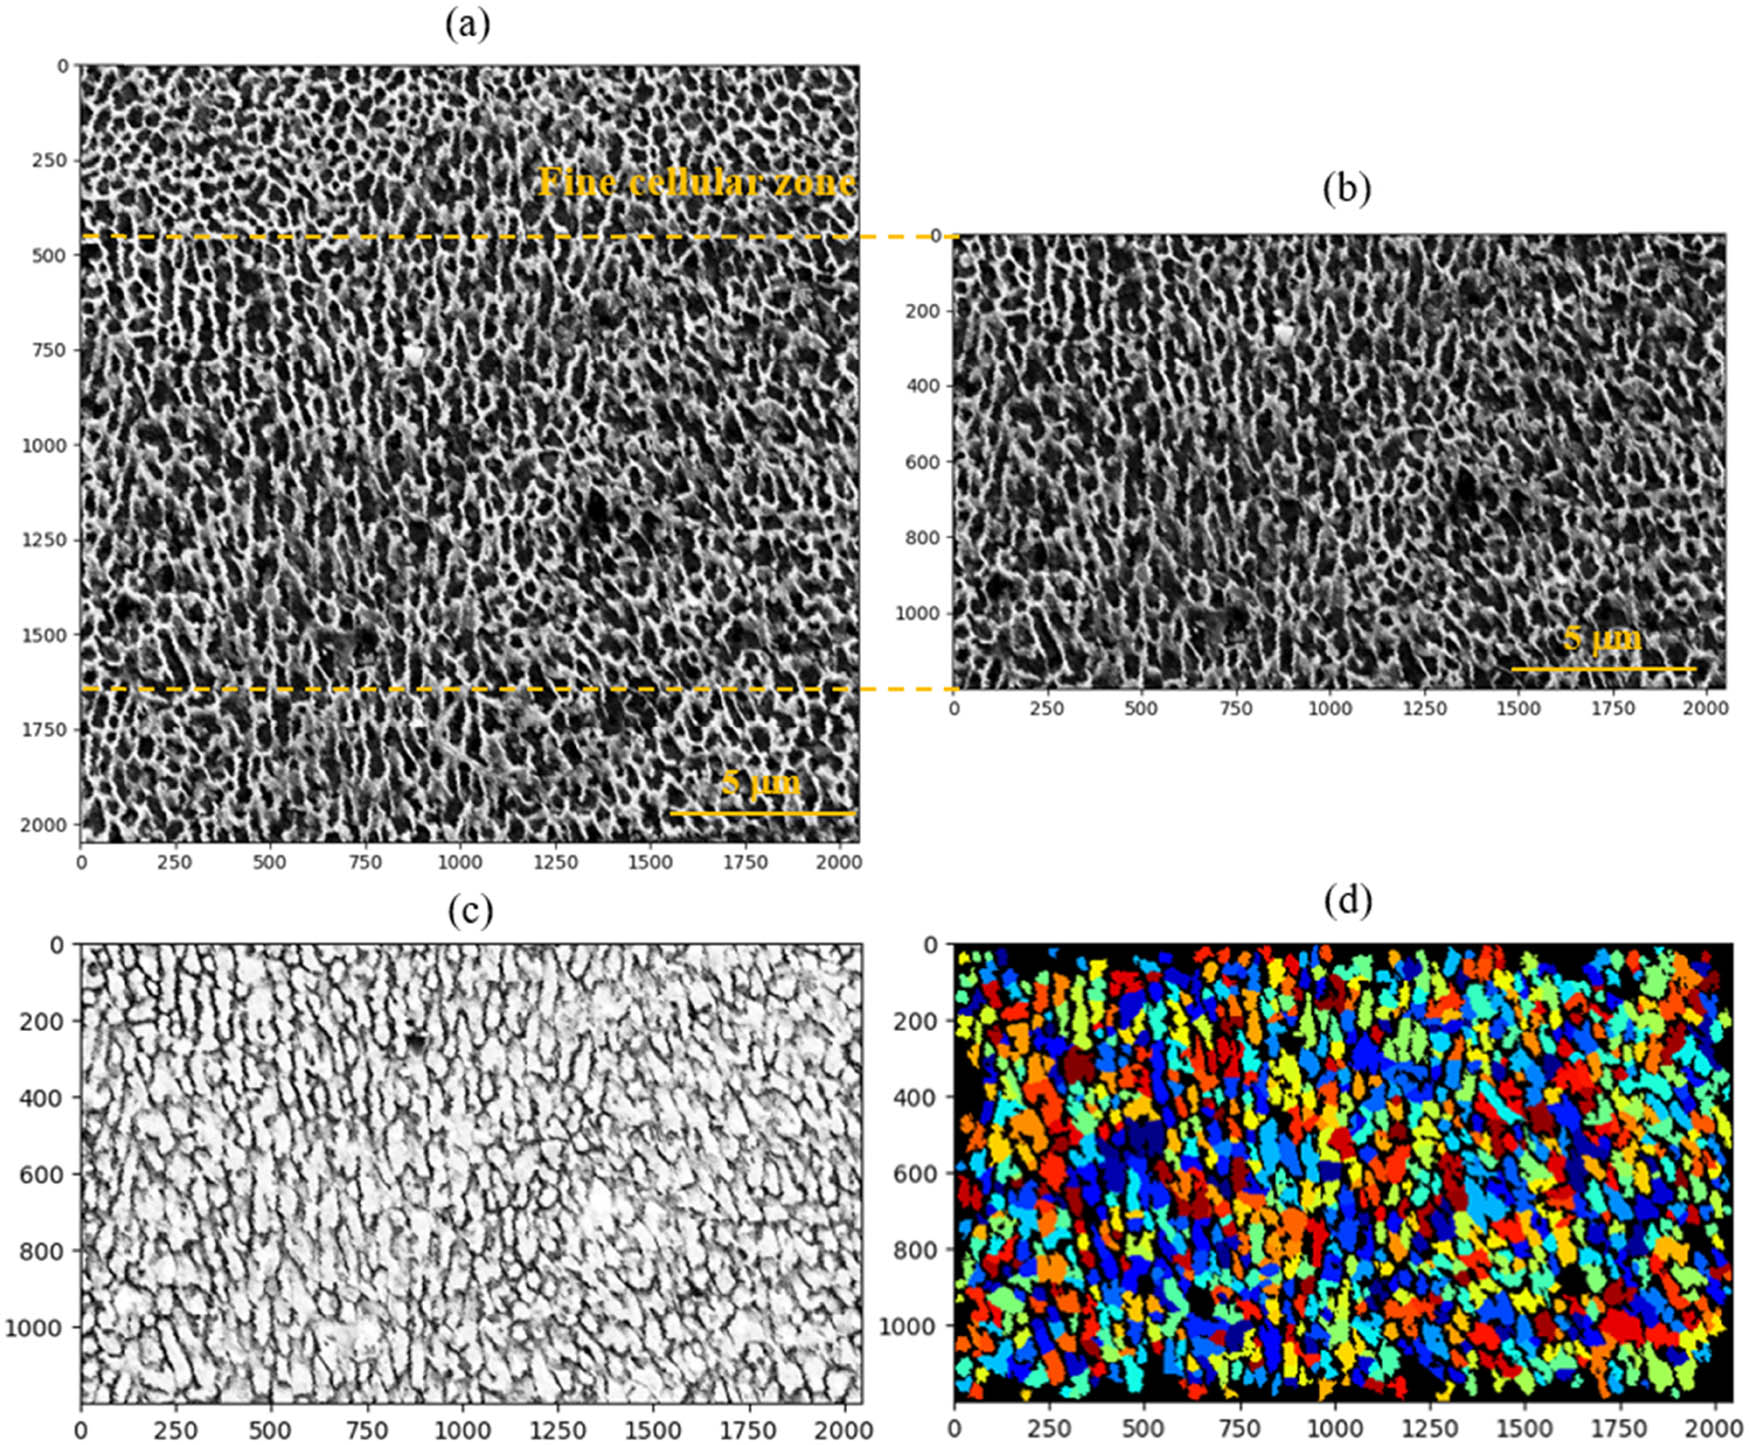
For example, 2,466 cells were detected in Figure 3(a). The cell geometry characteristics were calculated for each cell. A total of 83 coordinate-independent features were extracted and calculated for each cell. Among all features used in this study, several key features are described as follows:
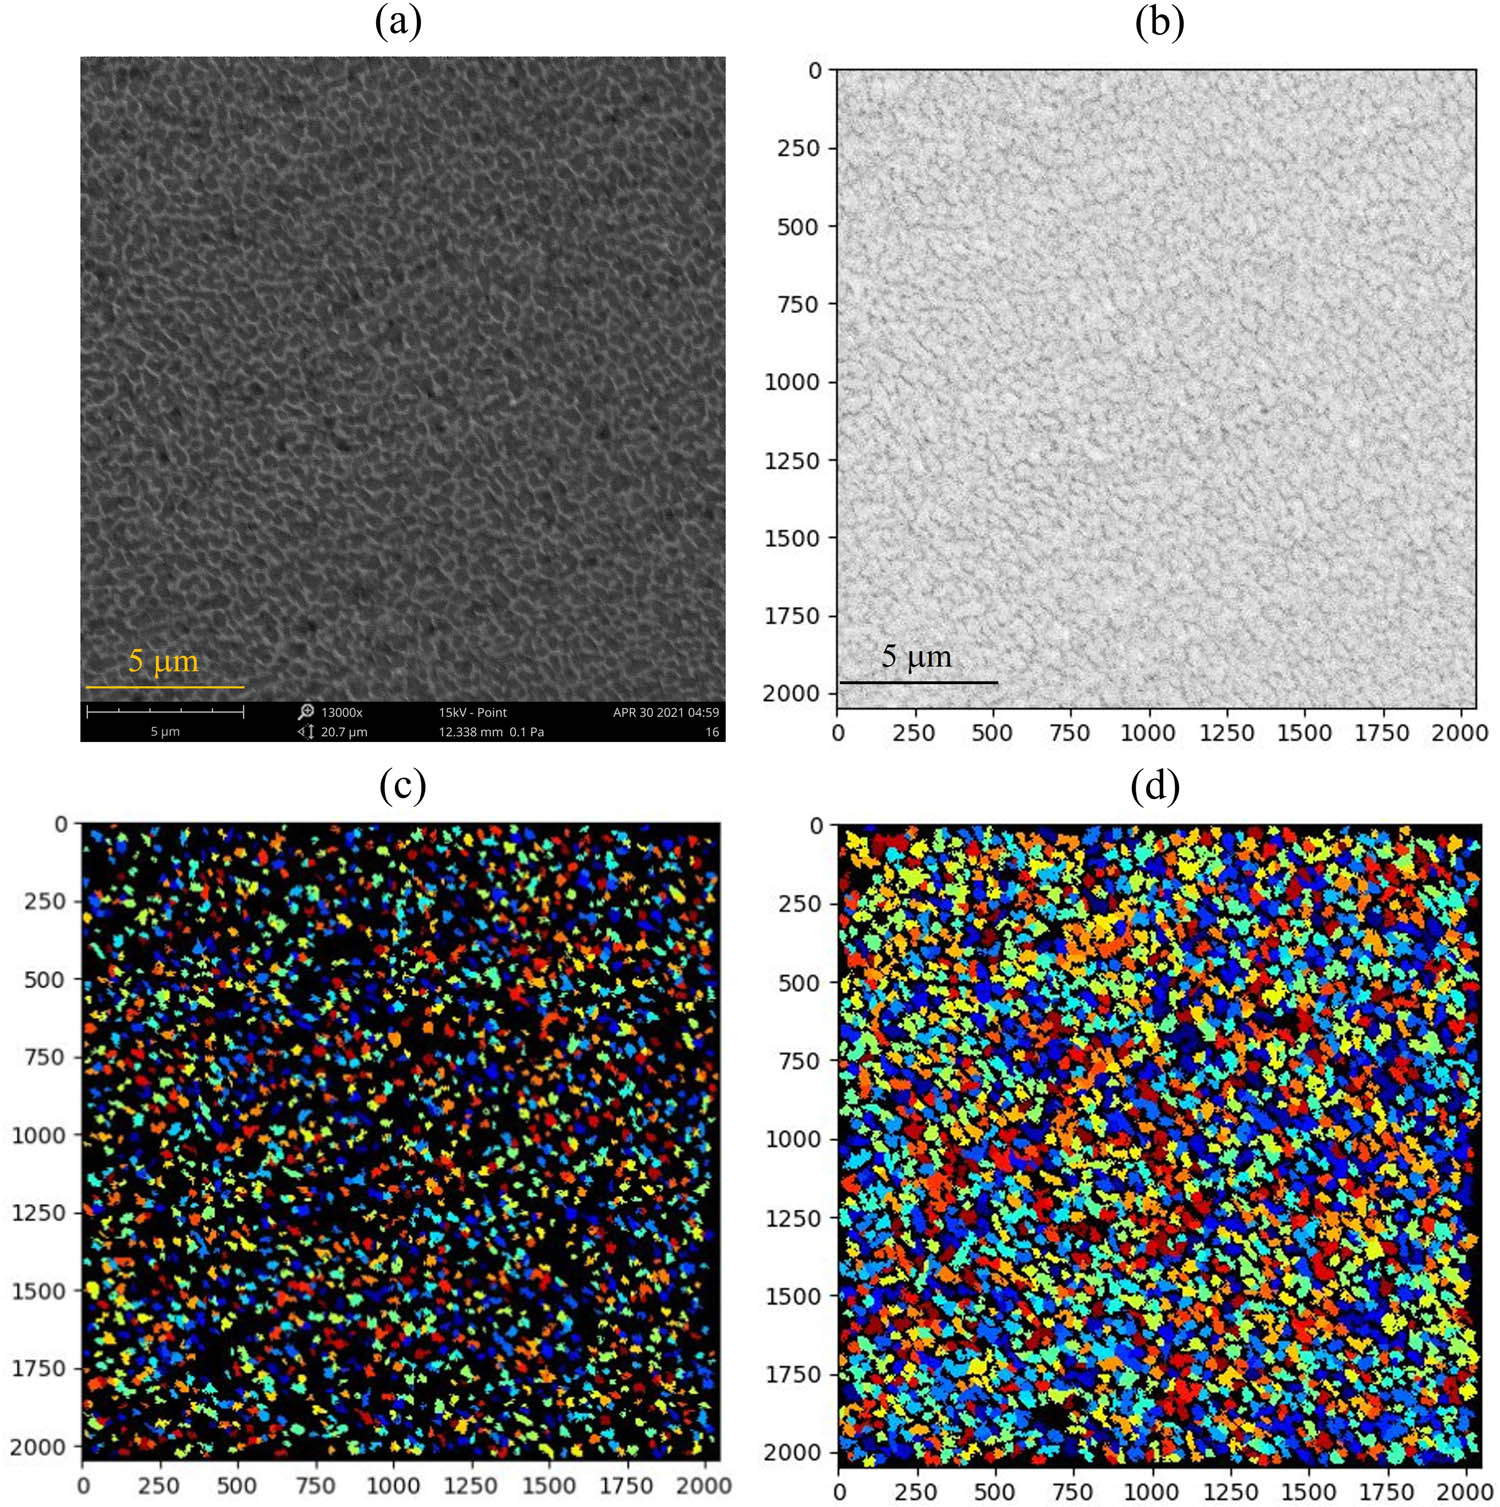
Fine cellular zone cell detection of sample no. 13 of CNTs/AlSi10Mg nanocomposites: (a) the original SEM image of the fine cellular zone in CNTs/AlSi10Mg nanocomposites, (b) the inversed gray image, (c) a cell nuclei map generated from the inversed gray image, and (d) a cell segmentation map showing high fidelity representation of the cell shape and size of the fine cellular zone.
Perimeter is the length around the boundary of each cell. Eccentricity is the ratio of the distance between the focus points of the ellipse and its major axis length. The value is between 0 and 1 (a circle’s eccentricity is 0, while an ellipse with an eccentricity of 1 is a line segment). FormFactor is defined as 4 * π * area/perimeter2 and the FormFactor of a perfectly circular object is equal to 1. Extent is the proportion of the area in the bounding box that is also in the cell. Solidity is the proportion of the area in the convex hull that is also in the cell. Compactness is the mean squared distance of the cell’s pixels from the centroid divided by the area. A filled circle has a compactness of 1. The cells with holes or irregular shapes have a value greater than 1. MeanRadius is the mean distance of any pixel in the object to the closest pixel outside of the cell. Several moments were used to accurately describe the shape and geometry of a cell. For Zernike moments [24], the center of mass for each cell was firstly calculated and a circle is defined. The Zernike moments Z nl for a cell was calculated using
where
where
In this study, Zernike polynomials from order 0 to order 9 were calculated and a total of 30 features were calculated. The other moment features are briefly introduced here. Spatial moment features represent a series of weighted averages of shape, size, rotation and location of cells. Central moment features are normalized to the cell’s centroid and therefore not influenced by a cell’s location within an image. Normalized moment features are further normalized to be scale-invariant and therefore not influenced by a cell’s size within an image. Hu moment features are a set of cell moment features that are not altered by the cell’s location, size or rotation. Different moments primarily describe the shape of a cell.
The schematic of the proposed cell segmentation and machine-learning assisted microstructure–property linkage framework pipeline for LBPF produced CNTs/AlSi10Mg nanocomposites are shown in Figure 4. The scope of the SEM image processing and cell segmentation is to assess the microstructure cellular distribution of the Si-rich phase and α-Al phase. For the images in which the Si-rich phase is discontinuous, dash dots were connected to form complete cells. The pixels inside a cell can be considered as the α-Al phase and the perimeter can be considered as the Si-rich phase. Then, morphological features for each cellular cell were extracted and calculated, presenting the information of both the Si-rich phase and α-Al phase. As shown in the training phase, 76 randomly selected SEM images were used as the training set. The rest 20 samples were used as the test set. Machine learning algorithms AdaBoost, gradient tree boosting, K-nearest neighbors, decision tree, and extra trees regressors were used to relate the subgrain cellular structure to the mechanical properties of CNTs/AlSi10Mg nanocomposites.
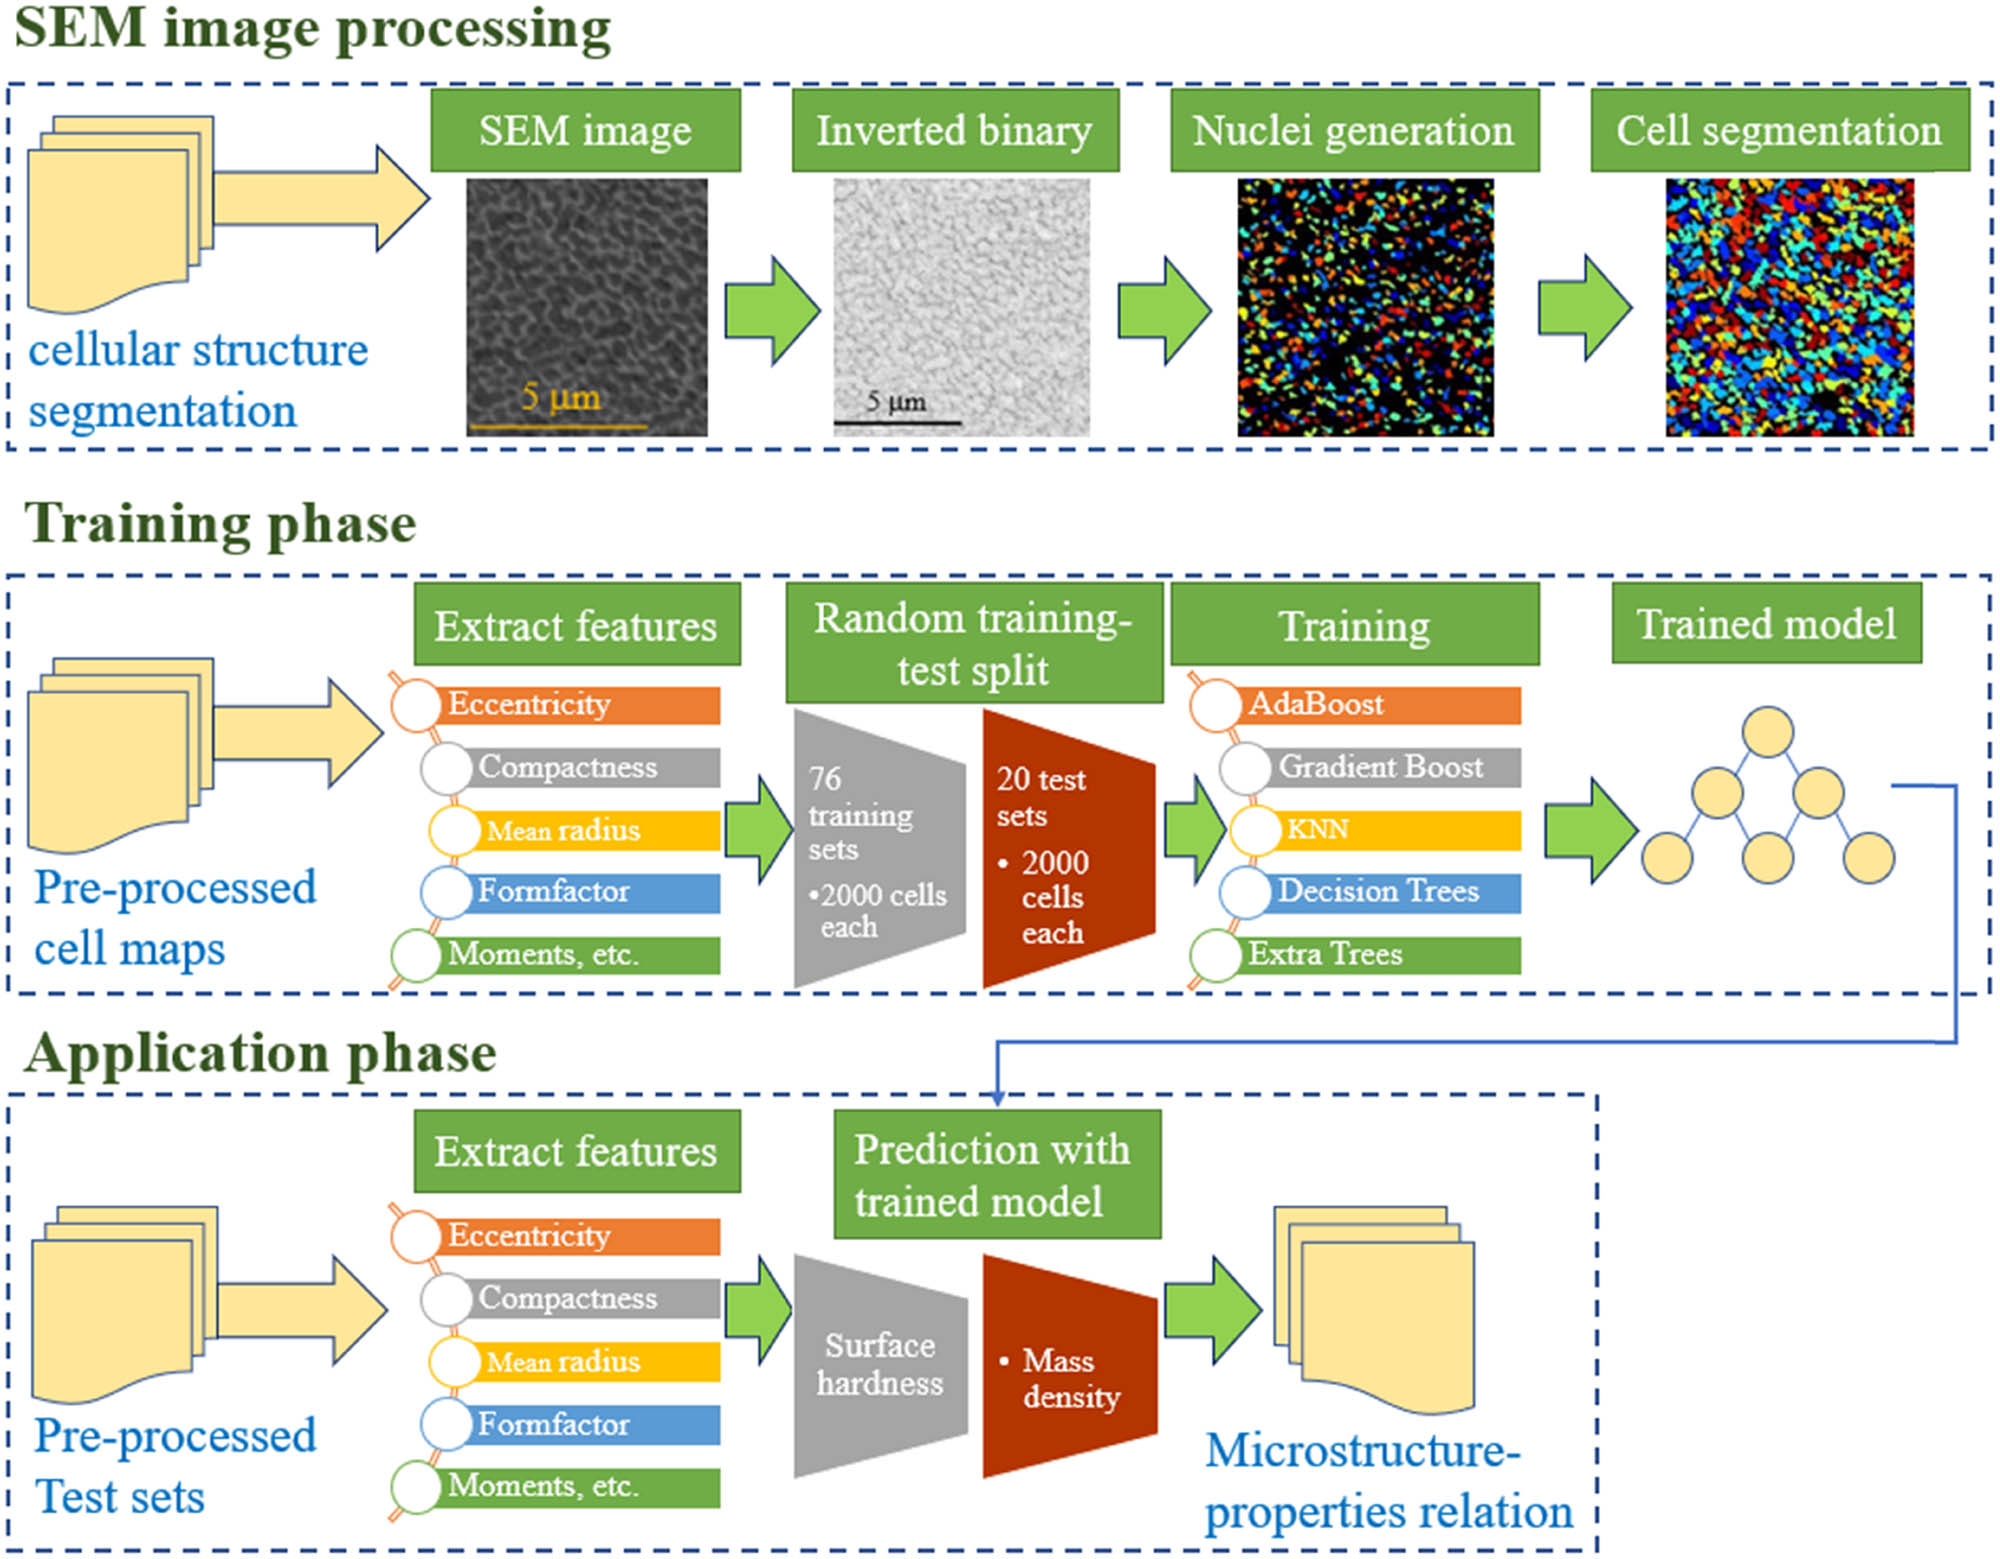
Schematic of the proposed processing framework pipeline for LBPF produced AlSi10Mg nanocomposites microstructure–properties linkages.
2.3 Machine learning methods
To measure the performance of a machine learning regressor, the root-mean-square error (RMSE) shown in Eq. (5) was used as the performance metric. The RMSE is more sensitive to outliers than the square root of the mean-squared error (MSE) since the effect of each error on RMSE is proportional to the size of the squared error [25]. Relative errors are also calculated:
where
The feature value was mean normalized by using
where average(X) is the average value of X, and stdev(X) is the standard deviation of X.
Different machine learning regressors were used in this study. AdaBoost is a meta-estimator that fits a regressor on the input dataset and then fits additional copies of the regressor on the same dataset but adjusted the weights of instances according to the error of prediction [26]. Gradient Tree Boosting builds an additive model in a forward stage-wise way [27]. It allows the optimization of arbitrary differentiable loss functions. In each stage, a regression tree is fit on the negative gradient of A given the loss function. KNN is an instance-based method, which uses the input consisting of the k closest training examples in the data set and the output is the property value for the object. The prediction value is the average of the values of k nearest neighbors [28]. Given the input data x and a number of K, the prediction value can be calculated as
A typical form of approximation by Extra Trees is shown as [30]:
where N is the sample size, I(i
1,…, i
n
)(x) is the characteristic function of the hyper-interval, and the real-valued parameters
In addition to the original features, principal component analysis [31] is also used in this study for dimensionality reduction by projecting each feature onto several principal components to obtain lower-dimensional features while preserving as much of the data’s variation as possible. It is mainly used to explore the internal relationships between large amounts of data. The main principle of the PCA method is to select K (where K is 3 in this study and indicates that data dimensions have been selected) units of orthogonal basis. After the original data is transformed to these three sets of bases, the covariance between each pair of features is set to zero, and the variance between features is as large as possible. In this new space, the information represented by the dimensionality reduction data (three new features) can be used to replace the message of a large amount of data (83 features) in the original space.
3 Results and discussion
3.1 Nanocomposites and cellular structure characterization
After ball milling, CNTs are deposited onto the surface of AlSi10Mg powders. Figure 5 shows the elemental distribution mapping of the ball-milled nanocomposites powder surface with 67.8 wt% aluminum, 25.3 wt% carbon, 6.6 wt% silicon and 0.34 wt% magnesium. The carbon element map reveals a uniform and homogeneous distribution of CNTs on the AlSi10Mg powder surfaces after ball milling, which is a prerequisite for SLM of homogeneous and densification of CNTs/AlSi10Mg nanocomposites.
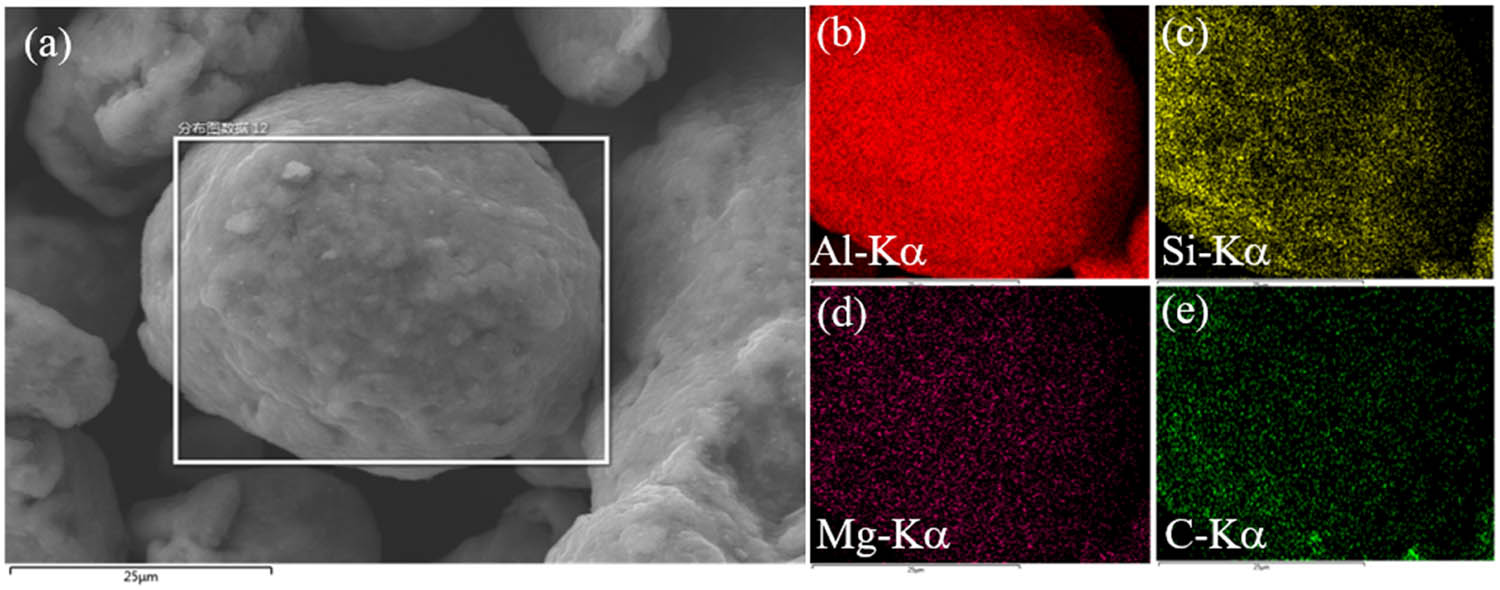
(a) SEM image of the ball-milled CNTs/AlSi10Mg nanocomposite powders with 0.5 wt% CNTs. EDS mapping showing the elemental distribution and concentration of (b) Al, (c) Si, (d) Mg and (e) C on the particle surface.
Three LPBF-produced tensile samples of CNTs/AlSi10Mg nanocomposites are shown in Figure 6(b). A typical yield strength of 380 ± 14 was achieved. A detailed tensile tests analysis is out of the scope of this study and will be reported elsewhere. In order to reveal the melt pool morphology, the fractured nanocomposites samples were etched. A Keller solution containing 2.5 mL of HNO3, 1.5 mL of HCl, 1.0 mL of HF and 95 mL of deionized water was used as an etching agent. Figure 7 shows the crack fronts with respect to the melt pool structure. The melt pool was stretched, showing the structure with a high aspect ratio near the crack front. The CNT phase in the nanocomposites can be also observed. Figure 7(a) and (b) shows the crack propagation path deviations triggered by melt pool boundaries and elongated melt pool structure. Liu et al. [12] found that when a crack is confined to the melt pool core regions, the cellular structure provides the main resistance to crack growth. It again suggests the correlation between the subgrain size cellular structure to the mechanical properties of the AlSi10Mg-based composites. Figure 8 shows the tensile specimen fractographs of CNTs/AlSi10Mg nanocomposites; ductile fracture with dimple rupture features was observed. The size of the microdimples is about 0.5–2 μm (shown in Figure 8(c)), which is consistent with the fine cellular size in the core melt pool area.
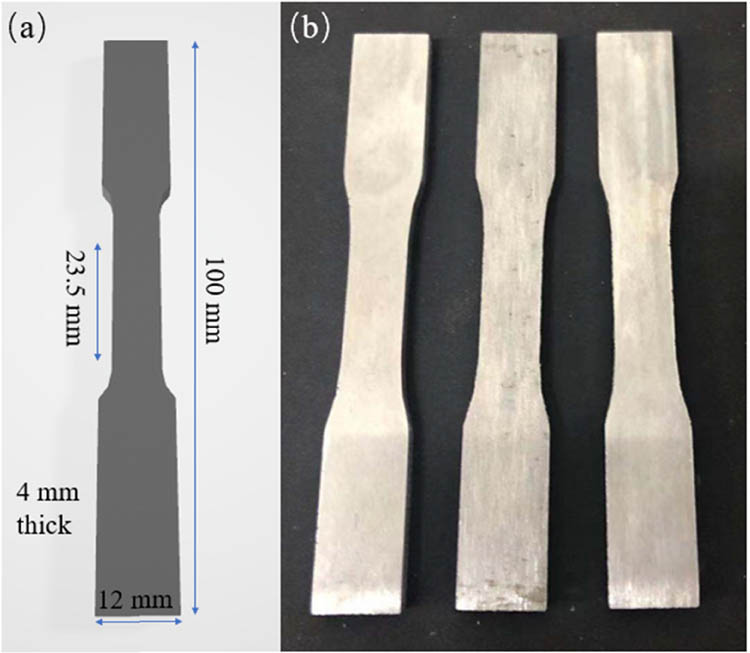
(a) CAD showing tensile bar’s dimension; (b) LPBF-produced CNTs/AlSi10Mg nanocomposites tensile samples after machining.
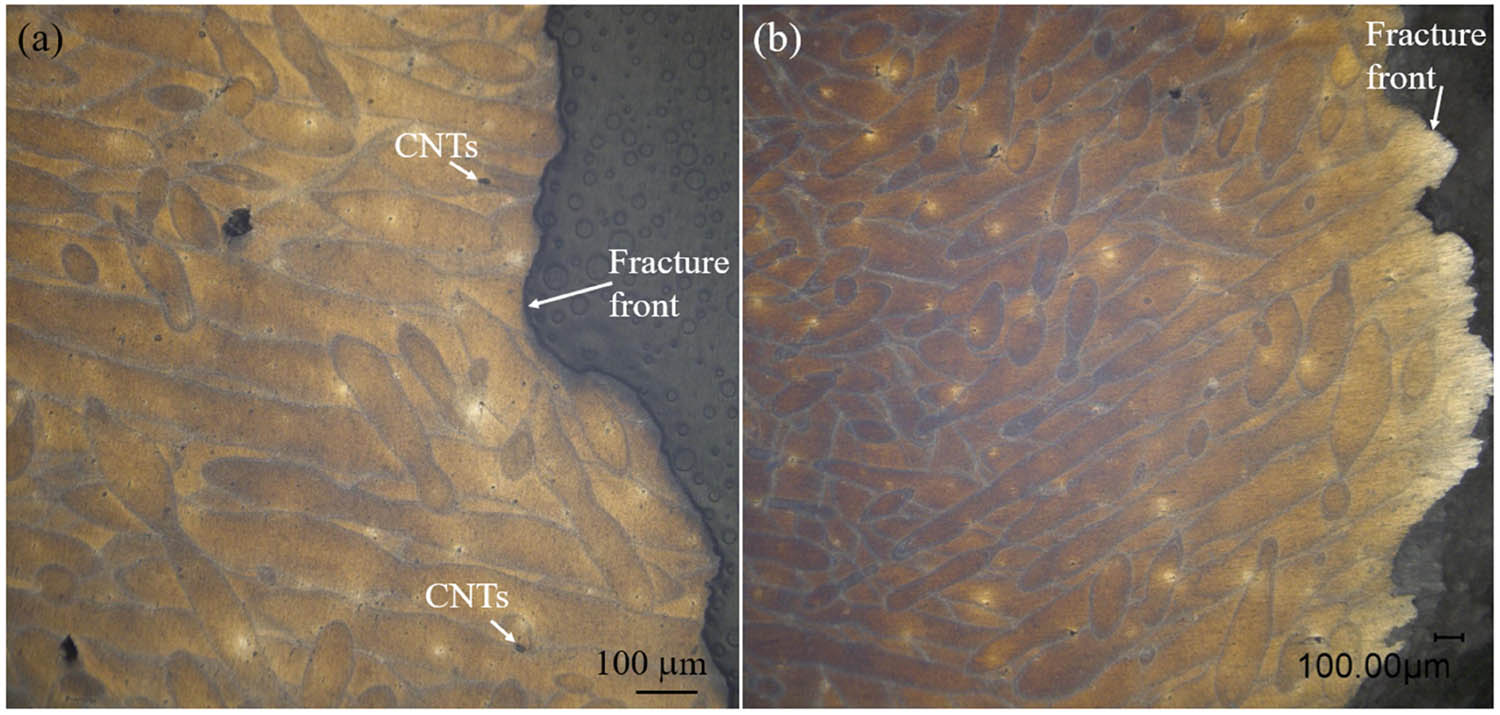
Crack front melt pool morphology of the tensile test specimen showing (a) the crack propagation path deviations triggered by melt pool boundaries and (b) an elongated melt pool structure.
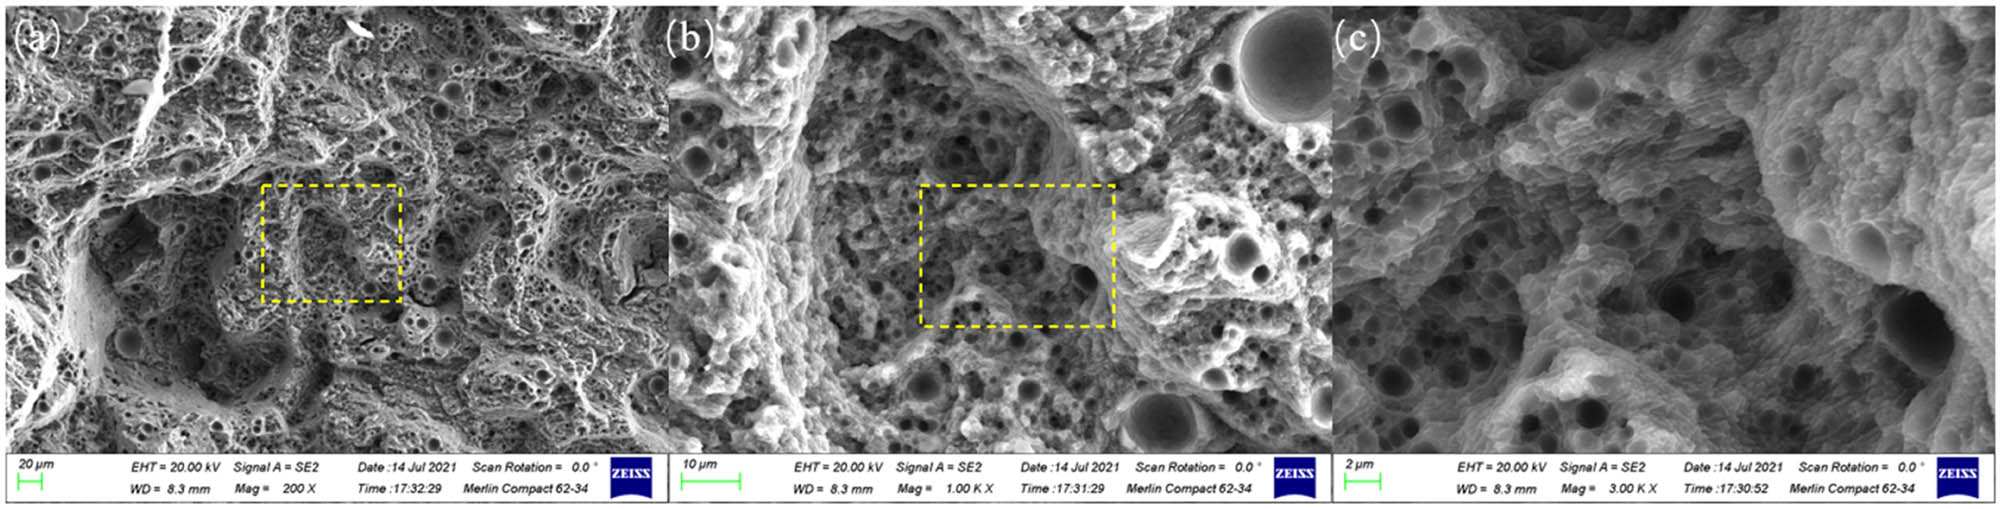
Tensile specimen fractographs of CNTs/AlSi10Mg nanocomposites indicating typical ductile fracture with dimples (a) 200X, (b) 1000X, (c) 3000X.
The unique Al–Si eutectic microstructures of LPBF-produced CNTs/AlSi10Mg nanocomposites exhibited a cellular microstructure as shown in Figure 9(a). Cells in fine and coarse grain/HAZ regions have different shapes and size factors, resulting in a large difference in mechanical properties including hardness and relative mass density of the nanocomposites. The cell segmentation framework was tested on an SEM image of the HAZ coarse cellular zone as shown in Figure 9(b). The HAZ zone, showing a coarse cellular structure, was successfully processed with a high cell segmentation accuracy as shown in Figure 9(d). It can be observed that the cell in the coarse cellular zone has a higher eccentricity value of 0.77 representing elongated cellular grain, a larger cell area value of 16.21 μm2, a longer perimeter of 2.279 μm and major axis length of 0.628 μm, about 30% higher than those of fine cellular zones. The results showed that the framework proposed in this study is robust and could represent the precise shape and size information for both the fine and HAZ coarse cellular zone of CNTs/AlSi10Mg nanocomposites. The corresponding mean feature values are listed in Table 2. However, the majority phase of the CNTs/AlSi10Mg nanocomposites is the fine cellular structure. Thus, in this study, only fine cellular zones are analyzed and related to their mechanical properties such as hardness and relative mass density.
Heat affected zone cellular structure cell detection: (a) subgrain cellular structure of CNTs/AlSi10Mg nanocomposites, (b) the HAZ coarse cellular zone, (c) inversed gray image of the HAZ coarse cellular zone and (d) the HAZ coarse cellular zone cell segmentation shows high fidelity representation of the cell shape and size.
Mean feature values of cells in HAZ and fine cellular zones
| Feature | HAZ zone | Fine cellular zone |
|---|---|---|
| Area (μm2) | 16.21 | 12.54 |
| Perimeter (μm) | 2.279 | 1.875 |
| Major axis length (μm) | 0.628 | 0.521 |
| Minor axis length (μm) | 0.355 | 0.327 |
| Eccentricity | 0.77 | 0.72 |
| Form factor | 0.42 | 0.48 |
| Extent | 0.53 | 0.56 |
| Solidity | 0.78 | 0.82 |
| Compactness | 2.72 | 2.34 |
| Euler number | 0.99 | 0.98 |
3.2 Machine learning-based microstructure–property linkages prediction
AdaBoost, GradientBoost, KNN, decision trees, and Extra Trees were used to predict hardness and relative mass density of the CNTs/AlSi10Mg nanocomposites using 83 features generated from the subgrain cellular cell segmentation framework. The features were normalized to avoid any feature bias. Randomly selected 76 SEM images were used as a training set. The rest 20 SEM images were used as a test set for model performance evaluation.
Feature importance was calculated using AdaBoost, decision tree and Extra Trees regressor (Figure 10). It can be seen that the five most important features for AdaBoost to determine the hardness of the CNTs/AlSi10Mg nanocomposites are Zernike moment 2_0 (9.92%), perimeter (8.48%), eccentricity (7.52%), compactness (6.77%), and maximum radius (5.14%). For decision tree regressor, the five most important features are eccentricity (33.52%), mean radius (28.19%), extent (17.74%), orientation (8.86%) and formfactor (6.34%). For Extra Trees, the 5 most important features are Zernike moment 5_3 (9.92%), Zernike moment 2_0 (9.92%), eccentricity (9.03%), formfactor (7.18%), and compactness (6.42%), showing the aspect ratio of the subgrain cell shape and size are crucial to the mechanical properties of the CNTs/AlSi10Mg nanocomposites. In all cases, eccentricity is one of the key features for the prediction of mechanical properties.
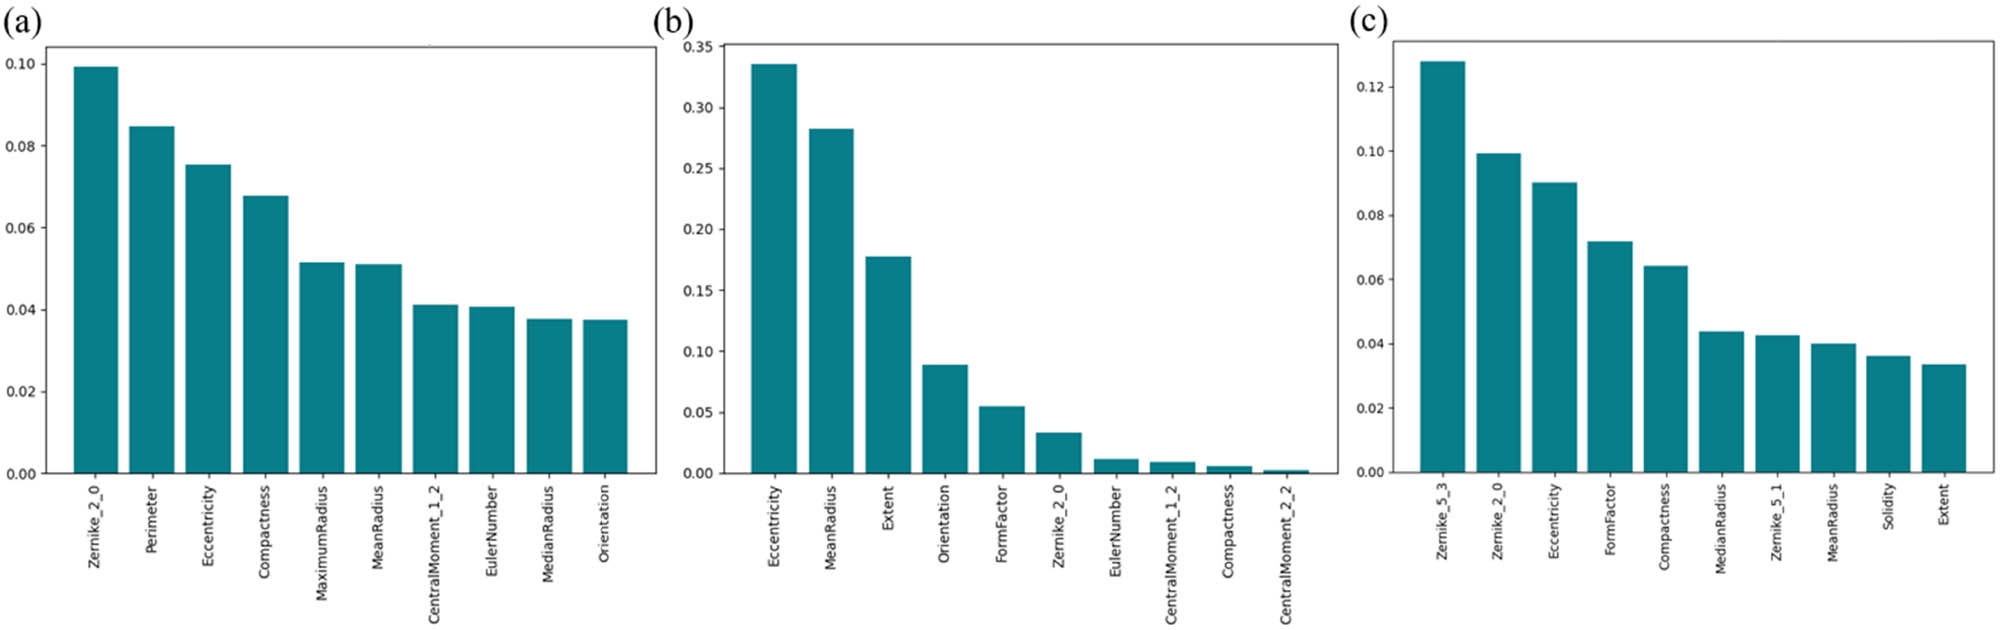
Feature importance rank to predict hardness of CNTs/AlSi10Mg nanocomposites for different ML methods: (a) AdaBoost, (b) decision tree, and (c) Extra Trees.
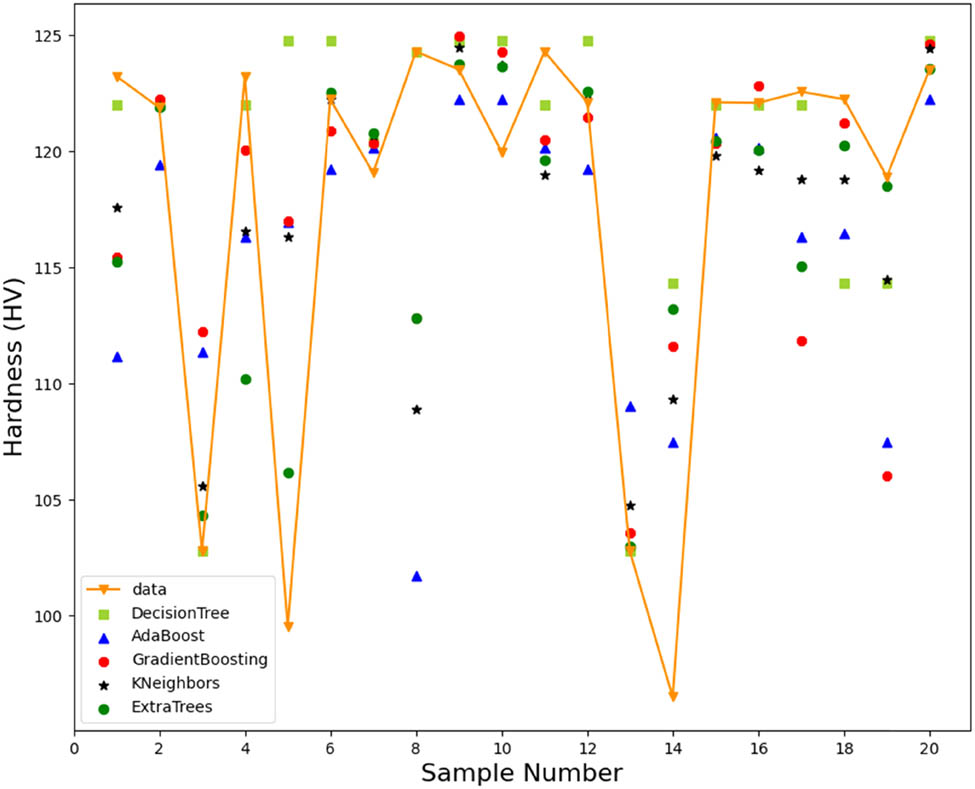
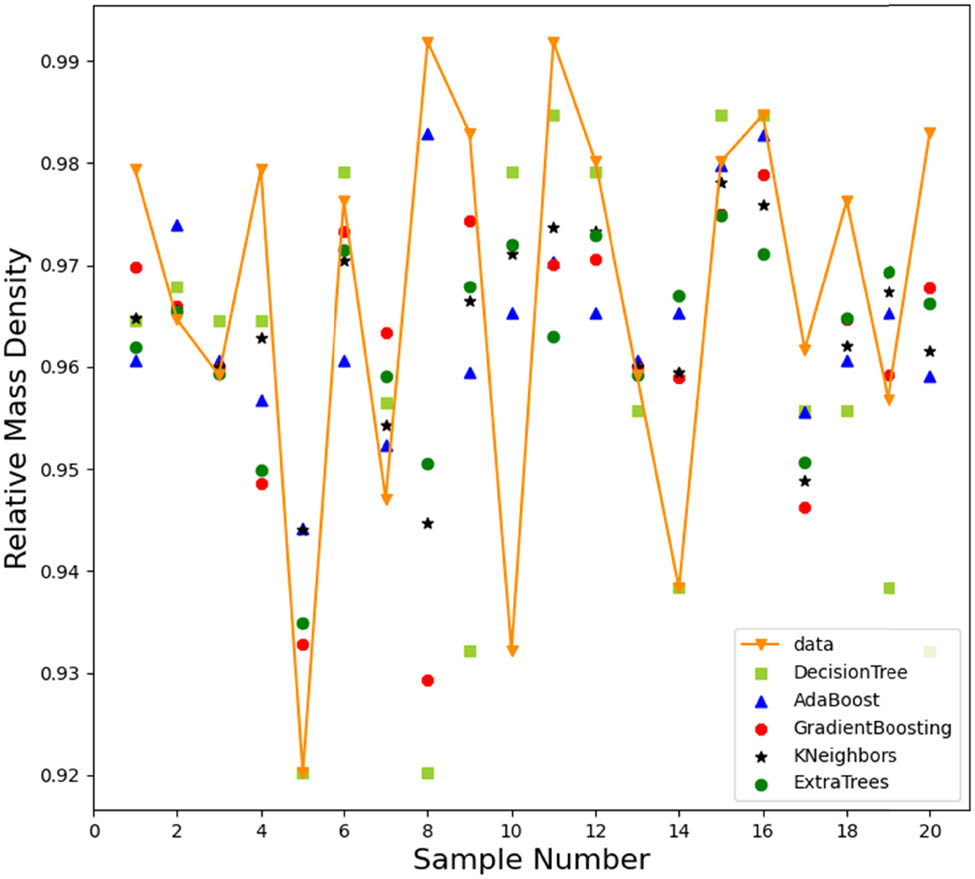
The model predictive results were plotted against the original data for hardness and relative mass density of CNTs/AlSi10Mg nanocomposites. It can be seen from Figure 11 that high accuracy was achieved for the predicted hardness values. Table 3 lists the performance metrics for different machine learning algorithms. AdaBoost has the best prediction performance with an RMSE of 5.936 HV, an MSE of 35.239 HV2 and a RE of 2.47%. Extra Trees have the prediction performance of the largest error with an RMSE of 8.402 HV, an MSE of 70.596 HV2 and a RE of 5.30%. Even the worst machine learning algorithm in this study can render a RE of 5.30%, showing the strong correlation between subgrain cellular structure and the mechanical properties of CNTs/AlSi10Mg nanocomposites. For relative mass density prediction, the decision tree method has the highest prediction accuracy with an RMSE of 2.36%, an MSE of 0.0558% and a RE of 1.59%. It provides better predictive performance over the other base learners (Table 4).
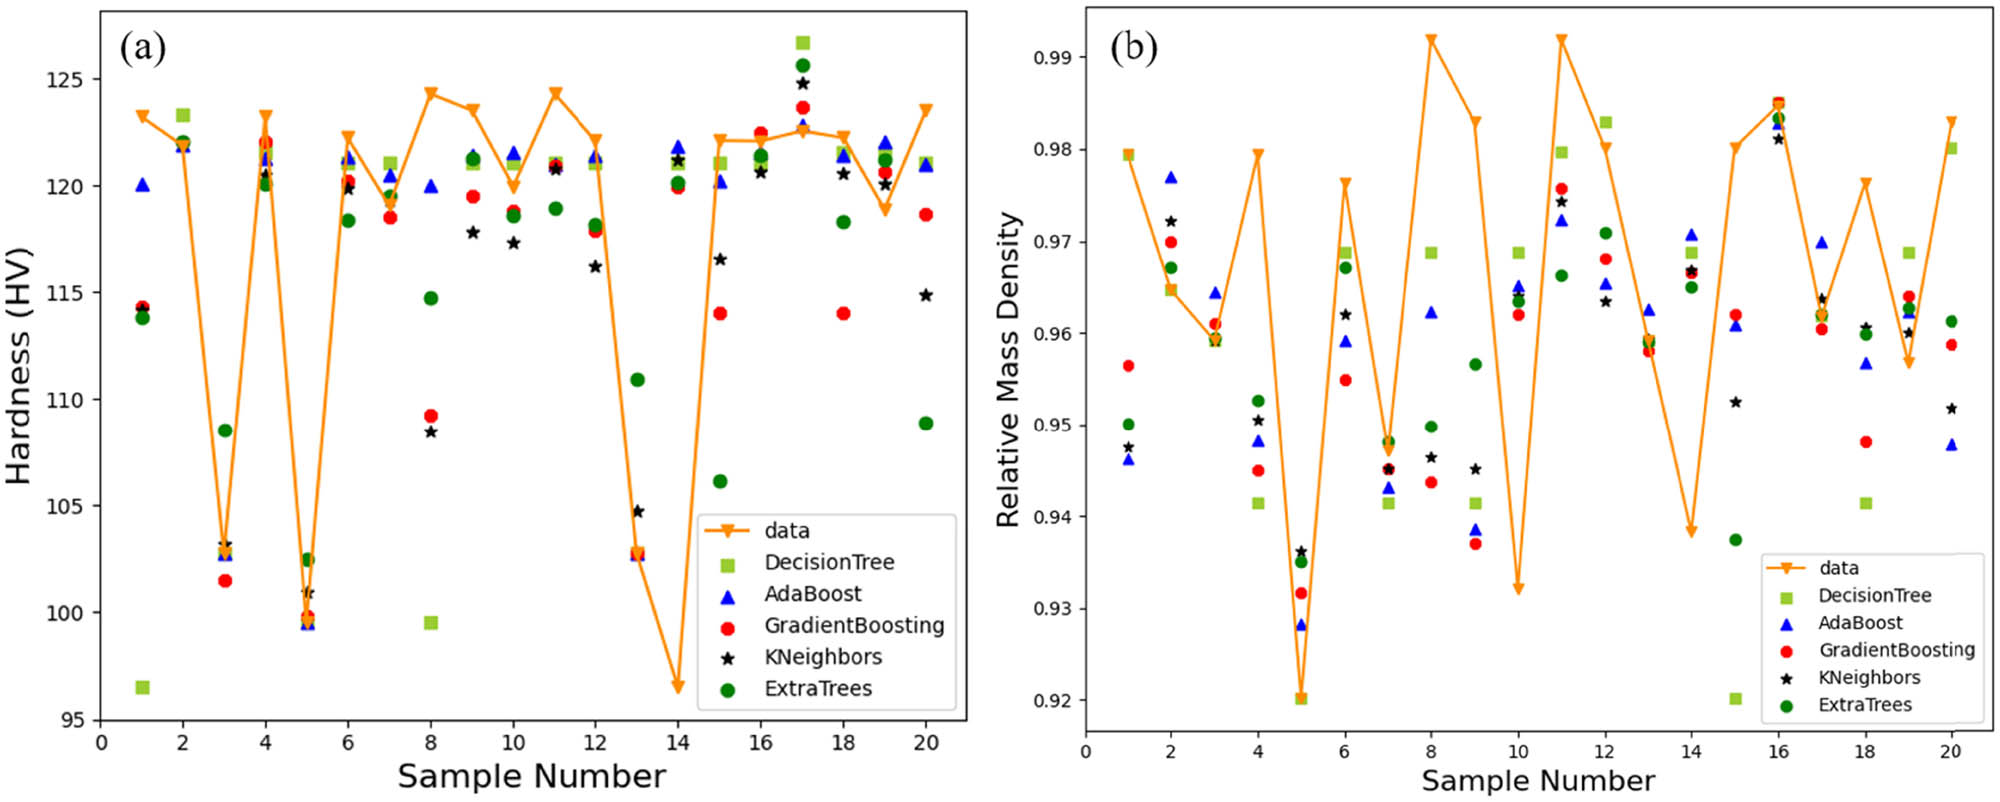
(a) Surface hardness and (b) relative mass density prediction of CNTs/AlSi10Mg nanocomposites using different ML methods with subgrain cellular structure features as input.
Surface hardness prediction performance using different ML methods
| ML method | RMSE (HV) | MSE (HV2) | RE (%) |
|---|---|---|---|
| AdaBoost | 5.936 | 35.239 | 2.47 |
| GradientBoost | 7.131 | 50.855 | 3.86 |
| KNN | 7.629 | 58.213 | 4.37 |
| Decision trees | 8.535 | 72.853 | 4.04 |
| Extra Trees | 8.402 | 70.596 | 5.30 |
Bold values stand for the best performance in the prediction.
Relative mass density prediction performance using different ML methods
| ML method | RMSE (%) | MSE (%) | RE (%) |
|---|---|---|---|
| AdaBoost | 2.26 | 0.0515 | 1.95 |
| GradientBoost | 2.30 | 0.0530 | 1.85 |
| KNN | 2.27 | 0.0514 | 1.86 |
| Decision trees | 2.36 | 0.0558 | 1.59 |
| Extra Trees | 2.17 | 0.0469 | 1.72 |
Bold values stand for the best performance in the prediction.
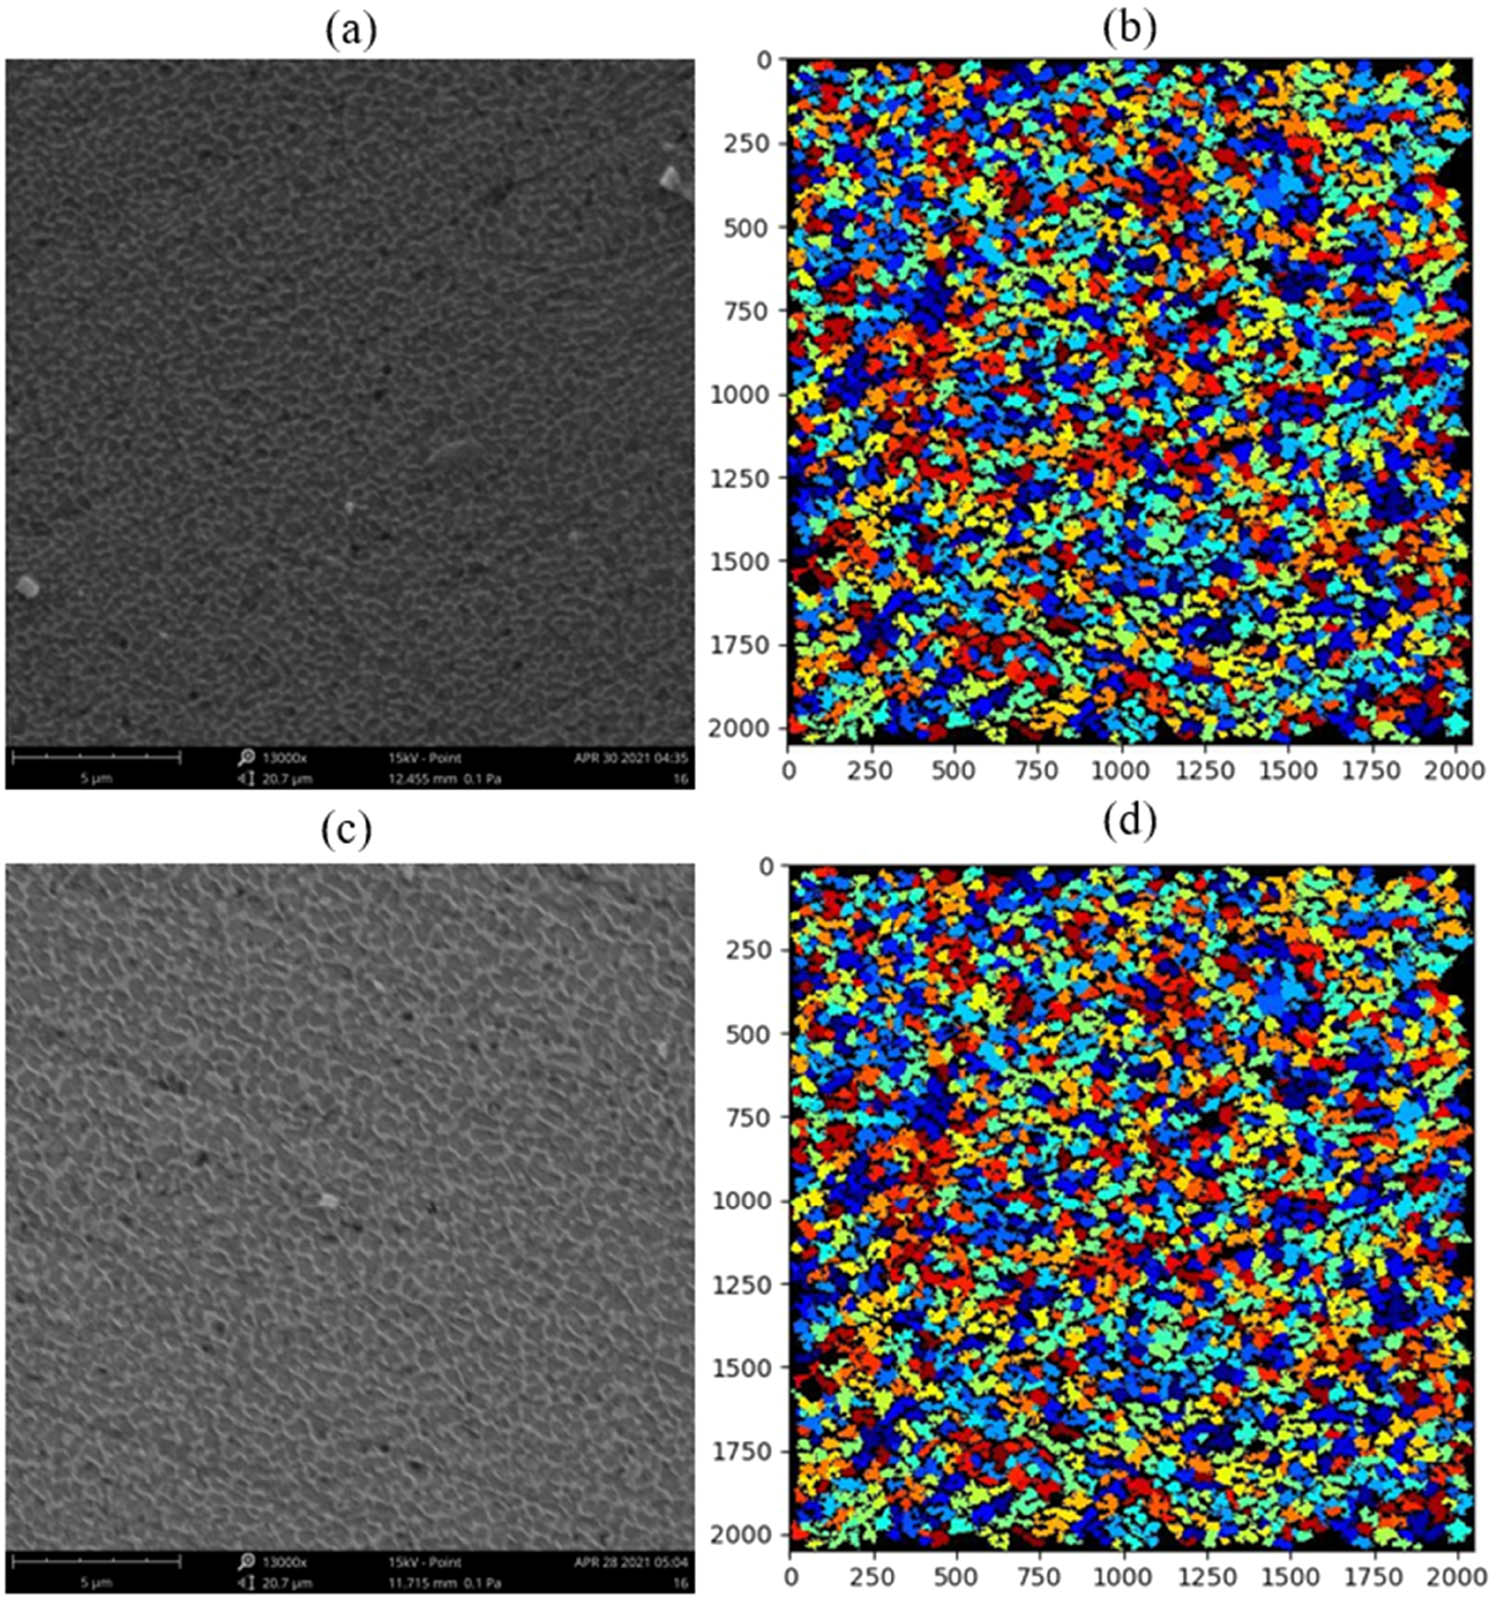
Figure 12 shows the SEM image and cell segmentation maps for low hardness (99.52 HV) and high hardness (124.29 HV) samples with good machine learning model prediction accuracy. The key feature values for low hardness samples are eccentricity, 0.75; mean radius, 3.69 pixels; compactness, 7.18; perimeter, 3.47 μm; extent, 0.46; and zernike_2_0–0.15. The key feature values for high hardness sample are eccentricity, 0.76; mean radius, 3.56; compactness, 5.47; perimeter, 2.65 μm; extent, 0.46; and zernike_2_0–0.16. With a similar mean radius value, the smaller compactness and perimeter can render a higher surface hardness. These results show that the proposed model can predict mechanical properties very well with subgrain cellular features as input. The cause for outliers such as sample no. 14 in Figure 11 may be due to the limited SEM images used in this study but it again suggests the model developed in this study can produce relatively accurate results with even limited data for the training set.
3.3 Principal component analysis of prediction of microstructure–property linkages
PCA normalizes the high dimension feature dataset (83 features in this study) with correlated variables and converts it into a set of linearly uncorrelated vectors that can describe the variances of the features. Three principal components PC1, PC2 and PC3 are used in this study for reducing the dimensionality of the feature datasets, evaluating the primary variances of the observations.
The PCA model predictive results are plotted against the original data for hardness and relative mass density of CNTs/AlSi10Mg nanocomposites. The hardness prediction performance after PCA decomposition is shown in Figure 13 and Table 5. The best performance machine learning algorithm compared with before PCA decomposition changes to Extra Tress from AdaBoost. The original RMSE of 5.936 HV, an MSE of 35.239 HV2 and a RE of 2.47% were changed to 6.313 HV, 39.858 HV2 and 3.61%, respectively. The predictive accuracy becomes a little worse but with PCA dimensional reduction, the number of features became much less, making it easier for SEM image data registration, especially for a large amount of data handling.
Surface hardness prediction of CNTs/AlSi10Mg nanocomposites using different ML methods with PCA decomposition reduced features.
Surface hardness prediction performance using different ML methods with PCA decomposition features
| ML method | RMSE (HV) | MSE (HV2) | RE (%) |
|---|---|---|---|
| AdaBoost | 8.659 | 74.986 | 5.71 |
| GradientBoost | 7.587 | 57.556 | 4.77 |
| KNN | 6.627 | 43.918 | 4.09 |
| Decision trees | 7.382 | 54.488 | 3.51 |
| Extra Trees | 6.313 | 39.858 | 3.61 |
Bold values stand for the best performance in the prediction.
The relative mass density prediction performance after PCA decomposition is shown in Figure 14 and Table 6. The best performance algorithm compared to before PCA decomposition changes to AdaBoost from decision trees. The original RMSE of 2.36%, an MSE of 0.0558% and a RE of 1.59% were improved to 1.71, 0.0294 and 1.42%, respectively. The predictive accuracy for relative mass density becomes better with PCA dimensional reduction, demonstrating the PCA decomposition contains the main shape and geometry information of the major features.
Relative mass density prediction of CNTs/AlSi10Mg nanocomposites using different ML methods with PCA decomposition reduced features.
Relative mass density prediction performance using different ML methods with PCA decomposition features
| ML method | RMSE (%) | MSE (%) | RE (%) |
|---|---|---|---|
| AdaBoost | 1.71 | 0.0294 | 1.42 |
| GradientBoost | 2.09 | 0.0437 | 1.51 |
| KNN | 1.87 | 0.0350 | 1.50 |
| Decision trees | 2.64 | 0.0699 | 1.71 |
| Extra Trees | 1.96 | 0.0385 | 1.61 |
Bold values stand for the best performance in the prediction.
4 Conclusions
CNT-reinforced aluminum matrix nanocomposites were successfully fabricated with different laser powers and scanning speeds. The unique Al–Si eutectic cellular microstructures and densification behavior during laser melting were examined.
A cellular structure segmentation framework was proposed to extract the cell geometric features. Machine-learning-assisted microstructure–property linkages were explored, successfully predicting the hardness and relative mass density with high accuracy. This study is one of the first works that is addressing microstructure–property linkages of LPBF-produced AlSi10Mg-based composites. The major findings of this study are summarized as follows:
The melt pool structure of the fractured tensile samples was stretched, showing the microstructure with a high aspect ratio near the crack front. The CNT phase in the nanocomposites was observed. The crack propagation path deviations triggered by melt pool boundaries and the cellular structure provide the main resistance to crack growth. The correlation between the subgrain size cellular structure to the mechanical properties of the nanocomposites was found to be prominent. The dimension, size and shape of a eutectic subcell are different for various laser parameters. The cell in the coarse cellular zone has a higher eccentricity value, a larger cell area value and a longer perimeter.
Cellular zone cell segmentation was successfully achieved by inverting the image, cell nuclei search and cell generation. Cells in both the fine cellular zone and coarse cellular zone of CNTs/AlSi10Mg nanocomposites were successfully represented and 83 geometric features were extracted for each individual cell. Zernike moment 2_0, perimeter, eccentricity and mean radius were found to be the key microstructural features that affected the mechanical properties of a nanocomposites specimen.
Machine learning algorithms such as AdaBoost, gradient tree boosting, K-nearest neighbors, decision tree, and Extra Trees regressors were used to successfully predict the hardness and relative mass density of CNTs/AlSi10Mg nanocomposites, correlating the mechanical properties with geometric features of cellular zone cells. The prediction relative error is as low as 3.61 and 1.42% for hardness and relative mass density using principal component analysis, respectively.
-
Funding information: This work was supported by Project 52005133 of National Natural Science Foundation of China, Self-Planned Task (No. SKLRS202002C) of State Key Laboratory of Robotics and System (HIT), Research Fund of Key Laboratory of High Performance Manufacturing for Aero Engine (Northwestern Polytechnical University), Ministry of Industry and Information Technology (Grant No.HPM-2020-08), and the Fundamental Research Funds for the Central Universities (No. AUGA5710050320).
-
Author contributions: All authors have accepted responsibility for the entire content of this manuscript and approved its submission.
-
Conflict of interest: The authors state no conflict of interest.
-
Data availability statement: The datasets generated during and/or analyzed during the current study are available from the corresponding author on reasonable request.
References
[1] Yu T, Hyer H, Sohn Y, Bai Y, Wu D. Structure-property relationship in high strength and lightweight AlSi10Mg microlattices fabricated by selective laser melting. Mater Des. 2019;182:108062.10.1016/j.matdes.2019.108062Suche in Google Scholar
[2] Kempen K, Thijs L, Van Humbeeck J, Kruth J-P. Mechanical properties of AlSi10Mg produced by selective laser melting. Phys Proc. 2012;39:439–46.10.1016/j.phpro.2012.10.059Suche in Google Scholar
[3] Read N, Wang W, Essa K, Attallah MM. Selective laser melting of AlSi10Mg alloy: Process optimisation and mechanical properties development. Mater Des (1980–2015). 2015;65:417–24.10.1016/j.matdes.2014.09.044Suche in Google Scholar
[4] Wu J, Wang X, Wang W, Attallah M, Loretto M. Microstructure and strength of selectively laser melted AlSi10Mg. Acta Mater. 2016;117:311–20.10.1016/j.actamat.2016.07.012Suche in Google Scholar
[5] Girelli L, Tocci M, Gelfi M, Pola A. Study of heat treatment parameters for additively manufactured AlSi10Mg in comparison with corresponding cast alloy. Mater Sci Eng: A. 2019;739:317–28.10.1016/j.msea.2018.10.026Suche in Google Scholar
[6] Thijs L, Kempen K, Kruth J-P, Van Humbeeck J. Fine-structured aluminium products with controllable texture by selective laser melting of pre-alloyed AlSi10Mg powder. Acta Mater. 2013;61(5):1809–19.10.1016/j.actamat.2012.11.052Suche in Google Scholar
[7] Liu X, Zhao C, Zhou X, Shen Z, Liu W. Microstructure of selective laser melted AlSi10Mg alloy. Mater Des. 2019;168:107677.10.1016/j.matdes.2019.107677Suche in Google Scholar
[8] Poncelet O, Marteleur M, van der Rest C, Rigo O, Adrien J, Dancette S, et al. Critical assessment of the impact of process parameters on vertical roughness and hardness of thin walls of AlSi10Mg processed by laser powder bed fusion. Addit Manuf. 2021;38:101801.10.1016/j.addma.2020.101801Suche in Google Scholar
[9] Roth CC, Tancogne-Dejean T, Mohr D. Plasticity and fracture of cast and SLM AlSi10Mg: high-throughput testing and modeling. Addit Manuf. 2021;43:101998.10.1016/j.addma.2021.101998Suche in Google Scholar
[10] Laursen CM, DeJong SA, Dickens SM, Exil AN, Susan DF, Carroll JD. Relationship between ductility and the porosity of additively manufactured AlSi10Mg. Mater Sci Eng: A. 2020;795:139922.10.1016/j.msea.2020.139922Suche in Google Scholar
[11] Fousová M, Dvorský D, Michalcová A, Vojtěch D. Changes in the microstructure and mechanical properties of additively manufactured AlSi10Mg alloy after exposure to elevated temperatures. Mater Charact. 2018;137:119–26.10.1016/j.matchar.2018.01.028Suche in Google Scholar
[12] Liu Q, Wu H, Paul MJ, He P, Peng Z, Gludovatz B, et al. Machine-learning assisted laser powder bed fusion process optimization for AlSi10Mg: new microstructure description indices and fracture mechanisms. Acta Mater. 2020;201:316–28.10.1016/j.actamat.2020.10.010Suche in Google Scholar
[13] Fan J, Wang C. Dynamic compressive response of a developed polymer composite at different strain rates. Compos Part B: Eng. 2018;152:96–101.10.1016/j.compositesb.2018.06.025Suche in Google Scholar
[14] Liu Y, Van der Meer F, Sluys LJ, Fan J. A numerical homogenization scheme used for derivation of a homogenized viscoelastic-viscoplastic model for the transverse response of fiber-reinforced polymer composites. Compos Struct. 2020;252:112690.10.1016/j.compstruct.2020.112690Suche in Google Scholar
[15] Yu T, Guo W, Wang X, Liu J, Wang Y, Chen M. Surface hydrophobicity and oleophilicity of hierarchical metal structures fabricated using ink-based selective laser melting of micro/nanoparticles. Nanotechnol Rev. 2020;9(1):626.10.1515/ntrev-2020-0050Suche in Google Scholar
[16] Zhang Z, Liu Z, Wu D. Prediction of melt pool temperature in directed energy deposition using machine learning. Addit Manuf. 2021;37:101692.10.1016/j.addma.2020.101692Suche in Google Scholar
[17] Hertlein N, Deshpande S, Venugopal V, Kumar M, Anand S. Prediction of selective laser melting part quality using hybrid Bayesian network. Addit Manuf. 2020;32:101089.10.1016/j.addma.2020.101089Suche in Google Scholar
[18] Wang Z-L, Adachi Y. Property prediction and properties-to-microstructure inverse analysis of steels by a machine-learning approach. Mater Sci Eng: A. 2019;744:661–70.10.1016/j.msea.2018.12.049Suche in Google Scholar
[19] Fan Z, Ding J, Ma E. Machine learning bridges local static structure with multiple properties in metallic glasses. Mater Today. 2020;40:48–62.10.1016/j.mattod.2020.05.021Suche in Google Scholar
[20] Yu T, Liu J, He Y, Tian J, Chen M, Wang Y. Microstructure and wear characterization of carbon nanotubes (CNTs) reinforced aluminum matrix nanocomposites manufactured using selective laser melting. Wear. 2020;203581.10.1016/j.wear.2020.203581Suche in Google Scholar
[21] Carpenter AE, Jones TR, Lamprecht MR, Clarke C, Kang IH, Friman O, et al. CellProfiler: image analysis software for identifying and quantifying cell phenotypes. Genome Biol. 2006;7(10):1–11.10.1186/gb-2006-7-10-r100Suche in Google Scholar
[22] Otsu N. A threshold selection method from gray-level histograms. IEEE Trans Syst, Man, Cybern. 1979;9(1):62–6.10.1109/TSMC.1979.4310076Suche in Google Scholar
[23] Sezgin M, Sankur B. Survey over image thresholding techniques and quantitative performance evaluation. J Electron Imaging. 2004;13(1):146–65.10.1117/1.1631315Suche in Google Scholar
[24] Boland MV, Markey MK, Murphy RF. Automated recognition of patterns characteristic of subcellular structures in fluorescence microscopy images. Cytometry: J Int Soc Anal Cytol. 1998;33(3):366–75.10.1002/(SICI)1097-0320(19981101)33:3<366::AID-CYTO12>3.0.CO;2-RSuche in Google Scholar
[25] Shi J, Yu T, Goebel K, Wu D. Remaining useful life prediction of bearings using ensemble learning: the impact of diversity in base learners and features. J Comput Inf Sci Eng. 2021;21(2):021004.10.1115/1.4048215Suche in Google Scholar
[26] Freund Y, Schapire RE. A decision-theoretic generalization of on-line learning and an application to boosting. J Comput Syst Sci. 1997;55(1):119–39.10.1006/jcss.1997.1504Suche in Google Scholar
[27] Friedman JH. Stochastic gradient boosting. Comput Stat Data Anal. 2002;38(4):367–78.10.1016/S0167-9473(01)00065-2Suche in Google Scholar
[28] Burba F, Ferraty F, Vieu P. k-Nearest neighbour method in functional nonparametric regression. J Nonparametr Stat. 2009;21(4):453–69.10.1080/10485250802668909Suche in Google Scholar
[29] Safavian SR, Landgrebe D. A survey of decision tree classifier methodology. IEEE Trans Syst, Man, Cybern. 1991;21(3):660–74.10.1109/21.97458Suche in Google Scholar
[30] Geurts P, Ernst D, Wehenkel L. Extremely randomized trees. Mach Learn. 2006;63(1):3–42.10.1007/s10994-006-6226-1Suche in Google Scholar
[31] Wold S, Esbensen K, Geladi P. Principal component analysis. Chemomet Intell Lab Syst. 1987;2(1–3):37–52.10.1016/0169-7439(87)80084-9Suche in Google Scholar
© 2021 Tianyu Yu et al., published by De Gruyter
This work is licensed under the Creative Commons Attribution 4.0 International License.
Artikel in diesem Heft
- Research Articles
- Improved impedance matching by multi-componential metal-hybridized rGO toward high performance of microwave absorption
- Pure-silk fibroin hydrogel with stable aligned micropattern toward peripheral nerve regeneration
- Effective ion pathways and 3D conductive carbon networks in bentonite host enable stable and high-rate lithium–sulfur batteries
- Fabrication and characterization of 3D-printed gellan gum/starch composite scaffold for Schwann cells growth
- Synergistic strengthening mechanism of copper matrix composite reinforced with nano-Al2O3 particles and micro-SiC whiskers
- Deformation mechanisms and plasticity of ultrafine-grained Al under complex stress state revealed by digital image correlation technique
- On the deformation-induced grain rotations in gradient nano-grained copper based on molecular dynamics simulations
- Removal of sulfate from aqueous solution using Mg–Al nano-layered double hydroxides synthesized under different dual solvent systems
- Microwave-assisted sol–gel synthesis of TiO2-mixed metal oxide nanocatalyst for degradation of organic pollutant
- Electrophoretic deposition of graphene on basalt fiber for composite applications
- Polyphenylene sulfide-coated wrench composites by nanopinning effect
- Thermal conductivity and thermoelectric properties in 3D macroscopic pure carbon nanotube materials
- An effective thermal conductivity and thermomechanical homogenization scheme for a multiscale Nb3Sn filaments
- Friction stir spot welding of AA5052 with additional carbon fiber-reinforced polymer composite interlayer
- Improvement of long-term cycling performance of high-nickel cathode materials by ZnO coating
- Quantum effects of gas flow in nanochannels
- An approach to effectively improve the interfacial bonding of nano-perfused composites by in situ growth of CNTs
- Effects of nano-modified polymer cement-based materials on the bending behavior of repaired concrete beams
- Effects of the combined usage of nanomaterials and steel fibres on the workability, compressive strength, and microstructure of ultra-high performance concrete
- One-pot solvothermal synthesis and characterization of highly stable nickel nanoparticles
- Comparative study on mechanisms for improving mechanical properties and microstructure of cement paste modified by different types of nanomaterials
- Effect of in situ graphene-doped nano-CeO2 on microstructure and electrical contact properties of Cu30Cr10W contacts
- The experimental study of CFRP interlayer of dissimilar joint AA7075-T651/Ti-6Al-4V alloys by friction stir spot welding on mechanical and microstructural properties
- Vibration analysis of a sandwich cylindrical shell in hygrothermal environment
- Water barrier and mechanical properties of sugar palm crystalline nanocellulose reinforced thermoplastic sugar palm starch (TPS)/poly(lactic acid) (PLA) blend bionanocomposites
- Strong quadratic acousto-optic coupling in 1D multilayer phoxonic crystal cavity
- Three-dimensional shape analysis of peripapillary retinal pigment epithelium-basement membrane layer based on OCT radial images
- Solvent regulation synthesis of single-component white emission carbon quantum dots for white light-emitting diodes
- Xanthate-modified nanoTiO2 as a novel vulcanization accelerator enhancing mechanical and antibacterial properties of natural rubber
- Effect of steel fiber on impact resistance and durability of concrete containing nano-SiO2
- Ultrasound-enhanced biosynthesis of uniform ZnO nanorice using Swietenia macrophylla seed extract and its in vitro anticancer activity
- Temperature dependence of hardness prediction for high-temperature structural ceramics and their composites
- Study on the frequency of acoustic emission signal during crystal growth of salicylic acid
- Controllable modification of helical carbon nanotubes for high-performance microwave absorption
- Role of dry ozonization of basalt fibers on interfacial properties and fracture toughness of epoxy matrix composites
- Nanosystem’s density functional theory study of the chlorine adsorption on the Fe(100) surface
- A rapid nanobiosensing platform based on herceptin-conjugated graphene for ultrasensitive detection of circulating tumor cells in early breast cancer
- Improving flexural strength of UHPC with sustainably synthesized graphene oxide
- The role of graphene/graphene oxide in cement hydration
- Structural characterization of microcrystalline and nanocrystalline cellulose from Ananas comosus L. leaves: Cytocompatibility and molecular docking studies
- Evaluation of the nanostructure of calcium silicate hydrate based on atomic force microscopy-infrared spectroscopy experiments
- Combined effects of nano-silica and silica fume on the mechanical behavior of recycled aggregate concrete
- Safety study of malapposition of the bio-corrodible nitrided iron stent in vivo
- Triethanolamine interface modification of crystallized ZnO nanospheres enabling fast photocatalytic hazard-free treatment of Cr(vi) ions
- Novel electrodes for precise and accurate droplet dispensing and splitting in digital microfluidics
- Construction of Chi(Zn/BMP2)/HA composite coating on AZ31B magnesium alloy surface to improve the corrosion resistance and biocompatibility
- Experimental and multiscale numerical investigations on low-velocity impact responses of syntactic foam composites reinforced with modified MWCNTs
- Comprehensive performance analysis and optimal design of smart light pole for cooperative vehicle infrastructure system
- Room temperature growth of ZnO with highly active exposed facets for photocatalytic application
- Influences of poling temperature and elongation ratio on PVDF-HFP piezoelectric films
- Large strain hardening of magnesium containing in situ nanoparticles
- Super stable water-based magnetic fluid as a dual-mode contrast agent
- Photocatalytic activity of biogenic zinc oxide nanoparticles: In vitro antimicrobial, biocompatibility, and molecular docking studies
- Hygrothermal environment effect on the critical buckling load of FGP microbeams with initial curvature integrated by CNT-reinforced skins considering the influence of thickness stretching
- Thermal aging behavior characteristics of asphalt binder modified by nano-stabilizer based on DSR and AFM
- Building effective core/shell polymer nanoparticles for epoxy composite toughening based on Hansen solubility parameters
- Structural characterization and nanoscale strain field analysis of α/β interface layer of a near α titanium alloy
- Optimization of thermal and hydrophobic properties of GO-doped epoxy nanocomposite coatings
- The properties of nano-CaCO3/nano-ZnO/SBR composite-modified asphalt
- Three-dimensional metallic carbon allotropes with superhardness
- Physical stability and rheological behavior of Pickering emulsions stabilized by protein–polysaccharide hybrid nanoconjugates
- Optimization of volume fraction and microstructure evolution during thermal deformation of nano-SiCp/Al–7Si composites
- Phase analysis and corrosion behavior of brazing Cu/Al dissimilar metal joint with BAl88Si filler metal
- High-efficiency nano polishing of steel materials
- On the rheological properties of multi-walled carbon nano-polyvinylpyrrolidone/silicon-based shear thickening fluid
- Fabrication of Ag/ZnO hollow nanospheres and cubic TiO2/ZnO heterojunction photocatalysts for RhB degradation
- Fabrication and properties of PLA/nano-HA composite scaffolds with balanced mechanical properties and biological functions for bone tissue engineering application
- Investigation of the early-age performance and microstructure of nano-C–S–H blended cement-based materials
- Reduced graphene oxide coating on basalt fabric using electrophoretic deposition and its role in the mechanical and tribological performance of epoxy/basalt fiber composites
- Effect of nano-silica as cementitious materials-reducing admixtures on the workability, mechanical properties and durability of concrete
- Machine-learning-assisted microstructure–property linkages of carbon nanotube-reinforced aluminum matrix nanocomposites produced by laser powder bed fusion
- Physical, thermal, and mechanical properties of highly porous polylactic acid/cellulose nanofibre scaffolds prepared by salt leaching technique
- A comparative study on characterizations and synthesis of pure lead sulfide (PbS) and Ag-doped PbS for photovoltaic applications
- Clean preparation of washable antibacterial polyester fibers by high temperature and high pressure hydrothermal self-assembly
- Al 5251-based hybrid nanocomposite by FSP reinforced with graphene nanoplates and boron nitride nanoparticles: Microstructure, wear, and mechanical characterization
- Interlaminar fracture toughness properties of hybrid glass fiber-reinforced composite interlayered with carbon nanotube using electrospray deposition
- Microstructure and life prediction model of steel slag concrete under freezing-thawing environment
- Synthesis of biogenic silver nanoparticles from the seed coat waste of pistachio (Pistacia vera) and their effect on the growth of eggplant
- Study on adaptability of rheological index of nano-PUA-modified asphalt based on geometric parameters of parallel plate
- Preparation and adsorption properties of nano-graphene oxide/tourmaline composites
- A study on interfacial behaviors of epoxy/graphene oxide derived from pitch-based graphite fibers
- Multiresponsive carboxylated graphene oxide-grafted aptamer as a multifunctional nanocarrier for targeted delivery of chemotherapeutics and bioactive compounds in cancer therapy
- Piezoresistive/piezoelectric intrinsic sensing properties of carbon nanotube cement-based smart composite and its electromechanical sensing mechanisms: A review
- Smart stimuli-responsive biofunctionalized niosomal nanocarriers for programmed release of bioactive compounds into cancer cells in vitro and in vivo
- Photoremediation of methylene blue by biosynthesized ZnO/Fe3O4 nanocomposites using Callistemon viminalis leaves aqueous extract: A comparative study
- Study of gold nanoparticles’ preparation through ultrasonic spray pyrolysis and lyophilisation for possible use as markers in LFIA tests
- Review Articles
- Advance on the dispersion treatment of graphene oxide and the graphene oxide modified cement-based materials
- Development of ionic liquid-based electroactive polymer composites using nanotechnology
- Nanostructured multifunctional electrocatalysts for efficient energy conversion systems: Recent perspectives
- Recent advances on the fabrication methods of nanocomposite yarn-based strain sensor
- Review on nanocomposites based on aerospace applications
- Overview of nanocellulose as additives in paper processing and paper products
- The frontiers of functionalized graphene-based nanocomposites as chemical sensors
- Material advancement in tissue-engineered nerve conduit
- Carbon nanostructure-based superhydrophobic surfaces and coatings
- Functionalized graphene-based nanocomposites for smart optoelectronic applications
- Interfacial technology for enhancement in steel fiber reinforced cementitious composite from nano to macroscale
- Metal nanoparticles and biomaterials: The multipronged approach for potential diabetic wound therapy
- Review on resistive switching mechanisms of bio-organic thin film for non-volatile memory application
- Nanotechnology-enabled biomedical engineering: Current trends, future scopes, and perspectives
- Research progress on key problems of nanomaterials-modified geopolymer concrete
- Smart stimuli-responsive nanocarriers for the cancer therapy – nanomedicine
- An overview of methods for production and detection of silver nanoparticles, with emphasis on their fate and toxicological effects on human, soil, and aquatic environment
- Effects of chemical modification and nanotechnology on wood properties
- Mechanisms, influencing factors, and applications of electrohydrodynamic jet printing
- Application of antiviral materials in textiles: A review
- Phase transformation and strengthening mechanisms of nanostructured high-entropy alloys
- Research progress on individual effect of graphene oxide in cement-based materials and its synergistic effect with other nanomaterials
- Catalytic defense against fungal pathogens using nanozymes
- A mini-review of three-dimensional network topological structure nanocomposites: Preparation and mechanical properties
- Mechanical properties and structural health monitoring performance of carbon nanotube-modified FRP composites: A review
- Nano-scale delivery: A comprehensive review of nano-structured devices, preparative techniques, site-specificity designs, biomedical applications, commercial products, and references to safety, cellular uptake, and organ toxicity
- Effects of alloying, heat treatment and nanoreinforcement on mechanical properties and damping performances of Cu–Al-based alloys: A review
- Recent progress in the synthesis and applications of vertically aligned carbon nanotube materials
- Thermal conductivity and dynamic viscosity of mono and hybrid organic- and synthetic-based nanofluids: A critical review
- Recent advances in waste-recycled nanomaterials for biomedical applications: Waste-to-wealth
- Layup sequence and interfacial bonding of additively manufactured polymeric composite: A brief review
- Quantum dots synthetization and future prospect applications
- Approved and marketed nanoparticles for disease targeting and applications in COVID-19
- Strategies for improving rechargeable lithium-ion batteries: From active materials to CO2 emissions