Enhanced electrochemical synthesis of Ni–Fe/brass foil alloy with subsequent combustion for high-performance photoelectrode and hydrogen production applications
-
Islam Kholidy
 ,
Hanafy Mahmoud Abd El-Salam
,
Hanafy Mahmoud Abd El-Salam

Abstract
This study presents a novel approach to synthesizing and characterizing Cu–Fe–Ni ternary alloy and oxide nanostructures for advanced electrochemical and photocatalytic applications. Using electrodeposition on brass substrates from tailored solutions of Nickel(ii)chloride, nickel(ii) sulfate, and iron(iii) chloride, five distinct alloy compositions were fabricated with optimized morphologies and electrochemical properties. Notably, succinic acid was identified as an effective additive, enhancing deposition quality and catalytic activity. A unique ternary alloy oxide was further synthesized via controlled combustion at 950°C. Comprehensive characterization using X-ray diffraction, X-ray photoelectron spectroscopy, scanning electron microscope, Energy dispersive X-ray, and cyclic voltammetry revealed significant structure–property relationships. Alloys formed with higher Ni and Fe chloride concentrations showed rough, agglomerated surfaces, correlating with improved hydrogen evolution reaction performance in alkaline sodium hydroxide. Among all samples, Alloy(v) exhibited the highest hydrogen production efficiency. Furthermore, the alloy oxide demonstrated remarkable photovoltaic potential, delivering current densities of 23 mA·cm−2 in the dark and 68.45 mA·cm−2 under illumination. These findings showcase a cost-effective, scalable method for producing multifunctional Cu–Fe–Ni-based materials with dual capabilities in hydrogen generation and solar energy conversion – highlighting a new direction in renewable energy material development.
1 Introduction
A material’s surface is where interactions between its mechanical, thermal, chemical, and electrochemical properties begin. Thus, the surface is the most crucial engineering component of a material. The application of surface modification technologies is indispensable in modern production processes due to evolving standards. The most critical areas of surface technology are tribology and corrosion [1] because surfaces are frequently threatened by wear and corrosion, leading to significant economic and industrial losses if not managed properly. Surface technology can prevent or delay such damage, making it essential in industrial engineering processes. Choosing the best technique to modify surface attributes involves complex decisions often guided by economic and environmental research [2]. One traditional yet effective surface modification technique is electrodeposition [3,4,5]. With advancements such as Volta’s galvanic cell around 1,800, electrodeposition became more efficient for creating coatings through electrochemical processes at the electrode/electrolyte interface. These coatings can enhance a substrate’s solderability, lubrication, electrical conductivity, corrosion resistance, wear resistance, and heat resistance. Electrodeposition can be performed using direct current or pulse current (PC), with PC offering benefits like improved element dispersion, nonporous nanostructures, reduced gas absorption, less need for organic additives, and lower environmental impact [6,7]. Nickel (Ni) and its alloys, particularly Ni–Fe, are highly valued in deposition applications due to their excellent corrosion and wear resistance. Ni electrodeposition accounts for up to 12% of global Ni usage [8], primarily for decorative coatings and various industrial purposes such as restoring eroded metals, enhancing magnetic properties, and preparing surfaces for further treatment [9,10]. Ni–Fe alloy coatings, known for their soft magnetic characteristics and good electrical conductivity, are used in electronics, sensors, communication, and optical industries [11]. Compared to other techniques like sputtering and molecular beam epitaxy, electrodeposition offers advantages such as uniform, flaw-free coatings at lower costs and under less stringent conditions. Electroplating baths commonly use sulfate and chloride solutions due to their economic advantages. As an example, for Fe–Ni alloys is the Permalloy where Fe–Ni alloys possess significant commercial value because of their magnetic properties and thermal expansion coefficient. For instance, the Permalloy, Invar, and other Fe–Ni alloys are ideal materials for all kinds of microelectromechanical system devices [12,13]. Adding Nickel(ii)chloride (NiCl2) to sulfate baths enhances solution conductivity and Ni anode dissolution, while chloride baths, although producing harder and more stressed coatings, offer higher current efficiencies due to the catalytic effect of chloride ions [14,15,16,17]. Boric acid is often added to these baths to improve current density range, coating appearance, and reduce brittleness by acting as a buffer, thus preventing pH rise at the cathode surface [18,19,20,21,22]. Citric acid is also used as a complexing agent in Ni–Fe electroplating baths, forming stable complexes with Fe3+, Ni2+, and Fe2+ ions. However, its addition can decrease current efficiency by increasing the cathode surface pH, leading to hydroxide layer formation [23,24,25]. Despite this, citric acid’s complexing effect can shift the reduction potential of Ni–Fe alloys, increase the diffusion-limited current, and enhance nucleation rates. The global shift toward renewable energy technologies, particularly solar cells, necessitates the development of efficient, storable, and transportable energy carriers. Among various alternatives, hydrogen stands out as a clean, high-energy-density fuel with the potential to replace fossil fuels across multiple sectors. As the most abundant element on Earth, hydrogen can be sustainably generated through water electrolysis, provided that the hydrogen evolution reaction (HER) is catalyzed efficiently. Recent advancements have focused on developing highly active and stable electrocatalysts, particularly in alkaline media, to enhance the reaction performance. Alloy-based electrodes have shown promise due to their synergistic catalytic properties, offering improved charge transfer and surface kinetics [26,27]. Despite considerable progress, the overall efficiency and yield of hydrogen production remain below the thresholds required for large-scale industrial deployment. This limitation highlights the urgent need for further innovation in catalyst design, nanostructuring, and interfacial engineering to maximize hydrogen output. Enhancing H2 generation efficiency not only boosts the viability of water-splitting technologies but also accelerates the implementation of hydrogen as a mainstream energy vector in fuel cells, grid storage systems, and industrial applications [22]. Therefore, optimizing this systems is a critical step toward realizing a hydrogen-powered future in the context of global decarbonization efforts. This enhancement can be attributed to the transformation of transition metal compounds into their active oxide forms [28,29], as shown in manganese-based photocathodes and nanocomposites [30,31]. Herein, in this study, electrochemical deposition of iron, nickel, and their binary alloys onto brass substrates was achieved using electrolytic baths containing 0.1M NiCl2, 0.1M NiSO4, and varying concentrations of FeCl3. Succinic acid was identified as the most effective additive for stabilizing the deposition process and improving coating quality. Structural, morphological, and electrochemical characterizations were performed using various techniques. EDX analysis confirmed alloy compositions including (8Ni–45Cu–0.3Fe–34.7Zn–12O), (15Ni–36Cu–4Fe–30Zn–15O), (60Ni–14Cu–3Fe–21Zn–2O), (18Ni–63Cu–8Fe–10Zn–1O), and (70Ni–7Cu–18Fe–4Zn–1O). Additionally, a thermally oxidized alloy synthesized at 950°C yielded a mixed oxide composition of (52Ni–8Fe–5Cu–4Zn–31O). X-ray diffraction (XRD) patterns revealed dominant alloy phases alongside minor oxide components, providing insights into crystallographic structure and phase distribution. Surface morphology studies indicated that increased concentrations of Ni2+ and Fe3+ resulted in more aggregated and rougher surface textures compared to deposits enriched in Cu2+. Under alkaline conditions, the Ni–Fe alloys demonstrated high catalytic activity toward the HER, facilitating water molecule reduction and efficient hydrogen gas evolution. The favorable hydrogen adsorption free energies on Ni–Fe active sites support their potential as cost-effective, high-performance electrocatalysts for sustainable hydrogen production in diverse electrolyte systems.
1.1 Experimental details
NiCl2 (99%), nickel(ii) sulfate (Ni2SO4 99%), sodium hydroxide (NaOH 99%), sodium sulfate (Na2SO4 99%), FeCl3 (99%), boric acid 99%, citric acid 99%, tartaric acid 99%, succinic acid 99% (Sigma Aldrich), and (77Cu-33Zn) Foil (Sigma Aldrich 99.99%).
1.2 Samples characterization
The scanning electron microscope (SEM) analysis was performed using a Quanta 250 FEG microscope (FEI Company, Eindhoven, Holland), and the chemical compositions were carefully examined using the accompanying energy-dispersive X-ray unit (EDX). For quantitative analysis, the XRD charts of the deposited alloys were assessed using a Phillips model PW 1730 X-ray generator, a PW 1716 diffractometer, and a PW 1050/25 detector. A copper (Cu) anode with a wavelength of 0.154 nm was utilized, with an ascending voltage of 40 kV, a current of 35 mA, and a scanning rate of 0.02 within a 2θ angle range of 10° to 80°. To study the binding energy and ion valence state of the specimens, X-ray photoelectron spectroscopy (XPS) was carried out using a Thermo ESCALAB 250 Xi instrument. Survey spectra were recorded over a range of 0–1,100 eV for each composition. Additionally, high-resolution spectra were obtained for the 2p1/2 and 2p3/2 levels of Fe, Ni, and Zn, as well as for the 1s level of oxygen.
1.3 Electrodeposition of Ni–Fe alloy
Cyclic voltammetry results indicate that, in comparison to other additives, succinic acid emerges as the most effective additive. Figure 2a–d displays cyclic voltammograms for a solution containing both Ni and Fe ions that were measured using an electrochemical cyclic voltammetry technique. The scan rate used was 50 mV·s−1, and the potential range was −2.0 to +2.0 V. The purpose of the experiment was to determine the appropriate current and potential for the electrodeposition process. A double jacket cell was used, which contained Pt electrodes as working and counter electrodes and a saturated calomel electrode as a reference electrode. The solution used in the experiment contained NiCl2, NiSO4, and FeCl3 dissolved in a distilled water electrolyte. The results presented in Figure 2a–d show the cyclic voltammograms obtained for this solution under the given experimental conditions. The information obtained from these measurements can be used to determine the optimal conditions for electrodeposition of Ni and Fe ions from this solution. Table 1 shows the effects of different experimental conditions on the electrochemical behavior of Ni–Fe alloys with additives (a) 0.1M NiCl2, 0.1M NiSO4, and (0.008–0.04) M FeCl3; (b) 0.1M NiCl2, 0.1M NiSO4, 0.008M FeCl2(S1), (S1) with 0.01M of tartaric acid; (c) (S1) with (0.01–0.03)M of citric acid; (d) (S1) with (0.01–0.04)M of succinic acid; and (e) S1 with 0.01M of citric acid, S1 with 0.01M succinic acid, S1 with 0.01M boric acid, and S1 with 0.01M tartaric acid) at 50 mV·s−1 and room temperature.
Effects of different experimental conditions on the electrochemical behavior of Ni–Fe alloys with additive
| Figure 1 | Samples | Start E pc Alloy (V) | Max I pc Alloy (mA) | Optimum sample |
|---|---|---|---|---|
| Figure 1a | 0.1M NiCl2 + 0.1M NiSO4 + 0.008M FeCl3(S1) | −1.05 | −0.8 | S1 |
| 0.1M NiCl2 + 0.1M NiSO4 + 0.02M FeCl3 | −0.96 | −0.6 | ||
| 0.1M NiCl2 + 0.1M NiSO4 + 0.04M FeCl3 | −1.1 | −0.48 | ||
| Figure 1b | S1 | −1.05 | −0.8 | S1 + 0.01M tartaric acid |
| S1 + 0.01M tartaric acid | –0.86 | −16.8 | ||
| Figure 1c | S1 | −1.05 | −0.8 | S1 + 0.01M citric acid |
| S1 + 0.01M citric acid | −0.99 | 16.4 | ||
| S1 + 0.03M citric acid | −0.99 | 18.2 | ||
| Figure 1d | S1 | −1.05 | −0.8 | S1 + 0.01M succinic acid |
| S1 + 0.01M succinic acid | −0.77 | −18 | ||
| S1 + 0.04M succinic acid | −0.83 | −16.3 | ||
| Figure 1e | S1 | −1.05 | −0.8 | S1 + 0.01M succinic acid |
| S1 + 0.01M tartaric acid | –0.86 | −16.8 | ||
| S1 + 0.01M citric acid | −0.99 | 16.4 | ||
| S1 + 0.01M succinic acid | −0.77 | −18 | ||
| S1 + 0.01M boric acid | −0.84 | −5 |
1.3.1 Determine the best concentration of Ni and Fe
It seems that Figure 1a shows the effects of different experimental conditions on the electrochemical behavior of Ni, Fe, and Ni–Fe alloys. In this figure, it was observed that increasing the concentration of Fe led to an increase in the reduction potential peak of Fe and Ni E pcIron = (−0.34 to −0.42) V, E pc Nickel = (−1.2 to −1.7) V, respectively, but a decrease in the reduction potential peak of Ni–Fe alloy E pc Alloy = (−1.15 to −0.96) V. The optimal condition for electrodeposition of Ni–Fe alloy was found to be a sample containing (0.008M Fe and 0.2M Ni) (S1). This sample showed a shift in the reduction potential peak of about 103 mV and an increase in the intensity of the reduction current peak of about 0.2 mA compared to the sample containing 0.2M Ni and 0.04M Fe alloy, where I pc Alloy = (−0.6 to −0.8) mA.
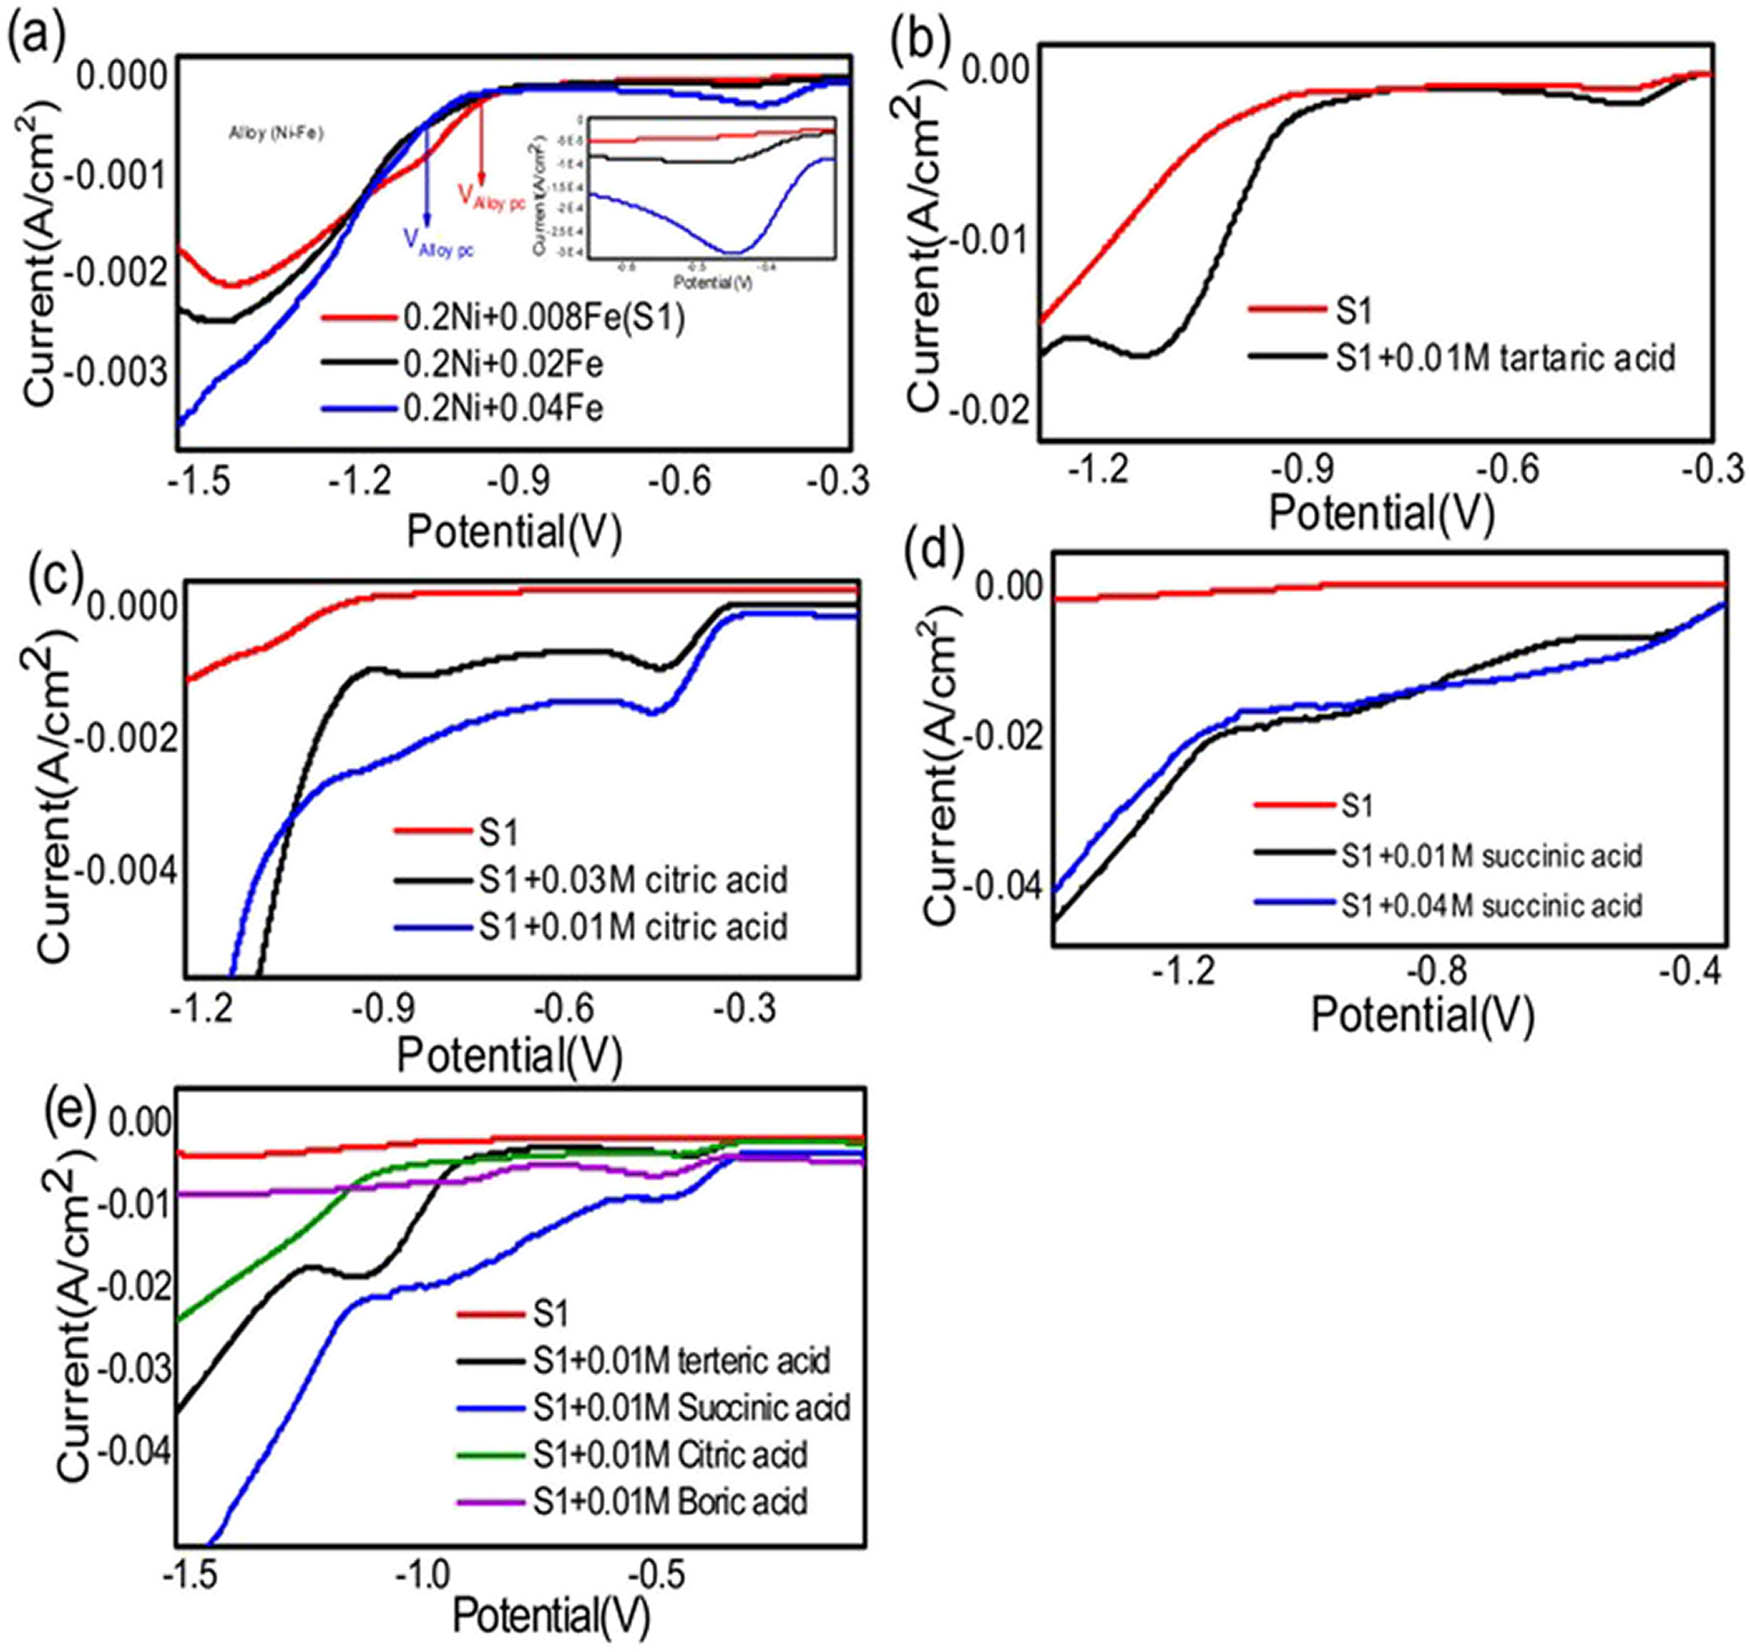
Electrochemical cyclic voltammetry of NiCl2, NiSO4, and FeCl3 dissolved in distilled water electrolyte where (a) 0.1M NiCl2, 0.1M NiSO4, and (0.008–0.04) M FeCl3; (b) 0.1M NiCl2, 0.1M NiSO4, 0.008M FeCl2(S1), and S1 with 0.01M of tartaric acid; (c) S1 with (0.01 to 0.03)M of citric acid; (d) S1 and (0.01–0.04)M of succinic acid; and (e) S1 and S1 with 0.01M of citric acid, 0.01M succinic acid, 0.01M boric acid, and 0.01M tartaric acid at 50 mV s−1 and room temperature.
1.3.2 Effect of tartaric acid
In Figure 1b, the effect of tartaric acid on the electrochemical behavior of Ni, Fe, and Ni–Fe alloys was studied. It was observed that the presence of tartaric acid led to an increase in the intensity of the current reduction peak of Fe I pc Iron = (−1.2 to −2.2) mA, and a shift in the electrodeposition process for Ni–Fe alloy to more positive potentials E pc Iron = (–0.5 to –0.34) V. The electrodeposition process for Ni–Fe alloy starts at around E pc Alloy = –0.86 V, at more positive potentials than in the absence of tartaric acid E pc Alloy = −0.99 V. Figure 1b shows a broad reduction peak for alloy where current reduction peak of alloy increases I pc Alloy = (−7 to −16.5) mA. From Figure 1b, we observed that the sample with tartaric acid has the ability to produce higher hydrogen evaluation than the sample without tartaric acid.
1.3.3 Effect of citric acid
According to Figure 1c, the addition of citric acid to the electrolyte solution led to an increase in the intensity of the current reduction peak of Fe I pc Iron = (−1 to −1.8) mA at an iron reduction potential peak of E pc Iron = −0.45 V. The best concentration of citric acid was found to be 0.01 M, as this concentration resulted in an increase in the intensity of the current reduction peaks of both Fe and Ni–Fe alloy.
1.3.4 Effect of succinic acid
Based on Figure 1d, it was observed that an increase in the concentration of succinic acid resulted in an increase in the intensity of the current reduction peak of Fe at an iron reduction potential peak of E pc Iron = −0.504 V. The optimal concentration of succinic acid was found to be 0.01 M, as it resulted in an increase in the intensity of the current reduction peaks of Ni–Fe alloy, specifically a change in I pc alloy = (−8 to −16.5) mA and in E pc alloy = (−1.15 to −0.81) V than other concentrations of succinic acid.
1.4 Preparation of photoelectrode
The Ni–Fe/brass composite material that was synthesized is utilized as a photoelectrode for the water splitting reaction (Figure 1(e)). Additionally, the oxides of this alloy, obtained through a combustion process at 950°C for 20 min, are employed as photoelectrodes for hydrogen generation. The hydrogen generation experiments are conducted using a 0.2M Na2SO4 electrolyte solution, and a solar simulator emitting light at an intensity of 400 mW·cm−2 is employed as the light source. The applied potential ranges from −1.2 to 1 V at room temperature.
2 Results and discussion
2.1 Electrodeposition process and alloy synthesizing
EDX spectra are shown in Figure 2a–g for Ni–Fe–Zn–Cu–O alloys synthesized in distilled water containing (a) Alloy(i), (b) Alloy(ii), (c) Alloy(iii), (d) Alloy(iv), (e) Alloy(v), (f) Alloy-oxide after deposited and combustion at 950°C for 20 min and (g) is a cross section of alloy(v). The chemical compositions of the examined samples are shown in Table 2. All the spectra show only Fe, Ni, Cu, and Zn and signals without any impurity traces from the used chemicals, which indicate the high purity of the deposited Ni/Fe alloys spectra of Ni–Fe–Zn–Cu–O alloys. The alloys were synthesized in distilled water and various samples were analyzed. The results are presented in Figure 2, with panels (a) to (g) corresponding to different samples. In Figure 2a, the EDX spectrum represents Alloy(i), which was synthesized in distilled water. Similarly, Figure 2b corresponds to Alloy(ii), Figure 2c corresponds to Alloy(iii), Figure 2d corresponds to Alloy(iv), Figure 2e corresponds to Alloy(v), Figure 2f represents the EDX spectrum of the Alloy-oxide after deposition and combustion at 950°C for 20 min, and Figure 2g shows a cross-section of Alloy(v). The chemical compositions of the examined samples are provided in Table 2. The elements detected in all the spectra are Fe, Ni, Cu, and Zn. No impurity traces from the used chemicals were observed, indicating the high purity of the deposited Ni/Fe alloys. The surface morphology of deposited alloys was studying by a SEM. The study involves two different Ni/Fe alloys formed on the surface of a Cu–Zn foil from distilled water. Additionally, there is mention of an alloy oxide formed after heat treatment at 950°C for 20 min. Figure 3a shows the SEM image of Alloy(i) on the Cu–Zn foil surface, Figure 3b shows the SEM image of Alloy(ii) on the Cu–Zn foil surface, Figure 3c shows the SEM image of Alloy(iii), shows the Figure 3d SEM image of Alloy(iv), Figure 3e shows the SEM image of Alloy(v), Figure 3f shows the SEM image of Alloy oxide formed after heat treatment at 950°C for 20 min, and Figure 3g shows the cross-section image of Alloy(v). It is stated that the morphology of the alloy can be reformed by governing its chemical composition. In Figure 3a, the Alloy(i) is characterized by spherical grain particles with low density. This is attributed to a low deposition ratio of Nickel and Iron in the alloy formation process. Moving to Figure 3b, Alloy(ii) shows a slight increase in the deposition ratio of Nickel and Iron compared to Alloy(i). The addition of boric acid leads to an increased number of deposited particles in Nickel and Iron, resulting in a slightly higher deposition ratio. Figure 3c demonstrates the significant effect of citric acid in the deposition process, particularly in Nickel deposition. There is a noticeable improvement in the deposition of Nickel, as well as a slight enhancement in the deposition of Iron. However, some agglomeration is observed between the particles of Iron and Nickel, indicating a possible interaction or collection between them. Figure 3d showcases the influence of tartaric acid, which has a very good effect on Iron deposition and a good effect on Nickel deposition. The result is a well-distributed composition between Iron and Nickel in the thin film. The presence of small overlapping grains indicates a good quality of deposit, suggesting a desirable structure for the alloy. Moving on to Figure 3e, Alloy(v) stands out as the best sample among the presented images. It contains the highest ratio of Nickel and Iron. Additionally, it exhibits a high number of bonds, resembling a thread mesh structure. This indicates a strong interconnectivity within the alloy and suggests a structurally robust composition. The percent composition of the Ni–Fe alloy in the thin film becomes dominant, contributing to the enhanced strength and structural integrity. Figure 3f focuses on the alloy oxide formed after heat treatment. Following the determination that Alloy(v) is the best sample, heat treatment is performed at 950°C. The SEM image shows clear small granular crystals of Ni–Fe metal uniformly deposited on the surface of the Cu–Zn substrate. This result suggests good adhesion between the Ni–Fe deposit and the Cu–Zn substrate, indicating a strong interface between the two materials. Finally, Figure 3g displays the cross-section of Alloy(v), offering insight into the thickness layer of the alloy. The image indicates a very good thickness distribution, highlighting the effectiveness of the deposition process in achieving a uniform and controlled thickness for the alloy. Taken together, the SEM images provide valuable information about the influence of deposition conditions and chemical compositions on the morphology and characteristics of the Ni/Fe alloys. The variations observed in grain size, density, distribution, and structural integrity underscores the importance of carefully controlling the deposition parameters to tailor the alloy properties according to desired specifications. Alloy(v) exhibited a well-defined network and fibrous morphology, with individual fiber diameters ranging from approximately 200 to 250 nm. This unique structure significantly enhances the surface area, which is highly beneficial for the HER. In contrast, Alloys(i) through (iv) primarily displayed radial particle morphologies, with particle diameters decreasing from around 500 nm in Alloy(i) to approximately 200 nm in Alloy(iv). Although Alloy(iv) shares a comparable particle size with Alloy(v), the latter demonstrates superior catalytic potential due to its interconnected fiber network and improved structural uniformity. These morphological features of Alloy(v) are believed to facilitate better charge transfer and active site exposure, thereby enhancing the efficiency of H2 gas generation.
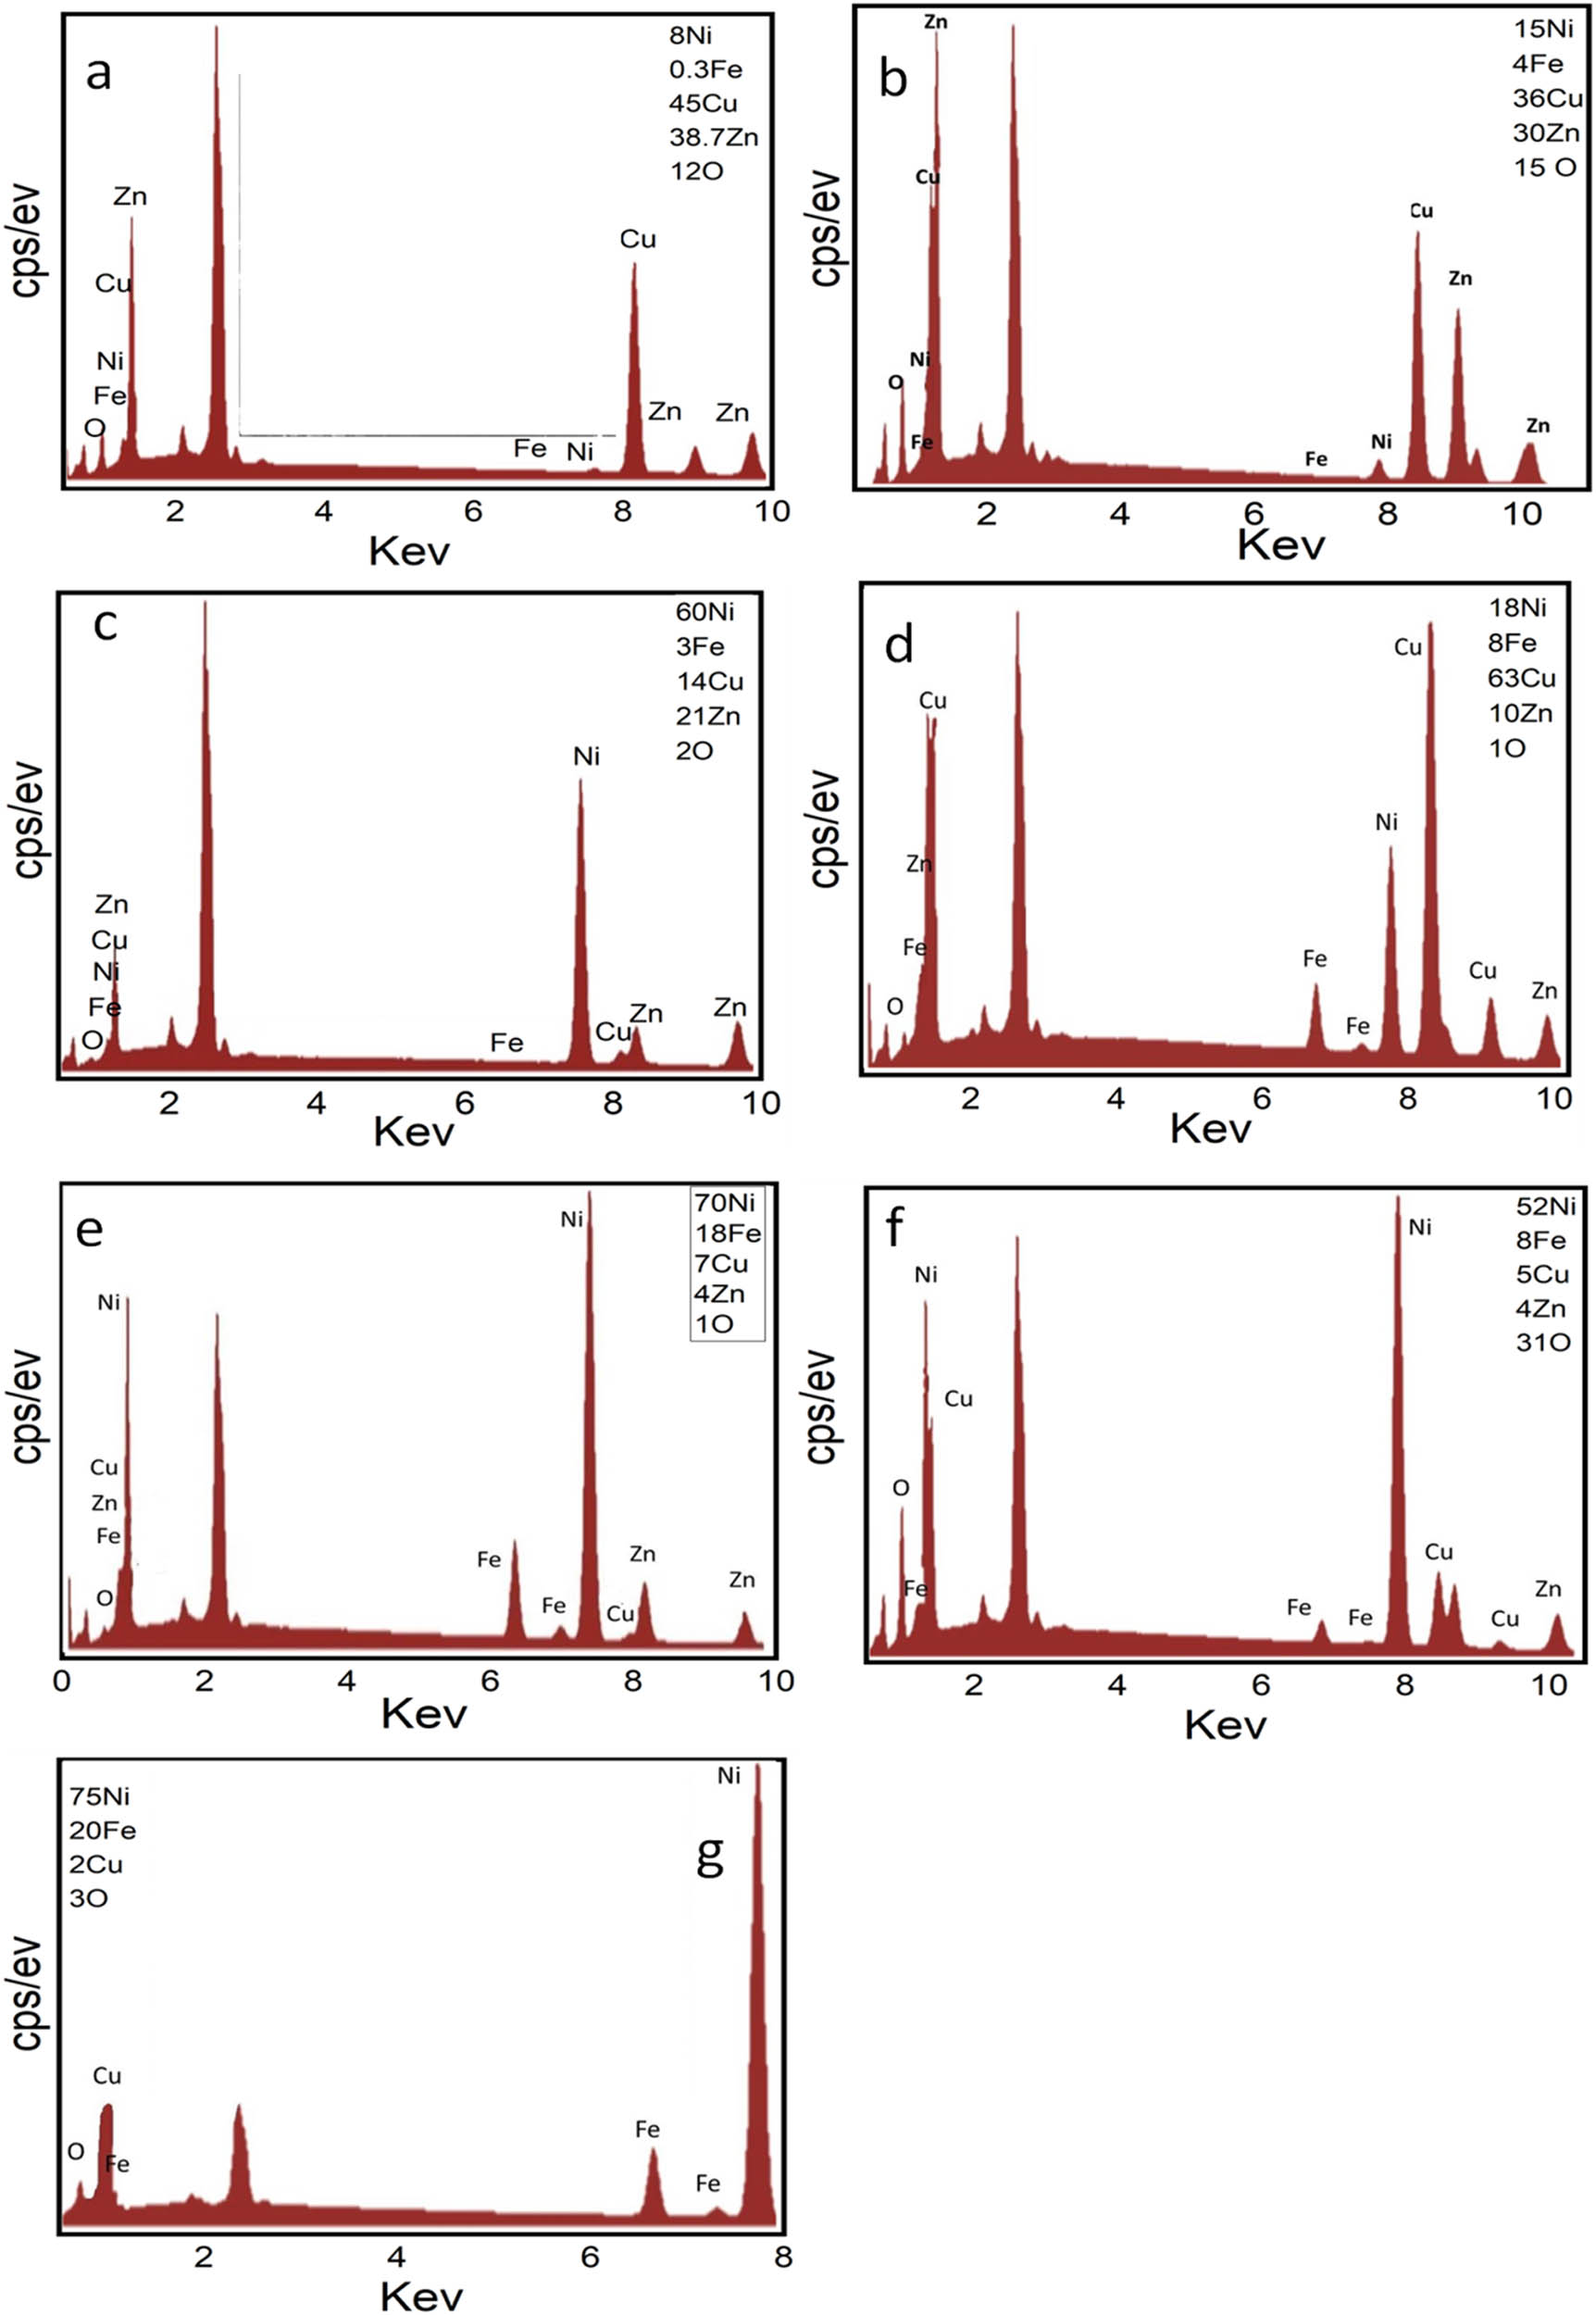
EDX spectra of Ni–Fe–Cu–Zn–O alloys: (a) Alloy i, (b) Alloy ii, (c) Alloy iii, (d) Alloy iv, (e) Alloy v, (f) the corresponding alloy oxide, and (g) cross-sectional analysis of Alloy iv.
Chemical compositions of nano crystalline Ni–Cu–Fe–Zn alloys obtained from EDX analysis where (S1) is 0.1M (NiCl2 + NiSO4) + 0.008M FeCl3
| Sample | Bath composition | Additives | Ni% | Cu% | Fe% | Zn% | O% | Applied potential (V) | Case of alloy |
|---|---|---|---|---|---|---|---|---|---|
| A | (S1) | Non | 8 | 45 | 0.3 | 34.7 | 12 | −1.05 | Alloy(i) |
| B | (S1) | 0.01M boric acid | 15 | 36 | 4 | 30 | 15 | −0.85 | Alloy(ii) |
| C | (S1) | 0.01M citric acid | 60 | 14 | 3 | 21 | 2 | −1 | Alloy(iii) |
| D | (S1) | 0.01M tartaric acid | 18 | 63 | 8 | 10 | 1 | −0.86 | Alloy(iv) |
| E | (S1) | 0.01M succinic acid | 70 | 7 | 18 | 4 | 1 | −0.77 | Alloy(v) |
| F | (S1) | 0.01M succinic acid | 52 | 5 | 8 | 4 | 31 | −0.77 | Alloy-oxide |
| G | (S1) | 0.01M succinic acid | 70 | 7 | 18 | 4 | 1 | −0.77 | Section of alloy(v) |
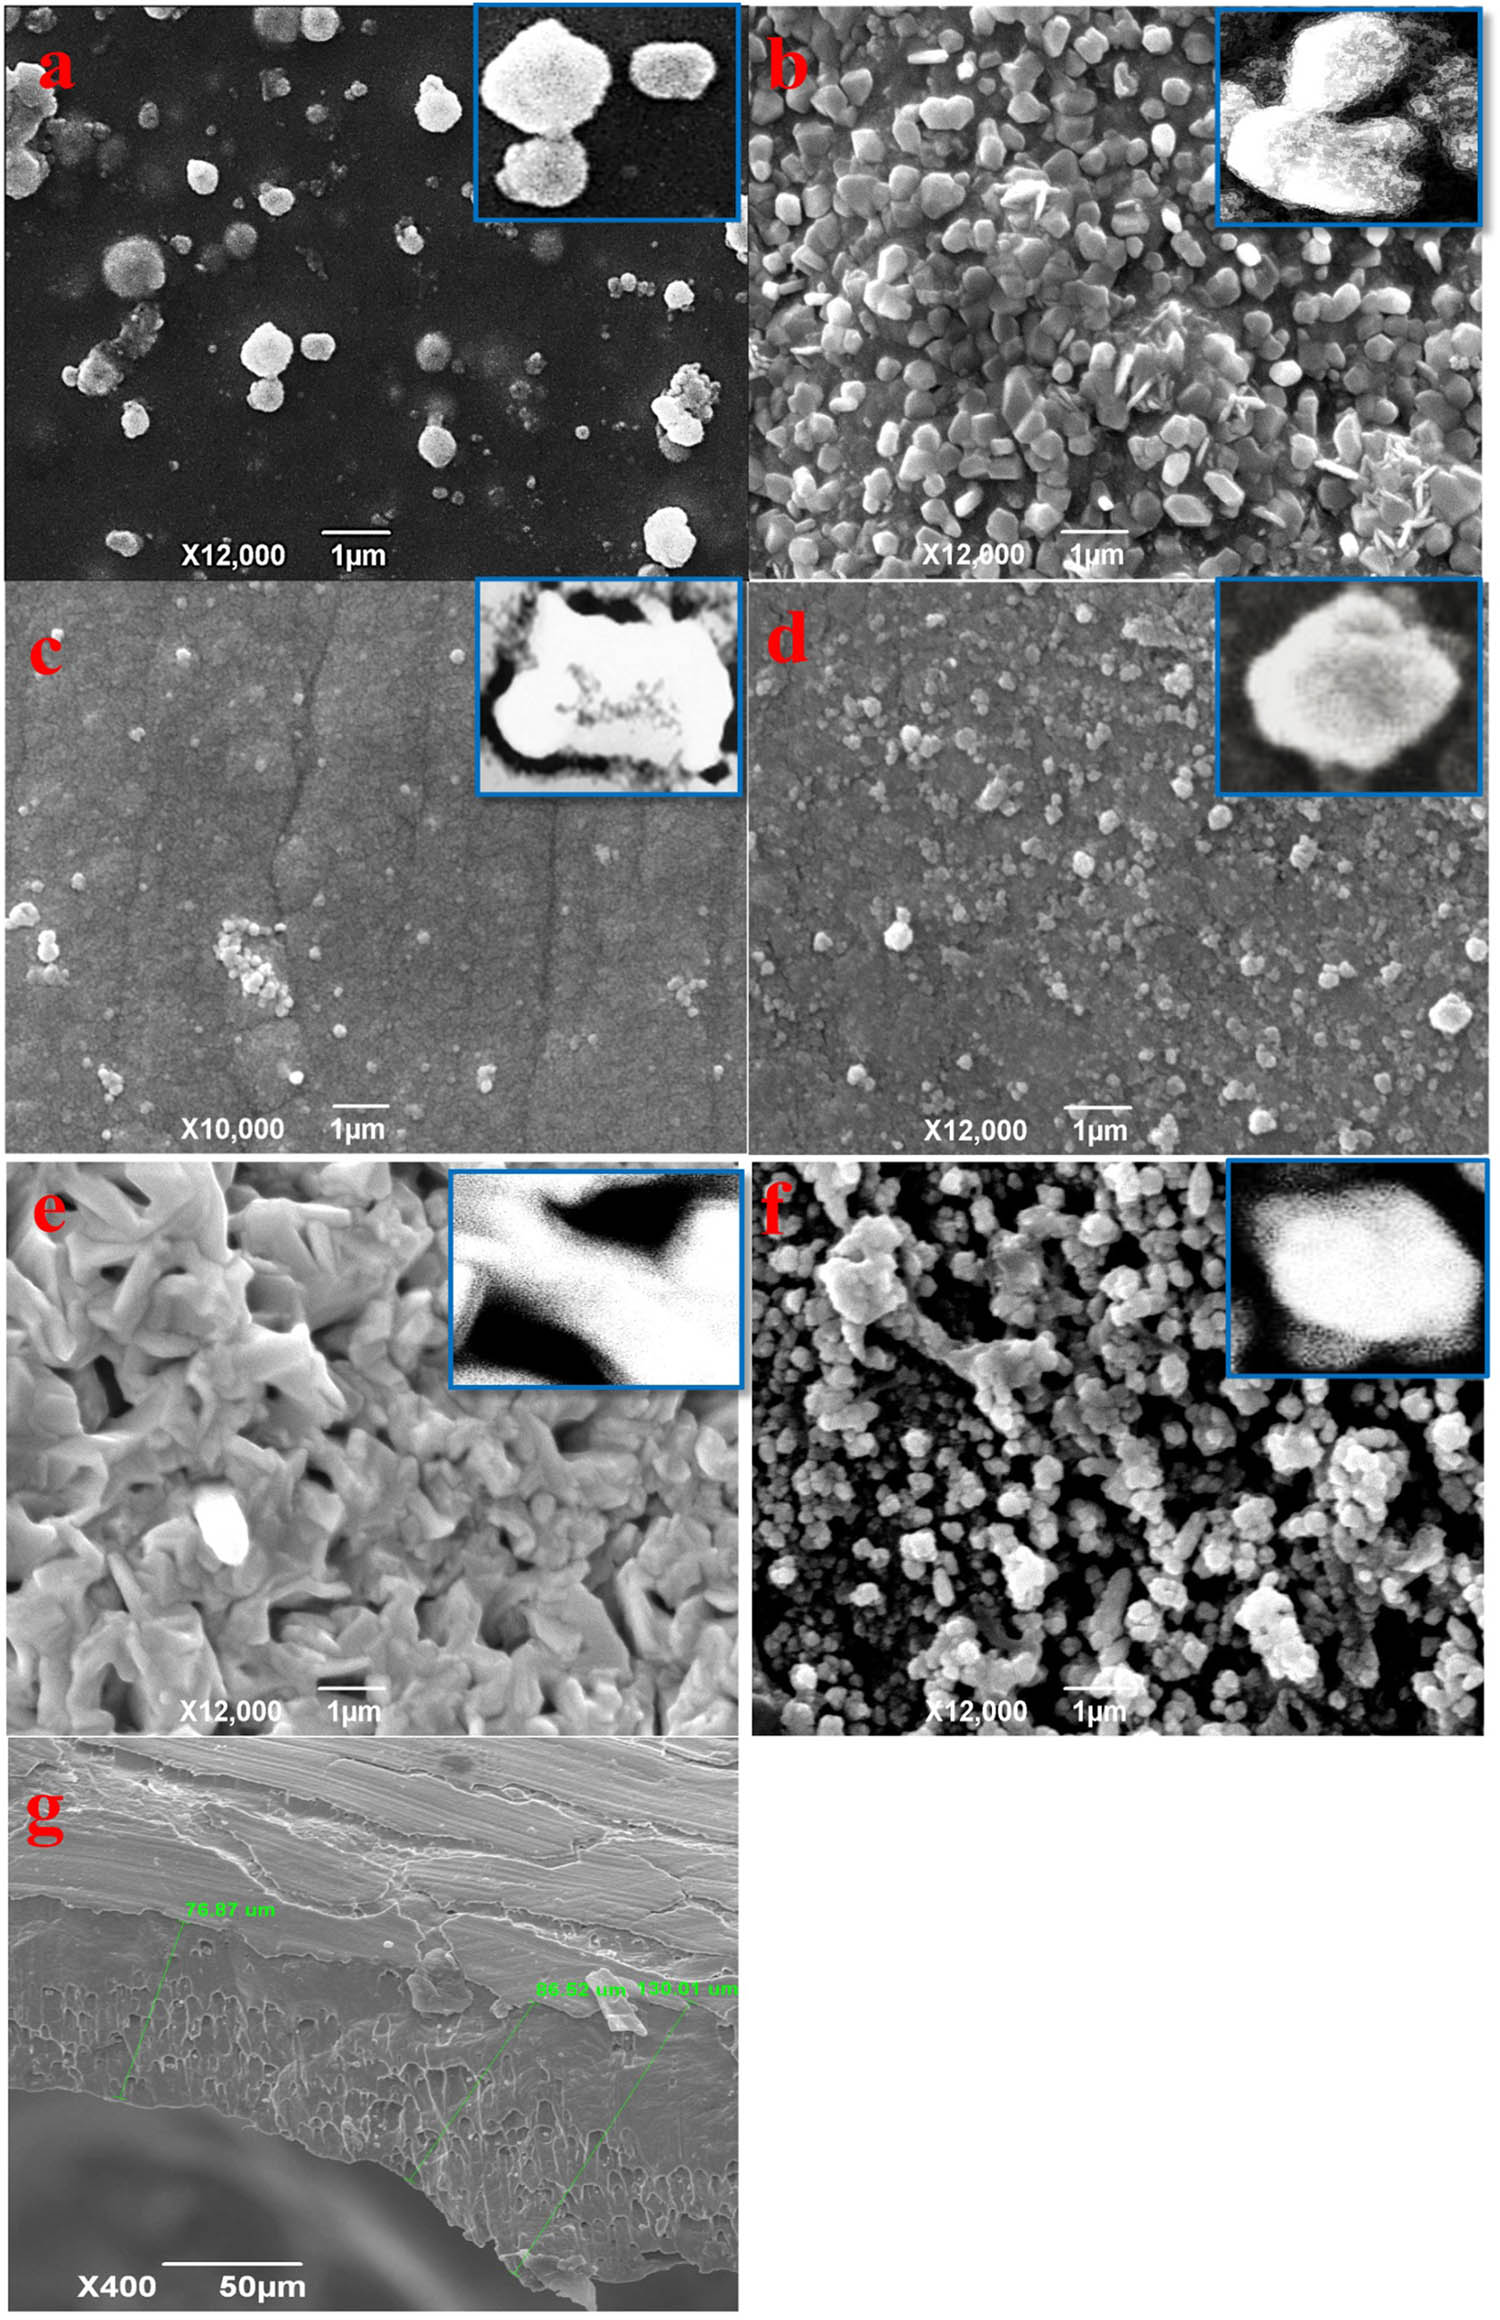
SEM images of Cu–Fe–Ni–Zn–O alloys: (a) Alloy i, (b) Alloy ii, (c) Alloy iii, (d) Alloy iv, (e) Alloy v, (f) the corresponding alloy oxide, and (g) cross-sectional view of Alloy V.
2.2 Structural properties of the prepared nanomaterials
The structural properties of the prepared nanomaterials, before (alloys) and after the combustion process, were investigated using XRD. Figure 4 shows XRD charts for Alloy(v) alloys deposited from different solutions of nickel and iron. Figure 4 displays the XRD pattern for the alloy prepared from the electrolyte: 0.1M NiCl2, 0.1M NiSO4, 0.008M FeCl3 (S1) with 0.01M succinic acid (Alloy v), and after combustion at 950°C (Alloy oxide). Figure 4 clearly demonstrates the polycrystalline nature of all deposited Ni/Fe-based films. For the Alloy(v), peaks related to the Ni/Fe alloy were observed at 2θ = 43.42° (111), 50.52° (200), and 74.21° (220) planes, corresponding to CuNi crystals (JCPDS card No. 00-009-0205); a peak at 2θ = 43.28° (101) for Zn crystals (JCPDS card No. 00-004-0784); peaks at 2θ = 44.47° (110), 52.73° (200), and 76.01° (211), corresponding to Fe crystals (JCPDS card No. 01-081-8767); a peak at 2θ = 43.25° (200) for NiO crystals (JCPDS card No. 04-0835) [32], peaks at 2θ = 35.65° (012), 43.24° (104), and 60.99° (110) corresponding to CuFeO₂ nanoparticles (JCPDS card No. 75-2146). These peaks confirm the presence of Ni/Fe alloy phases. For the alloy oxide after combustion, peaks were observed at 2θ = 30.24° (220), 35.58° (311), 36.35° (222), 43.71° (400), 53.54° (422), 57.12° (511), 62.91° (440), 66.20° (531), 75.28° (533), and 79.34° (444), corresponding to (Fe0.8·Zn0.2)(Ni0.6·Cu0.2·Fe1.2)O4 spinel oxide structure (JCPDS card No. 01-081-8585); peaks at 2θ = 37.23° (111), 43.25° (200), 62.82° (220), 75.28° (311), and 79.43° (222) for NiO crystals (JCPDS card No. 04-0835); and peaks at 2θ = 30.32° (220), 35.52° (311), 37.19° (222), 43.25° (400), 51.30° (511), 62.94° (440), and 75.38° (533) for CuFe2O4 (JCPDS card No. 00-025-0283). These results indicate that the final oxide material is a multi-metal oxide system comprising Cu, Ni, Zn, and Fe integrated into a spinel-like structure.
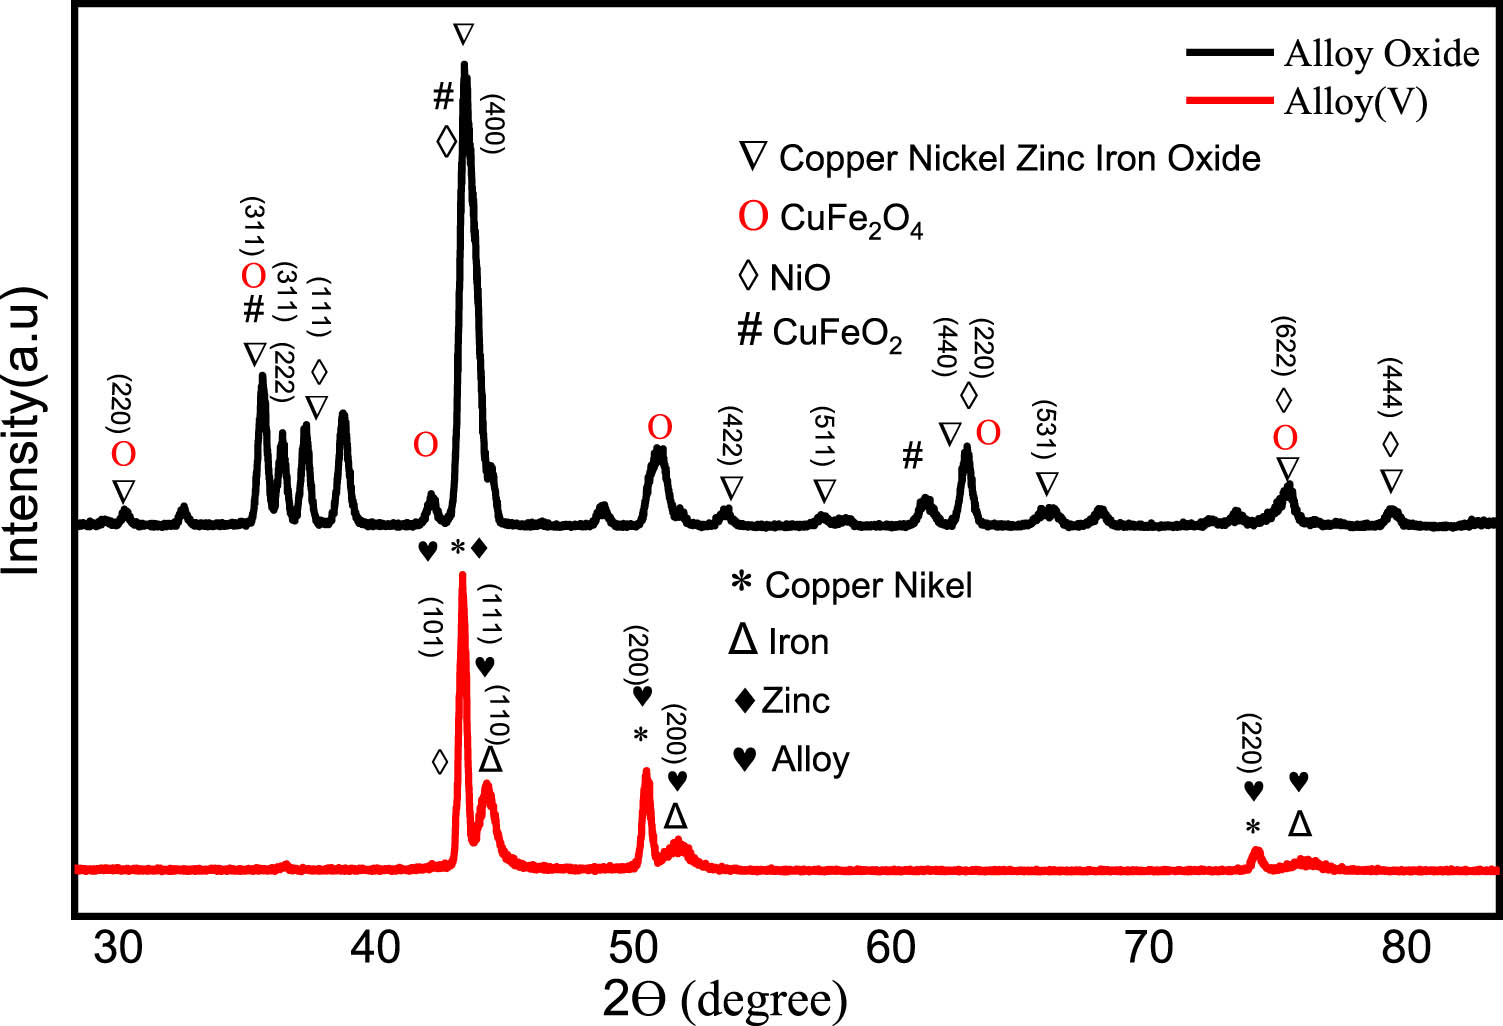
XRD charts for the alloy prepared from where Alloy(v) is, Alloy oxide is Alloy(v) after combustion at 950°C for 20 min.
2.3 XPS
The XPS spectrum presented in Figure 5a–h clearly indicates the presence of several elements, including Ni, Cu, Fe, Zn, and O in the alloy. This observation is consistent with the elemental mapping results discussed earlier. In particular, Figure 5a and g represents Alloy(v), while Figure 5h and n represents Alloy Oxide. Figure 5g and n shows distinct peaks centered at 1022.32 and 1045.40 eV, which can be attributed to Zn2P species. Additionally, Figure 5c and j displays peaks corresponding to CuLM2, and Figure 5f provides detailed XPS spectra of Cu2p. Figure 5d provides detailed XPS spectra of Fe2p spectra, exhibit peaks at 712.5 eV, which can be assigned to Fe ions. Furthermore, the spectrum in Figure 5b reveals high-resolution XPS spectra of O1s, with peaks observed at 529.3, 531.27, and 532.22 eV. After fitting with Gaussian–Lorentzan functions, three peaks are identified. The peak at 529.3 eV corresponds to the lattice oxygen peak in the O1s spectrum of polycrystalline NiO [33,34]. The provided information suggests that in the Ni2p region, there is evidence of bulk metal content supporting the compositional analysis previously discussed. In Figure 5e, the spectra of nickel display a distinct and sharp peak, indicating the presence of metallic nickel. The multiple structures observed in the Ni2p spectra are identical to the spectra reported for NiO. Moving on to Figure 5i, the O1s spectrum of metal oxides displays two peaks. A low binding energy feature is observed at 530.1 eV, which is attributed to the lattice oxygen in metals oxide. Additionally, a high binding energy (HBE) feature is observed at 531.5 eV. In the O1s spectrum of different metal oxides including Cu–Fe–Ni–Zn oxide, the lattice oxygen peak was found at 529.3 eV with an HBE feature at 531.1 eV, as reported by researchers [33,34,35,36,37]. The HBE feature in the O1s spectrum is discussed in the literature to arise from oxygen defects or adsorbed oxygen. Furthermore, in summary, the features observed in the XPS spectra provide evidence that the sample contains Ni, Fe, Cu, and Zn. The high-resolution XPS spectra of O1s were observed and fitted using Gaussian–Lorentzian functions. In Figure 5k, the high-resolution XPS spectra of Fe2p and O1s are displayed. The peaks observed at 724.18 and 709.42 eV can be associated with the characteristic signals of Fe2p1/2 and Fe2p3/2, respectively. Additionally, two broad peaks at 732.16 and 718.4 eV are attributed to satellite peaks of Fe. The Fe2p3/2 peak can be further divided into three distinct peaks at binding energies of 712.9, 710.65, and 709.43 eV, respectively, the presence of these three peaks indicates the presence of Fe–O bonds. These results provide confirmation of the formation of iron oxide within the sample. In Figure 5l, the XPS spectra of nickel exhibit well-defined and sharp peaks, signifying the presence of nickel in multiple oxidation states. The presence of a satellite peak confirms the existence of NiO or another Ni2+ species. Additionally, the observed chemical shifts in the 2p1/2A and 2p3/2A peaks indicate that nickel is present in distinct chemical environments. Figure 5m reveals important information about the oxidation states of copper in the CuFe2O4 sample. Strong Cu2+ satellites can be observed at binding energies of 942.5 and 962.5 eV, in addition to a peak at 934.3 eV. This indicates the presence of Cu2+ in CuFe2O4, as reported in the literature [38,39]. Furthermore, based on the relatively lower peak at 932.1 eV, it can be inferred that there are Cu+ species on the surface of CuFe2O4 [40]. The XPS spectra provide strong evidence for the presence of CuFeO2 in the sample. The Fe2p3/2 peak at 709.43 eV, observed in Figure 5k, indicates the presence of Fe–O bonds, consistent with iron oxide compounds. Additionally, the Cu2p3/2 peak at 934.3 eV, along with satellite peaks at 942.5 and 962.5 eV in Figure 5m, confirms the presence of Cu²⁺ species. The lower peak at 932.1 eV further suggests the existence of Cu+ species, which are characteristic of CuFeO2. The O1s spectrum in Figure 5i shows peaks at 530.1 and 531.5 eV [35,37], corresponding to lattice oxygen in metal oxides and oxygen defects, respectively, aligning with the reported values for CuFeO2. Literature [38,39,40] support these binding energies, specifically for the coexistence of Cu+ and Cu2+ in the structure of CuFeO2. Together, these findings indicate the formation of CuFeO2 within the sample, corroborating the XPS results with the known chemical structure of CuFeO2. The XPS spectra showed the presence of CuFeO2 in the sample. The Fe2p3/2 peak at 709.43 eV, observed in Figure 5k, indicates the presence of Fe–O bonds, consistent with iron oxide compounds. Additionally, the Cu2p3/2 peak at 934.3 eV, along with satellite peaks at 942.5 and 962.5 eV in Figure 5m, confirms the presence of Cu2+ species. The lower peak at 932.1 eV further suggests the existence of Cu+ species, which are characteristic of CuFeO2. The O1s spectrum in Figure 5i shows peaks at 530.1 and 531.5 eV, corresponding to lattice oxygen in metal oxides and oxygen defects, respectively, aligning with the reported values for CuFeO2. Literature [38,39,40] support these binding energies, specifically for the coexistence of Cu+ and Cu2+ in the structure of CuFeO2. Together, these findings indicate the formation of CuFeO2 within the sample. The XPS analysis confirms the formation of the Copper Nickel Zinc Iron Oxide compound through the detection of Fe, Zn, Ni, Cu, and O in their characteristic oxidation states. The Fe 2p spectrum exhibits peaks at 724.18 and 709.42 eV [37], with satellite peaks at 732.16 and 718.4 eV, confirming Fe2+/Fe3+ oxidation states. Zn2+ is identified by peaks at 1022.32 and 1045.40 eV, indicating its substitution in the spinel lattice. Ni2+ is confirmed by a peak at 855.6 eV, while Cu2+ is identified at 934.3 eV, with satellites at 942.5 and 962.5 eV, suggesting Cu–Fe interactions. The O1s spectrum exhibits a peak at 529.3 eV [33,34], characteristic of metal-oxygen bonding in spinel structures. The observed binding energy shifts confirm strong cationic interactions, indicative of a mixed-metal oxide rather than separate oxides. The fitting of Fe, Ni, Cu, and Zn peaks with Gaussian–Lorentzian functions further supports their incorporation in a single-phase ferrite structure.
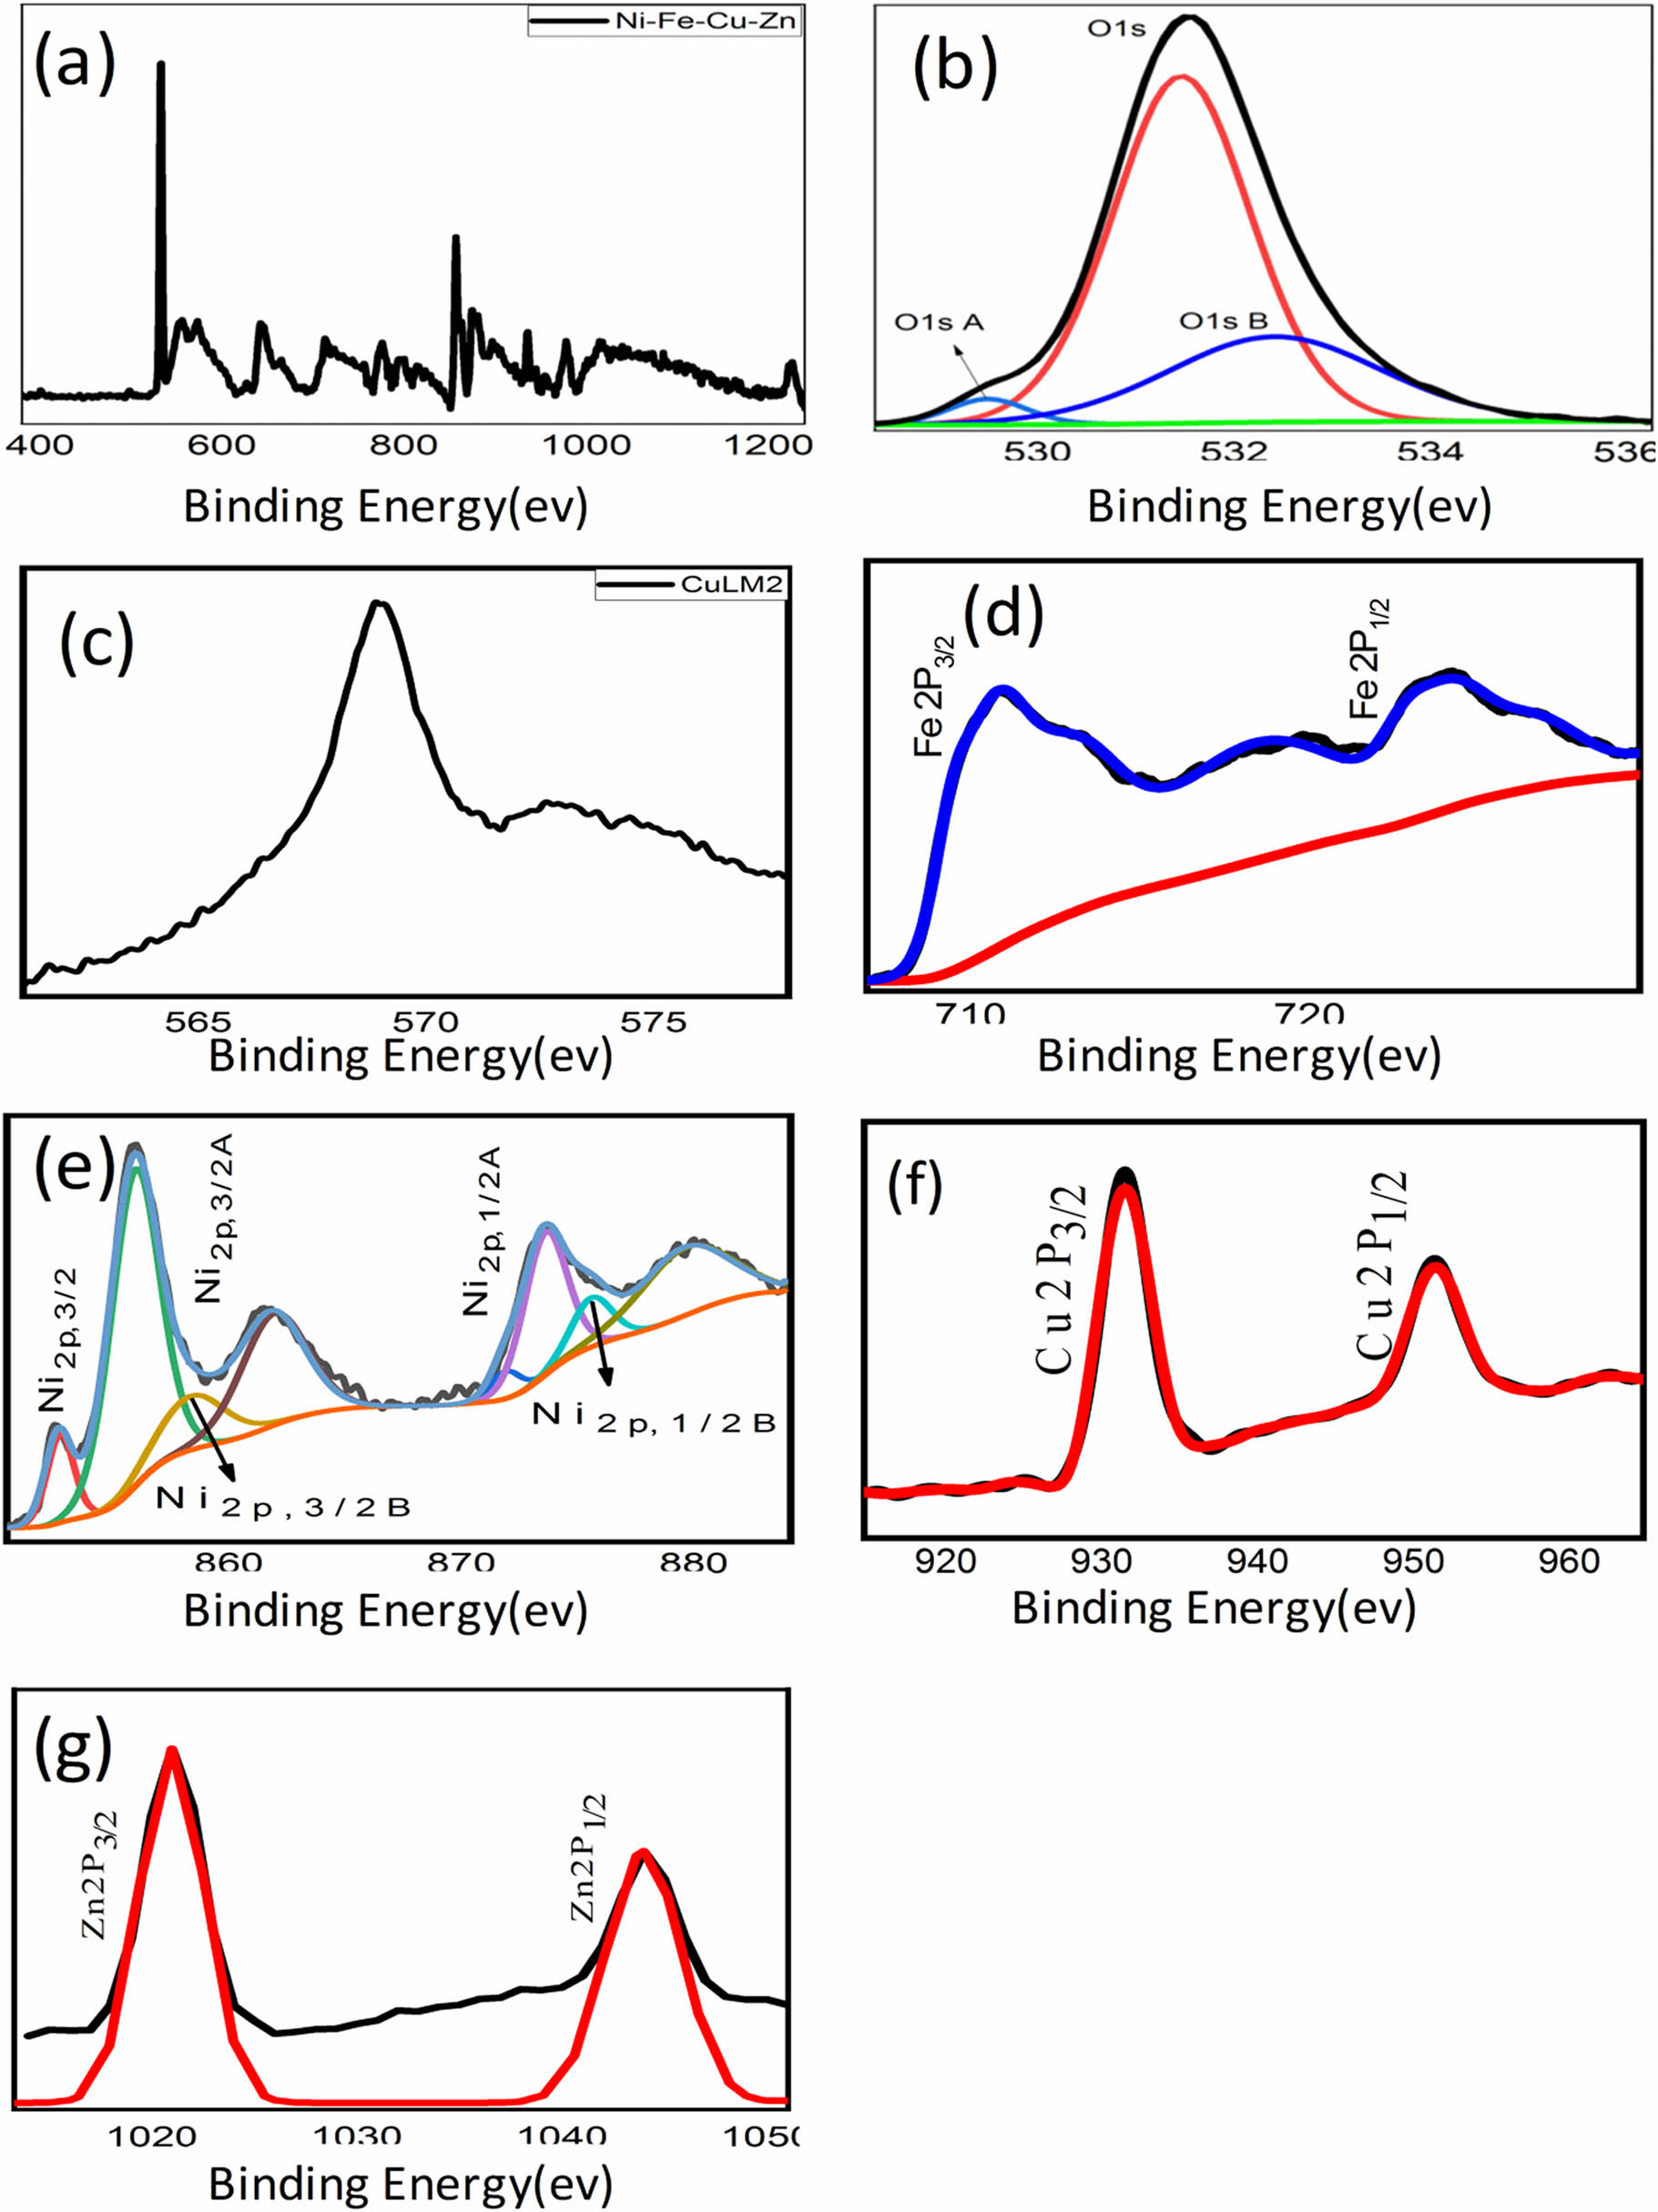
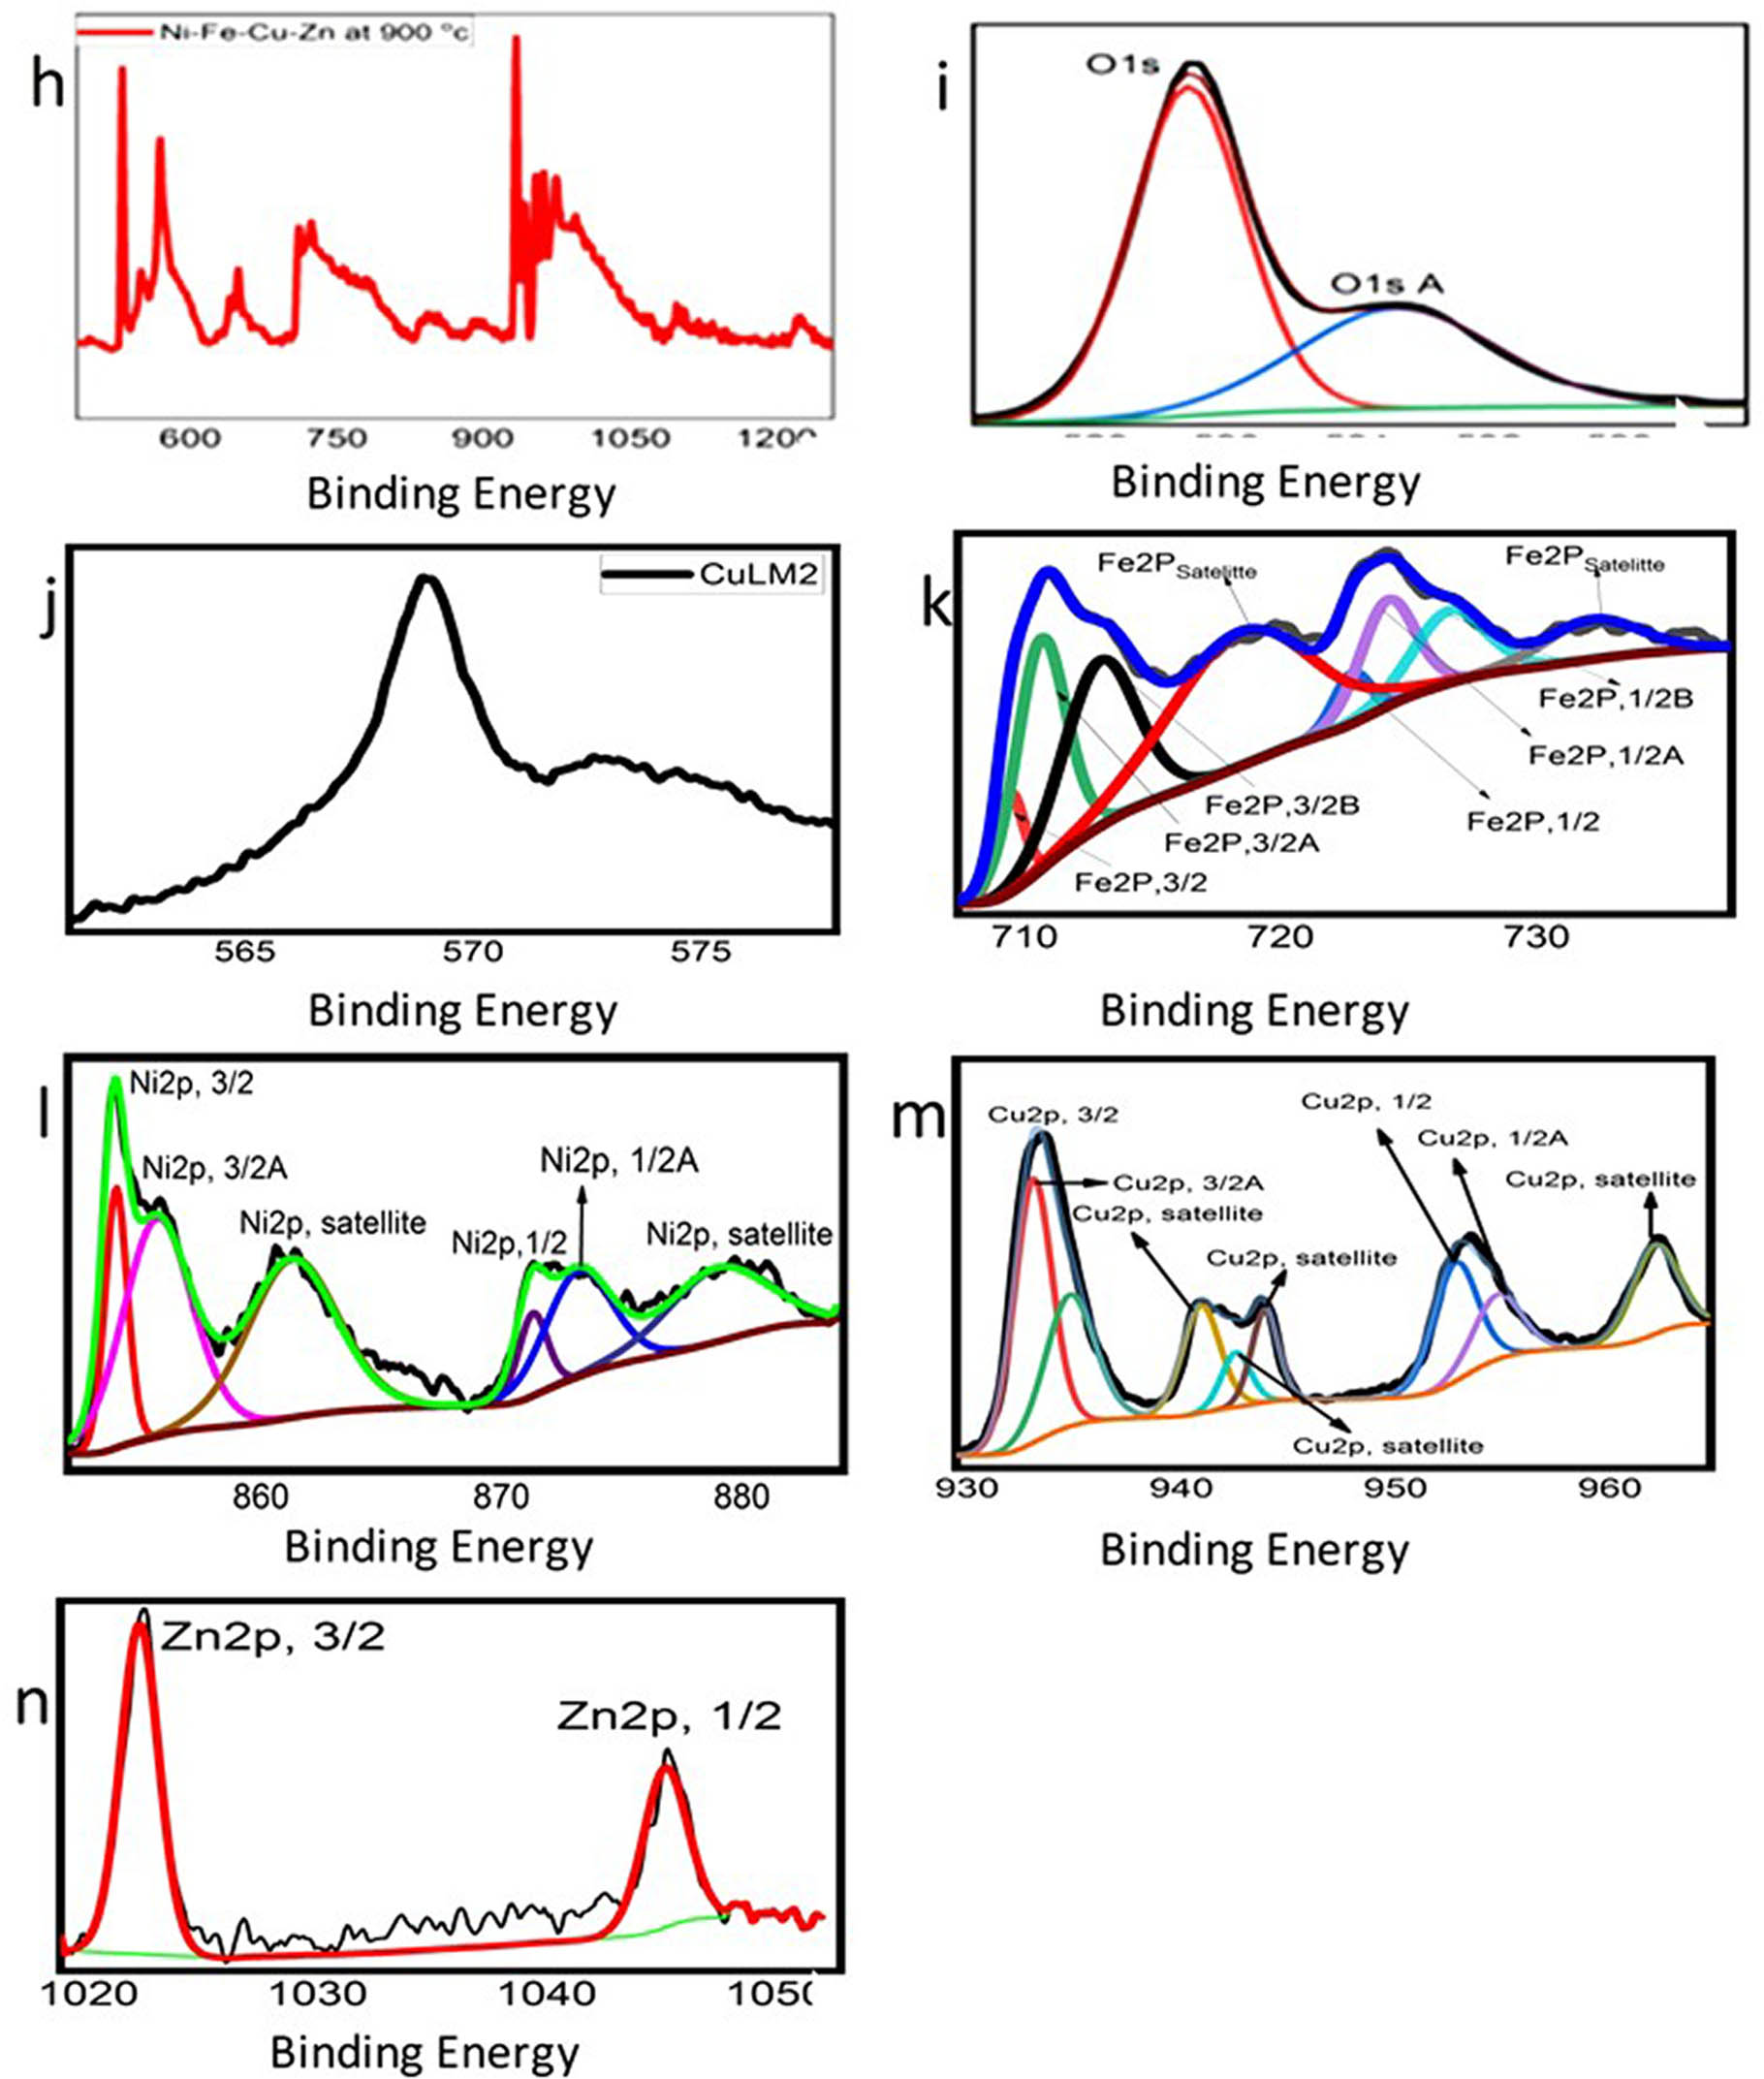
XPS spectrum of the as-prepared Alloy(v): (a) survey spectrum of Ni–Cu–Fe–Zn–O, (b) binding energy spectrum of O(1S,ISA,B), (c) binding energy spectrum of CuLM2, (d) binding energy spectrum of Fe2P, (e) binding energy spectrum of Ni2P(3/2,1/2), (f) binding energy spectrum of Cu2P(3/2,1/2), (g) binding energy spectrum of Zn2P, (h) survey spectrum of alloy oxide for Ni–Cu–Fe–Zn–O, (i) binding energy spectrum of O(1S,ISA), (j) binding energy spectrum of CuLM2, (k) binding energy spectrum of Fe2P(3/2,1/2), (l) binding energy spectrum of Ni2P(3/2,1/2), (m) binding energy spectrum of Cu2P(3/2,1/2), and (n) binding energy spectrum of Zn2P.
2.4 Open-circuit potentials measurements
In an alkaline medium such as 0.5 mol·L−1 NaOH, the OCP reflects the equilibrium between anodic (e.g., metal oxidation or dissolution) and cathodic (e.g., water or proton reduction) surface processes [41,42]. A more negative OCP signifies a surface that is more reducing, indicating that the cathodic reaction specifically HER is thermodynamically more favorable (Figure 6). Therefore, a material exhibiting a lower (more negative) OCP is closer to the HER potential and typically requires less overpotential to initiate hydrogen evolution. In our study, Alloy(v) displayed the most negative steady-state OCP among the five alloys tested. This implies a higher driving force for electron transfer to water molecules, thereby enhancing the tendency for HER to occur on its surface. Additionally, the more negative potential may also indicate a less stable or thinner passive film, which facilitates electron availability for HER instead of passivation [41,42]. In summary, the significantly negative OCP observed for Alloy(v), combined with its known composition and surface characteristics, strongly suggests that it is electrochemically predisposed to promote hydrogen generation, validating our conclusion from the OCP measurements.
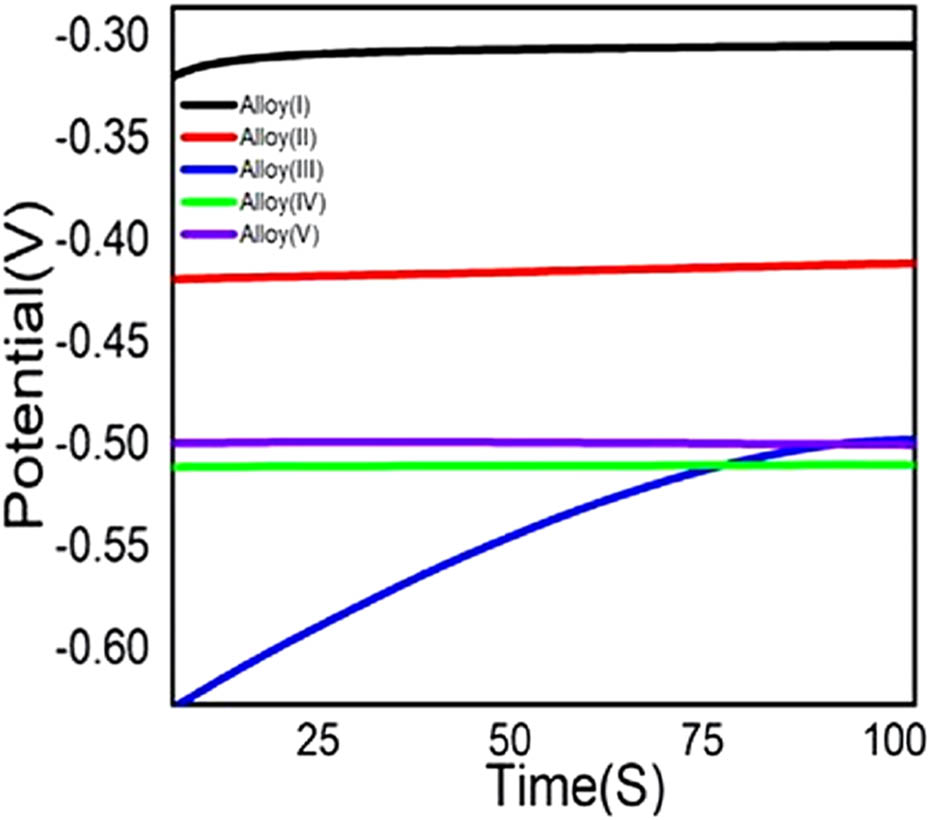
Variation of the open-circuit potential with time for substrate of Alloy(i, ii, iii, iv, v) immersed in stagnant aerated 0.5 mol·L−1 NaOH solution at 25°C.
2.5 Electrocatalytic activities
The Cu–Fe–Ni–Zn–O alloy system demonstrates significant potential for efficient hydrogen gas generation from alkaline media, particularly NaOH solutions. This multimetallic oxide alloy exhibits a synergistic catalytic behavior that enhances the HER by offering a high density of active sites and promoting rapid electron transfer. The presence of nickel and copper oxides contributes to improved electrical conductivity and catalytic activity, facilitating the adsorption and reduction of water molecules. Meanwhile, iron and zinc oxides modulate the electronic structure of the surface, optimizing hydrogen adsorption energy and enhancing overall reaction kinetics. In an alkaline NaOH environment, the HER mechanism typically follows:initially, water molecules are reduced to form adsorbed hydrogen intermediates (H*) and hydroxide ions. These intermediates then combine either electrochemically with another electron and water molecule to form hydrogen gas or recombine directly. The redox-active nature of the alloy, particularly through Fe3+/Fe2+ and Ni3+/Ni2+ transitions, supports continuous electron cycling and catalytic stability. Moreover, the mixed oxide structure enhances corrosion resistance, allowing for long-term operation in harsh alkaline environments. Overall, Cu–Fe–Ni–Zn–O alloys offer a robust, cost-effective platform for green hydrogen generation. HERs can occur in alkaline mediasuch as (NaOH), and the electrochemical polarization (ECP) mechanism plays a crucial role in this case. The HER also proceeds through an ECP mechanism. In an alkaline medium, the hydroxide ions (OH−) are the source of protons for the HER. The overall reaction (2OH− + 2e− → H2O + 2OH− → H2 + 2O2−). Here, two hydroxide ions (OH−) are reduced to produce water (H2O) and generate hydrogen gas (H2) as a product. The reaction proceeds through a similar series of steps. Hydroxide ions are adsorbed onto the electrode surface, followed by electron transfer to form adsorbed hydroxyl radicals (OH*) [42]. These radicals then combine to form water and release hydrogen gas. In an alkaline media, the ECP mechanism governs the HER and involves the adsorption, electron transfer, and desorption of species on the electrode surface. The kinetics and efficiency of the HER in each medium can be influenced by factors such as the electrode material, electrolyte concentration, temperature, and applied potential. Understanding the HER in alkaline medium is crucial for various applications, including hydrogen fuel cells, electrolyzers, and renewable energy storage. By studying the ECP mechanisms in an alkaline medium, researchers can develop efficient electrocatalysts and optimize operating conditions for hydrogen production. In summary, HERs using the electrochemical polarization (ECP) mechanism occur in an alkaline (NaOH) medium. hydroxide ions are reduced in the alkaline medium [42].
The electrocatalytic activity of Cu−Fe−Ni−Zn−O cathodes with varying percentages of Ni and Fe was investigated for HERs in 1M NaOH solution. The experiment involved calibrating the measured potential with respect to the NHE using the Nernst equation. The experimentally measured potential versus Ag/AgCl, E Ag/AgCl, was calibrated with respect to the NHE (normal/standard hydrogen electrode), E NHE, according to the Nernst equation [42]. Figure 7(a) shows the data, indicating that Alloy(v) exhibits higher activity for HER compared to Alloy(i, ii, iii, iv). The rate of HER is directly proportional to the cathodic current density, and Alloy(v) demonstrates the highest current density for hydrogen production, measuring 1.57 A·cm−2 at a potential of 2.506 V in alkaline medium (1M NaOH). The enhanced activity of Alloy(v) can be attributed to its nanoporous structure, which provides a higher surface area to volume ratio. Additionally, the synergistic combination of Cu, Ni, Fe, Zn, and O in Alloy(v) contributes significantly to its HER activity. The increased content of iron and nickel in the alloy may also enhance the hydrogen evolution rate due to the structural and morphological properties, such as the reticular form of Alloy(v) and the presence of nano-granular structures on the surface, which result in a rough and high surface area. In the case of Alloy(i), it exhibits the lowest HER production rate as it has the lowest ratio of Ni and Fe in its structure and on its surface. Table 3 provides estimated current densities for different electrodes at various potential values and in different mediums. The results from Figure 7 and Table 3 indicate that an increase in Fe% and Ni% leads to higher current density and, consequently, an increased rate of hydrogen production. Furthermore, applying higher potentials also increases the rate of hydrogen production, as mentioned in the literature [42]. In summary, the findings suggest that Alloy(v) is the most effective for HER, exhibiting higher current densities in alkaline mediums. Figure 7(b) shows the stability and hydrogen production efficiency of the alloy in 1M NaOH over time. The current density gradually increases and stabilizes around 1.2 A·cm−2, indicating consistent electrochemical performance. This stable current density reflects the alloy’s ability to produce hydrogen efficiently through the HER. The absence of significant drops in current density suggests excellent chemical and structural stability of the alloy, even in a highly alkaline environment. Minor fluctuations observed in the graph are likely caused by gas bubble formation during the HER process, which is a typical phenomenon. Despite these fluctuations, the alloy maintains its activity, proving its reliability for long-term use. This high stability and hydrogen production efficiency make the alloy suitable for water splitting applications. Overall, the results highlight the alloy’s potential as a durable and effective hydrogen evolution catalyst.
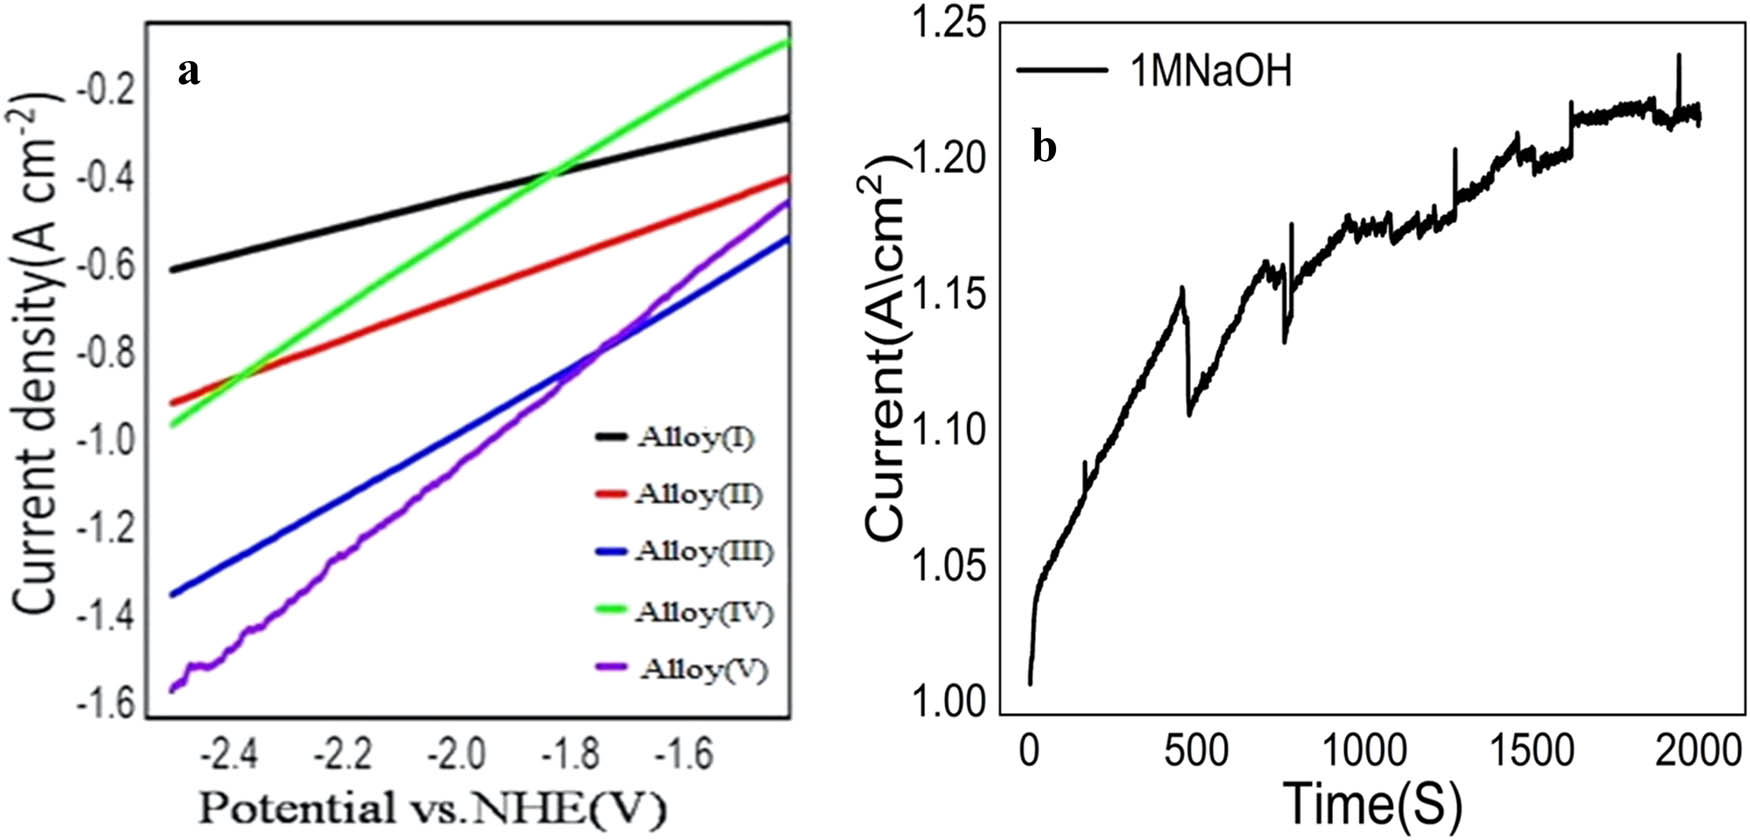
Cathodic polarization for electrodeposited Alloy(i, ii, iii, iv, v): (a) immersed in stagnant aerated (1 mol·L−1) NaOH solution at 25°C, NHE (normal/standard hydrogen electrode), (b) relation between time (s) and current density (mA·cm−2) to study the stability of Alloy(i).
Values of H2 evolution rate of deposited Cu–Fe–Ni–Zn–O alloys dipped in 1 mol L−1NaOH solution at 25°C
| Materials | I −2.506V (A·cm−2) | I −2.3V (A·cm−2) | I −2.1 V (A·cm−2) | I −1.9V (A·cm−2) | I −1.7V (A·cm−2) |
|---|---|---|---|---|---|
| Medium | NaOH | NaOH | NaOH | NaOH | NaOH |
| Alloy(i) | −0.61 | −0.54 | −0.48 | −0.41 | 0.29 |
| Alloy(ii) | −0.95 | −0.78 | −0.61 | −0.44 | 0.34 |
| Alloy(iii) | −0.91 | −0.82 | −0.72 | −0.61 | 0.54 |
| Alloy(iv) | −1.35 | −1.2 | −1.06 | −0.90 | 0.75 |
| Alloy(v) | −1.57 | −1.38 | −1.17 | −0.96 | 0.75 |
2.6 Electrochemical impedance spectroscopy (EIS) analysis
EIS was employed to validate the electrochemical polarization (ECP) measurements and to investigate the HER kinetics of the electroplated Ni–Fe alloys deposited on brass foil. The EIS measurements were conducted using a galvanostat/potentiostat frequency analyzer coupled with an Autolab 10 potentiostat (Radiometer PGZ100) controlled by software version 4. Figure 8a displays the Nyquist plots for Alloy(i), Alloy(ii), Alloy(iii), Alloy(iv), and Alloy(v), recorded at potentials relevant to hydrogen evolution. All the investigated alloys exhibited depressed capacitive semicircles, which are characteristic of non-ideal electrochemical interfaces, possibly due to surface roughness or heterogeneities in the alloy coatings. The diameter of the semicircles, which corresponds to the charge transfer resistance (R ct), varied significantly among the different alloy electrodes. A smaller semicircle radius indicates a lower Rct and thus reflects more rapid electron transfer kinetics and superior electrocatalytic activity toward the HER. Among the tested electrodes, Alloy(v) displayed the smallest semicircle diameter, indicating the lowest Rct and therefore the most efficient catalytic behavior for hydrogen evolution, while Alloy(iv) also demonstrated excellent HER activity but was slightly less efficient than Alloy(v). In contrast, Alloy(i) and Alloy(ii) exhibited the largest semicircle diameters, implying higher R ct values and slower HER kinetics. Moreover, the Warburg impedance (σ), evident as a linear slope at lower frequencies, revealed mass transport effects associated with hydrogen ion diffusion and gas bubble detachment at the electrode surface; lower σ values suggest enhanced diffusion processes and fewer transport limitations during HER. Repeated EIS measurements under prolonged HER conditions revealed that Alloy(v) and Alloy(iv) maintained consistent Nyquist plots with negligible changes in semicircle diameter, confirming their excellent electrochemical stability during hydrogen production. Conversely, Alloy(i) and Alloy(ii) showed increases in semicircle diameters upon repeated cycling, indicating a progressive increase in Rct and suggesting possible surface degradation or loss of active catalytic sites. Thus, Alloy(v) emerged as the most promising electrocatalyst among the studied Ni–Fe alloys, combining the lowest Rct, minimal Warburg impedance, and high operational stability, which are all critical parameters for efficient and durable HER performance. A comparative summary of the measured electrochemical parameters for all alloys is presented in Table 4, highlighting the superior performance of Alloy(v) in terms of both activity and stability.
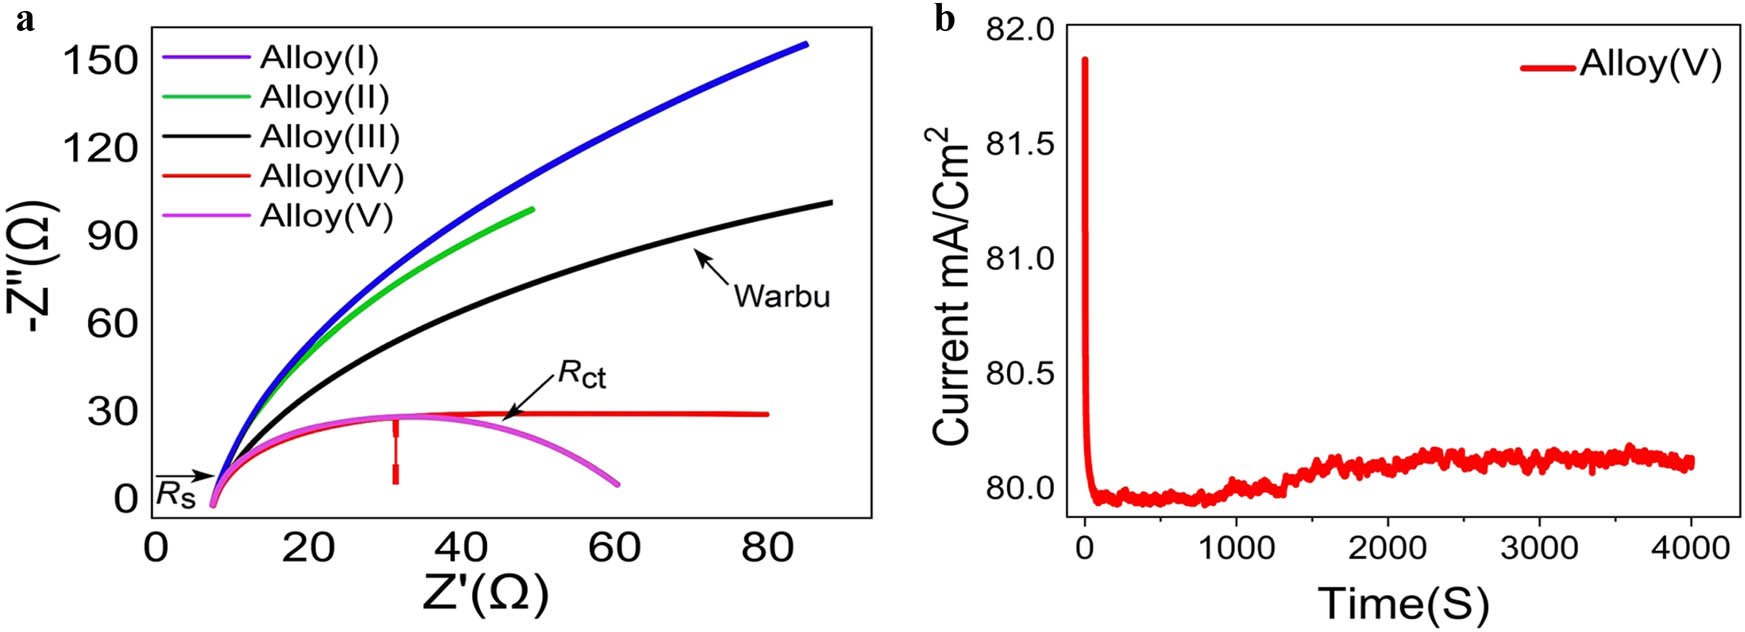
(a) Nyquist plots of electroplated Ni–Fe/Brass foil alloy electrodes (Alloy i, ii, iii, iv, and v), (b) chronoamperometry stability test for Alloy v.
EIS parameters and HER performance comparison of Ni–Fe/brass alloys
| Alloy | R s (Ω) | R ct (Ω) | σ (Ω·s−1/2) | HER performance |
|---|---|---|---|---|
| Alloy(v) | 2.1 | 18.2 | 6.5 | Excellent |
| Alloy(iv) | 2.3 | 24.7 | 8.3 | Very good |
| Alloy(iii) | 2.0 | 35.9 | 10.9 | Moderate |
| Alloy(ii) | 2.5 | 45.2 | 13.7 | Poorer |
| Alloy(i) | 2.4 | 52.8 | 15.4 | Poorest |
To further verify the electrochemical stability of Alloy(v) during the HER, a chronoamperometric measurement was conducted by recording the current density as a function of time under a constant applied potential corresponding to HER conditions. Figure 8b shows the current–time curve for Alloy(v), the experiment revealed an initial rapid decrease in current density during the first few seconds, which is commonly attributed to double-layer charging, surface restructuring, and the removal of adsorbed hydrogen bubbles from the electrode surface, all of which contribute to stabilizing the electrode–electrolyte interface. Following this brief initial transient, the current density plateaued and remained nearly constant at approximately 80.0 mA·cm−2 over an extended period exceeding 4,000 s, with only minimal fluctuations within ±0.5 mA·cm−2. This steady-state behavior indicates that Alloy(v) maintains its catalytic activity without significant degradation, dissolution, or loss of active sites during prolonged HER operation. Such stability is critical for practical applications, as it ensures sustained hydrogen production efficiency over time. The chronoamperometric results are consistent with the EIS measurements, where Alloy(v) exhibited the lowest charge transfer resistance (R ct) and the smallest Warburg impedance coefficient (σ), confirming both its high intrinsic catalytic activity and its durability under electrochemical stress. Therefore, the combination of low R ct, minimal diffusion limitations, and excellent current retention during long-term HER electrolysis positions Alloy(v) as a highly promising and stable electrocatalyst for hydrogen production applications.
2.7 Effect of light intensity on the alloy oxide as a photodetector
The effect of light intensity on the photodetection capabilities of the Cu–Fe–Ni–Zn–O burning NPs alloy material was investigated. The tests were conducted using a solar simulator with a power density of 400 mW·cm−2 in solution of 0.2M Na2SO4. The current density (J ph) values were measured under both dark and light conditions. In the absence of light, the J ph value was found to be 23 mA·cm−2 at potential 1 V, as shown in Figure 9, while under light conditions, it significantly increased to 68.45 mA·cm−2 at potential 1 V. The high current density under light exposure is primarily due to the photoexcitation of electrons. Upon illumination, the alloy oxide absorbs photons, which excite electrons from the valence band to the conduction band, generating electron–hole pairs (e⁻–h⁺) [43,44]. This absorption can be attributed to the composition of the alloy oxide, which includes materials like NiO and CuO, known for their ability to harness visible light effectively and for photocatalytic applications. Efficient charge separation and minimized recombination is critical for achieving high photocurrent.
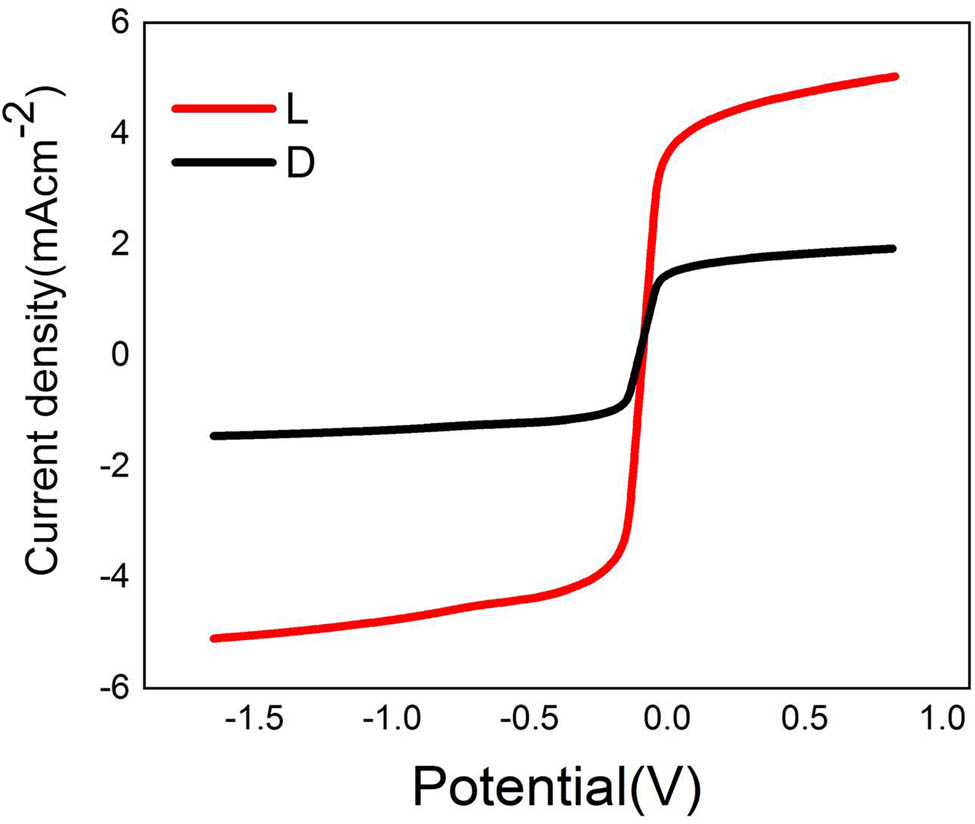
Effect of light intensity on the alloy oxide Cu–Fe–Ni–Zn–O.
The alloy composition with Ni, Cu, and Fe can enhance charge separation and prolong the life of photogenerated carriers. For instance, Fe and Ni sites can trap holes temporarily, thus helping maintain separated e⁻–h⁺ pairs and reducing recombination [43], [44]. This process can be facilitated further by the layered microstructure observed in alloys with rough and agglomerated surfaces, as these can increase the surface area and provide additional active sites for hydrogen evolution. Alloy oxide composition and structure also play an essential role in charge transport. Nickel and copper oxides, for example, have suitable band gaps for visible light absorption, enhancing the alloy’s capability to act as a photoelectrode under solar conditions. This substantial increase in J ph when exposed to light indicates that the Cu–Fe–Ni–Zn–ONPs alloy material is an efficient photodetector.
2.8 Conclusion
Different characterization techniques confirmed the structural and electrochemical properties of the prepared Ni–Fe alloys. Cyclic voltammetry revealed that the optimal Fe/Ni ratio resulted in the thickest alloy layer, while succinic acid significantly enhanced deposition efficiency lowering the reduction potential to –0.77 mV and increasing the peak current to –18 mA. EDX analysis confirmed the high purity of the electrodes. Electrochemical testing using ECP showed that Alloy(v) achieved the highest hydrogen evolution activity, with a current density of 1.57 A·cm−2 at 2.506 V in 1M NaOH, highlighting its efficiency as an HER electrocatalyst. Additionally, the thermally oxidized alloy showed excellent performance as a photodetector, achieving a photocurrent density of 68.45 mA·cm−2 under 400 mW·cm−2 illumination.
Acknowledgments
Dr. Mohammad H. BinSabt gratefully acknowledges the resources of the research sector projects unit (RSPU) general facilities of the Faculty of Science (GFS) (GS01/01, GS01/05, GS02/08), Nanotechnology Research Facility (KUNRF) of the College of Engineering and Petroleum (GE01/07) and Chemistry department at Kuwait University for the use of scanning electron microscopy (SEM).
-
Funding information: Authors state no funding involved.
-
Author contributions: Validation and investigation: Islam Kholidy. Methodology, validation, supervision, investigation, writing – review and editing: Muhammad Hussain Bin Sabt, Mohamed Rabia. Methodology, validation, investigation, writing – review and editing: Hanafy Mahmoud Abd El-Salam, Mohamed Shaban.
-
Conflict of interest: The authors state no conflict of interest.
-
Data availability statement: All data generated or analyzed during this study are included in this published article.
References
[1] Mahdavi S, Allahkaram SR. Composition, characteristics and tribological behavior of Cr, Co-Cr and Co-Cr/TiO2 nano-composite coatings electrodeposited from trivalent chromium based baths. J Alloy Compd. 2015;635:150–7. 10.1016/j.jallcom.2015.02.119.Search in Google Scholar
[2] El Awadi GA. Review of effective techniques for surface engineering material modification for a variety of applications. AIMS Mater Sci. 2023;10(4):652–92. 10.3934/matersci.2023037.Search in Google Scholar
[3] Bhat RS, Nagaraj P, Priyadarshini S. Zn–Ni compositionally modulated multilayered alloy coatings for improved corrosion resistance. Surf Eng. 2021;37(12):1430–7. 10.1080/02670844.2020.1812479.Search in Google Scholar
[4] Hong B, Jiang CH, Wang XJ. Texture of electroplated copper film under biaxial stress. Mater Trans. 2006;47(9):2299–301. 10.2320/matertrans.47.2299.Search in Google Scholar
[5] Guan T, Zhang N. Recent advances in electrodeposition of nickel-based nanocomposites enhanced with lubricating nanoparticles. Nanomanuf Metrol. 2024;7(1):25. 10.1007/s41871-024-00245-6. Search in Google Scholar
[6] Chandrasekar MS, Pushpavanam M. Pulse and pulse reverse plating-Conceptual, advantages and applications. Electrochim Acta. 2008;53(8):3313–22. 10.1016/j.electacta.2007.11.054.Search in Google Scholar
[7] Sajjadnejad M, Mozafari A, Omidvar H, Javanbakht M. Preparation and corrosion resistance of pulse electrodeposited Zn and Zn-SiC nanocomposite coatings. Appl Surf Sci. 2014;300:1–7. 10.1016/j.apsusc.2013.12.143.Search in Google Scholar
[8] Torabinejad V, Aliofkhazraei M, Assareh S, Allahyarzadeh MH, Rouhaghdam AS. Electrodeposition of Ni–Fe alloys, composites, and nano coatings – A review. J Alloy Compd. 2017;693:1238–61. 10.1016/j.jallcom.2016.08.329.Search in Google Scholar
[9] Okonkwo BO, Jeong C, Jang C. Advances on Cr and Ni electrodeposition for industrial applications – a review. Coatings. 2022;12(10):1555. 10.3390/coatings12101555.Search in Google Scholar
[10] Giurlani W, Zangari G, Gambinossi F, Passaponti M, Salvietti E, Di Benedetto F, et al. Electroplating for decorative applications: Recent trends in research and development. Coatings. 2018;8(8):260. 10.3390/coatings8080260.Search in Google Scholar
[11] Bagaria SK, Periasamy C. Magnetic properties of electro formed Ni and Ni Fe for micromagnetic MEMS applications. J Supercond Nov Magn. 2015;28:3357–63. 10.1007/s10948-015-3168-5.Search in Google Scholar
[12] Bao M, Wang W. Future of microelectromechanical systems (MEMS). Sens. Actuators, A. 1996;56(1–2):135–41. 10.1016/0924-4247(96)01274-5.Search in Google Scholar
[13] Myung NV, Park DY, Yoo BY, Sumodjo PTA. Development of electroplated magnetic materials for MEMS. J Magn Magn Mater. 2003;265(2):189–98. 10.1016/S0304-8853(03)00264-6.Search in Google Scholar
[14] Bari GADI. Electrodeposition of nickel, modern electroplating: fifth edition. Hoboken, NJ, USA: John Wiley & Sons, Inc.; 2011. p. 79–114. 10.1002/9780470602638.ch3.Search in Google Scholar
[15] Gezerman AO, Corbacioglu BD. Analysis of the characteristics of nickel-plating baths. Int J Chem. 2010;2(2):36–44. 10.5539/ijc.v2n2p124.Search in Google Scholar
[16] Horkans J. Effect of plating parameters on electrodeposited NiFe. J Electrochem Soc. 1981;128(1):45–9. 10.1149/1.2127385.Search in Google Scholar
[17] Myung NV, Nobe K. Electrodeposited iron group thin-film alloys: structure-property relationships. J Electrochem Soc. 2001;148(3):C136. 10.1149/1.1345875.Search in Google Scholar
[18] Wu Y, Chang D, Kim D, Kwon S-C. Influence of boric acid on the electrodepositing process and structures of Ni–W alloy coating. Surf Coat Technol. 2003;173(2–3):259–64. 10.1016/S0257-8972(03)00449-3.Search in Google Scholar
[19] Tsuru Y, Nomura M, Foulkes FR. Effects of boric acid on hydrogen evolution and internal stress in films deposited from a nickel sulfamate bath. J Appl Electrochem. 2002;32(6):629–34. 10.1023/A:1020130205866.Search in Google Scholar
[20] Zech N, Landolt D. The influence of boric acid and sulfate ions on the hydrogen formation in Ni–Fe plating electrolytes. Electrochim Acta. 2000;45(21):3461–71. 10.1016/S0013 4686(00)00415 1.Search in Google Scholar
[21] Gadad S, Harris TM. Oxygen incorporation during the electrodeposition of Ni, Fe, and Ni–Fe alloys. J Electrochem Soc. 1998;145( 11):3699–703. 10.1149/1.1838861.Search in Google Scholar
[22] Oriňáková R, Turoňová A, Kladeková D, Gálová M, Smith RM. Recent developments in the electrodeposition of nickel and some nickel-based alloys. J Appl Electrochem. 2006;36(9):957–72. 10.1007/s10800-006-9162-7.Search in Google Scholar
[23] Wei Su C, Jiao He F, Ju H, Bin Zhang Y, Li Wang E. Electrodeposition of Ni, Fe and Ni–Fe alloys on a 316 stainless steel surface in a fluorborate bath. Electrochim Acta. 2009;54(26):6257–63. 10.1016/j.electacta.2009.05.076.Search in Google Scholar
[24] Afshar A, Dolati AG, Ghorbani M. Electrochemical characterization of the Ni-Fe alloy electrodeposition from chloride-citrate-glycolic acid solutions. Mater Chem Phys. 2003;77(2):352–8. 10.1016/S0254-0584(02)00017-2.Search in Google Scholar
[25] Ghorbani M, Dolati AG, Afshar A. Electrodeposition of Ni-Fe alloys in the presence of complexing agents. Russ J Electrochem. 2002;38(11):1173–7. 10.1023/A:1021141524584.Search in Google Scholar
[26] Zhou Y, Wang Z, Cui M, Wu H, Liu Y, Ou Q, et al. NiFe‐based electrocatalysts for alkaline oxygen evolution: Challenges, strategies, and advances toward industrial‐scale deployment. Adv Funct Mater. 2024;34:2410618. 10.1002/adfm.202410618.Search in Google Scholar
[27] Shetty S. Electrodeposition and characterization of Ni–Mo alloy as an electrocatalyst for alkaline water electrolysis. J Electroanal Chem. 2017;796:1–9. 10.1016/j.jelechem.2017.05.002.Search in Google Scholar
[28] Alnuwaiser MA, Rabia M, Elsayed A. M, Katkar P. K. Paving the way for commercial hydrogen generation from natural and artificial seawater based on photocathode of manganese(II) oxide–manganese(IV) oxide/poly 1H pyrrole nanocomposite seeded on additional poly 1H pyrrole film. Int J Energy Res. 2025;11:9369233. 10.1155/ER/9369233.Search in Google Scholar
[29] Rabia M, Alnuwaiser MA. One pot fabrication of highly porous morphology of ferric oxide ferric oxychloride/poly O chloroaniline nanocomposite seeded on poly 1H pyrrole: Photocathode for green hydrogen generation from natural and artificial seawater. Open Chem. 2025;23(1):20240123,1–11. 10.1515/CHEM 2024 0123.Search in Google Scholar
[30] Alkallas FH, Trabelsi ABG, Rabia M, Boshagh F. Rod-structured manganese oxides/poly-3-methyl benzene amine photocathode without a sacrificial agent for hydrogen production. Int J Energy Res. 2025;2025:9031508. 10.1155/ER/9031508 E.Search in Google Scholar
[31] Aldosari E, Rabia M, Zhang Q, Altilasi HH, Trabelsi ABG, Alkallas FH. Single-step fabrication of Mn(IV) oxide–Mn(II) sulfide/poly-2-mercaptoaniline porous network nanocomposite for pseudo-supercapacitors and charge storage. Open Phys. 2025;23(1):1–11. 10.1515/phys-2025-0132.Search in Google Scholar
[32] Menaka SM, Umadevi G, Maheswari AU. Spray deposition and characterization of p-type Li doped NiO Thin films. Int J Thin Films Sci Tec. 2019;8(2):61–6. 10.18576/ijtfst/080205.Search in Google Scholar
[33] Biesinger MC, Lau LWM, Gerson AR, Smart RSC. The role of the auger parameter in XPS studies of nickel metal, halides and oxides. Phys Chem Chem Phys. 2012;14(7):2434–42. 10.1039/c2cp22419d.Search in Google Scholar
[34] Dubey P, Ravrupesh AN, Devan S, Okram GS, Kuod YK. The effect of stoichiometry on the structural, thermal and electronic properties of thermally decomposed nickel oxide. RSC Adv. 2018;8:5882. 10.1039/c8ra00157.Search in Google Scholar
[35] Ratcliff E L, Meyer J, Steirer KX, Garcia A, Berry JJ, Ginley DS, et al. Evidence for near-surface NiOOH species in solution-processed NiOx selective interlayer materials: impact on energetics and the performance of polymer bulk heterojunction photovoltaics. Chem Mater. 2011;23(22):4988–5000. 10.1021/cm202296p.Search in Google Scholar
[36] Biesinger M C, Payne BP, Lau LWM, Gerson A, Smart RSC. X ray photoelectron spectroscopic chemical state quantification of mixed nickel metal, oxide and hydroxide systems. Surf Interface Anal. 2009;41(4):324–32. 10.1002/sia.3026.Search in Google Scholar
[37] Valentine JG, Street RA, Bradley DDC, Silva SRP, Amaratunga GAJ. X ray photoelectron spectroscopic investigation of plasma enhanced chemical vapor deposition and electrocatalytic characterization of pure NiOₓ and NiOₓ(OH)ᵧ. J Phys Chem C. 2017;121(12):6521–30. 10.1021/acs.jpcc.6b12652.Search in Google Scholar
[38] Huang L, Peng F, Ohuchi FS. In situ’ XPS study of band structures at Cu2O/TiO2 heterojunctions interface. Surf Sci. 2009;603(17):2825–34. 10.1016/j.susc.2009.07.030.Search in Google Scholar
[39] Ai Z, Zhang L, Lee S, Ho W. Interfacial hydrothermal synthesis of Cu@Cu2O core - Shell microspheres with enhanced visible-light-driven photocatalytic activity. J Phys Chem C. 2009;113(49):20896–902. 10.1021/jp9083647.Search in Google Scholar
[40] Liu Y, Zhang H, Fu W, Yang Z, Li Z. Characterization of temperature sensitivity of V-modified CuFe2O4 ceramics for NTC thermistors. J Mater Sci: Mater Electron. 2018;29(21):18797–806. 10.1007/s10854-018-0005-1.Search in Google Scholar
[41] Kholidy I, BinSabt MH, Abd El-Salam HM, Shaban M, Rabia M. Improved electrochemical synthesis of Cu–Fe/brass foil alloy followed by combustion for high-efficiency photoelectrodes and hydrogen production in alkaline solutions. Green Process Synth. 2025;14(1):20240137. 10.1515/gps-2024-0137.Search in Google Scholar
[42] Shaban M, Kholidy I, Ahmed GM, Negem M, Abd El-Salam HM. Cyclic voltammetry growth and characterization of Sn–Ag alloys of different nanomorphologies and compositions for efficient hydrogen evolution in alkaline solutions. RSC Adv. 2019;9:22389. 10.1039/c9ra03503f.Search in Google Scholar PubMed PubMed Central
[43] Elsayed AM, Rabia M, Shaban M, Aly AH, Ahmed AM. Preparation of hexagonal nanoporous Al2O3/TiO2/TiN as a novel photodetector with high efficiency. Sci Rep. 2021;11(1):1–12. 10.1038/s41598-021-96200-2.Search in Google Scholar PubMed PubMed Central
[44] Abdelazeez AAA, Hadia NMA, Alzaid M, Shaban M, Mourad AHI, Fernández S, et al. Development of CuO nanoporous material as a highly efficient optoelectronic device. Appl Phys A Mater Sci Process. 2022;128(4):321. 10.1007/s00339-022-05447-7.Search in Google Scholar
© 2025 the author(s), published by De Gruyter
This work is licensed under the Creative Commons Attribution 4.0 International License.
Articles in the same Issue
- Synthesis of N,S co-doped carbon quantum dots – metal complex for the detection of fluoride (F−) ion in adults and Children’s toothpastes
- Research Articles
- Optimized green synthesis of silver nanoparticles from guarana seed skin extract with antibacterial potential
- Green adsorbents for water remediation: Removal of Cr(vi) and Ni(ii) using Prosopis glandulosa sawdust and biochar
- Green approach for the synthesis of zinc oxide nanoparticles from methanolic stem extract of Andrographis paniculata and evaluation of antidiabetic activity: In silico GSK-3β analysis
- Development of a green and rapid ethanol-based HPLC assay for aspirin tablets and feasibility evaluation of domestically produced bioethanol in Thailand as a sustainable mobile phase
- A facile biodegradation of polystyrene microplastic by Bacillus subtilis
- Enhanced synthesis of fly ash-derived hydrated sodium silicate adsorbents via low-temperature alkaline hydrothermal treatment for advanced environmental applications
- Impact of metal nanoparticles biosynthesized using camel milk on bacterial growth and copper removal from wastewater
- Preparation of Co/Cr-MOFs for efficient removal of fleroxacin and Rhodamine B
- Applying nanocarbon prepared from coal as an anode in lithium-ion batteries
- Improved electrochemical synthesis of Cu–Fe/brass foil alloy followed by combustion for high-efficiency photoelectrodes and hydrogen production in alkaline solutions
- Precipitation of terephthalic acid from post-consumer polyethylene terephthalate waste fractions
- Biosynthesized zinc oxide nanoparticles: Multifunctional potential applications in anticancer, antibacterial, and B. subtilis DNA gyrase docking
- Anticancer and antimicrobial effects of green-synthesized silver nanoparticles using Teucrium polium leaves extract
- Green synthesis of eco-friendly bioplastics from Chlorella and Lithothamnion algae for safe and sustainable solutions for food packaging
- Optimizing coal water slurry concentration via synergistic coal blending and particle size distribution
- Green synthesis of Ag@Cu and silver nanowire using Pterospermum heterophyllum extracts for surface-enhanced Raman scattering
- Green synthesis of copper oxide nanoparticles from Algerian propolis: Exploring biochemical, structural, antimicrobial, and anti-diabetic properties
- Simultaneous quantification of mefenamic acid and paracetamol in fixed-dose combination tablet dosage forms using the green HPTLC method
- Green synthesis of titanium dioxide nanoparticles using green tea (Camellia sinensis) extract: Characteristics and applications
- Pharmaceutical properties for green fabricated ZnO and Ag nanoparticle-mediated Borago officinalis: In silico predications study
- Synthesis and optimization of gemcitabine-loaded nanoparticles by using Box–Behnken design for treating prostate cancer: In vitro characterization and in vivo pharmacokinetic study
- A comparative analysis of single-step and multi-step methods for producing magnetic activated carbon from palm kernel shells: Adsorption of methyl orange dye
- Sustainable green synthesis of silver nanoparticles using walnut septum waste: Characterization and antibacterial properties
- Efficient electrocatalytic reduction of CO2 to CO over Ni/Y diatomic catalysts
- Greener and magnetic Fe3O4 nanoparticles as a recyclable catalyst for Knoevenagel condensation and degradation of industrial Congo red dye
- Recycling of HDPE-giant reed composites: Processability and performance
- Fabrication of antibacterial chitosan/PVA nanofibers co-loaded with curcumin and cefadroxil for wound healing
- Cost-effective one-pot fabrication of iron(iii) oxychloride–iron(iii) oxide nanomaterials for supercapacitor charge storage
- Novel trimetallic (TiO2–MgO–Au) nanoparticles: Biosynthesis, characterization, antimicrobial, and anticancer activities
- Green-synthesized chromium oxide nanoparticles using pomegranate husk extract: Multifunctional bioactivity in antioxidant potential, lipase and amylase inhibition, and cytotoxicity
- Therapeutic potential of sustainable zinc oxide nanoparticles biosynthesized using Tradescantia spathacea aqueous leaf extract
- Chitosan-coated superparamagnetic iron oxide nanoparticles synthesized using Carica papaya bark extract: Evaluation of antioxidant, antibacterial, and anticancer activity of HeLa cervical cancer cells
- Antioxidant potential of peptide fractions from tuna dark muscle protein isolate: A green enzymatic approach
- Clerodendron phlomoides leaf extract-mediated synthesis of selenium nanoparticles for multi-applications
- Optimization of cellulose yield from oil palm trunks with deep eutectic solvents using response surface methodology
- Nitrogen-doped carbon dots from Brahmi (Bacopa monnieri): Metal-free probe for efficient detection of metal pollutants and methylene blue dye degradation
- High energy density pseudocapacitor based on a nanoporous tungsten(VI) oxide iodide/poly(2-amino-1-mercaptobenzene) composite
- Green synthesized Ag–Cu nanocomposites as an improved strategy to fight multidrug-resistant bacteria by inhibition of biofilm formation: In vitro and in silico assessment study
- In vitro evaluation of antibacterial activity and associated cytotoxicity of biogenic silver nanoparticles using various extracts of Tabernaemontana ventricosa
- Fabrication of novel composite materials by impregnating ZnO particles into bacterial cellulose nanofibers for antimicrobial applications
- Solidification floating organic drop for dispersive liquid–liquid microextraction estimation of copper in different water samples
- Kinetics and synthesis of formation of phosphate composites from low-grade phosphorites in the presence of phosphate–siliceous shales and oil sludge
- Removal of minocycline and terramycin by graphene oxide and Cr/Mn base metal–organic framework composites
- Microfluidic preparation of ceramide E liposomes and properties
- Therapeutic potential of Anamirta cocculus (L.) Wight & Arn. leaf aqueous extract-mediated biogenic gold nanoparticles
- Antioxidant-rich Micromeria imbricata leaf extract as a medium for the eco-friendly preparation of silver-doped zinc oxide nanoparticles with antibacterial properties
- Influence of different colors with light regime on Chlorella sp., biomass, pigments, and lipids quantity and quality
- Experimental vibrational analysis of natural fiber composite reinforced with waste materials for energy absorbing applications
- Green synthesis of sea buckthorn-mediated ZnO nanoparticles: Biological applications and acute nanotoxicity studies
- Production of liquid smoke by consecutive electroporation and microwave-assisted pyrolysis of empty fruit bunches
- Synthesis of MPAA based on polyacrylamide and gossypol resin and applications in the encapsulation of ammophos
- Application of iron-based catalysts in the microwave treatment of environmental pollutants
- Enhanced adsorption of Cu(ii) from wastewater using potassium humate-modified coconut husk biochar
- Adsorption of heavy metal ions from water by Fe3O4 nano-particles
- Green synthesis of parsley-derived silver nanoparticles and their enhanced antimicrobial and antioxidant effects against foodborne resistant bacteria
- Unwrapping the phytofabrication of bimetallic silver–selenium nanoparticles: Antibacterial, Anti-virulence (Targeting magA and toxA genes), anti-diabetic, antioxidant, anti-ovarian, and anti-prostate cancer activities
- Optimizing ultrasound-assisted extraction process of anti-inflammatory ingredients from Launaea sarmentosa: A novel approach
- Eggshell membranes as green carriers for Burkholderia cepacia lipase: A biocatalytic strategy for sustainable wastewater bioremediation
- Research progress of deep eutectic solvents in fuel desulfurization
- Enhanced electrochemical synthesis of Ni–Fe/brass foil alloy with subsequent combustion for high-performance photoelectrode and hydrogen production applications
- Valorization of baobab fruit shell as a filler fiber for enhanced polyethylene degradation and soil fertility
- Valorization of Agave durangensis bagasse for cardboard-type paper production circular economy approach
- Green priming strategies using seaweed extract and citric acid to improve early growth and antioxidant activity in lentil
- Gold extraction from oxide ore using iron ion-thiourea-additive
- Development of loess-derived P-type molecular sieve as a sustainable antibacterial agent
- Review Article
- Sustainable innovations in garlic extraction: A comprehensive review and bibliometric analysis of green extraction methods
- Natural sustainable coatings for marine applications: advances, challenges, and future perspectives
- Integration of traditional medicinal plants with polymeric nanofibers for wound healing
- Rapid Communication
- In situ supported rhodium catalyst on mesoporous silica for chemoselective hydrogenation of nitriles to primary amines
- Special Issue: Valorisation of Biowaste to Nanomaterials for Environmental Applications
- Valorization of coconut husk into biochar for lead (Pb2+) adsorption
- Corrigendum
- Corrigendum to “An updated review on carbon nanomaterials: Types, synthesis, functionalization and applications, degradation and toxicity”