Analysis of land use change on urban landscape patterns in Northwest China: A case study of Xi’an city
-
Yizhen Zhao
 ,
Wenyu Wang
,
Wenyu Wang

Abstract
Xi’an, an inland city in Northwest China, borders the Qinling Mountains to the south and Wei River to the north. This city is rich in biodiversity and occupies a unique position in China. In the past few decades, human activities have led to great changes in land use in Xi’an city, and the ecosystem has experienced an accelerated fragmentation process. This study analyzed the degree of land use change and landscape fragmentation in the region. Land use data in 1990, 2000, 2010, and 2018 were used to evaluate the effects of land use change on the landscape pattern in Xi’an city at different scales using mathematical models and landscape indices. Results show that from 1990 to 2018, built-up land expanded the most, from 7.34 to 13.51%. Cropland decreased the most, from 40.12 to 29.81%. Overall, the fragmentation degree of cropland patches decreased, and the fragmentation degree of built-up land patches increased. The landscape patterns of different districts and counties show different change directions. The results can provide necessary information for land use planning and land resource allocation in inland cities in Northwest China.
1 Introduction
The land is the material basis of human production activities and an important carrier of regional economic development [1]. With the rapid development of China’s economy and increase in population, the expansion of urban construction land has become a prominent feature of China’s urbanization process [2]. Furthermore, some ecological problems have gradually emerged, such as ecological damage caused by the unreasonable development and utilization of natural resources [3], environmental pollution [4], and resource shortage [5]. Currently, land use/cover change (LUCC) is an important research interest in the field of landscape assessment [6]. Landscape pattern generally refers to its spatial pattern, that is, the spatial arrangement and combination of landscape elements of different sizes and shapes [7]. Landscape pattern is an important index reflecting the relationship between the social-economic system and the natural ecosystem [8], reflecting the rationality of land use to a certain extent. Exploring the interaction mechanism between land use and landscape morphological evolution can elucidate the impact of social development on natural ecology [9] and provide a reference for regional land use planning and ecological civilization construction.
At present, land use change is an important direction in the field of land resource change research. First, as a basic tool for monitoring regional development, land use change is currently a hot global issue [10]. Saur and Rathore analyzed the channel migration and LUCC in the Jadar River Basin in the Eastern Himalayas of Assam, India, using topographic maps and multi-temporal satellite data from 1928 to 2010 [11]. Shen et al. revealed the bidirectional detection of land use function change in the Huangshui Watershed over 40 years on the basis of Google Earth Engine Landsat images [12]. However, few analyses have been performed on the landscape pattern interactions of land use.
Landscape pattern is closely related to the spatial-temporal distribution changes of land use [13], showing characteristics of spatial distribution, density, dominance, connectivity, aggregation, and diversity [14]. Landscape index analysis is a quantitative method [15], which is widely used in the assessment of landscape morphology and characteristics [16]. These indices can provide various indicators of the structure and transition of topographic features. The landscape index can be used to analyze the landscape characteristics in terms of diversity, geometry, distribution, aggregation, and composition. Under the background of urbanization, land use change can alter regional landscape patterns [17] and has profound impacts on the ecological systems, social institutions, and economic development [18]. However, research on the impact of land use change on the landscape pattern of China’s inland megacities is insufficient.
China has a vast area and distinct geomorphic features. Xi’an city, an inland megacity, has a complex terrain, including mountains, hills, plains, and valleys. This complex terrain has led to the city’s unique urban appearance. With a population of more than 9 million in the urban area, human activities are greatly restricted by topography. Land use change has a direct impact on the farmers’ livelihood and the healthy development of the regional economy. Objectively understanding the temporal and spatial evolution law of land use and landscape pattern change in Xi’an has become the key to regional sustainable development. Therefore, more attention should be given to the problem of human settlements in inland megacities. With the deepening of reform and opening-up, the economy of Xi’an has developed rapidly, but economic development and population growth have led to the land shortage. Thus, the effects of LUCC change on landscape patterns at different scales were analyzed in this study. The main objectives are as follows: (1) to reconstruct the spatial-temporal change processes of land use, (2) to evaluate the landscape dynamics, and (3) to analyze the impact of LUCC change on landscape patterns. Assessing the evolution process of land resources in China’s inland megacity can provide references for regional sustainable development and government decision-making.
2 Materials and methods
2.1 Study area
Xi’an (33°42′–34°45′N, 107°40′–109°49″E) is located in the central part of the Shaanxi province, northwest of China, covering a surface area of 10,108 km2, with an altitude of 345–3,867 m (Figure 1). Xi’an has 11 districts and 2 counties under its jurisdiction. Located at the northern foot of the Qinling Mountains and south of the Guanzhong Plain, Xi’an is one of the most developed and densely populated inland cities in China. The location conditions are good, and the city has been strongly supported by national management policies in recent years. Xi’an has rapidly become the political, economic, and cultural center of the Shaanxi province, which has great significance to the economic development of the west and China’s ecological security. Therefore, selecting Xi’an as the study area is critical to the evaluation of the impact of LUCC change on landscape patterns.

Location map of the study area produced by ArcGIS 10.3 software: (a) China, (b) Shaanxi province, and (c) Xi’an city.
2.2 Data sources
The land use data employed in this study are raster data in 1990, 2000, 2010, and 2018 with a resolution of 1 km. The rasterization data came from the Data Center for Resources and Environmental Sciences, Chinese Academy of Sciences (http://www.resdc.cn/), the interpretation accuracy is 88.95% from the description of the data, which meets the needs of this study. The main data source of these data is Landsat TM/ETM remote sensing images. According to the classification standard of land use status in China (GB/T21010-2017) and the characteristics of different land uses [19], the classified image obtained for the study area contained only 19 land use classes among 23. Referring to previous research [20], these 19 classes are merged into 6 categories, namely, cropland, forest land, grassland, water bodies, built-up area, and unused land (Table 1), using the reclassification function of ArcGIS 10.3. The digital elevation model (DEM) with a spatial resolution of 30 m was extracted through the Advanced Spaceborne Thermal Emission and Reflection Radiometer Global DEM Version 2, which was downloaded from the geospatial data cloud (http://www.gscloud.cn/).
Description of land use types
| Code | Land use type | Secondary land use type | Description |
|---|---|---|---|
| 1 | Cropland | Paddy, dry farm | The land for producing crops |
| 2 | Forest land | Woodland, shrubbery, sparse woods, and other forest lands | The land where trees, bamboos, shrubs, and mangroves grow |
| 3 | Grassland | High, low, and medium coverage grassland | The land for growing herbaceous plants |
| 4 | Water bodies | River, lake, reservoir, pond, and beach | The land for natural water areas and water conservancy facilities |
| 5 | Built-up land | Urban land, rural residential areas, and other construction lands | The land where urban and rural residential areas and for industrial, mining, and transportation purposes |
| 6 | Unused land | Sandy land, saline alkaline land, and bare rock land | Currently unused land, including difficult-to-use land |
2.3 Methodology
2.3.1 Land use transition matrix
The transition matrix reflects the dynamic process of mutual conversion, indicating the type of land use at the beginning and end of a certain time in a certain area [21]. The calculation formula is as follows:
where
2.3.2 Dynamic change of land use
The process of land use change can be represented by quantitative indexes, such as total change (TC), net change (NC), state, direction, and trend.
2.3.2.1 Total land use change
TC, which is defined as the sum of gains and losses in an area, is the most commonly used indicator for calculating land-use area change [22]. For a certain land use type, the NC is defined as follows:
2.3.2.2 Net land use change
The NC of land use is the absolute change of transfer-in and transfer-out areas in each type [23]. For a certain land use type, NC is defined as follows:
where U
a and U
b represent the area of a certain land use type at the beginning and end of the study, respectively.
2.3.2.3 Land use change state index
Directionality refers to the characterization of the land increase and decrease the process of a certain land type and can be divided into one-way and two-way transitions. The state reflects the dynamics of land change, which can be divided into four categories: balance (the area loss of a certain land type is equal to the area increase), quasi-balance (the difference between the increase and decrease areas is small), unbalanced (the land decrease and increase areas have a significant difference), and extremely unbalanced.
Trend refers to the degree of positive or negative change for each land type, using the PS to represent the trend [24]:
where 0 < PS ≤ 1 means that the land tends to increase with the change in land use. PS → 0 indicates that the area expansion rate of a specific land type is relatively slow, has the characteristics of bidirectional transition, and belongs to the equilibrium state. Conversely, PS → 1 indicates a one-way dominant transition. This process indicates that the land type is consuming other land types, increasing its own area. This land change is considered unbalanced.
When −1 ≤ PS < 0, the trend is decreasing. When PS → 0, the land type has experienced a slow shrinkage, showing the characteristics of a two-way balanced transition. If PS → −1, then a one-way change occurred. Such land transitions are called unidirectional negative transitions and are extremely unbalanced.
2.3.3 Landscape pattern metrics
Landscape pattern is closely related to patch size, shape, connectivity, and edge [25]. Given the landscape complexity of different land types, landscape patterns cannot be measured by a single metric. Therefore, a set of landscape metrics is usually used to describe a land’s landscape pattern [16]. This study analyzed landscape on the basis of class and landscape level. According to the study scope, the typical landscape pattern metrics were analyzed at the district/county scale. The landscape metrics were calculated using raster data and the FRAGSTATS4.2© software. Table 2 describes these metrics. To describe the changes in landscape pattern in Xi’an in more detail, four landscape indices reflecting the shape of the patch area were selected from the class level, and three indices reflecting the overall landscape information were selected from the landscape level. The selection of landscape metrics was based on previous studies [26,27,28].
Landscape pattern indices
| Scale | Name | Formula | Description |
|---|---|---|---|
| Class metrics | Patch density (PD) |
|
Reflect the fragmentation of the inner landscape |
| Edge density (ED) |
|
Reflect the plaque edge complexity | |
| Mean shape index (SHAPE_MN) |
|
The shape complexity of the individual land use types | |
| Mean Patch Fractal Index (FRAC_MN) |
|
The complexity of patch boundaries | |
| Landscape Metrics | Shannon’s Diversity Index (SHDI) |
|
Reflect the diversity of the landscape |
| Shannon’s Evenness Index (SHEI) |
|
Reflect the dominance of the landscape | |
| Contagion index (CONTAG) |
|
Tendency of land use types to be aggregated |
3 Results
3.1 Overall change of land use in Xi’an
3.1.1 Spatial distribution of land use from 1990 to 2018
Figure 2 shows the results of the land use distribution in Xi’an city from 1990 to 2018. The cropland decreased significantly from 40.12% in 1990 to 34.53% in 2018, and it is mainly distributed around the central urban area. The built-up land increased obviously from 7.34% in 1990 to 13.51% in 2018, and the proportion of built-up urban areas decreased from the central urban area to the suburbs. Grassland decreased slowly from 21.27% in 1990 to 20.03% in 2010 and increased slightly to 20.78% in 2018, showing a small change. From 1990 to 2018, forest land and water bodies showed a “decrease-increase-decrease” trend. The unused land increased slightly in 2018, but the change was small. In general, the change range of the built-up land area was the largest, while the unused land change was the smallest. The decrease in cropland and grassland and the rapid increase in built-up land area were the results of economic development.
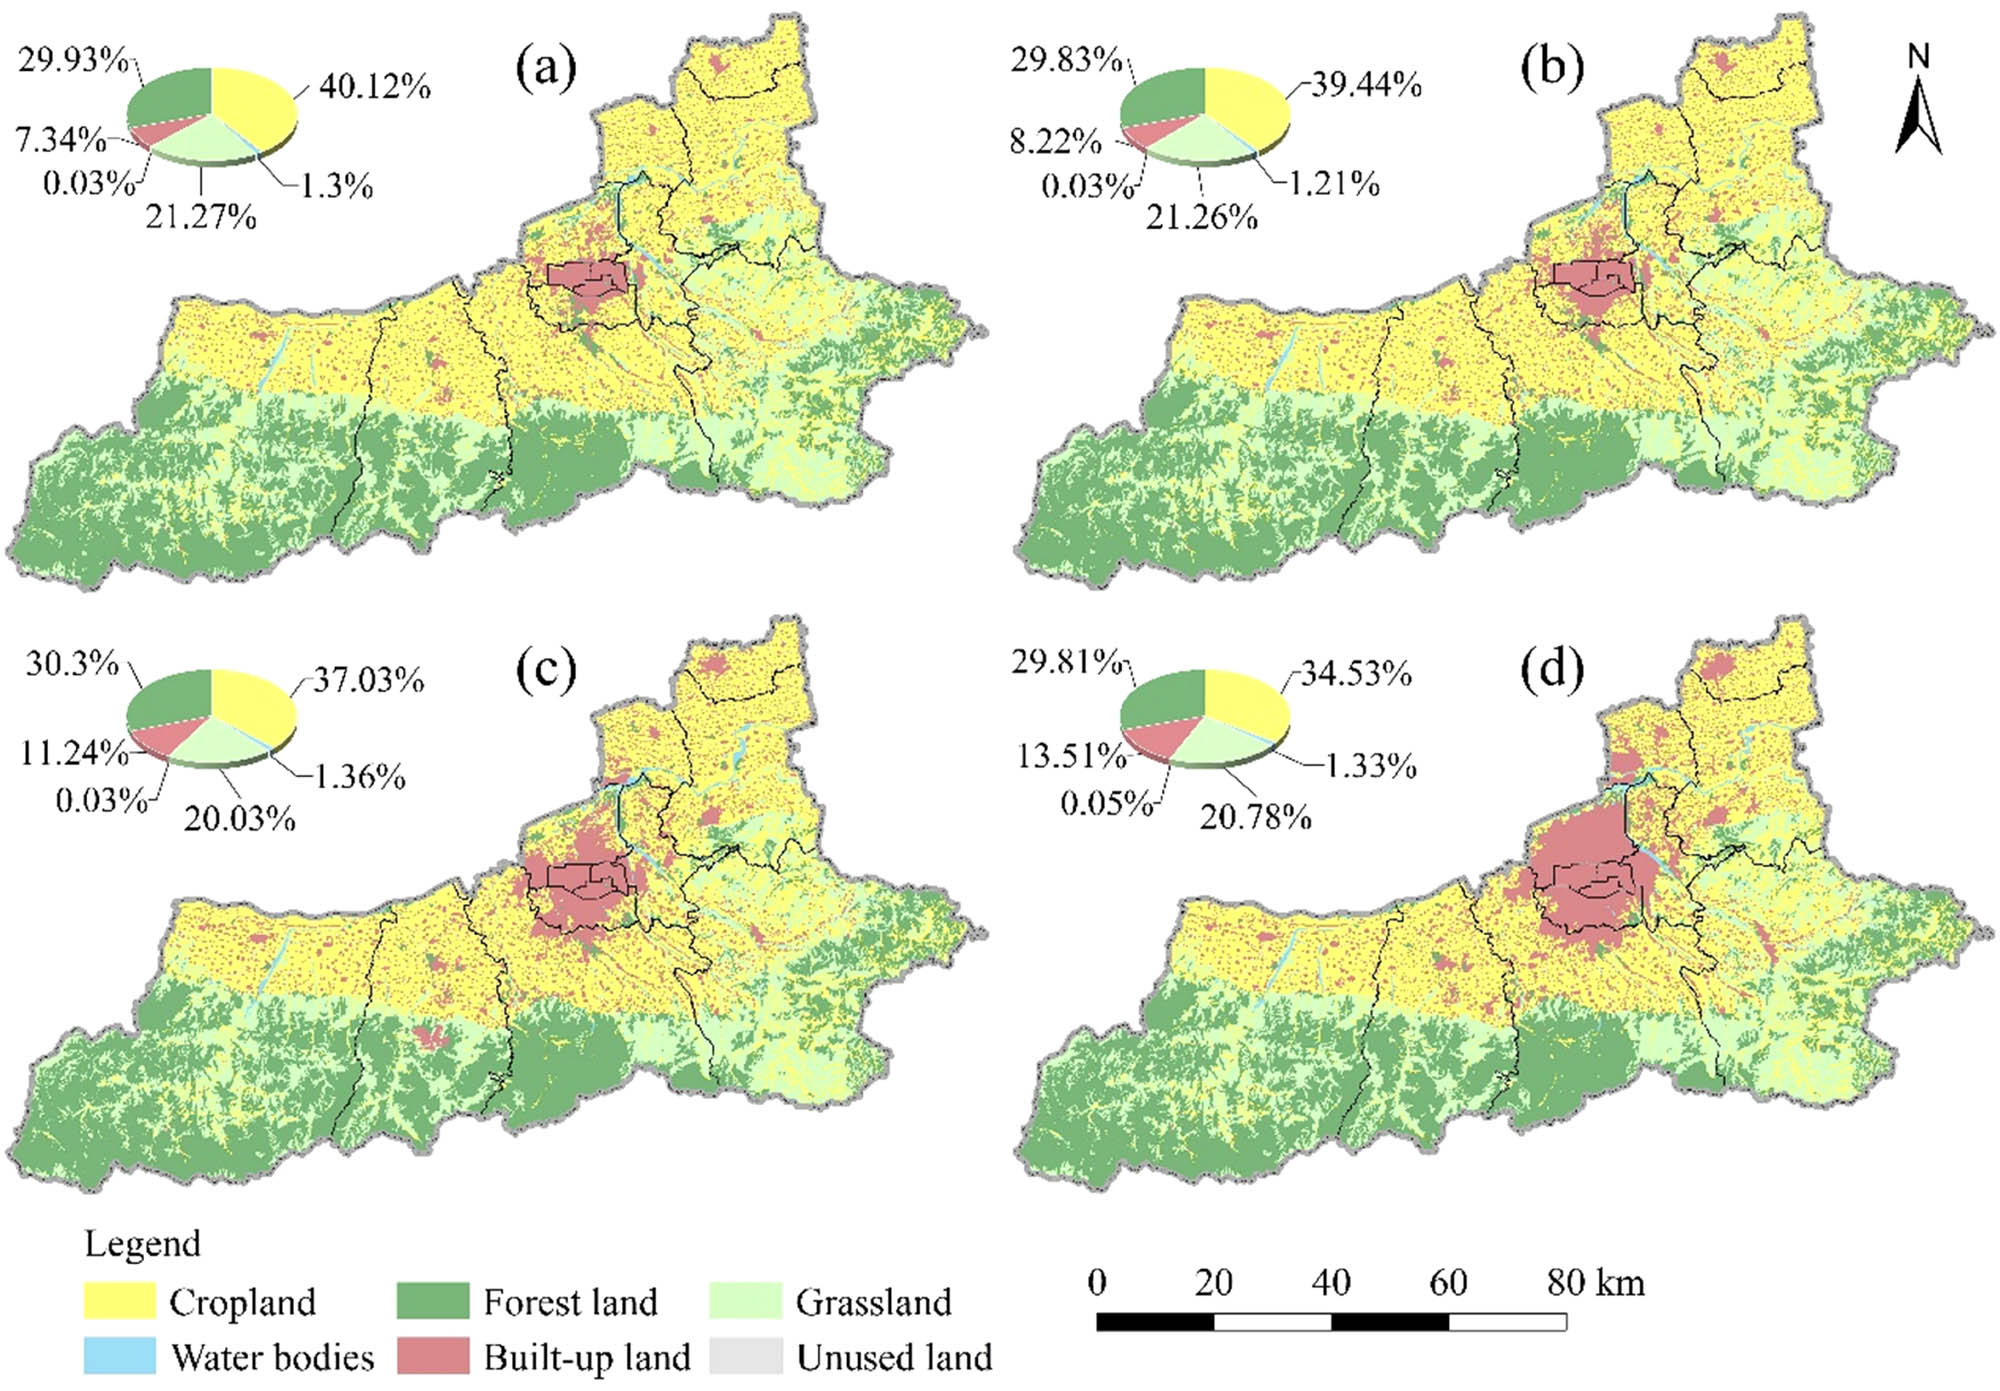
Land use change types in Xi’an city from 1990 to 2018: (a) 1990, (b) 2000, (c) 2010, and (d) 2018.
Figure 2 shows the specific land use distribution of each district and county. The built-up land expanded outward from the Lianhu district, Xincheng district, and Beilin district. The urbanization rate of the Weiyang district and Yanta district had increased significantly. Grassland was mainly distributed in the southern of Zhouzhi county, Huyi district, Chang’an district, and Lantian county. The urban area of Yanliang district was also gradually expanding.
3.1.2 Spatial change of land use from 1990 to 2018
Figure 3 shows that cropland, forest land, grassland, and built-up land were frequently converted. Cropland was the most significantly changed land use type in the study area and mainly converted to build-up land and grassland. The cropland in Gaoling District, Yanliang District, Lintong District, Lantian County, Chang’an District, Huyi District and Zhouzhi County was relatively stable. The area of cropland converted into built-up land is 592.32 km2, which is mainly distributed in the former main urban area, that was the locations of Gaoling district, Baqiao district, Yanta district, and Chang’an district near the urban area (Figure 3a). The total area of forest land transferred to other land is 119.18 km2. Among them, an area of 49.55 km2 was transferred to built-up land and scattered around the old city, with an area of 42.63 km2 transferred to grassland, which is distributed in the mountainous area in the south of Xi’an (Figure 3b). Grassland was the main land use type transferred to cropland, with a transfer area of 102.94 km2, and distributed in Zhouzhi County, Huyi District, Chang’an District, and Qinling Mountains in Lantian County (Figure 3c). The area of water bodies was mainly transferred to cropland and build-up land (Figure 3d). The built-up land mainly occupied forest land and cropland to realize expansion. The changing areas were mainly located in the Weiyang, Yanta, Baqiao, Lianhu, Beilin, and Xincheng districts, and landscape agglomeration became increasingly obvious (Figure 3e). In addition, unused land was mainly converted to cropland (Figure 3f).

Spatial changes in land use types in Xi’an city during 1990–2018: (a) cropland, (b) forest land, (c) grassland, (d) water bodies, (e) built-up land, and (f) unused land; 1, 2, 3, 4, 5, and 6 represent cropland, forest land, grassland, water bodies, built-up land, and unused land, respectively.
3.1.3 Temporal change of land use from 1990 to 2018
The Markov transition matrix was used to calculate the land use transition matrix in Xi’an from 1990 to 2018, and the land use pattern in Xi’an changed significantly. The results are shown in Table 3. The main changes were the transfers of cropland and forest land to built-up land, grassland to cropland, water bodies to cropland, built-up land, and unused land to cropland, and the areas were 592.32, 49.55, 102.94, 17.12, 44.60, and 0.22 km2, respectively. The area transferred from cropland was the largest, reaching 751.92 km2, which was mainly transferred to built-up land. Grassland was the main land type transferred to cropland. During the study period, built-up land increased the most, from 741.72 km2 in 1990 to 1364.26 km2 in 2018. Under the background of rapid urbanization and rural revitalization, the cropland and forest land in the joint region of the urban area and the suburb have been expropriated due to the expansion of construction land.
Land use transition matrix for Xi’an city during 1990—2018
| 2018 | |||||||
|---|---|---|---|---|---|---|---|
| 1990 | Cropland | Forest land | Grassland | Water bodies | Built-up land | Unused land | Total |
| Cropland | 3299.35 | 41.83 | 87.78 | 29.22 | 592.32 | 0.77 | 4051.27 |
| Forest land | 22.41 | 2903.14 | 42.63 | 4.05 | 49.55 | 0.53 | 3022.32 |
| Grassland | 102.94 | 59.26 | 1960.32 | 7.09 | 18.57 | 0.24 | 2148.42 |
| Water bodies | 17.12 | 3.91 | 5.09 | 93.00 | 12.45 | 0.00 | 131.56 |
| Built-up land | 44.60 | 2.26 | 2.60 | 0.96 | 691.28 | 0.02 | 741.72 |
| Unused land | 0.22 | 0.05 | 0.02 | 0.00 | 0.09 | 3.10 | 3.49 |
| Total | 3486.65 | 3010.45 | 2098.44 | 134.32 | 1364.26 | 4.65 | 10098.77 |
The urbanization rate of Xincheng district, Beilin district, and Lianhu district was relatively high, and it can be seen from Tables A1–A3 that the degree of land change in these three districts was relatively small. From Tables A4–A6, A9 and A10, it can be seen that Baqiao district, Weiyang district, Yanta district, Lintong district, Chang’an district, and Gaoling district were undergoing rapid urbanization, and the source of built-up land was mainly cropland, and the land areas of cropland transferred to built-up land were 60.09, 118.58, 62.77, 52.36, 115.62, and 59.10 km2 respectively. In order to maintain the relative balance of cropland occupation and compensation, it can be seen from the attached Tables A9, A11–A13 that a large area of grassland had been transferred to cropland. In Chang’an district, Huyi district, Lantian county and Zhouzhi county, the area of grassland transferred to cropland was 61.50, 54.08, 114.11, and 99.53 km2, respectively.
3.2 The process and trend of land use change
Table 4 lists the process and trends of land use change from 1990 to 2008. During the 28 years, significant changes in land use occurred, and the land use types in Xi’an generally presented a two-way transition trend. The built-up land area showed an increasing trend in different periods.
Changes in different land use types in Xi’an City
| Year | Indicators | Cropland | Forest land | Grassland | Water bodies | Built-up land | Unused land |
|---|---|---|---|---|---|---|---|
| 1990 | Area (km2) | 4051.27 | 3022.32 | 2148.42 | 131.56 | 741.72 | 3.49 |
| 2000 | Area (km2) | 3982.64 | 3012.83 | 2146.95 | 122.55 | 830.33 | 3.49 |
| 2010 | Area (km2) | 3739.15 | 3060.12 | 2022.98 | 137.81 | 1135.29 | 3.46 |
| 2018 | Area (km2) | 3486.66 | 3010.45 | 2098.45 | 134.32 | 1364.26 | 4.65 |
| 1990–2000 | NC (%) | −1.69 | −0.31 | −0.07 | −6.85 | 11.95 | 0.00 |
| TC (%) | 2.39 | 0.56 | 0.33 | 12.75 | 11.96 | 0.00 | |
| PS | −0.71 | −0.56 | −0.21 | −0.54 | 0.99 | 0.00 | |
| 2000−2010 | NC (%) | −6.11 | 1.57 | −5.77 | 12.45 | 36.73 | −0.88 |
| TC (%) | 13.97 | 6.22 | 12.63 | 51.21 | 45.66 | 50.85 | |
| PS | −0.44 | 0.25 | −0.46 | 0.24 | 0.80 | −0.02 | |
| 2010−2018 | NC (%) | −6.75 | −1.62 | 3.73 | −2.53 | 20.17 | 34.69 |
| TC (%) | 14.92 | 7.92 | 13.43 | 49.80 | 37.92 | 101.67 | |
| PS | −0.45 | −0.21 | 0.28 | −0.05 | 0.53 | 0.34 | |
| 1990−2018 | NC (%) | −13.94 | −0.39 | −2.33 | 2.10 | 83.93 | 33.51 |
| TC (%) | 23.18 | 7.49 | 15.18 | 60.72 | 97.53 | 55.50 | |
| PS | −0.60 | −0.05 | −0.15 | 0.03 | 0.86 | 0.60 |
From 1990 to 2000, the NC of built-up land was 11.95, showing an extremely unbalanced growth trend. The NCs of cropland, forest land, grassland, and water bodies were all negative, and the PS values were −0.71, −0.56, −0.21, and −0.54, respectively. These indicators reflect that the corresponding land types showed a decreasing trend. The grassland area decreased at the slowest rate, and bi-directional conversion occurred in the other land use types. The PS index of built-up land was 0.99, which is very near 1, indicating that built-up land mainly experienced a one-way increase and rapid expansion and was in an extremely unbalanced state.
In 2000 and 2010, the NCs of forest land, water area, and built-up land showed an increasing trend, and the PS of these land types were −0.44, −0.46, and 0.80, respectively. These indicators reflect that the scale of the corresponding land type showed an increasing trend. The conversion of built-up land was mainly a one-way conversion. The NCs of cropland, grassland, and unused land showed a decreasing trend during this period. The PS of unused land was −0.02, indicating that the loss of unused land was very slow and tended toward dynamic balance.
From 2010 to 2018, the NCs of grassland, built-up land, and unused land showed an increasing trend, and the PS values of grassland and built-up land were relatively near 0, indicating that the growth rate of the land type was slow and in a bidirectional equilibrium state. The NCs of cropland, forest land, and water bodies showed a decreasing trend.
3.3 Analysis of the landscape pattern
3.3.1 The landscape pattern change in Xi’an city at class level
This study analyzed the landscape pattern change in Xi’an in different years and at the class and landscape levels. PD and ED were used to analyze the change in the land use patch fragmentation degree. PD reflects the fragmentation degree and heterogeneity of the landscape, while ED can be used to describe the edge shape characteristics of the entire landscape patch. The mean shape index (SHAPE_MN) and mean the patch fractal index (FRAC_MN) were used to analyze the change in the spatial pattern. MSI is the most suitable index for describing the macro morphology of the land use patch, while FRAC_MN is used to describe the complexity of the land use patch boundary.
The results of PD and LSI in Xi’an from 1990 to 2018 are shown in Figure 4. The PD of cropland was the highest among all the land types, indicating that the internal region was the most fragmented. The PD of forestland fluctuated, indicating that the patch shape of forestland was unstable. The PDs of grassland and built-up land showed an increasing trend, indicating that the patch shape became increasingly complex during the study period. The PD of the water bodies showed a downward trend, indicating that the patch shape of the water bodies was simple during the study period. The lowest patch fragmentation was found for unused land. The EDs of forestland, grassland, and water area was larger than those of the other land use types, indicating that their edge shape was more complex. The ED of unused land increased gradually. The comparison of the PD with the LSI shows that the PD and LSI in Xi’an were generally stable.
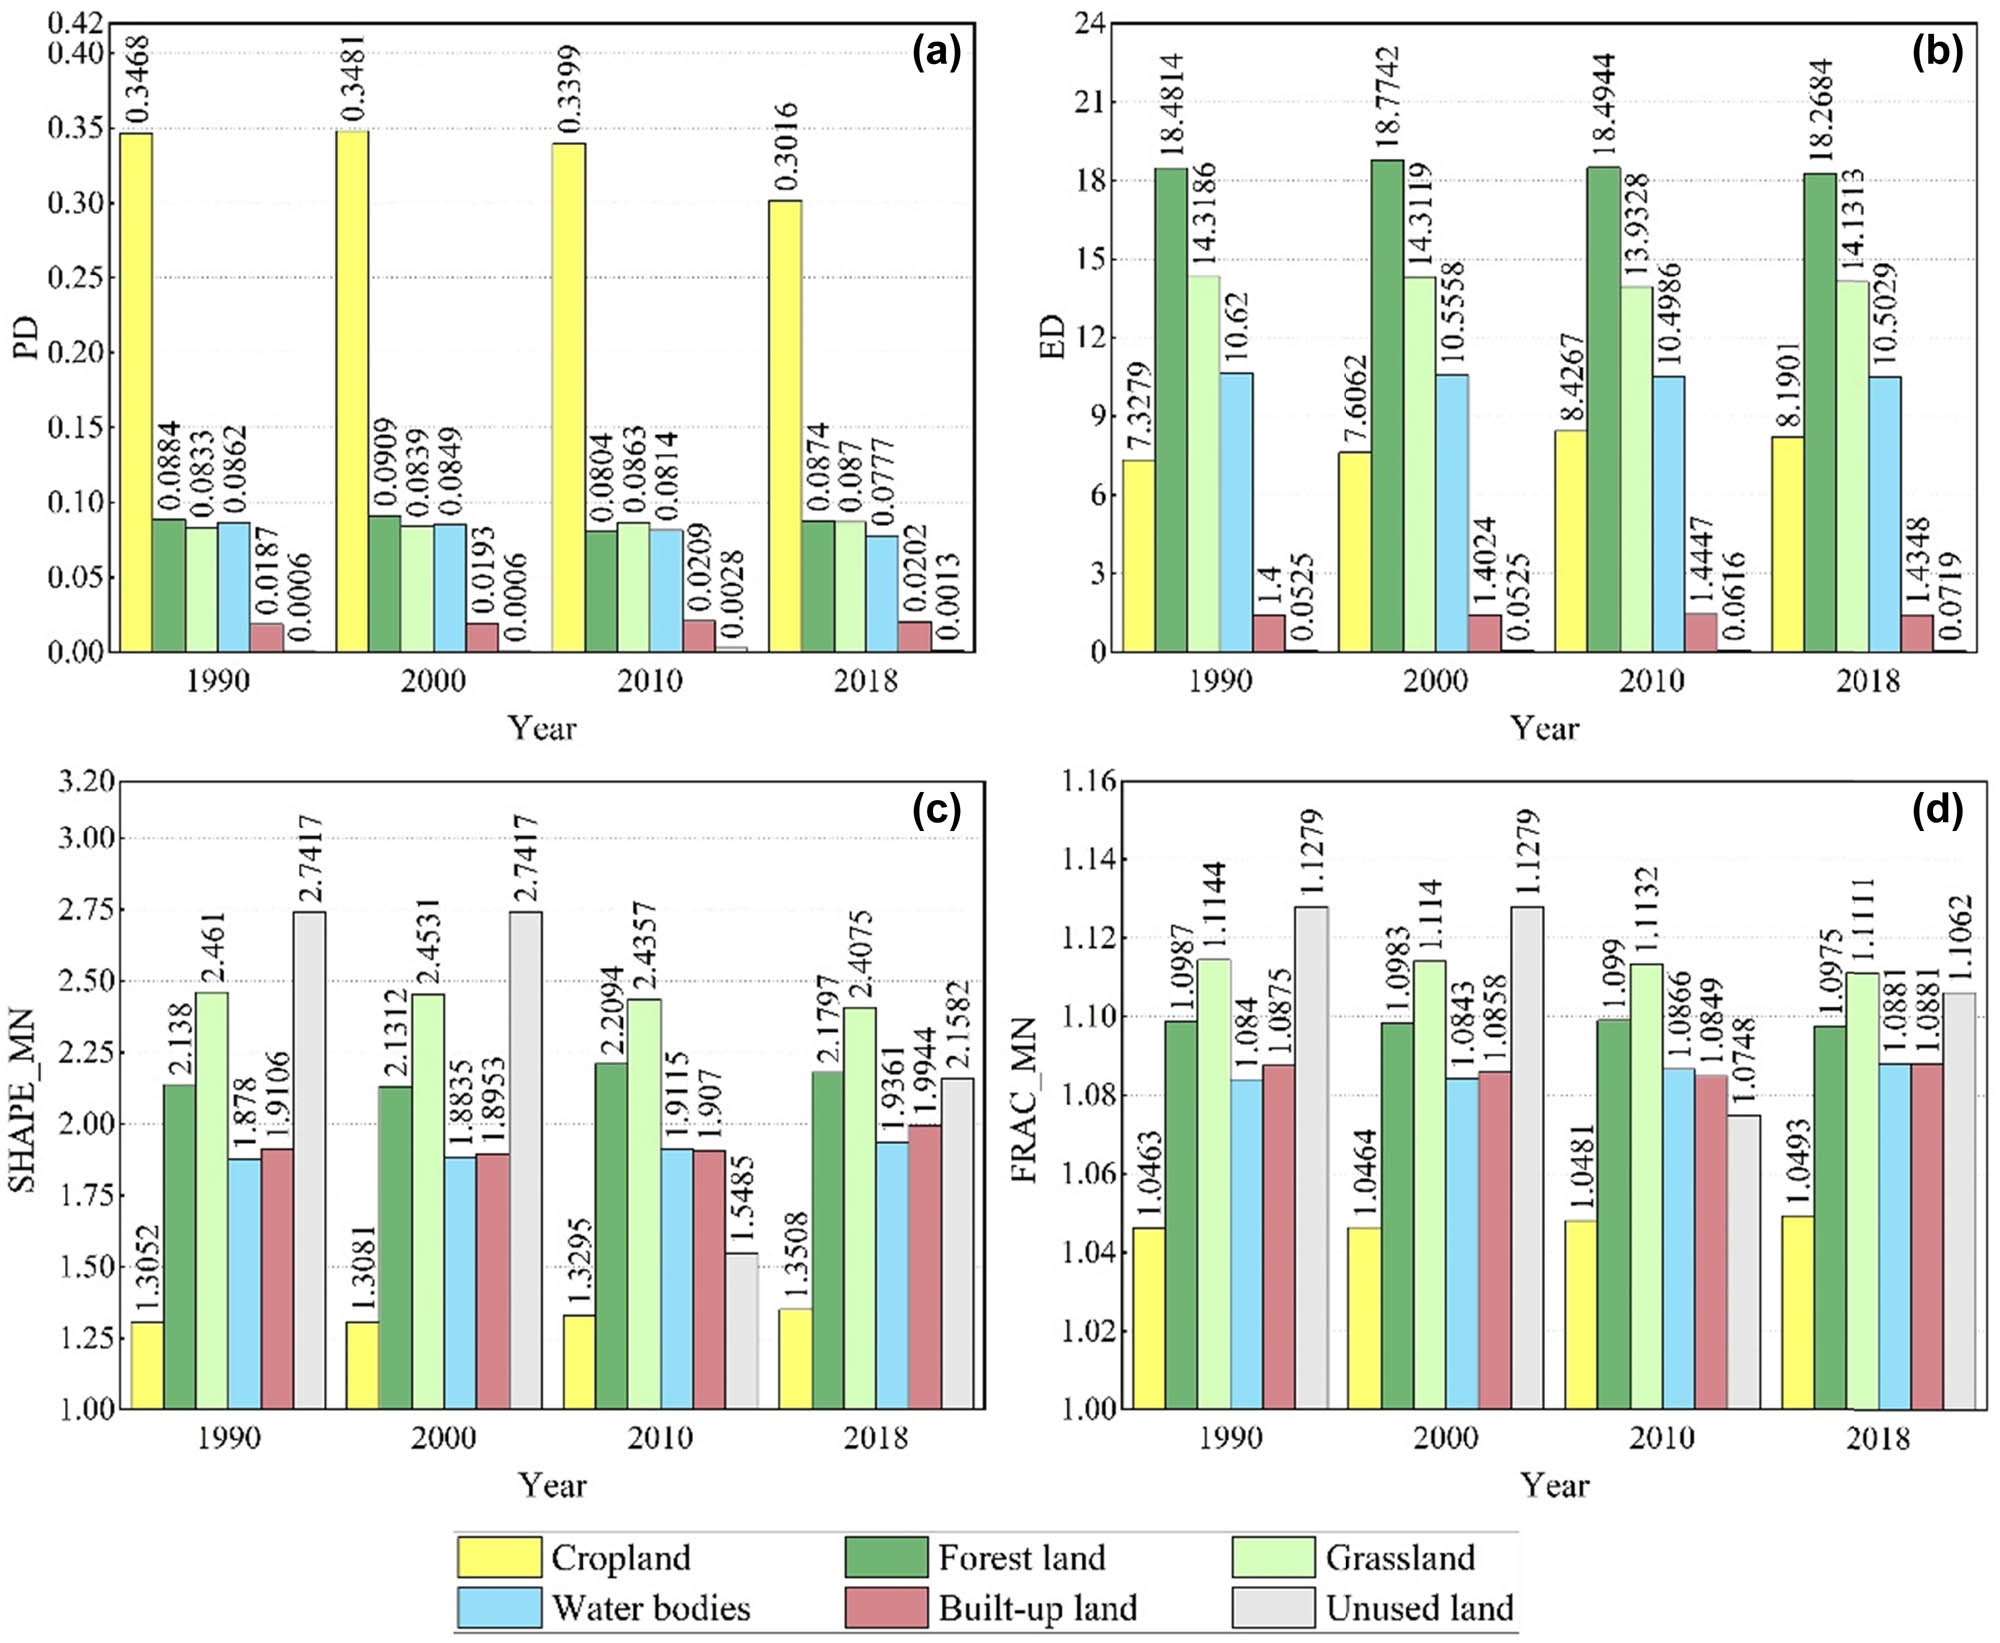
The value of landscape indexes Xi’an for four time points. (a) PD, (b) ED, (c) mean shape index (SHAPE_MN), and (d) mean Patch Fractal Index (FRAC_MN).
The changes in the SHAPE_MN and FRAC_MN in Xi’an are illustrated in Figure 4. The SHAPE_MN and FRAC_MN of cropland were the smallest among all the land types, indicating that the boundary of the cropland patches was regular and simple. The FRAC_MN of grassland and forestland was the most stable, indicating that the corresponding land types were the least affected by human activities. The SHAPE_MN and FRAC_MN of built-up land were relatively stable during the study period, indicating that the urban construction boundary of Xi’an City was relatively regular. The SHAPE_MN and FRAC_MN of unused land in 1990–2000 were the largest among all the land types. The SHAPE_MN and FRAC_MN of unused land fluctuated from 2000 to 2018, indicating that the unused land patches changed significantly in morphology after 2000, and their boundary shape increased in complexity. The comparison of SHAPE_MN and FRAC_MN reveals that the changing trend of SHAPE_MN and FRAC_MN was similar among different land types.
3.3.2 The landscape pattern change in Xi’an city at landscape level
LUCC has different effects on the landscape pattern of Xi’an City. The CONTEG, SHEI, and SHDI were used to evaluate the landscape evenness, diversity, and fragmentation of each district and county at the landscape level (Table 5). SHEI can reflect the dominance of the landscape. In 2018, the CONTEG, SHEI, and SHDI in the Xincheng, Beilin, and Lianhu districts were 0. From 1990 to 2018, the SHEI in Yanta District showed an upward trend. Meanwhile, the SHEI in the Yanliang, Lintong, and Gaoling districts and Zhouzhi county decreased. In 2018, the CONTEG of the Xincheng, Beilin, and Lianhu districts was 100 because the landscape types of these three districts 2018 were only built-up land. The CONTEG fluctuated in Xi’an, the Baqiao, Weiyang, Chang’an, and Huyi districts, and Lantian County.
Landscape pattern indices of different districts/counties in Xi’an city
| Location | 1990 | 2000 | 2010 | 2018 | 1990 | 2000 | 2010 | 2018 | 1990 | 2000 | 2010 | 2018 |
|---|---|---|---|---|---|---|---|---|---|---|---|---|
| CONTAG | CONTAG | CONTAG | CONTAG | SHDI | SHDI | SHDI | SHDI | SHEI | SHEI | SHEI | SHEI | |
| Xincheng district | 94.419 | 96.158 | 96.158 | 100 | 0.113 | 0.079 | 0.079 | 0.000 | 0.103 | 0.072 | 0.072 | 0.000 |
| Beilin district | 92.700 | 94.392 | 94.408 | 100 | 0.149 | 0.116 | 0.116 | 0.000 | 0.136 | 0.106 | 0.106 | 0.000 |
| Lianhu district | 88.348 | 98.304 | 0.000 | 100 | 0.241 | 0.022 | 0.000 | 0.000 | 0.219 | 0.032 | 0.000 | 0.000 |
| Baqiao district | 59.071 | 57.865 | 57.980 | 56.915 | 1.220 | 1.255 | 1.250 | 1.283 | 0.758 | 0.780 | 0.777 | 0.797 |
| Weiyang district | 63.146 | 61.977 | 64.030 | 76.288 | 1.221 | 1.262 | 1.206 | 0.729 | 0.682 | 0.704 | 0.673 | 0.453 |
| Yanta district | 66.317 | 67.490 | 73.310 | 81.038 | 1.005 | 0.974 | 0.807 | 0.577 | 0.625 | 0.605 | 0.501 | 0.358 |
| Yanliang district | 82.096 | 81.282 | 78.314 | 77.227 | 0.518 | 0.544 | 0.631 | 0.668 | 0.322 | 0.338 | 0.392 | 0.415 |
| Lintong district | 68.336 | 67.848 | 67.006 | 65.418 | 0.937 | 0.951 | 0.980 | 1.023 | 0.582 | 0.591 | 0.609 | 0.636 |
| Chang’an district | 60.174 | 59.668 | 62.349 | 61.497 | 1.223 | 1.237 | 1.286 | 1.317 | 0.760 | 0.769 | 0.718 | 0.735 |
| Gaoling district | 79.132 | 79.139 | 73.097 | 69.352 | 0.607 | 0.606 | 0.787 | 0.904 | 0.377 | 0.377 | 0.489 | 0.562 |
| Huyi district | 59.286 | 59.173 | 61.787 | 62.050 | 1.247 | 1.250 | 1.303 | 1.294 | 0.775 | 0.777 | 0.727 | 0.722 |
| Lantian county | 62.995 | 62.862 | 62.229 | 62.126 | 1.210 | 1.214 | 1.237 | 1.240 | 0.675 | 0.678 | 0.691 | 0.692 |
| Zhouzhi county | 64.979 | 64.967 | 64.654 | 64.447 | 1.185 | 1.185 | 1.195 | 1.202 | 0.661 | 0.661 | 0.667 | 0.671 |
| Xi’an city | 57.983 | 57.638 | 56.487 | 56.915 | 1.307 | 1.318 | 1.358 | 1.283 | 0.729 | 0.735 | 0.758 | 0.797 |
SHDI can reflect the heterogeneity of landscape patches and is particularly sensitive to the uneven distribution of patches, which emphasizes the contribution of rare patch types to information. In the Yanliang, Lintong, Chang’an, Lantian, and Zhouzhi districts, SHDI increased; that is, the landscape heterogeneity increased. In Yanta District, SHDI decreased, indicating that the landscape heterogeneity decreased. In 2018, the SHDI of the Xincheng, Beilin, and Lianhu districts was 0 because the entire landscape in this area was only composed of one block in 2018. The SHDI of Xi’an City and the Baqiao, Weiyang, Gaoling, and Huyi districts fluctuated throughout the study period.
SHEI can reflect the degree of the landscape type’s control over the overall landscape. From 1990 to 2018, SHEI showed an increasing trend in Xi’an and the Yanliang, Lintong, Gaoling, Lantian, and Zhouzhi counties. All landscape patches showed a balanced development trend. SHEI decreased in Yanta District. In 2018, the SHEI of the Xincheng, Beilin, and Lianhu districts was 0 because the entire landscape in this area was only composed of one block in 2018. The SHEI of the Baqiao, Weiyang, Chang’an, and Unremarkable districts fluctuated during the entire study period.
4 Discussion
4.1 Land use change
From 1990 to 2018, land use in the study area changed significantly and rapidly. The trends and magnitudes of these changes varied in space and time. In most LUCC studies, the Markov transition model was used to study the processes and trends of land use change [29,30,31,32]. These studies regarded land use change as a Markov stochastic process and constructed the transition matrix by overlapping land type maps in different periods. However, when the implementation of government policies led to major changes, such as the implementation of the western development policy, land use was not metastable [33]. Therefore, based on adopting the Markov model, this study further analyzed the land use change by using TC, NC, and the state index, avoiding the premise of randomness and stationarity required by the Markov model.
As for the change in land use, the area of built-up land continued to increase, and the main source was arable land, which is consistent with the previous results [34]. During the study period, the built-up land in Xi’an expanded significantly, which could have been triggered by the population increase [35,36]. In addition, the implementation of economic policies, such as the Western Development and the Guanzhong–Tianshui Economic Zone Development Plan, and the entry of Xi’an into a new stage of building an international metropolis also led to an increase in residential and commercial facilities in the major towns of the study area. Since 2000, Shaanxi Province has implemented the policy of returning farmland to forest, so from 2000 to 2010, the forest area increased. From 1990 to 2000 and from 2010 to 2018, the forest area decreased because during these two periods, Xi’an vigorously developed the economy, and the built-up land occupied the forest land. It can be seen from Figure 1 that the northern part of Xi’an is flat, and the southern part is mostly mountainous. During the study period, the built-up land in Xi’an was mainly distributed in the northern plain, and the southern mountainous area changed little.
4.2 Land use change on landscape pattern change
In this study, quantitative indicators were used to analyze the landscape pattern and its changes to analyze the degree of landscape fragmentation. The analysis of landscape indicators was carried out at the class and landscape levels. The results of the analysis can provide an in-depth understanding of the LUCC structural trends.
The comparison of the evolution of the landscape pattern and LUCC in Xi’an City reveals that the change of each land use type had a certain impact on its landscape pattern [37]. First is the relationship between PD, ED, and land use area. The PD and the ED increased with the unused land area. The cropland area in the study area gradually decreased, and the density of the cropland patch decreased, indicating that the cropland patch developed in a more concentrated direction during the conversion process. From 1990 to 2010, the PD and ED of built-up land increased with the area. This phenomenon was mainly due to the scattered expansion of built-up land, the occupation of different kinds of land, and the increased fragmentation of the landscape pattern. In general, the change in the landscape pattern in Xi’an City was affected by land use, and the patch form of land use increased in complexity, which was a process from natural random growth to human-guided land change. The spatial pattern of the land use patch expanded from concentration to dispersion.
The analysis of the landscape pattern change of Xi’an City shows that from 1990 to 2010, CONTAG and SHDI declined in Xi’an City but rebounded in 2018, while SHEI gradually increased. The results show that the aggregation degree of each patch decreased, the diversity of the landscape patch decreased most significantly, and the landscape dominance gradually improved. This phenomenon was mainly promoted by the “Xi’an City Master Plan (1995–2010)” implemented in 1999. The construction of various infrastructures rapidly expanded the urbanization land, which became an important land use type in this region. The overall area of cropland, forest land, and grassland was reduced, and this unbalanced land change trend reduced the connectivity and uniformity of the landscape. In general, LUCC had different effects on the urban landscape pattern in Xi’an City. The urban land expansion was the key factor that promoted the landscape pattern change.
4.3 Future land use planning of Xi’an city
Strengthening the protection of ecological security in mountainous areas and consolidating the achievements of returning farmland to forests and grasslands.
According to the geographical location and the distribution characteristics of cropland resources in Xi’an, the newly increased high-quality cropland should be placed as basic farmland.
Encouraging infrastructure construction, secure transportation, water conservancy, energy construction projects and communication facilities, and promoting population and industrial agglomeration.
5 Conclusions
On the basis of the quantitative method, this study analyzed the impact of LUCC on landscape patterns at different scales in typical human settlements in Shaanxi Province. The main conclusions are as follows:
From 1990 to 2018, the built-up land expansion of Xi’an City was the fastest, and its proportion increased from 15.39 to 24.30%. The loss of cropland was the fastest, and the proportion decreased from 43.54 to 35.35%. This result reflects the increased human demand for land in nearby city areas, transforming the agricultural landscape into a man-made type.
LUCC resulted in significant changes in landscape patterns. The built-up land expansion was the key factor that promoted the landscape pattern change. At the regional scale, the patch morphology of most land types tended to be complex and the fragmentation degree increased. The patch morphology evolved from natural randomness to zigzag, and the spatial pattern evolved from the rule set to fragment expansion. Some districts were fully urbanized, such as the Beilin, Lianhu, and Weiyang districts, with an urbanization rate of 100%.
This study helps elucidate the evolution process and mechanism of land resources in the Guanzhong basin and provides theoretical guidance for reviewing the evolution of land resources in the Guanzhong basin. The method is also applicable to other areas. Future research will focus on the ecological effects of land use change in the Guanzhong basin, analyze the simulation and prediction of land use change, and delineate a reasonable spatial control boundary.
Acknowledgments
The authors acknowledge the financial support from the National Natural Science Foundation of China (41571346).
-
Conflict of interest: The authors state no conflict of interest.
Appendix
Land use transition matrix for Xincheng district during 1990–2018
| 2018 | |||||||
|---|---|---|---|---|---|---|---|
| 1990 | Cropland | Forest land | Grassland | Water bodies | Built-up land | Unused land | Total |
| Cropland | 0.00 | 0.00 | 0.00 | 0.00 | 0.19 | 0.00 | 0.19 |
| Forest land | 0.00 | 0.00 | 0.00 | 0.00 | 0.18 | 0.00 | 0.18 |
| Grassland | 0.25 | 0.00 | 0.00 | 0.00 | 0.00 | 0.00 | 0.25 |
| Water bodies | 0.00 | 0.00 | 0.00 | 0.00 | 0.00 | 0.00 | 0.00 |
| Built-up land | 0.00 | 0.00 | 0.00 | 0.00 | 29.52 | 0.00 | 29.52 |
| Unused land | 0.00 | 0.00 | 0.00 | 0.00 | 0.00 | 0.00 | 0.00 |
| Total | 0.25 | 0.00 | 0.00 | 0.00 | 29.88 | 0.00 | 29.88 |
Land use transition matrix for Beilin district during 1990–2018
| 2018 | |||||||
|---|---|---|---|---|---|---|---|
| 1990 | Cropland | Forest land | Grassland | Water bodies | Built-up land | Unused land | Total |
| Cropland | 0.00 | 0.00 | 0.00 | 0.00 | 0.00 | 0.00 | 0.00 |
| Forest land | 0.00 | 0.00 | 0.00 | 0.00 | 0.50 | 0.00 | 0.50 |
| Grassland | 0.21 | 0.00 | 0.00 | 0.00 | 0.00 | 0.00 | 0.21 |
| Water bodies | 0.00 | 0.00 | 0.00 | 0.00 | 0.00 | 0.00 | 0.00 |
| Built-up land | 0.00 | 0.00 | 0.00 | 0.00 | 22.67 | 0.00 | 22.67 |
| Unused land | 0.00 | 0.00 | 0.00 | 0.00 | 0.00 | 0.00 | 0.00 |
| Total | 0.21 | 0.00 | 0.00 | 0.00 | 23.17 | 0.00 | 23.38 |
Land use transition matrix for Lianhu district during 1990–2018
| 2018 | |||||||
|---|---|---|---|---|---|---|---|
| 1990 | Cropland | Forest land | Grassland | Water bodies | Built-up land | Unused land | Total |
| Cropland | 0.00 | 0.00 | 0.00 | 0.00 | 1.56 | 0.00 | 1.56 |
| Forest land | 0.00 | 0.00 | 0.00 | 0.00 | 0.51 | 0.00 | 0.51 |
| Grassland | 0.00 | 0.00 | 0.00 | 0.00 | 0.00 | 0.00 | 0.00 |
| Water bodies | 0.00 | 0.00 | 0.00 | 0.00 | 0.00 | 0.00 | 0.00 |
| Built-up land | 0.00 | 0.00 | 0.00 | 0.00 | 36.26 | 0.00 | 36.26 |
| Unused land | 0.00 | 0.00 | 0.00 | 0.00 | 0.00 | 0.00 | 0.00 |
| Total | 0.00 | 0.00 | 0.00 | 0.00 | 38.33 | 0.00 | 38.33 |
Land use transition matrix for Baqiao district during 1990–2018
| 2018 | |||||||
|---|---|---|---|---|---|---|---|
| 1990 | Cropland | Forest land | Grassland | Water bodies | Built-up land | Unused land | Total |
| Cropland | 126.07 | 2.26 | 2.96 | 1.50 | 60.09 | 0.00 | 192.89 |
| Forest land | 0.94 | 24.37 | 0.28 | 1.07 | 6.38 | 0.00 | 33.05 |
| Grassland | 12.08 | 1.33 | 19.55 | 0.25 | 4.94 | 0.00 | 38.15 |
| Water bodies | 0.54 | 0.89 | 0.07 | 11.88 | 2.80 | 0.00 | 16.18 |
| Built-up land | 1.99 | 0.16 | 0.32 | 0.08 | 41.76 | 0.00 | 44.31 |
| Unused land | 0.00 | 0.00 | 0.00 | 0.00 | 0.00 | 0.00 | 0.00 |
| Total | 141.62 | 29.01 | 23.19 | 14.79 | 115.97 | 0.00 | 324.58 |
Land use transition matrix for Weiyang district during 1990–2018
| 2018 | |||||||
|---|---|---|---|---|---|---|---|
| 1990 | Cropland | Forest land | Grassland | Water bodies | Built-up land | Unused land | Total |
| Cropland | 126.07 | 2.26 | 2.96 | 1.50 | 60.09 | 0.00 | 192.89 |
| Forest land | 0.94 | 24.37 | 0.28 | 1.07 | 6.38 | 0.00 | 33.05 |
| Grassland | 12.08 | 1.33 | 19.55 | 0.25 | 4.94 | 0.00 | 38.15 |
| Water bodies | 0.54 | 0.89 | 0.07 | 11.88 | 2.80 | 0.00 | 16.18 |
| Built-up land | 1.99 | 0.16 | 0.32 | 0.08 | 41.76 | 0.00 | 44.31 |
| Unused land | 0.00 | 0.00 | 0.00 | 0.00 | 0.00 | 0.00 | 0.00 |
| Total | 141.62 | 29.01 | 23.19 | 14.79 | 115.97 | 0.00 | 324.58 |
Land use transition matrix for Yanta district during 1990–2018
| 2018 | |||||||
|---|---|---|---|---|---|---|---|
| 1990 | Cropland | Forest land | Grassland | Water bodies | Built-up land | Unused land | Total |
| Cropland | 15.52 | 5.22 | 0.04 | 0.50 | 62.77 | 0.00 | 84.05 |
| Forest land | 0.21 | 0.63 | 0.13 | 0.28 | 13.98 | 0.00 | 15.22 |
| Grassland | 2.13 | 0.01 | 0.75 | 0.00 | 1.17 | 0.00 | 4.06 |
| Water bodies | 0.00 | 0.00 | 0.00 | 0.15 | 0.30 | 0.00 | 0.45 |
| Built-up land | 0.28 | 0.01 | 0.00 | 0.00 | 47.40 | 0.00 | 47.68 |
| Unused land | 0.00 | 0.00 | 0.00 | 0.00 | 0.00 | 0.00 | 0.00 |
| Total | 18.13 | 5.87 | 0.92 | 0.93 | 125.62 | 0.00 | 151.46 |
Land use transition matrix for Yanliang district during 1990–2018
| 2018 | |||||||
|---|---|---|---|---|---|---|---|
| 1990 | Cropland | Forest land | Grassland | Water bodies | Built-up land | Unused land | Total |
| Cropland | 172.43 | 0.03 | 1.48 | 0.03 | 28.72 | 0.00 | 202.70 |
| Forest land | 0.03 | 0.22 | 0.00 | 0.00 | 0.31 | 0.00 | 0.57 |
| Grassland | 0.33 | 0.00 | 1.53 | 0.00 | 0.02 | 0.00 | 1.89 |
| Water bodies | 0.21 | 0.00 | 0.00 | 0.73 | 0.03 | 0.00 | 0.96 |
| Built-up land | 2.78 | 0.00 | 0.06 | 0.00 | 35.50 | 0.00 | 38.34 |
| Unused land | 0.00 | 0.00 | 0.00 | 0.00 | 0.00 | 0.00 | 0.00 |
| Total | 175.79 | 0.25 | 3.07 | 0.76 | 64.59 | 0.00 | 244.46 |
Land use transition matrix for Lintong district during 1990–2018
| 2018 | |||||||
|---|---|---|---|---|---|---|---|
| 1990 | Cropland | Forest land | Grassland | Water bodies | Built-up land | Unused land | Total |
| Cropland | 588.59 | 2.08 | 5.40 | 11.59 | 52.36 | 0.00 | 660.01 |
| Forest land | 2.16 | 40.06 | 1.10 | 0.03 | 1.71 | 0.00 | 45.06 |
| Grassland | 15.26 | 0.96 | 82.44 | 0.28 | 1.72 | 0.00 | 100.66 |
| Water bodies | 4.60 | 0.06 | 0.18 | 14.44 | 0.16 | 0.00 | 19.44 |
| Built-up land | 8.95 | 0.13 | 0.12 | 0.14 | 81.53 | 0.00 | 90.87 |
| Unused land | 0.00 | 0.00 | 0.00 | 0.00 | 0.00 | 0.00 | 0.00 |
| Total | 619.57 | 43.29 | 89.23 | 26.49 | 137.47 | 0.00 | 916.05 |
Land use transition matrix for Chang’an district during 1990–2018
| 2018 | |||||||
|---|---|---|---|---|---|---|---|
| 1990 | Cropland | Forest land | Grassland | Water bodies | Built-up land | Unused land | Total |
| Cropland | 551.31 | 3.83 | 16.57 | 2.19 | 115.62 | 0.45 | 689.96 |
| Forest land | 2.98 | 546.43 | 3.31 | 0.12 | 7.07 | 0.00 | 559.92 |
| Grassland | 61.50 | 12.61 | 145.03 | 0.36 | 0.88 | 0.00 | 220.39 |
| Water bodies | 1.50 | 0.07 | 0.23 | 8.57 | 0.10 | 0.00 | 10.48 |
| Built-up land | 7.00 | 0.96 | 0.16 | 0.22 | 99.48 | 0.00 | 107.82 |
| Unused land | 0.00 | 0.00 | 0.00 | 0.00 | 0.00 | 0.00 | 0.00 |
| Total | 624.30 | 563.91 | 165.31 | 11.46 | 223.15 | 0.45 | 1588.58 |
Land use transition matrix for Gaoling district during 1990–2018
| 2018 | |||||||
|---|---|---|---|---|---|---|---|
| 1990 | Cropland | Forest land | Grassland | Water bodies | Built-up land | Unused land | Total |
| Cropland | 168.77 | 1.83 | 0.40 | 2.56 | 59.10 | 0.00 | 232.65 |
| Forest land | 0.12 | 2.27 | 0.00 | 0.36 | 0.04 | 0.00 | 2.79 |
| Grassland | 0.00 | 0.00 | 0.00 | 0.00 | 0.00 | 0.00 | 0.00 |
| Water bodies | 0.47 | 2.50 | 0.93 | 7.28 | 0.12 | 0.00 | 11.29 |
| Built-up land | 3.54 | 0.37 | 0.00 | 0.01 | 34.31 | 0.00 | 38.23 |
| Unused land | 0.00 | 0.00 | 0.00 | 0.00 | 0.00 | 0.00 | 0.00 |
| Total | 172.90 | 6.97 | 1.33 | 10.20 | 93.56 | 0.00 | 284.97 |
Land use transition matrix for Huyi district during 1990–2018
| 2018 | |||||||
|---|---|---|---|---|---|---|---|
| 1990 | Cropland | Forest land | Grassland | Water bodies | Built-up land | Unused land | Total |
| Cropland | 440.88 | 3.36 | 8.49 | 0.52 | 34.25 | 0.06 | 487.55 |
| Forest land | 1.18 | 430.01 | 7.39 | 0.06 | 0.95 | 0.17 | 439.78 |
| Grassland | 54.08 | 4.80 | 218.88 | 0.34 | 0.63 | 0.01 | 278.74 |
| Water bodies | 1.25 | 0.02 | 0.09 | 3.47 | 0.06 | 0.00 | 4.89 |
| Built-up land | 4.98 | 0.13 | 0.05 | 0.02 | 63.23 | 0.00 | 68.42 |
| Unused land | 0.00 | 0.00 | 0.00 | 0.00 | 0.00 | 0.00 | 0.00 |
| Total | 502.37 | 438.32 | 234.91 | 4.41 | 99.12 | 0.24 | 1279.38 |
Land use transition matrix for Lantian county during 1990–2018
| 2018 | |||||||
|---|---|---|---|---|---|---|---|
| 1990 | Cropland | Forest land | Grassland | Water bodies | Built-up land | Unused land | Total |
| Cropland | 611.27 | 15.94 | 36.22 | 1.33 | 25.03 | 0.00 | 689.79 |
| Forest land | 9.26 | 433.20 | 8.57 | 0.24 | 0.32 | 0.06 | 451.65 |
| Grassland | 114.11 | 12.64 | 668.19 | 0.76 | 3.43 | 0.02 | 799.16 |
| Water bodies | 1.24 | 0.21 | 0.78 | 11.95 | 0.13 | 0.00 | 14.32 |
| Built-up land | 3.97 | 0.17 | 1.60 | 0.05 | 44.44 | 0.00 | 50.24 |
| Unused land | 0.00 | 0.04 | 0.02 | 0.00 | 0.00 | 1.09 | 1.15 |
| Total | 739.86 | 462.22 | 715.37 | 14.34 | 73.35 | 1.18 | 2006.31 |
Land use transition matrix for Zhizhi county during 1990–2018
| 2018 | |||||||
|---|---|---|---|---|---|---|---|
| 1990 | Cropland | Forest land | Grassland | Water bodies | Built-up land | Unused land | Total |
| Cropland | 614.26 | 6.03 | 11.89 | 5.84 | 29.78 | 0.21 | 668.01 |
| Forest land | 4.40 | 1418.85 | 17.53 | 0.36 | 0.85 | 0.00 | 1442.00 |
| Grassland | 99.53 | 17.46 | 604.61 | 2.50 | 0.54 | 0.01 | 724.64 |
| Water bodies | 5.29 | 0.03 | 0.87 | 24.58 | 0.13 | 0.00 | 30.91 |
| Built-up land | 8.16 | 0.15 | 0.17 | 0.11 | 68.33 | 0.02 | 76.94 |
| Unused land | 0.20 | 0.00 | 0.00 | 0.00 | 0.01 | 2.01 | 2.22 |
| Total | 731.85 | 1442.52 | 635.07 | 33.39 | 99.63 | 2.24 | 2944.71 |
References
[1] Han Y, Yi D, Ye Y, Guo X, Liu S. Response of spatiotemporal variability in soil pH and associated influencing factors to land use change in a red soil hilly region in southern China. Catena. 2022;212:106074.10.1016/j.catena.2022.106074Suche in Google Scholar
[2] Wu R, Li Y, Wang S. Will the construction of high-speed rail accelerate urban land expansion? Evidences from Chinese cities. Land Use Policy. 2022;114:105920.10.1016/j.landusepol.2021.105920Suche in Google Scholar
[3] Li P, Chen J, Zhao G, Holden J, Liu B, Chan FK, et al. Determining the drivers and rates of soil erosion on the Loess Plateau since 1901. Sci Total Env. 2022;823:153674.10.1016/j.scitotenv.2022.153674Suche in Google Scholar PubMed
[4] Hu J, Liang J, Fang J, He H, Chen F. How do industrial land price and environmental regulations affect spatiotemporal variations of pollution-intensive industries? Regional analysis in China. J Clean Prod. 2022;333:130035.10.1016/j.jclepro.2021.130035Suche in Google Scholar
[5] Zhang X, Wu X, Zhao R, Mu W, Wu C. Identifying the facts and driving factors of deceleration of groundwater table decline in Beijing during 1999–2018. J Hydrol. 2022;607:127475.10.1016/j.jhydrol.2022.127475Suche in Google Scholar
[6] Liu J, Wang M, Yang L. Assessing landscape ecological risk induced by land-use/cover change in a county in china: A GIS- and landscape-metric-based approach. Sustainability. 2020;12:9037.10.3390/su12219037Suche in Google Scholar
[7] Ahmadi MF, Souri B. Spatial analysis of soil quality through landscape patterns in the Shoor River Basin. Southwest Iran Catena. 2022;211:106028.10.1016/j.catena.2022.106028Suche in Google Scholar
[8] Huang J, Wang Y. Cooling intensity of hybrid landscapes in a metropolitan area: relative contribution and marginal effect. Sustain Cities Soc. 2022;79:103725.10.1016/j.scs.2022.103725Suche in Google Scholar
[9] Wang Q, Liu S, Liu Y, Wang F, Liu H, Yu L. Effects of urban agglomeration and expansion on landscape connectivity in the river valley region, Qinghai-Tibet Plateau. Glob Ecol Conserv. 2022;34:e02004.10.1016/j.gecco.2022.e02004Suche in Google Scholar
[10] Caballero CB, Ruhoff A, Biggs T. Land use and land cover changes and their impacts on surface-atmosphere interactions in Brazil: A systematic review. Sci Total Env. 2022;808:152134.10.1016/j.scitotenv.2021.152134Suche in Google Scholar PubMed
[11] Saur R, Rathore VS. Flashy river channel migration and its impact in the Jiadhal river basin of Eastern Himalaya, Assam, India: A long term assessment (1928–2010). J Earth Syst Sci. 2022;131(1):1–3.10.1007/s12040-021-01790-0Suche in Google Scholar
[12] Shen Z, Wang Y, Su H, He Y, Li S. A bi-directional strategy to detect land use function change using time-series landsat imagery on google earth engine: A case study of Huangshui River Basin in China. Sci Remote Sens. 2022;5:100039.10.1016/j.srs.2022.100039Suche in Google Scholar
[13] Yang H, Zhong X, Deng S, Nie S. Impact of LUCC on landscape pattern in the Yangtze River Basin during 2001–2019. Ecol Inf. 2022;69:101631.10.1016/j.ecoinf.2022.101631Suche in Google Scholar
[14] Liu Y, Xu J, Yuan Z, Sha Z. Analysis of the influence of the water balance process on the change of landscape patterns in the upper reaches of the Yangtze River. Water Policy. 2022;24:261–81.10.2166/wp.2022.096Suche in Google Scholar
[15] Biswas G, Sengupta A. Assessment of agricultural prospects in relation to land use change and population pressure on a spatiotemporal framework. Env Sci Pollut R. 2022;29(28):43267–86.10.1007/s11356-021-17956-8Suche in Google Scholar PubMed
[16] Ma X, Peng S. Research on the spatiotemporal coupling relationships between land use/land cover compositions or patterns and the surface urban heat island effect. Env Sci Pollut Res Int. 2022;29(26):39723–42.10.1007/s11356-022-18838-3Suche in Google Scholar PubMed
[17] Salvati L, Zambon I, Chelli FM, Serra P. Do spatial patterns of urbanization and land consumption reflect different socioeconomic contexts in Europe? Sci Total Env. 2018;625:722–30.10.1016/j.scitotenv.2017.12.341Suche in Google Scholar PubMed
[18] Lausch A, Blaschke T, Haase D, Herzog F, Syrbe RU, Tischendorf L, et al. Understanding and quantifying landscape structure – A review on relevant process characteristics, data models and landscape metrics. Ecol Model. 2015;295:31–41.10.1016/j.ecolmodel.2014.08.018Suche in Google Scholar
[19] Xu Y, Yu L, Peng D, Zhao J, Cheng Y, Liu X, et al. Annual 30-m land use/land cover maps of China for 1980–2015 from the integration of AVHRR. MODIS Landsat data using BFAST Algorithm Sci China Earth Sci. 2020;63:1390–407.10.1007/s11430-019-9606-4Suche in Google Scholar
[20] Verma R, Garg PK. Mapping the spatiotemporal changes of land use/land cover on the urban heat island effect by open source data: A case study of Lucknow, India. J Indian Soc Remote Sens. 2021;49:2655–71.10.1007/s12524-021-01421-7Suche in Google Scholar
[21] Zhou X, Zhou Y. Spatio-temporal variation and driving forces of land-use change from 1980 to 2020 in loess plateau of Northern Shaanxi, China. Land. 2021;10(9):982.10.3390/land10090982Suche in Google Scholar
[22] Luo GP, Zhou CH, Chen X, Li Y. A methodology of characterizing status and trend of land changes in oases: a case study of Sangong River watershed, Xinjiang, China. J Env Manage. 2008;88:775–83.10.1016/j.jenvman.2007.04.003Suche in Google Scholar PubMed
[23] Feng Y, Luo G, Lu L, Zhou D, Han Q, Xu W, et al. Effects of land use change on landscape pattern of the manas river watershed in Xinjiang, China. Env Earth Sci. 2011;64:2067–77.10.1007/s12665-011-1029-5Suche in Google Scholar
[24] Long X, Lin H, An X, Chen S, Qi S, Zhang M. Evaluation and analysis of ecosystem service value based on land use/cover change in Dongting Lake wetland. Ecol Indic. 2022;136:108619.10.1016/j.ecolind.2022.108619Suche in Google Scholar
[25] Legarreta-Miranda CK, Prieto-Amparán JA, Villarreal-Guerrero F, Morales-Nieto CR, Pinedo-Alvarez A. Long-term land-use/land-cover change increased the landscape heterogeneity of a fragmented temperate forest in Mexico. Forests. 2021;12:1099.10.3390/f12081099Suche in Google Scholar
[26] Csikos N, Schwanebeck M, Kuhwald M, Szilassi P, Duttmann R. Density of biogas power plants as an indicator of bioenergy generated transformation of agricultural landscapes. Sustainability. 2019;11:2500.10.3390/su11092500Suche in Google Scholar
[27] Kojima N, Laba M, Velez Liendo XM, Bradley AV, Millington AC, Baveye P. Causes of the apparent scale independence of fractal indices associated with forest fragmentation in Bolivia. ISPRS J Photogramm. 2006;61:84–94.10.1016/j.isprsjprs.2006.08.001Suche in Google Scholar
[28] Wei C, Zhang Z, Wang Z, Cao L, Wei Y, Zhang X, et al. Response of variation of water and sediment to landscape pattern in the dapoling watershed. Sustainability. 2022;14:678.10.3390/su14020678Suche in Google Scholar
[29] Yao Z, Wang B, Huang J, Zhang Y, Yang J, Deng R, et al. Analysis of land use changes and driving forces in the yanhe river basin from 1980 to 2015. J Sens. 2021;2021:1–11.10.1155/2021/6692333Suche in Google Scholar
[30] Liu B, Pan L, Qi Y, Guan X, Li J. Land use and land cover change in the yellow river basin from 1980 to 2015 and its impact on the ecosystem services. Land. 2021;10:1080.10.3390/land10101080Suche in Google Scholar
[31] Yi Y, Zhang C, Zhang G, Xing L, Zhong Q, Liu J, et al. Effects of urbanization on landscape patterns in the middle reaches of the Yangtze River Region. Land. 2021;10:1025.10.3390/land10101025Suche in Google Scholar
[32] Wang H, Huang L, Hu J, Yang H, Guo W. Effect of urbanization on the river network structure in Zhengzhou City, China. Int J Env Res Pub He. 2022;19:2464.10.3390/ijerph19042464Suche in Google Scholar PubMed PubMed Central
[33] Wu L, Yang S, Liu X, Luo Y, Zhou X, Zhao H. Response analysis of land use change to the degree of human activities in Beiluo River basin since 1976. Acta Geogr Sin. 2014;69:54–63.Suche in Google Scholar
[34] Li X, Han L, Wei F. Changes and prediction analysis of construction land in Xi’an based on ecological protection. Acta Agr Jiangxi. 2021;33:111–20.Suche in Google Scholar
[35] Zhao Y. The comparison and revelation of the population cluster in Xi’an and Lanzhou. China Econ Tr Her. 2020;24:68–71.Suche in Google Scholar
[36] Gao M, Kang B, Cao L. Application of mathematical model in population forecast of Xi’an. J Xi’an Technol Univ. 2019;39:373–7.Suche in Google Scholar
[37] Cervelli E, Pindozzi S. The historical transformation of peri-urban land use patterns, via landscape gis-based analysis and landscape metrics, in the vesuvius area. Appl Sci-Basel. 2022;12:2442.10.3390/app12052442Suche in Google Scholar
© 2022 Yizhen Zhao et al., published by De Gruyter
This work is licensed under the Creative Commons Attribution 4.0 International License.
Artikel in diesem Heft
- Regular Articles
- Study on observation system of seismic forward prospecting in tunnel: A case on tailrace tunnel of Wudongde hydropower station
- The behaviour of stress variation in sandy soil
- Research on the current situation of rural tourism in southern Fujian in China after the COVID-19 epidemic
- Late Triassic–Early Jurassic paleogeomorphic characteristics and hydrocarbon potential of the Ordos Basin, China, a case of study of the Jiyuan area
- Application of X-ray fluorescence mapping in turbiditic sandstones, Huai Bo Khong Formation of Nam Pat Group, Thailand
- Fractal expression of soil particle-size distribution at the basin scale
- Study on the changes in vegetation structural coverage and its response mechanism to hydrology
- Spatial distribution analysis of seismic activity based on GMI, LMI, and LISA in China
- Rock mass structural surface trace extraction based on transfer learning
- Hydrochemical characteristics and D–O–Sr isotopes of groundwater and surface water in the northern Longzi county of southern Tibet (southwestern China)
- Insights into origins of the natural gas in the Lower Paleozoic of Ordos basin, China
- Research on comprehensive benefits and reasonable selection of marine resources development types
- Embedded deformation of the rubble-mound foundation of gravity-type quay walls and influence factors
- Activation of Ad Damm shear zone, western Saudi Arabian margin, and its relation to the Red Sea rift system
- A mathematical conjecture associates Martian TARs with sand ripples
- Study on spatio-temporal characteristics of earthquakes in southwest China based on z-value
- Sedimentary facies characterization of forced regression in the Pearl River Mouth basin
- High-precision remote sensing mapping of aeolian sand landforms based on deep learning algorithms
- Experimental study on reservoir characteristics and oil-bearing properties of Chang 7 lacustrine oil shale in Yan’an area, China
- Estimating the volume of the 1978 Rissa quick clay landslide in Central Norway using historical aerial imagery
- Spatial accessibility between commercial and ecological spaces: A case study in Beijing, China
- Curve number estimation using rainfall and runoff data from five catchments in Sudan
- Urban green service equity in Xiamen based on network analysis and concentration degree of resources
- Spatio-temporal analysis of East Asian seismic zones based on multifractal theory
- Delineation of structural lineaments of Southeast Nigeria using high resolution aeromagnetic data
- 3D marine controlled-source electromagnetic modeling using an edge-based finite element method with a block Krylov iterative solver
- A comprehensive evaluation method for topographic correction model of remote sensing image based on entropy weight method
- Quantitative discrimination of the influences of climate change and human activity on rocky desertification based on a novel feature space model
- Assessment of climatic conditions for tourism in Xinjiang, China
- Attractiveness index of national marine parks: A study on national marine parks in coastal areas of East China Sea
- Effect of brackish water irrigation on the movement of water and salt in salinized soil
- Mapping paddy rice and rice phenology with Sentinel-1 SAR time series using a unified dynamic programming framework
- Analyzing the characteristics of land use distribution in typical village transects at Chinese Loess Plateau based on topographical factors
- Management status and policy direction of submerged marine debris for improvement of port environment in Korea
- Influence of Three Gorges Dam on earthquakes based on GRACE gravity field
- Comparative study of estimating the Curie point depth and heat flow using potential magnetic data
- The spatial prediction and optimization of production-living-ecological space based on Markov–PLUS model: A case study of Yunnan Province
- Major, trace and platinum-group element geochemistry of harzburgites and chromitites from Fuchuan, China, and its geological significance
- Vertical distribution of STN and STP in watershed of loess hilly region
- Hyperspectral denoising based on the principal component low-rank tensor decomposition
- Evaluation of fractures using conventional and FMI logs, and 3D seismic interpretation in continental tight sandstone reservoir
- U–Pb zircon dating of the Paleoproterozoic khondalite series in the northeastern Helanshan region and its geological significance
- Quantitatively determine the dominant driving factors of the spatial-temporal changes of vegetation-impacts of global change and human activity
- Can cultural tourism resources become a development feature helping rural areas to revitalize the local economy under the epidemic? An exploration of the perspective of attractiveness, satisfaction, and willingness by the revisit of Hakka cultural tourism
- A 3D empirical model of standard compaction curve for Thailand shales: Porosity in function of burial depth and geological time
- Attribution identification of terrestrial ecosystem evolution in the Yellow River Basin
- An intelligent approach for reservoir quality evaluation in tight sandstone reservoir using gradient boosting decision tree algorithm
- Detection of sub-surface fractures based on filtering, modeling, and interpreting aeromagnetic data in the Deng Deng – Garga Sarali area, Eastern Cameroon
- Influence of heterogeneity on fluid property variations in carbonate reservoirs with multistage hydrocarbon accumulation: A case study of the Khasib formation, Cretaceous, AB oilfield, southern Iraq
- Designing teaching materials with disaster maps and evaluating its effectiveness for primary students
- Assessment of the bender element sensors to measure seismic wave velocity of soils in the physical model
- Appropriated protection time and region for Qinghai–Tibet Plateau grassland
- Identification of high-temperature targets in remote sensing based on correspondence analysis
- Influence of differential diagenesis on pore evolution of the sandy conglomerate reservoir in different structural units: A case study of the Upper Permian Wutonggou Formation in eastern Junggar Basin, NW China
- Planting in ecologically solidified soil and its use
- National and regional-scale landslide indicators and indexes: Applications in Italy
- Occurrence of yttrium in the Zhijin phosphorus deposit in Guizhou Province, China
- The response of Chudao’s beach to typhoon “Lekima” (No. 1909)
- Soil wind erosion resistance analysis for soft rock and sand compound soil: A case study for the Mu Us Sandy Land, China
- Investigation into the pore structures and CH4 adsorption capacities of clay minerals in coal reservoirs in the Yangquan Mining District, North China
- Overview of eco-environmental impact of Xiaolangdi Water Conservancy Hub on the Yellow River
- Response of extreme precipitation to climatic warming in the Weihe river basin, China and its mechanism
- Analysis of land use change on urban landscape patterns in Northwest China: A case study of Xi’an city
- Optimization of interpolation parameters based on statistical experiment
- Late Cretaceous adakitic intrusive rocks in the Laimailang area, Gangdese batholith: Implications for the Neo-Tethyan Ocean subduction
- Tectonic evolution of the Eocene–Oligocene Lushi Basin in the eastern Qinling belt, Central China: Insights from paleomagnetic constraints
- Geographic and cartographic inconsistency factors among different cropland classification datasets: A field validation case in Cambodia
- Distribution of large- and medium-scale loess landslides induced by the Haiyuan Earthquake in 1920 based on field investigation and interpretation of satellite images
- Numerical simulation of impact and entrainment behaviors of debris flow by using SPH–DEM–FEM coupling method
- Study on the evaluation method and application of logging irreducible water saturation in tight sandstone reservoirs
- Geochemical characteristics and genesis of natural gas in the Upper Triassic Xujiahe Formation in the Sichuan Basin
- Wehrlite xenoliths and petrogenetic implications, Hosséré Do Guessa volcano, Adamawa plateau, Cameroon
- Changes in landscape pattern and ecological service value as land use evolves in the Manas River Basin
- Spatial structure-preserving and conflict-avoiding methods for point settlement selection
- Fission characteristics of heavy metal intrusion into rocks based on hydrolysis
- Sequence stratigraphic filling model of the Cretaceous in the western Tabei Uplift, Tarim Basin, NW China
- Fractal analysis of structural characteristics and prospecting of the Luanchuan polymetallic mining district, China
- Spatial and temporal variations of vegetation coverage and their driving factors following gully control and land consolidation in Loess Plateau, China
- Assessing the tourist potential of cultural–historical spatial units of Serbia using comparative application of AHP and mathematical method
- Urban black and odorous water body mapping from Gaofen-2 images
- Geochronology and geochemistry of Early Cretaceous granitic plutons in northern Great Xing’an Range, NE China, and implications for geodynamic setting
- Spatial planning concept for flood prevention in the Kedurus River watershed
- Geophysical exploration and geological appraisal of the Siah Diq porphyry Cu–Au prospect: A recent discovery in the Chagai volcano magmatic arc, SW Pakistan
- Possibility of using the DInSAR method in the development of vertical crustal movements with Sentinel-1 data
- Using modified inverse distance weight and principal component analysis for spatial interpolation of foundation settlement based on geodetic observations
- Geochemical properties and heavy metal contents of carbonaceous rocks in the Pliocene siliciclastic rock sequence from southeastern Denizli-Turkey
- Study on water regime assessment and prediction of stream flow based on an improved RVA
- A new method to explore the abnormal space of urban hidden dangers under epidemic outbreak and its prevention and control: A case study of Jinan City
- Milankovitch cycles and the astronomical time scale of the Zhujiang Formation in the Baiyun Sag, Pearl River Mouth Basin, China
- Shear strength and meso-pore characteristic of saturated compacted loess
- Key point extraction method for spatial objects in high-resolution remote sensing images based on multi-hot cross-entropy loss
- Identifying driving factors of the runoff coefficient based on the geographic detector model in the upper reaches of Huaihe River Basin
- Study on rainfall early warning model for Xiangmi Lake slope based on unsaturated soil mechanics
- Extraction of mineralized indicator minerals using ensemble learning model optimized by SSA based on hyperspectral image
- Lithofacies discrimination using seismic anisotropic attributes from logging data in Muglad Basin, South Sudan
- Three-dimensional modeling of loose layers based on stratum development law
- Occurrence, sources, and potential risk of polycyclic aromatic hydrocarbons in southern Xinjiang, China
- Attribution analysis of different driving forces on vegetation and streamflow variation in the Jialing River Basin, China
- Slope characteristics of urban construction land and its correlation with ground slope in China
- Limitations of the Yang’s breaking wave force formula and its improvement under a wider range of breaker conditions
- The spatial-temporal pattern evolution and influencing factors of county-scale tourism efficiency in Xinjiang, China
- Evaluation and analysis of observed soil temperature data over Northwest China
- Agriculture and aquaculture land-use change prediction in five central coastal provinces of Vietnam using ANN, SVR, and SARIMA models
- Leaf color attributes of urban colored-leaf plants
- Application of statistical and machine learning techniques for landslide susceptibility mapping in the Himalayan road corridors
- Sediment provenance in the Northern South China Sea since the Late Miocene
- Drones applications for smart cities: Monitoring palm trees and street lights
- Double rupture event in the Tianshan Mountains: A case study of the 2021 Mw 5.3 Baicheng earthquake, NW China
- Review Article
- Mobile phone indoor scene features recognition localization method based on semantic constraint of building map location anchor
- Technical Note
- Experimental analysis on creep mechanics of unsaturated soil based on empirical model
- Rapid Communications
- A protocol for canopy cover monitoring on forest restoration projects using low-cost drones
- Landscape tree species recognition using RedEdge-MX: Suitability analysis of two different texture extraction forms under MLC and RF supervision
- Special Issue: Geoethics 2022 - Part I
- Geomorphological and hydrological heritage of Mt. Stara Planina in SE Serbia: From river protection initiative to potential geotouristic destination
- Geotourism and geoethics as support for rural development in the Knjaževac municipality, Serbia
- Modeling spa destination choice for leveraging hydrogeothermal potentials in Serbia