Detection of sub-surface fractures based on filtering, modeling, and interpreting aeromagnetic data in the Deng Deng – Garga Sarali area, Eastern Cameroon
-
Lionel Cedric Yigui
 ,
Arsène Meying
,
Arsène Meying

Abstract
The aeromagnetic anomalies existing in the Deng Deng – Garga Sarali region in Eastern Cameroon were filtered for a structural study of the region’s subsoil. This study presents the results of lineaments and fractures extracted by aeromagnetic image processing methods and compared with scientific data to obtain potential terrain models in the study area. The methodological approach used is based on the filtering of aeromagnetic image by using the analytical signal, the Euler deconvolution, and 2D3/4 modeling, to establish the maps of the lineaments and faults of the study area and their characteristics, and also to propose three models from three previously chosen profiles. Analytical signal and Euler deconvolution techniques have been applied to aeromagnetic anomalies to highlight the relationship between the depth and the source of magnetic anomalies, two parameters whose importance in geoexploration and modeling of the body is essential. We identified the potential contacts by interpretation of the deep Euler anomalies, these are highlighted on the basis of a certain similarity between the maps of the total magnetic field, the map of the analytical signal, the map of the maxima of the gradient horizontal, and geological map. Euler’s map of solutions correlates well with the edges of certain superficial and deep causative bodies.
1 Introduction
The depth and shape of the causative bodies are important parameters, providing information that becomes a guide for subsequent exploration processes such as drilling and modeling of the mineralized body. Total magnetic field data are generally the first set of data to be collected in geophysical exploration [1]. They help identify important targets that may require further examination and general structural geology for a much deeper understanding. Appropriate filtering techniques therefore become crucial since much information must be drawn from this preliminary dataset to guide subsequent exploration processes [2]. It is in this context that the analytical signal filter and the Euler deconvolution filter are applied to the total magnetic field and interpreted relative to each other on the one hand, and on the other hand, the two with respect to the total magnetic field. Analytic signal filter and the Euler deconvolution techniques are normally applied in the analysis of magnetic data but interpreted with reference to the total magnetic map of the field [3]. In this study, we focus on the interpretation of these two techniques by referring to the total magnetic map, with an emphasis on the most important correlations between the two techniques. Any similarity between the two filtering techniques will greatly help to validate future interpretations of the magnetic data in our region, which will allow quick inferences.
2 Geological and tectonic settings of study area
The Deng Deng – Garga Sarali area is situated in the East Cameroon, in Lom and Djerem’s division and affects both the districts of Belabo and Betare-Oya. This study area extends from 13°30′ to 14°45′ east longitude and from 05°00′ to 05°30′ north latitude, covering an area of approximately 8,000 km2.
The altitude here varies approximately between 800 and 1,050 m [4,5,6], the topography is roughly flat, with more or less deep streams and swamps spreading across the region. Tall and thick grasses, thick undergrowth, and sandy soils, mainly ferralitic, and in places lateritic, characterize the region [4,5,6]. The lateritic texture characterizes the presence of rocks covered with a lateritic mantle of weathered rocks [4,5,6] (Figure 1).
![Figure 1
Geological map of the study area (modified after [6]).](/document/doi/10.1515/geo-2022-0357/asset/graphic/j_geo-2022-0357_fig_001.jpg)
Geological map of the study area (modified after [6]).
According to geochronological studies, Cameroon mainly comprises two structural zones:
In the south, the stable Congo craton, represented by the Ntem complex which is a Calco-Magnesian complex from south Cameroon [7].
The central and northern parts correspond to the mobile zone of central Africa, seat of tectonic events of the pan-African which constitutes the essential structure of the pan-African orogeny. This north equatorial orogenic area of east-west direction north of the Congo craton, crosses Cameroon and the Central African Republic (where it is experiencing significant development) and would extend to Northeast Brazil: it constitutes the pan-African chain of central Africa [7]. The synthesis of recent work shows that Africa in general and Cameroon essentially is made up of Precambrian basement comprising magmatic and metamorphic rocks [8,9,10,11,12]. These rocks belong to various eras and are flush. These are mainly granites and migmatites rejuvenated during the pan-African episode.
The region studied belongs to the pan-African chain of Central Africa, it includes metamorphic groups (granite-gneiss, schists, gneiss, and magmatic), granitic intrusive rocks (massive and granitic veins) more or less covered by sedimentary formations, and enclaves (shale and basic materials) [4,13]. The region is dominated by the presence of several mylonitic zones of variable dimensions, which extend towards the NE the Sanaga fault of NE–SW direction, bringing into contact the Lom series and the ancient metamorphic series [4,6].
Two phases or series of folds affected our study area. The first, the ancient metamorphic series, the second the epi-metamorphic series. These orogenic phenomena gave rise to important fractures and ruptures in the basement. The latter being difficult to observe for lack of outcrop [6].
Local tectonics is intricately linked to regional tectonics. It is the set of brittle and plastic deformations that have generated the current geological and mining architecture in Cameroon [6,13,14]. The old structural alignments induced a network of collapsed panels which can be identified by photogeological analysis in the metamorphic series upstream of the Lom [14]. The regional lineaments underline two major structural directions which result from the tectonic phase of readjustment of the base, in the pan-African. On these directions, which are NW–SE and NE–SW, certain sections of the main rivers (Lom, Djerem, and Pangar) and their main tributaries have been aligned [14]. The geologico-tectonic context of Cameroon in general and of the study area in particular is reflected in the fact that it is comprised vast expanses of sedimentary basin [15,16], which is very interesting for mining. Note that here as elsewhere in Africa, there is a large void of geological residue that existed between the Cambrian era and the deposit of cretaceous sediments and young intrusive volcanic rocks [17]. These granite blocks hide sedimentary deposits which mark the process of thermo-tectonic event which the pan-African chain of central Africa underwent Cameroon [8,18]. These deposits contain concentrations of basic minerals and precious materials of high economic value [16].
3 Methodology
Aeromagnetism consists of measuring the intensity of the earth’s magnetic field above the ground from an airplane flying at a precise altitude relative to the earth’s surface, while allowing the determination of the susceptibility of rocks located below the Curie temperature [15]. The processing of aeromagnetic data allows the precise location of the limits of various geological structures and the detection of faults buried in the subsoil. Recall that the appearance of anomalies on the maps or profiles roughly reflect those of the structures but with a spreading effect as a function of the distance between the measurements and the sources and a mixing effect when there are several sources, not too far apart [15]. To correct these effects, transformation operators are used [15]. We will present in this section these operators which will help us in the interpretation of real data acquired during aeromagnetic prospecting campaigns in East Cameroon.
3.1 Horizontal gradient method
Phillips in his work demonstrates that the horizontal gradient method is the simplest approach to locate the geological contacts of bodies in the ground [19]. The major advantages are its insensitivity to noise during aeromagnetic surveys, and the fact that it only takes into account the calculation of the first derivatives of the magnetic field in the horizontal plane [19].
Let M be the anomaly of the magnetic field at any point on Earth. Then, the amplitude of its horizontal gradient (AHG) is given by equation (1), which gives the maxima above the geological contacts if certain assertions are satisfied [9].
with M representing the magnetic anomaly and AHG the horizontal gradient anomaly.
To highlight or to confirm the significant lineament, the data must be transformed by the operator of reduction to the equator and the analytical signal which does not depend on the directions of the magnetization, and the magnetic field will help in the final choice of geological contacts [15].
3.2 Analytical signal method
Li in his work shows that the analytical signal applied in the spatial domain or in the frequency domain, generates a maximum directly on the discrete bodies as well as on their edges [20]. The analytical signal also called total gradient is formed by the combination of the horizontal and vertical gradients of the magnetic anomaly [20]. Its shape on a causal body depends on the locations of the body (horizontal coordinates and depth), and not on its direction of magnetization. Thus, its amplitude is also independent of the direction of the magnetization. The simplification of the magnetic data therefore implies the creation of a function independent of the direction of the magnetization of the body and of the ambient geomagnetic parameters [21]. These parameters are important when the remnant magnetization is not negligible. The analytical signal filter has this property and has been used by several authors for edge detection and estimation of the depth of magnetic bodies [21]. Roest et al. applied it to the detection of the location of the causal body [21], while Hsu et al. used it for the detection of geological limits [22].
The ability of the filter to generate a maximum value directly on the causative body and the depth makes it an extremely useful technique for the interpretation of magnetic data [23].
At each point on the earth’s surface, the amplitude A of the analytical signal of an observed total magnetic field F, is calculated as shown in equation (2).
In our study, the vertical and horizontal derivatives are calculated directly in the Geosoft Oasis Montaj 8.4 software.
The advantage of this magnetic data improvement process is that its amplitude function is always positive and does not require any assumption of direction of the magnetization of the body [24]. In a manner identical to that used in the horizontal gradient method, there are peaks in the amplitude of the analytical signal. The maxima of the analytical signal can be used to detect the structures responsible for the magnetic anomalies observed in the area studied [24].
3.3 Euler deconvolution method
Euler’s deconvolution, based on the solution of Euler’s homogeneity equation (3), is both a limit explorer and a depth estimation method [25]. This method does not require any information on the magnetization vector but simply a prior knowledge of the geometry of the magnetic source [5,25]. The rate of change of field with distance can be used to estimate the depth and location of a source by solving equation (3) below:
where x 0, y 0, and z 0 are the locations of the source of the magnetic field T, measured in x, y, and z; B is the regional value of the total magnetic field; and N is the structural index (SI) which characterizes the geometry of the source.
The most critical parameter in Euler’s deconvolution is the structural index N [5]. It is a homogeneity factor connecting the magnetic field (and its gradient components) to the location of the source. Essentially, N measures the rate of change of fields with the distance from the source (fall rate) and is related to the dimensions of the source. Therefore, by changing N, we can estimate the geometry and depth of the magnetic sources. It has been shown that a poor choice of the structural index provokes a diffuse solution of the locations of the sources and a serious bias in the estimation of the depth. Both Thomson and Reid [5,25] have suggested that a correct N gives the closest grouping of Euler solutions around the geological structure of interest. For the magnetic data, the physically plausible N values go from 0 to 3 taking the values of zero (for infinite depth contact), 0.5 ((for the linear dam subsoil), 1 (for the thin dam), 2 (for the pipe), and 3 for the spherical bodies [1].
4 Data processing
The magnetic data used in this study come from the compilation of data recorded during aeromagnetic surveys carried out in 1970 by the Canadian company SURVAIR on behalf of the Canadian International Development Agency (CIDA) in favor of Cameroon. The aeromagnetic coverage was carried out at a flight altitude of 235 m according to the N135° direction profiles and spaced 750 m apart with a magnetometer recording sensitivity ±0.5 nT [26]. After correction of the measurements due to the temporary variation in the magnetic field, the anomalies of the total Cameroonian magnetic field were deduced from the measurements corrected by subtraction of the theoretical geomagnetic field (or GIFI) at each station, on January 1, 1970. The data are extracted from aeromagnetic maps using the MAP INFO 7.5 software, then operators integrated into the OASIS MONTAJ 8.4 software are applied to these data for the production of the maps.
5 Results
In order to be able to extract the maximum information from the maps produced, we will use the methodology recommended by Baranov [27]. Indeed, we will first carry out a detailed analysis of the geophysical data obtained from the various methods applied, then we will synthesize it to have a much clearer idea of the structure of the soil in our study area. To do this, we will first describe the map of the anomalies of the total magnetic field, then in a second step, we will use some of the mathematical transformation operators mentioned above in order to better manipulate the magnetic cards and extract the most information possible. Finally, from three profiles plotted on the map of the reduced total magnetic field at the equator, we will establish a 2.75D model.
5.1 Map of the total magnetic field anomaly
Cross-sectionally, this map shows that there is little correlation between magnetic anomalies and geological contours. In addition, we can see that the magnetic relief of our working area is disturbed by numerous anomalies of different wavelengths. This seems more obvious in the central part where the magnetic field is particularly agitated and reflects the heterogeneity of the content of the base in magnetic minerals. The superficial effects being strongly masked by regional anomalies of high amplitude, it will, therefore, be up to us to highlight them throughout this work (Figure 2).
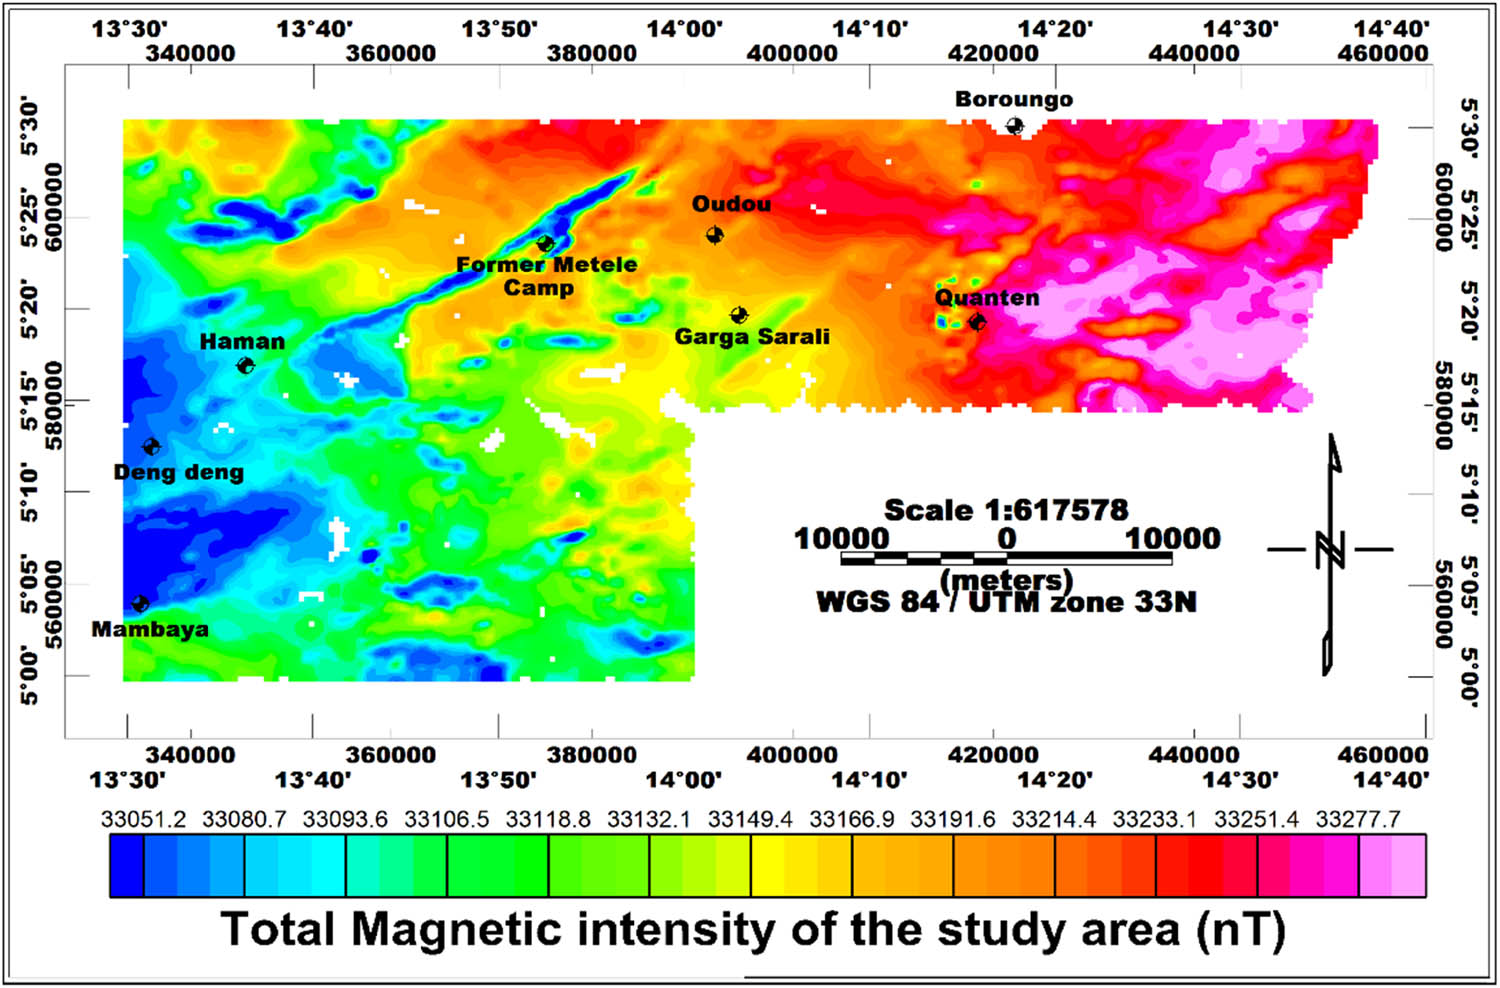
Map of the total magnetic field anomaly.
On this map, there are two main magnetic fields, namely:
Domain 1, located in the zones of Deng Deng, Haman, and extending in the central part (Garga Sarali) of our study region, this domain is characterized by negative anomalies if not small amplitudes. These approximate direction anomalies ENE–WSW would be due to the deposits of shales on the granites; note here the presence of a strongly negative intensity anomaly towards ENE–WSW which infiltrates continuously from the village of Haman to the village of Kongolo via the former Metele camp.
Domain 2, meanwhile, encompasses the north and east of our study area, thus sweeping the villages of Kungolo and Quanten, and even the former Metele camp located in the center of the map. Here the anomalies are positive and sometimes reach 120 nT. The magnetic field, particularly agitated here, would reflect the heterogeneity of the base content of magnetic minerals. Other anomalies rather coincide with areas covered by more recent deposits, notably north of the village of Haman and south of Mambaya. Some of these anomalies are probably associated with the Mesozoic magmas injected into the Paleozoic cover represented here by the intermediate series of Yaoundé and Lom which have been taken up and reworked by the pan-African process.
5.2 Map of the anomalies of the total magnetic field reduced to the equator (with selected profiles)
Figure 3 shows the map of the total magnetic field reduced to the equator. The equatorial reduction was calculated by taking the values of tilt and declination on January 1st, 1970 for our study area. These values are: I = −13.21° and D = −5.09°, respectively, the inclination and the declination of the magnetic field.

Map of the anomaly of the total magnetic field reduced to the equator (TMI-RTE) with selected profiles. With P1: profile no. 1; P2: profile no. 2; and P3: profile no. 3.
The minimum value of the magnetic field went from −20.5 to −14.5 nT, while the maximum value has hardly changed. The above positive and negative anomalies are always present and well defined with the same directions. The intrusions present in the village of Quanten are even more interesting here.
These intrusions could be due to the presence of migmatites (embrechites) under the granite layers of the region. The presence of well localized positive anomalies testifies here (mobile area) to a magmatic rise in shales [3]. The strong magnetic anomalies (reaching 107 nT) in the regions of Kongolo, in the north-west of the map, correspond perfectly to the granitic nature of the granular and crushed rocks which underwent a high metamorphism and a granitization carried out in accordance with the Precambrian crystalline bases of that portion.
5.3 Maps extended to the top of the total magnetic field anomaly reduced to the equator
The map of the anomalies of the total magnetic field reduced to the equator has been extended upwards in order to amplify the long wavelength anomalies linked to the deep structures of the base in order to be able to highlight them. The extension was carried out at altitudes of 500, 1,000, 2,000, 3,000, 4,000, and 5,000 m. It results from the observation of the resulting maps that the large anomaly of positive intensity located east of our study area is present and always well defined, the low amplitude anomaly is also present and better defined. The strongly negative ENE–WSW direction anomaly noted above and the intrusion zones disappear very quickly, proving that they are the result of recent and superficial events. The large persistent positive anomaly east of our map is associated with calc-alkaline granites (Figure 4).
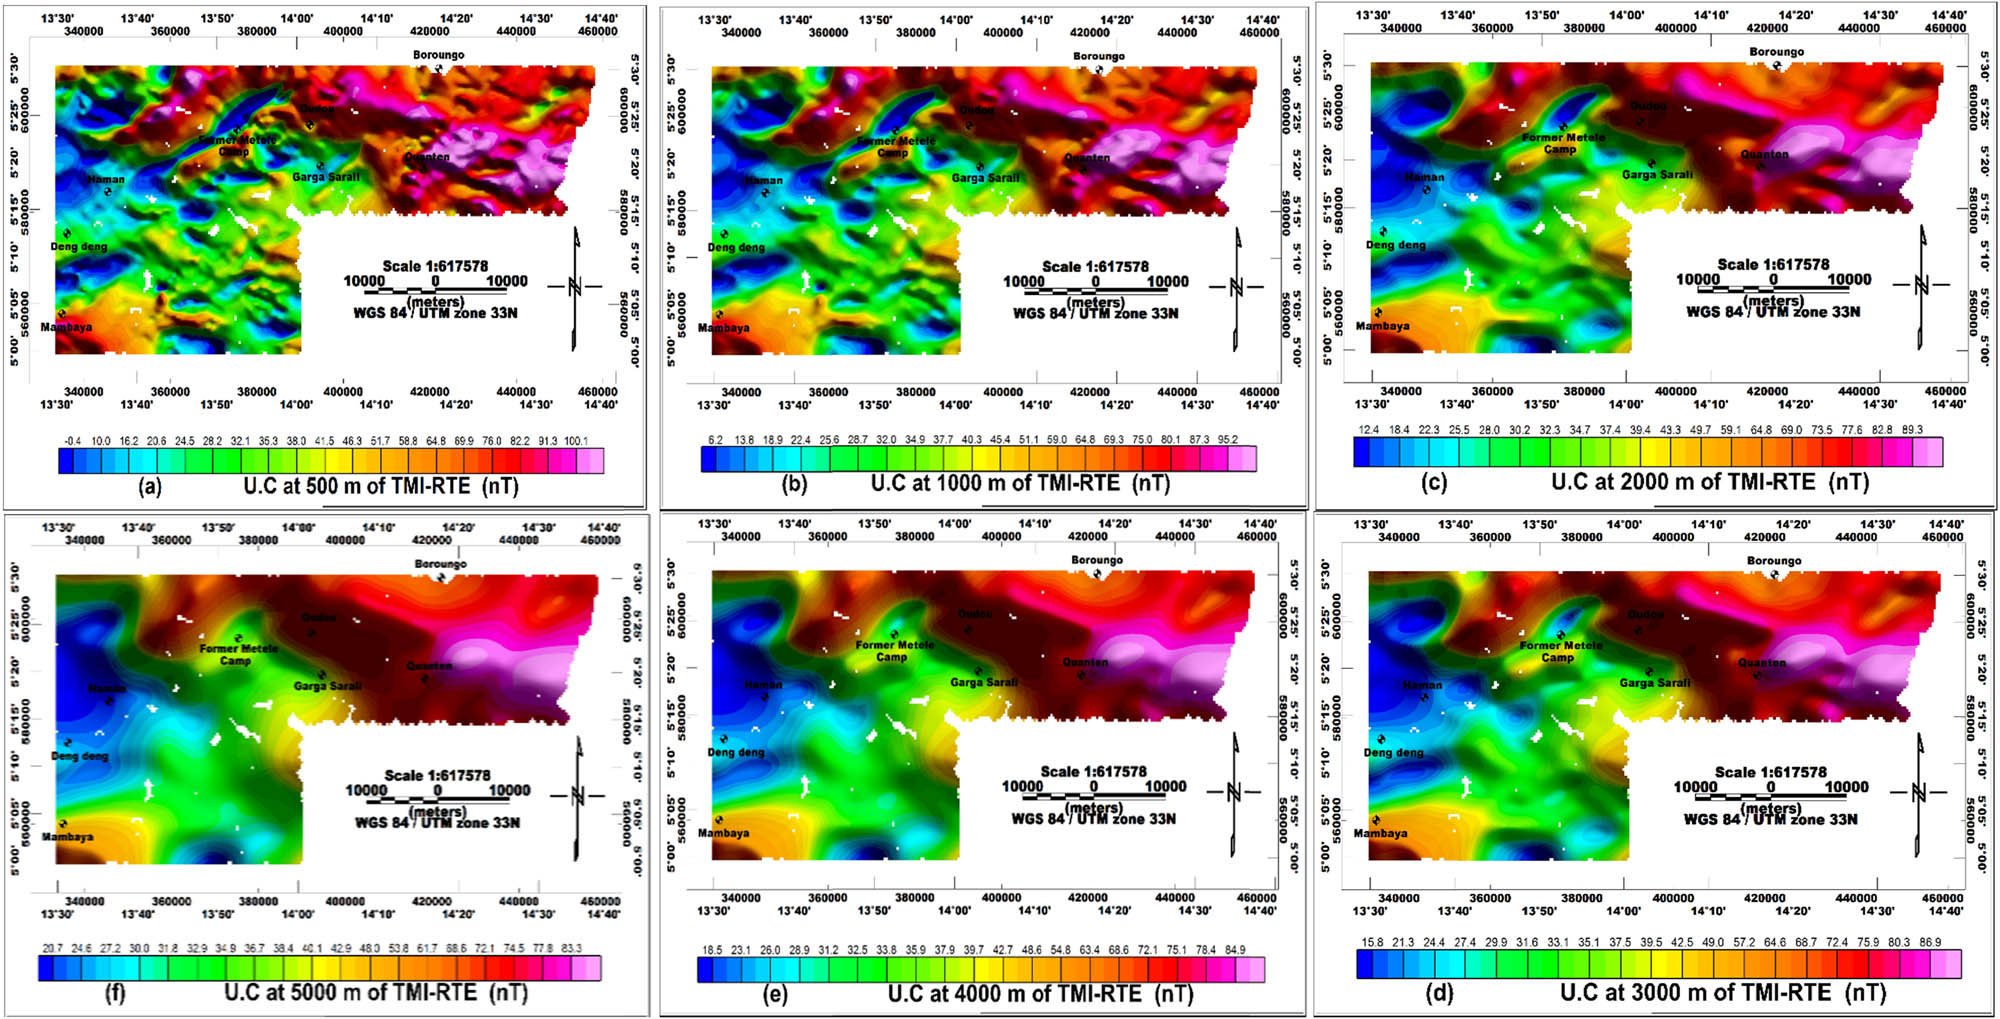
Extended maps of the total magnetic field anomaly reduced at the equator. U.C.: upward continuation.
5.4 Map of the maximums of the horizontal gradient of the maps extended to 500, 1,000, 2,000, 3,000, 4,000, and 5,000 m
The map above illustrates the local maxima of the horizontal gradient at different altitudes. This card is obtained from the Oasis Montaj 8.4 software. To be able to obtain this card we have taken as parameters (Figure 5):
Peak detection level: more peaks (3)
No filter smoothing passages: 20

Map of the maxima of the horizontal gradient of the maps extended to 500, 1,000, 2,000, 3,000, 4,000, and 5000 m.
On this map, we observe that in some places, the maxima are almost confused and in others, they are almost parallel which would correspond, respectively, to the vertical contact structures and to the different directions of the dip. This would be the result of tectonic accidents in the region. These structures are of directions E–W, N–S, NE–SW, ENE–WSW, and WNW–ESE which mix and correlate very well with the previous results. In the center and east of the map, we observe maxima forming folds.
5.5 Map of lineaments
It should already be noted from Scanvic [28] that the interpretation of lineaments following their mapping constitutes the essential link in geological and structural mapping. The superimposition map of the horizontal gradient maxima of the maps extended to 500, 1,000, 2,000, 3,000, 4,000, and 5,000 m allows us to highlight the different lineaments. The major lineaments are drawn for a superposition of contacts of at least four different altitudes, while the minor lineaments are obtained for at most three different maxima superimposed. The map of lineaments thus obtained comprises a total of 60 lineaments. The main families of lineaments are E–W, N–S, NE–SW, ENE–WSW, and WNW–ESE, with a total of 61% of major lineaments and 39% of minor lineaments (Figures 6 and 7).

Map of lineaments.

Rose diagram of the lineament orientations. (a) Major lineaments. (b) Minor lineaments.
These magnetic lineaments (and their characteristics) compiled in Table 1 reflect with Dobrin and Savit, the geological conditions of the subsoil and provide information on the tectonic events which affected the rocks of the region [29].
Direction and characteristics of the main lineaments identified
| Lineament no. | Dip direction | Average length (m) | Lineament no. | Dip direction | Average length (m) | Lineament no. | Dip direction | Average length (m) |
|---|---|---|---|---|---|---|---|---|
| L1 | Vertical | 110,253 | L21 | S–E | 6,842 | L41 | N | 4,737 |
| L2 | N–W | 15,263 | L22 | Vertical | 9,474 | L42 | Vertical | 10,000 |
| L3 | Vertical | 32,632 | L23 | Vertical | 12,632 | L43 | S–E | 7,895 |
| L4 | Vertical | 6,842 | L24 | S–E | 10,526 | L44 | Vertical | 9,474 |
| L5 | Vertical | 7,368 | L25 | Vertical | 13,684 | L45 | Vertical | 8,947 |
| L6 | Vertical | 10,526 | L26 | S–E | 7,895 | L46 | S | 6,316 |
| L7 | Vertical | 6,316 | L27 | Vertical | 14,210 | L47 | Vertical | 4,210 |
| L8 | Vertical | 4,210 | L28 | Vertical | 2,632 | L48 | Vertical | 5,789 |
| L9 | Vertical | 11,579 | L29 | Vertical | 5,789 | L49 | S–W | 4,737 |
| L10 | S | 10,526 | L30 | S | 5,263 | L50 | Vertical | 3,158 |
| L11 | S–W | 5,263 | L31 | Vertical | 4,737 | L51 | S–E | 6,316 |
| L12 | Vertical | 8,947 | L32 | Vertical | 3,158 | L52 | Vertical | 5,789 |
| L13 | Vertical | 7,895 | L33 | Vertical | 7,368 | L53 | Vertical | 12,632 |
| L14 | Vertical | 6,316 | L34 | Vertical | 7,895 | L54 | Vertical | 4,210 |
| L15 | Vertical | 6,316 | L35 | Vertical | 10,526 | L55 | Vertical | 7,895 |
| L16 | S–W | 6,842 | L36 | Vertical | 4,210 | L56 | Vertical | 4,210 |
| L17 | S–W | 9,474 | L37 | Nord | 6,842 | L57 | Vertical | 5,789 |
| L18 | Vertical | 1,4210 | L38 | Vertical | 8,947 | L58 | S–E | 7,895 |
| L19 | S | 8,421 | L39 | S–E | 12,632 | L59 | Vertical | 4,210 |
| L20 | Vertical | 6,842 | L40 | Vertical | 5,263 | L60 | S–E | 11,053 |
5.6 Analytic signal map
It is immediately recognized with Li, Roest et al., and Blakely [20,21,30] that the amplitude of the analytical signal depends truly little on the direction of magnetization and is almost independent when the sources are vertical. This map highlights the positions of the sources in the horizontal and vertical planes. The anomalies here have amplitudes which vary between 0.003 and +0.083 nT/m. The limits of contacts and intrusions of strong magnetization are well highlighted on this map. We note here the presence of ENE–WSW direction anomalies extended in the center from Haman and crossing the former Metele camp, as well as east of Garga Sarali. These anomalies would probably characterize the linear structures. On the other hand, in the south, east, and north of our study area, we have pseudo-circular anomalies which suggest intrusions of strongly magnetized bodies in the base (Figure 8).

Map of the analytical signal.
5.7 Map of Euler’s solutions
Euler’s deconvolution is a remarkably effective method which makes it possible to locate the magnetic contacts in the horizontal plane as well as their depth with little information on the magnetization of the causative sources [31]. After varying the structural index, a movable window and tolerance, and after comparing the results obtained, it was easy to see that only the following parameters give us satisfactory results (Figure 9):
Structural index N = 1 for faults and dikes with low discharge.
A movable window W = 5 km × 5 km; A tolerance Z = 20% on the depth estimate. On this map, the depths of Euler vary on average from 250 to 1,750 m.
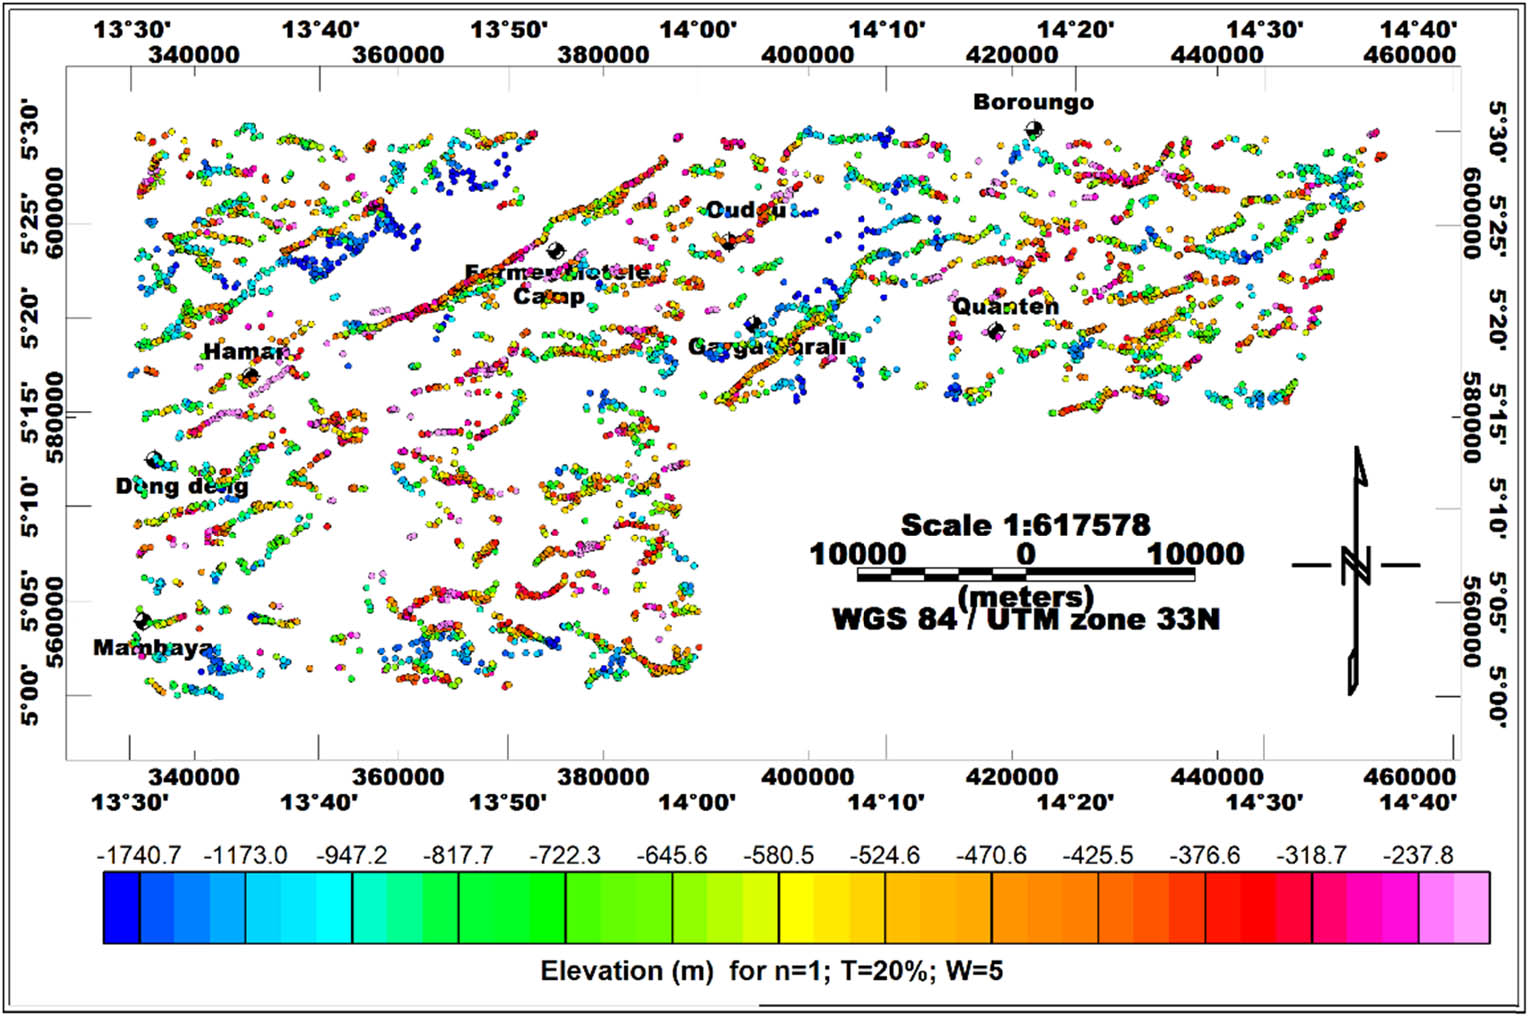
Map of Euler’s solutions.
Reid et al. [25] suggested that a good grouping of solutions indicates that the location of the source is well defined, and a dispersion indicates that the solutions should probably be ignored. A very quick observation allows us to see that Euler’s solutions are generally well grouped here along well-defined lines. Colors range from around 150 to 1,800 m. The predominant directions are the same as those noted on the map of lineaments, namely: E–W, NE–SW, ENE–WSW, and WNW–ESE.
5.8 Structural analyses of maps
5.8.1 Magnetic lineaments superimposed on magnetic anomalies
Figure 10a illustrates that the lineaments generally follow the directions of the various gradients highlighted on the TMI-RTE. We also note that all areas (strongly magnetized or not) of our region have been affected by regional tectonics.

Overlay of the lineaments and significant maps. (a) Superposition of TMI-RTE and lineaments map's, (b) superposition of analytic signal and lineaments map's, (c) superposition of AS deriv-Z and lineaments map's, (d) superposition of lineaments map's and Euleur's solutions, (e) superposition of geologic map and lineaments map's, and (f) superposition of geologic map, Euler's solutions, and lineaments map’s.
5.8.2 Magnetic lineaments superimposed on the maps of the analytical signal
From Figure 10b, we observe that the spatial localization of the lineaments given by the chart of the analytical signal correlates very well with the localization given by the maxima of the horizontal gradient. This correlation is moreover confirmed by Figure 10c, where the map of lineaments was superimposed on the first derivative of the analytical signal which was used to separate the close and coalescent anomalies. The contacts highlighted above are therefore certain and show that the region of study has been the scene of intense tectonic activity.
5.8.3 Magnetic lineaments superimposed on Euler solutions
This superposition given by Figure 10d makes it possible to note that certain solutions of Euler almost align on certain lineaments traced above. Therefore, on this basis we can say that the Euler solutions were given for a structural index N = 1 corresponding to the faults, among these lineaments, some if not most correspond to faults, while others are simply contacts. These distinctions are compiled in Table 2.
Characteristics of the main faults identified
| Lineament no. corresponding to the faults | Fault direction | Dip direction | Average depth (m) | Lineament no. corresponding to the faults | Fault direction | Dip direction | Average depth (m) |
|---|---|---|---|---|---|---|---|
| L2 | ENE–WSW | NW | 700 | L23 | NE–SW | Vertical | 800 |
| L3 | ENE–WSW | Vertical | 370 | L24 | ENE–WSW | SE | 1,200 |
| L4 | NW–SW | Vertical | 700 | L26 | ENE–WSW | SE | 1,200 |
| L6 | ENE–WSW | Vertical | 450 | L30 | E–W | S | 350 |
| L9 | ENE–WSW | Vertical | 620 | L33 | ENE–WSW | Vertical | 850 |
| L13 | ENE–WSW | Vertical | 600 | L42 | NE–SW | Vertical | 380 |
| L14 | WNW–ESE | Vertical | 700 | L47 | E–W | Vertical | 600 |
| L15 | WNW–ESE | Vertical | 950 | L48 | E–W | Vertical | 1,200 |
| L21 | NE–SW | SE | 350 | L53 | WNW–ESE | Vertical | 480 |
| L22 | NE–SW | Vertical | 350 | L59 | ENE–WSW | Vertical | 300 |
| L60 | NE–SW | SE | 350 |
5.8.4 Magnetic lineaments and geology
The magnetic lineaments were superimposed on the geological map first (Figure 10e) and then the map in Figure 10e was superimposed on Euler’s solutions (Figure 10f) in order to obtain the interpretative structural map of the study area. In this map, the main boundaries between the areas with significant contrast of magnetic susceptibility in the soil are summarized. These limits correspond for the most part to tectonic accidents. These two maps specify and/or confirm the layout of brittle structures from previous geological and geophysical studies on the one hand, and on the other hand the richness of our results highlights new accidents not detected by geological studies. The accidents listed here are organized as follows:
The E–W oriented faults are with Mbom-Abane [31], the oldest in the region and are linked to the geodynamic evolution of the pan-African chain of Central Africa.
The ENE–WSW oriented faults correlate with the major direction of the tectonic lines crossing our study area.
NW–SE occur following senestral and dextral radiation and represent fractures with or without vein flow [32].
Certain lineaments combine to give V, or inverted V shapes. These lineaments located in the center and east of the study area suggest mega-folds at these sites in ancient syntectonic granite formations and lower gneisses caused by the resumption of events oriented NE–SW by those oriented NW–SE. Hence, the passage of the tectonic lines at these places.
The NE–SW oriented lineaments represent faults which would be caused by the contact between the Lom series (shale) and the granito-gneissic rocks. These lineaments follow the direction of the Cameroonian center shear.
The presence of lineaments oriented E–W, NE–SW, and N–S justifies the intermediate character of the pan-African chain which is located between the trans-Saharan chains oriented N–S and the chain of Oubanguids oriented E–W [33].
5.9 Modeling
We have extracted 03 magnetic profiles from the grid of field anomalies reduced to the equator (Figure 3). The P1 profile oriented NNW–SSE will highlight the great negative anomaly that crosses the former Metele camp, the P2 profile oriented NW–SE aims to understand the origin of a positive intensity in the midst of negative intensities to the south from Deng Deng. The P3 profile, meanwhile, oriented NNE–SSW will allow us to focus on tectonics which suggest intense activity in the Quanten area. Thus, considering the depths of Euler’s deconvolution, the 2.75D models were calculated with the GM-SYS program integrated into Oasis Montaj (version 8.4). The work carried out consisted in seeking, from a vertical size polygon, the susceptibility which would allow reaching the maximum amplitude of the observed profile. For a better result, we have, as Gérard and Griveau suggest in their work [34], considered that the interface determined by Euler’s deconvolution corresponded to the average roof of the sources. Thereafter, while maintaining the horizontal base, we have, on the basis of the forms deduced from the calculated structural indices (Euler deconvolution), modified the vertex of the body until the calculated anomaly overlaps as best as possible the observed one.
5.9.1 P1 profile modeling
The magnetic topography of this long NNW–SSE direction profile, which is around 33,300 m, reveals four geological layers of different natures which appear from the surface to the base as follows (Figure 11):
Metasediments of average sensitivity 0.024 SI, much more present at north of Haman and south of the former Metele camp,
serito-schists and chlorito-schists of average sensitivity 0.003 SI, which are abundant in the center of the profile,
the 0.025 SI medium sensitivity gneiss which extends over the entire profile, and
the calc-alkaline granites of average sensitivity 0.05 SI which constitute the base.

Model 2.75D of profile P1.
Figure 10 above shows the adjustment between the anomalies observed and those calculated with a relative error of 3.24%. Here the subsidence of the base in places and the vertical contacts are highlighted and taking into account the arrangement of the latter, they would correspond, respectively, from left to right with the lineaments L2 (approximately at a depth of 1,000 m), L3 (approximately at a 300 m depth), and L6 (approximately at a depth of 800 m), which are faults. The long negative anomaly would therefore be due to a granitic rise of the covers.
5.9.2 P2 profile modeling
The P2 direction NNW–SSE profile extends over approximately 32,900 m. This profile begins in the South of Deng Deng and ends in the southeast of Mambaya. It suggests the same four geological layers but with a different lithology characterized by weak layers of metasediments, a large thickness of gneiss which is sometimes exposed. However, it also highlights vertical or almost vertical contacts south of Deng Deng and southeast of Mambaya at depths of around 300–600 m, and subsidence of the base in places. The strong positive anomaly trapped between the negative anomalies would correspond to a massive presence of shales in the area. The adequacy between the observed and calculated anomalies is excellent here with an accuracy of 2.1% (Figures 12 and 13).

Model 2.75D of profile P2,.

Model 2.75D of profile P3.
5.9.3 P3 profile modeling
The P3 profile is oriented NNE–SSW and extends over an average of 25,500 m. This profile which goes from Boroungo to Quanten presents irregular shapes suggesting a crushing which makes it possible to say that this zone of Quanten was the theater of an intense tectonic activity. The intrusions observed on the previous maps would be the result of the latter probably due to a strong collision. Here and there we see granite rising, sagging of the base, and vertical contacts. The latter are found at average depths of 150 m (south of Boroungo), 200–1,200 m (north of Quanten), and 900 m (south of Quanten). The clear adjustment between the anomalies observed and those calculated gives an accuracy of 4.62%.
The modeling results clearly show that the underlying rocks that gave rise to the magnetic signatures, as seen on the geological map of the region, do not exactly match those of the generated models.
6 Discussion
The qualitative interpretation of the magnetic field map suggests that the structures at the origin of the observed anomalies are located deep in the crust and constitute intrusive bodies of strong magnetization. The superimposition of the maxima of the horizontal gradient coupled with the upward extension at different altitudes, on the one hand, and the Euler deconvolution, on the other hand, allowed us to characterize the faults (Table 2) faults which correlate well with lines of faults and tectonic lines present in the region, and which cross-sectionally informs about the structural and tectonic aspect of our study area.
The interpretative map of the region (Figure 10e), obtained by superposition of the map of the magnetic lineaments and the geological map, after removing the effect of the deep structures of the total magnetic fields observed, summarizes the signatures of the shallow bodies. These shallow bodies are associated with substances, such as magnetite and hematite, which contain a deposit of iron ore (magnetic exploration).
The main limits between the zones with a strong contrast of magnetic susceptibility under the ground and several of these limits correspond to tectonic accidents. This confirms and specifies not only the layout of the brittle structures resulting from the previous geological and geophysical studies but also highlights new accidents not detected by the geological studies.
Before saying more about the models obtained, let us first recall that three parameters underlying our model, namely: the magnetic susceptibility contrast, the depth (or the limits of vertical extension), and the shape of the sources. The models obtained can be considered reliable given the sufficiently high precision. However, in addition to the estimation of depths and shape, the susceptibility parameter is not constrained, which then leaves the possibility of having an infinity of terrain models, all of which can be as different as each other.
Thus, the reliability of the conclusion depends on the precision with which the results were obtained. Note, however, that formations likely to be magnetic cannot be found at depths greater than that of the Curie point. This depth is difficult to specify. Admitting with Chapman and Pollack [35], with a heat flux of 40 mW/m2 for Central Africa, and a curie temperature of 300°C (case of highly metamorphosed and granitized rocks present in the region) we can exceed, according to the geothermal gradient, Curie depths of 25 km. This assumption seems reasonable for old terrains where the gradient must be relatively low. Indeed, the magnetic map shows little correlation with the surface geology.
Regarding the models obtained and the map of the lineaments, we can undoubtedly state that our study area was the scene of intense tectonic activity. In addition, the intrusion zones suggested on the TMI and TMI-RTE maps would rather be in accordance with the models obtained from the zones of intense tectonic crushing or due to granitic rise under the covers which, in any case, is good augurs for mineral exploration because they constitute ore traps.
Clearly, the study area shows the existence of brittle tectonics marked by faults in diversified directions in agreement with the known tectonic and structural directions of our study area [6,14,32,36].
The resulting fault system is characterized by a diversity of directions, which highlights the geological heterogeneity of the area which is part of a regime of structures of the Riedel’s system [37,38,39]. Indeed, the NE–SW direction (deformation phase D2) corresponds to the P-type Riedel structures which are the lithological signatures of the regional schistosity [4,40,41]. The ENE–WSW direction (deformation phase D3) corresponds here to the materialization of the mylonitic foliation which includes the Central Cameroonian shear zone, the Sanaga Fault, the Betare-Oya shear zone, and the Adamawa shear zone (ASZ) [6,16,40,42]. The NW–SE and ESE–WNW directions represent the R′-type Riedel structures, while the N–S and NNW–SSE (deformation phase D2) correspond to the secondary Riedel structures of P′-type. Finally, the ESE–WNW and NNW–SSE directions are kinematic markers of readjustment linked to transpression formed during the pan-African orogeny [4,17,40,41,43].
The geometry of the structures noted here highlights a dextral shear along the NE–SW and ENE–WSW structures which facilitated the development of the structures oriented NW–SE to ESE–WNW and E–W during the pan-African orogeny [4,40,41,44].
From all the above it is established that the deformation phases D1, D2, D3, and D4, affected the study area generating structures with various shapes and directions.
7 Conclusion
It is clear from all the above that the underlying rocks that gave rise to the magnetic signatures, as seen on the geological map of the region, do not exactly match those of the generated models. The results revealed the highlighting of the compression, bending and shear axes, mylonitic veins several kilometers long, and oriented NE–SW. The framework of regional and local structures in the area is characterized by major faults and other structural elements striking mainly in the directions NE–SW, NW–SE, ENE–WSW, N–S, and E–W. The results obtained effectively show that the study area is crossed by the two former major dextral shear corridors which are the Cameroonian center shear direction EW and NE–SW, and the extension of the Sanaga fault which passes through the former Metele camp and in the direction of ENE–WSW. Estimating the depths of some of these intrusive bodies gave Euler deconvolution of depths between 300 and 800 m. For deep faults, the depths vary from 800 to 1,300 m which gives some satisfaction with the knowledge of the internal structure of the soil. The 2.75D models are acceptable because they show the bodies of strong magnetization in depth even though the geological structures are most often in 3D. These models correspond well to a compression and continental collision. The extended maps show us that the bodies generated by the anomalies crossed by the profiles P1 and P2 are rooted at the base of the crust, that is to say that they have a deep structure compared to the intrusive body crossed by the profile P3 which has a surface structure.
Acknowledgments
This work was carried out at the University of Yaounde I, Cameroon, as a part of first author’s Ph.D. studies. The authors thank the reviewers for their valuable comments.
-
Conflict of interest: The authors declare that there are no conflicts of interest regarding the publication of this article.
-
Data availability statement: The data used to support the findings of this study are available from the corresponding author upon request.
References
[1] Ghosh GK, Gupta RD, Khanna AK, Singh SN. Application of euler deconvolution of gravity and magnetic data for basement depth estimation in Mizoram area. Geohorizons. 2012;13–9. 10.3997/2214-4609.20143715.Search in Google Scholar
[2] Thabisani N, Mashingaidze RT, Mpofu P. Analytic signal and Euler depth interpretation of magnetic anomalies: applicability to the Beatrice Greenstone Belt. J Geogr Geol. 2015;7(4):108–12. ISSN 1916-9779 E-ISSN 1916-9787.10.5539/jgg.v7n4p108Search in Google Scholar
[3] Ndougsa-Mbarga T, Feumoé NSA, Manguelle-Dicoum E, Fairhead DJ. Aeromagnetic data interpretation to locate buried faults in South-East Cameroon. Geophysica. 2012;48(1–2):49–63.Search in Google Scholar
[4] Kankeu B. Anisotropie magnétique des roches dans la zone de Garga-Sarali Betare-Oya. Thèse de doctorat. University of Yaoundé I. Faculty of Science; 2008. p. 298.Search in Google Scholar
[5] Thompson DT. EULDPH: A new technique for making computer-assisted depth estimates from magnetic data. Geophysics. 1982;47:31–7. 10.1190/1.1441278.Search in Google Scholar
[6] Gazel J, Gerard G. Carte géologique de reconnaissance du Cameroun au 1/500000, feuille Batouri-Est avec notice explicative. Yaoundé, Cameroun: Mémoire Direction des Mines et de la Géologie; 1954. p. 43.Search in Google Scholar
[7] Bessoles B, Trompette R. Géologie de l’Afrique. La chaîne Pan-Africaine « Zone Mobile » d’Afrique Centrale (partie sud) et zone mobile soudanaise. Mém BRGM. 1980;71–8246(92):396.Search in Google Scholar
[8] Olinga JB, Mpesse JE, Minyem D, Ngako V, Ndougsa-Mbarga T, Ekodeck GE. The Awae-Ayosstrike-slip shearzones (Southern Cameroon): Geometry, kinematics and significance in the late Pan-African tectonics. N Jb Geol Paläont Abh. 2010;257(1):1–11. 10.1127/0077-7749/2010/0042.Search in Google Scholar
[9] Mvondo H, Owona S, Mvondo-Ondoua J, Essono J. Tectonic evolution of the Yaounde segment of the Neoproterozoic central African orogenic belt in southern Cameroon. Can J Earth Sci. 2007;44:433–44. 10.1139/e06-107.Search in Google Scholar
[10] Mvondo H, Den-Brok SWJ, Mvondo-Ondoua J. Evidence for symmetric extension and exhumation of the Yaounde nappe Pan-African Fold Belt, Cameroon. J Afr Earth Sci. 2003;35:215–31. 10.1016/S0899-5362(03)00017-4.Search in Google Scholar
[11] Ngako V, Jegouzo P, Nzenti JP. Le cisaillement centre camerounais, rôle structural et géochronologique dans l’orogenèse panafricaine. C R Acad Sci Paris. 1991;t.313(SérieII P):457–63.Search in Google Scholar
[12] Cornacchia M, Dars R. Un trait structural majeur du continent africain. Les linéaments Centrafricains du Cameroun au Golfe d’Aden. Bull Soc Geol Fr. 1983;25:101–9. 10.2113/gssgfbull.S7-XXV.1.101.Search in Google Scholar
[13] Soba D. La série du Lom étude géologique et géochronologique du bassin Volcano sédimentaire de la chaîne panafricaine à l’Est du Cameroun. Thèse de Doctorat d’Etat. Paris: University of Pierre et Marie Curie; 1989. p. 205–21. 6,198 pages.Search in Google Scholar
[14] Coyne, Bellier. Aménagement hydroélectrique de Lom Pangar. Doc n° 10108-RP-400-B; 2010.Search in Google Scholar
[15] Feumoe ANS. Apport des filtrages et inversions 2D1/2 des anomalies aéromagnetiques dans la détermination des accidents tectoniques majeurs au Sud-est Cameroun. Thèse de Doctorat/PhD ès sciences. Université deYaoundé I; 2014. p. 143.Search in Google Scholar
[16] Regnoult JM. Synthèse géologique du Cameroun. Du Cameroun: Pub. Direction des Mines et de la Géologie; 1986. p. 119.Search in Google Scholar
[17] Njonfang E, Ngako V, Moreau C, Affaton P, Diot H. Restraining bends in high temperature shear zones: The « Central Cameroon Shear Zone », central Africa. J Afr Earth Sci. 2008;52:9–20. 10.1016/j.jafrearsci.2008.03.002.Search in Google Scholar
[18] Gouet DH. Applications des méthodes geoelectriques (DC&IP) à l’identification des cibles minieres et des acquifères dans la zone de Boutou- Colomine (Est-Cameroun). Thèse de doctorat. University of Yaoundé I. Faculty of Science; 2014. p. 193.Search in Google Scholar
[19] Phillips JD. Processing and Interpretation of aeromagnetic data for the Santa Cruz Basin Patahonia Mountains Area, South-Central Arizona. U.S.: Geological Survey Open-File Report 02-98;1998.Search in Google Scholar
[20] Li X. Understanding 3D analytic signal amplitude. Geophysics. 2006;71:13–6. 10.1190/1.2184367.Search in Google Scholar
[21] Roest WR, Verhoef J, Pilkington M. Magnetic interpretation using the 3-D analytic signal. Geophysics. 1992;57(6):116–25. 10.1190/1.1443174.Search in Google Scholar
[22] Hsu SK, Sibuet JC, Shyu CT. High-resolution detection of geologic boundaries from potential-field anomalies; an enhanced analytic signal technique. Geophysics. 1996;61:373–86. 10.1190/1.1443966.Search in Google Scholar
[23] Ansari AH, Alamdar K. Reduction to the pole of magnetic anomalies using analytic signal. World Appl Sci J. 2009;7(4):405–9. ISSN 1818-4952.Search in Google Scholar
[24] Jeng Y, Lee YL, Chen CY, Lin MJ. Integrated signal enhancements in magnetic investigation in archaeology. J Appl Geophysics. 2003;53(31–48). 10.1016/S0926-9851 (03)00015-6.Search in Google Scholar
[25] Reid AB, Allsop JM, Granser H, Millett AJ, Somerton IW. Magnetic interpretation in three dimensions using Euler deconvolution. Geophysics. 1990;55:80–90. 10.1190/1.1442774.Search in Google Scholar
[26] Paterson G, Watson Ltd. Aeromagnetic studies on some regions of the United Republic of Cameroon. Toronto: Interpretation Report. A.C.D.I.; 1976. p. 192.Search in Google Scholar
[27] Baranov V. A new method for interpretation of aeromagnetic map: pseudogravimetric anomalies. Geophysics. 1957;22:359–83. 10.1190/1.1438369.Search in Google Scholar
[28] Scanvic J. Utilisation de la télédétection dans les sciences de la terre. BRGM. Man et Méthodes No. 7; 1983. p. 158.Search in Google Scholar
[29] Dobrin MB, Savit CH. Introduction to geophysical prospecting. New York: McGraw-Hill; 1988. p. 867. 10.1126/science.117.3029.65.Search in Google Scholar
[30] Blakely RB. Potential theory in gravity and magnetic applications. Cambridge, G B: Cambridge University Press; 1996. p. 441. 10.1017/CB09780511549816.Search in Google Scholar
[31] Mbom-Abane S. Investigation géophysique en bordure du craton du Congo région d’abong-Mbang/Akonolinga, Cameroun et implications structurales. Thèse de doctorat d’Etat ès Sciences. University of Yaoundé I. Faculty of Sciences; 1997. p. 187.Search in Google Scholar
[32] Kankeu B, Greiling RO, Nzenti JP. Pan-African strikeslip tectonics in eastern Cameroon-Magnetic fabrics (AMS) and structures in the Lom basin and its gneissic basement. Precambrian Res. 2009;174:258–72. 10.1016/j.precamres.2009.08.001.Search in Google Scholar
[33] Meying A, Ndougsa MT, Manguelle DE. Evidence of fractures from the image of the subsurface in the Akonolinga-Ayos area (Cameroon) by combining the classical and the Bostick approaches in the interpretation of audiomagnetotellurics data. J Geol Min Res. 2009;1(8):159–71. 10.5897/JGMR.9000023.Search in Google Scholar
[34] Gerard A, Griveau P. Interprétation quantitative en gravimétrie ou magnétisme à Partir de cartes transformées de gradient vertical. Geophys Prospect. Apr 1972;20(2):459–81. 10.1111/j.1365-2478.1972.tb00648.x.Search in Google Scholar
[35] Chapman DS, Pollack HN. Global heat flow: A new look. Earth Planet SciLett. 1975;28:23–32. http://hdl.handle.net/2027.42/2195210.1016/0012-821X(75)90069-2Search in Google Scholar
[36] Nih Fon A, Bih CV, Suh CE. Application of electrical resistivity and chargeability data on a GIS platform in delineating Auriferous structures in a deeply Weathered Lateritic Terrain, Eastern Cameroon. Int J Geosci. 2012;03:960–71. 10.4236/ijg.2012.325097.Search in Google Scholar
[37] Pepogo MAD. Mise en evidence des relations tectoniques et minéralisations à l’aide de la méthode audiomagnetotellurique (AMT) dans les régions de Garga Sarali – Ndokayo, Est Cameroun. Thèse de doctorat. University of Yaoundé I. Faculty of Sciences; 2020. p. 161.Search in Google Scholar
[38] Davis GH, Bump AP, Garcia PE, Ahlgren BG. Conjugate Riedel deformation band shear zones. J Struct Geol. 2000;22:169–90. 10.1016/S0191-8141(99)00140-6.Search in Google Scholar
[39] Riedel S. The Saddle Mountains; the evolution of an anticline in the Yakima fold belt. Am J Sci. 1984;284:942–78. 10.2475/ajs.284.8.942.Search in Google Scholar
[40] Pepogo MAD, Ndougsa MT, Meying A, Ngoh JD, Mvondo OJ, Ngoumou PC. New geological and structural facts under the lateritic cover in Garga-Sarali, Ndokayo (East Cameroon) area, from audiomagnetotellurics soundings. Int J Geophys. 2018;17. 10.1155/2018/4806357.Search in Google Scholar
[41] Kankeu B, Greiling RO. Magneticfabrics (AMS) and transpression in the Neoproterozoic basement of Eastern Cameroon (Garga-Sarali area). NeuesJahrbuch Geol Palaontol – Abhandlungen. 2006;239:263–87. 10.12691/jgg-6-3-4.Search in Google Scholar
[42] Takoudjou WJD, Ganno S, Djonthu LYS, Kouankap NGD, Fossi DH, Tchouatcha MS, et al. Geostatical and GIS analysis of the spatial variability of alluvial gold content in Ngoura-Colomines area, Eastern Cameroon: Implications for the exploration of primary gold deposit. J Afr Earth Sci. 2018;142:138–57. 10.1016/j.jafrearsci.2018.03.015.Search in Google Scholar
[43] Nzenti JP, Barbey P, Tchoua FM. Evolution crustale au Cameroun, éléments pour un modèle géodynamique de l’orogenèse néoprotérozoique. Ed Collect GEOCAM, 2/1999, Press. University of Yaounde; 1998. p. 397–407. 10.12691/jgg-2-2-4.Search in Google Scholar
[44] Toteu SF, Penaye J, Djomani YP. Geodynamic evolution of the Pan-African belt in central Africa with special reference to Cameroon. Can J Earth Sci. 2004;v.41:73–85. 10.1139/e03-079.Search in Google Scholar
© 2022 Lionel Cedric Yigui et al., published by De Gruyter
This work is licensed under the Creative Commons Attribution 4.0 International License.
Articles in the same Issue
- Regular Articles
- Study on observation system of seismic forward prospecting in tunnel: A case on tailrace tunnel of Wudongde hydropower station
- The behaviour of stress variation in sandy soil
- Research on the current situation of rural tourism in southern Fujian in China after the COVID-19 epidemic
- Late Triassic–Early Jurassic paleogeomorphic characteristics and hydrocarbon potential of the Ordos Basin, China, a case of study of the Jiyuan area
- Application of X-ray fluorescence mapping in turbiditic sandstones, Huai Bo Khong Formation of Nam Pat Group, Thailand
- Fractal expression of soil particle-size distribution at the basin scale
- Study on the changes in vegetation structural coverage and its response mechanism to hydrology
- Spatial distribution analysis of seismic activity based on GMI, LMI, and LISA in China
- Rock mass structural surface trace extraction based on transfer learning
- Hydrochemical characteristics and D–O–Sr isotopes of groundwater and surface water in the northern Longzi county of southern Tibet (southwestern China)
- Insights into origins of the natural gas in the Lower Paleozoic of Ordos basin, China
- Research on comprehensive benefits and reasonable selection of marine resources development types
- Embedded deformation of the rubble-mound foundation of gravity-type quay walls and influence factors
- Activation of Ad Damm shear zone, western Saudi Arabian margin, and its relation to the Red Sea rift system
- A mathematical conjecture associates Martian TARs with sand ripples
- Study on spatio-temporal characteristics of earthquakes in southwest China based on z-value
- Sedimentary facies characterization of forced regression in the Pearl River Mouth basin
- High-precision remote sensing mapping of aeolian sand landforms based on deep learning algorithms
- Experimental study on reservoir characteristics and oil-bearing properties of Chang 7 lacustrine oil shale in Yan’an area, China
- Estimating the volume of the 1978 Rissa quick clay landslide in Central Norway using historical aerial imagery
- Spatial accessibility between commercial and ecological spaces: A case study in Beijing, China
- Curve number estimation using rainfall and runoff data from five catchments in Sudan
- Urban green service equity in Xiamen based on network analysis and concentration degree of resources
- Spatio-temporal analysis of East Asian seismic zones based on multifractal theory
- Delineation of structural lineaments of Southeast Nigeria using high resolution aeromagnetic data
- 3D marine controlled-source electromagnetic modeling using an edge-based finite element method with a block Krylov iterative solver
- A comprehensive evaluation method for topographic correction model of remote sensing image based on entropy weight method
- Quantitative discrimination of the influences of climate change and human activity on rocky desertification based on a novel feature space model
- Assessment of climatic conditions for tourism in Xinjiang, China
- Attractiveness index of national marine parks: A study on national marine parks in coastal areas of East China Sea
- Effect of brackish water irrigation on the movement of water and salt in salinized soil
- Mapping paddy rice and rice phenology with Sentinel-1 SAR time series using a unified dynamic programming framework
- Analyzing the characteristics of land use distribution in typical village transects at Chinese Loess Plateau based on topographical factors
- Management status and policy direction of submerged marine debris for improvement of port environment in Korea
- Influence of Three Gorges Dam on earthquakes based on GRACE gravity field
- Comparative study of estimating the Curie point depth and heat flow using potential magnetic data
- The spatial prediction and optimization of production-living-ecological space based on Markov–PLUS model: A case study of Yunnan Province
- Major, trace and platinum-group element geochemistry of harzburgites and chromitites from Fuchuan, China, and its geological significance
- Vertical distribution of STN and STP in watershed of loess hilly region
- Hyperspectral denoising based on the principal component low-rank tensor decomposition
- Evaluation of fractures using conventional and FMI logs, and 3D seismic interpretation in continental tight sandstone reservoir
- U–Pb zircon dating of the Paleoproterozoic khondalite series in the northeastern Helanshan region and its geological significance
- Quantitatively determine the dominant driving factors of the spatial-temporal changes of vegetation-impacts of global change and human activity
- Can cultural tourism resources become a development feature helping rural areas to revitalize the local economy under the epidemic? An exploration of the perspective of attractiveness, satisfaction, and willingness by the revisit of Hakka cultural tourism
- A 3D empirical model of standard compaction curve for Thailand shales: Porosity in function of burial depth and geological time
- Attribution identification of terrestrial ecosystem evolution in the Yellow River Basin
- An intelligent approach for reservoir quality evaluation in tight sandstone reservoir using gradient boosting decision tree algorithm
- Detection of sub-surface fractures based on filtering, modeling, and interpreting aeromagnetic data in the Deng Deng – Garga Sarali area, Eastern Cameroon
- Influence of heterogeneity on fluid property variations in carbonate reservoirs with multistage hydrocarbon accumulation: A case study of the Khasib formation, Cretaceous, AB oilfield, southern Iraq
- Designing teaching materials with disaster maps and evaluating its effectiveness for primary students
- Assessment of the bender element sensors to measure seismic wave velocity of soils in the physical model
- Appropriated protection time and region for Qinghai–Tibet Plateau grassland
- Identification of high-temperature targets in remote sensing based on correspondence analysis
- Influence of differential diagenesis on pore evolution of the sandy conglomerate reservoir in different structural units: A case study of the Upper Permian Wutonggou Formation in eastern Junggar Basin, NW China
- Planting in ecologically solidified soil and its use
- National and regional-scale landslide indicators and indexes: Applications in Italy
- Occurrence of yttrium in the Zhijin phosphorus deposit in Guizhou Province, China
- The response of Chudao’s beach to typhoon “Lekima” (No. 1909)
- Soil wind erosion resistance analysis for soft rock and sand compound soil: A case study for the Mu Us Sandy Land, China
- Investigation into the pore structures and CH4 adsorption capacities of clay minerals in coal reservoirs in the Yangquan Mining District, North China
- Overview of eco-environmental impact of Xiaolangdi Water Conservancy Hub on the Yellow River
- Response of extreme precipitation to climatic warming in the Weihe river basin, China and its mechanism
- Analysis of land use change on urban landscape patterns in Northwest China: A case study of Xi’an city
- Optimization of interpolation parameters based on statistical experiment
- Late Cretaceous adakitic intrusive rocks in the Laimailang area, Gangdese batholith: Implications for the Neo-Tethyan Ocean subduction
- Tectonic evolution of the Eocene–Oligocene Lushi Basin in the eastern Qinling belt, Central China: Insights from paleomagnetic constraints
- Geographic and cartographic inconsistency factors among different cropland classification datasets: A field validation case in Cambodia
- Distribution of large- and medium-scale loess landslides induced by the Haiyuan Earthquake in 1920 based on field investigation and interpretation of satellite images
- Numerical simulation of impact and entrainment behaviors of debris flow by using SPH–DEM–FEM coupling method
- Study on the evaluation method and application of logging irreducible water saturation in tight sandstone reservoirs
- Geochemical characteristics and genesis of natural gas in the Upper Triassic Xujiahe Formation in the Sichuan Basin
- Wehrlite xenoliths and petrogenetic implications, Hosséré Do Guessa volcano, Adamawa plateau, Cameroon
- Changes in landscape pattern and ecological service value as land use evolves in the Manas River Basin
- Spatial structure-preserving and conflict-avoiding methods for point settlement selection
- Fission characteristics of heavy metal intrusion into rocks based on hydrolysis
- Sequence stratigraphic filling model of the Cretaceous in the western Tabei Uplift, Tarim Basin, NW China
- Fractal analysis of structural characteristics and prospecting of the Luanchuan polymetallic mining district, China
- Spatial and temporal variations of vegetation coverage and their driving factors following gully control and land consolidation in Loess Plateau, China
- Assessing the tourist potential of cultural–historical spatial units of Serbia using comparative application of AHP and mathematical method
- Urban black and odorous water body mapping from Gaofen-2 images
- Geochronology and geochemistry of Early Cretaceous granitic plutons in northern Great Xing’an Range, NE China, and implications for geodynamic setting
- Spatial planning concept for flood prevention in the Kedurus River watershed
- Geophysical exploration and geological appraisal of the Siah Diq porphyry Cu–Au prospect: A recent discovery in the Chagai volcano magmatic arc, SW Pakistan
- Possibility of using the DInSAR method in the development of vertical crustal movements with Sentinel-1 data
- Using modified inverse distance weight and principal component analysis for spatial interpolation of foundation settlement based on geodetic observations
- Geochemical properties and heavy metal contents of carbonaceous rocks in the Pliocene siliciclastic rock sequence from southeastern Denizli-Turkey
- Study on water regime assessment and prediction of stream flow based on an improved RVA
- A new method to explore the abnormal space of urban hidden dangers under epidemic outbreak and its prevention and control: A case study of Jinan City
- Milankovitch cycles and the astronomical time scale of the Zhujiang Formation in the Baiyun Sag, Pearl River Mouth Basin, China
- Shear strength and meso-pore characteristic of saturated compacted loess
- Key point extraction method for spatial objects in high-resolution remote sensing images based on multi-hot cross-entropy loss
- Identifying driving factors of the runoff coefficient based on the geographic detector model in the upper reaches of Huaihe River Basin
- Study on rainfall early warning model for Xiangmi Lake slope based on unsaturated soil mechanics
- Extraction of mineralized indicator minerals using ensemble learning model optimized by SSA based on hyperspectral image
- Lithofacies discrimination using seismic anisotropic attributes from logging data in Muglad Basin, South Sudan
- Three-dimensional modeling of loose layers based on stratum development law
- Occurrence, sources, and potential risk of polycyclic aromatic hydrocarbons in southern Xinjiang, China
- Attribution analysis of different driving forces on vegetation and streamflow variation in the Jialing River Basin, China
- Slope characteristics of urban construction land and its correlation with ground slope in China
- Limitations of the Yang’s breaking wave force formula and its improvement under a wider range of breaker conditions
- The spatial-temporal pattern evolution and influencing factors of county-scale tourism efficiency in Xinjiang, China
- Evaluation and analysis of observed soil temperature data over Northwest China
- Agriculture and aquaculture land-use change prediction in five central coastal provinces of Vietnam using ANN, SVR, and SARIMA models
- Leaf color attributes of urban colored-leaf plants
- Application of statistical and machine learning techniques for landslide susceptibility mapping in the Himalayan road corridors
- Sediment provenance in the Northern South China Sea since the Late Miocene
- Drones applications for smart cities: Monitoring palm trees and street lights
- Double rupture event in the Tianshan Mountains: A case study of the 2021 Mw 5.3 Baicheng earthquake, NW China
- Review Article
- Mobile phone indoor scene features recognition localization method based on semantic constraint of building map location anchor
- Technical Note
- Experimental analysis on creep mechanics of unsaturated soil based on empirical model
- Rapid Communications
- A protocol for canopy cover monitoring on forest restoration projects using low-cost drones
- Landscape tree species recognition using RedEdge-MX: Suitability analysis of two different texture extraction forms under MLC and RF supervision
- Special Issue: Geoethics 2022 - Part I
- Geomorphological and hydrological heritage of Mt. Stara Planina in SE Serbia: From river protection initiative to potential geotouristic destination
- Geotourism and geoethics as support for rural development in the Knjaževac municipality, Serbia
- Modeling spa destination choice for leveraging hydrogeothermal potentials in Serbia