Spatio-temporal analysis of East Asian seismic zones based on multifractal theory
-
Ziyan Zhang
 ,
Changjiang Chen
,
Changjiang Chen

Abstract
In this article, the integrity of the seismic catalog obtained (1970–2014, M > 2.8) was verified according to the Gutenberg–Richter relation, the appropriate minimum magnitude was determined, and the whole region was divided into five areas according to the geological structure background of the whole research object and the trend of the historical seismic zone. We applied multifractal analysis in each partition. The results showed that although in different geological backgrounds, before major earthquakes, the earthquake time series information dimension had different degrees of growth, and the parameter after the flame had different degrees of decline. To a certain extent, this reflected the seismic energy accumulation and release process. In addition, the variation of fractal parameters in scale-free regions of time series and spatial distribution series also indicated that these two kinds of sequences in different regions show the characteristics of a multifractal structure rather than a single and uniform fractal structure.
1 Introduction
Nowadays, humankind faces many environmental problems [1,2,3,4]. Earthquake prediction has always been an internationally recognized worldwide problem [5,6,7,8]. In recent years, with the continuous development of computer science and control theory [9,10], especially nonlinear dynamics theory [11], geological statistics analysis [12] has been rapidly developed. Based on various models and algorithms, researchers have conducted diversified analyses of historical seismic data and obtained many beneficial conclusions [13].
Because seismic source events can be regarded as point events in time or space, seismic events are usually treated as point sets in most seismic models based on nonlinear theory. Since Mantelbrot [14] first introduced the concept of fractal in 1976, fractal geometry, as one of the powerful tools for studying complex phenomena in nature, has been attracting significant attention of scholars worldwide and has been much widely used. In recent years, fractal and multifractal theories have been applied in seismology [15]. These have been fully applied in recognition of precursors of major earthquakes, analysis of aftershock sequence and other fields in relevant seismic regions [16].
In studying the temporal and spatial transmission characteristics of earthquakes, the fractal dimension theory mainly focuses on the fractal structure of the temporal and spatial distribution of earthquakes and their evolution process [17]. As early as in the 1980s, Kagan and Kuopoff used fractal theory to study the spatial distribution of seismic sources and concluded that seismic phenomena are fractal, that is, with scale invariance, at least in a specific space and time range and a certain scale area [18]. However, soon after, the research results of scholars such as Glickman from the Soviet Union, Tadashi Hirayashi from Japan, and Longxing Hirada from Japan all agreed that the spatial and temporal distribution structure of seismic activity was a complex fractal rather than a simple fractal, so the method of multifractal was also introduced into the study of the spatial and temporal characteristics of earthquakes [19,20]. Richa Jain et al. studied the aftershocks of the Channoli earthquake in Garhwal Himalaya in 1999 and found that the correlation dimension of the spatial sequence reached 1.64, which was close to the two-dimensional plane distribution, while the time series became continuous distribution (M ≥ 1) and discrete distribution (M ≥ 1.75) at different magnitudes [21].
With increasing breadth and depth of the application of multifractal theory in seismic-related fields, the relevant models and algorithms are constantly improved and developed in practical applications. Michas et al. [22] used a multifractal approach to study the time dynamics of the recent earthquake activity in the Corinth rift. The results indicated the degree of heterogeneous clustering and correlations acting at all time scales that suggest non-Poissonian behavior. Additionally, the multifractal analysis in different time periods showed that the degree of multifractality exhibits strong variations with time, which are associated with the dynamic evolution of the earthquake activity in the rift and the transition between periods of high and low seismicity. Based on multifractal detrended fluctuation analysis (MF-DFA), Yang et al. [23] calculated the multifractal characteristic parameters of acceleration time series for typical near-fault ground motions and analyzed their correlations with two period parameters (i.e., mean period T m and characteristic period T c) and box-counting fractal dimensions. Chamoli and Yadav [24] used the MF-DFA to understand the multifractal behavior of earthquake data. For this purpose, a complete and homogeneous earthquake catalog of the period 1965–2013 with a magnitude of completeness M w of 4.3 was used. The analysis revealed the presence of multifractal behavior and sharp changes near the occurrence of three earthquakes of magnitude (M w) >6.6, including the October 2005 Muzaffarabad–Kashmir earthquake.
After a major earthquake, a series of aftershocks generally occur, reflecting the instability of the newly formed geological faults and the discontinuity of energy. In recent years, the fractal theory has also made breakthroughs in this field. Liu et al. [25] applied detrended fluctuation analysis (DFA) and multifractal methods to the time-scaling property analysis of the waiting time sequence of aftershocks (WTSAs) of the Wenchuan Ms8.0 earthquake that occurred on the Longmen mountain tectonic zone of Sichuan Province in China. The results showed that the WTSA is characterized by multifractal scaling.
The propagation characteristics of an earthquake are an interdisciplinary subject. Many research studies combine fractal theory with other theories to study earthquakes. Subhadra et al. [26] characterized the nature of the spatial distribution of heterogeneities in the source area of the 2015 Nepal earthquake based on the seismic b-value and fractal analysis of its aftershocks. The earthquake size distribution of aftershocks gives a b-value of 1.11 ± 0.08, possibly representing the highly heterogeneous and low-stress state of the region. Pasten [27] applied the fractal theory in order to describe the phase transition of earthquakes and had studied the multifractality of the time series of connections on the complex network, and found monofractal behavior for an earthquake with precursors and a multifractal behavior in a region without large earthquake with Mw 6.0. Denisse [28] introduced a new method of characterizing the seismic complex systems using a procedure of transformation from complex networks into time series. It was shown that the multifractality of constructed connectivity time series changes due to the particular geophysics characteristics of the seismic zones – it decreases with the occurrence of large earthquakes – and shows the spatiotemporal organization of these seismic systems.
In this article, the east Asia seismic belt was divided into regions. Then the time series set and the space distribution series set of the five major seismic belts were analyzed by the multi-fractal method. Based on these two sets, we explained the multifractal characteristics of the five regions in seismic time series and seismic spatial distribution series from different aspects. Besides, we elaborated that the multifractal categories of each region are according to the important parameters of their respective relations.
2 Study area and data
Located at the confluence of two major seismic belts, Asia encompasses the eastern part of the Eurasian earthquake zone and the northwestern part of the Pacific Ring of Fire. Due to its complex geological features and high earthquake occurrence frequency, it is highly representative in regions with high earthquake occurrence in the world. Therefore, historical seismic data and modern seismic data of the entire Asian region are of high research value [29]. Based on this, the study area was selected in the range of longitude 80–140°E and latitude 20–60°N, and the seismic data were collected from the SEISMIC catalog of USGS. In terms of time span, the data range was from January 1, 1970, to May 30, 2014, and the minimum magnitude was M ≥ 2.8.
In addition, among the objects studied in this article, the magnitude range was M ≥ 2.3. Rather than discussing only the destructive strong earthquakes (M ≥ 7.0), the Gutenberg–Richter (G–R) relationship can be used to obtain a reasonably complete magnitude catalogue, which makes the research results more objective.
In this article, the magnitude–frequency distribution principle of the G–R relationship was adopted to conduct seismic data integrity analysis [30]:
where M is the earthquake magnitude, N is the number of earthquakes with a magnitude greater than or equal to M in the study area, and a and b are statistical constants.
The steps of seismic directory integrity analysis are as follows:
First, aftershocks of earthquakes (1.0 ≤ M ≤ 9.0) in the study samples (set M ≤ 5.0) will be deleted, as shown in Table 1. A total of 15,138 small earthquakes (M ≤ 5.0) were obtained.
Small earthquake data catalog in the study area
| Directory | Magnitude | Total | ||
|---|---|---|---|---|
| 2.0–2.9 | 3.0–3.9 | 4.0–4.9 | ||
| I | 182 | 7,852 | 13,282 | 21,316 |
| II | 46 | 5,230 | 9,908 | 15,138 |
Then, the complete data after the aftershock were deleted according to the step size of 0.1 magnitude compared with Table 2.
Complete data catalog after removing aftershocks in the study area
| M | N | M | N | M | N | M | N | M | N | M | N |
|---|---|---|---|---|---|---|---|---|---|---|---|
| 2.3 | 1 | 3.3 | 818 | 4.3 | 10,562 | 5.3 | 16,394 | 6.3 | 17,375 | 7.3 | 17,588 |
| 2.4 | 2 | 3.4 | 1,221 | 4.4 | 11,672 | 5.4 | 16,584 | 6.4 | 17,422 | 7.4 | 17,596 |
| 2.5 | 3 | 3.5 | 1,794 | 4.5 | 12,665 | 5.5 | 16,754 | 6.5 | 17,453 | 7.5 | 17,598 |
| 2.6 | 4 | 3.6 | 2,480 | 4.6 | 13,446 | 5.6 | 16,864 | 6.6 | 17,486 | 7.6 | 17,602 |
| 2.7 | 11 | 3.7 | 3,266 | 4.7 | 14,131 | 5.7 | 16,972 | 6.7 | 17,513 | 7.7 | 17,602 |
| 2.8 | 25 | 3.8 | 4,204 | 4.8 | 14,692 | 5.8 | 17,052 | 6.8 | 17,526 | 7.8 | 17,604 |
| 2.9 | 46 | 3.9 | 5,276 | 4.9 | 15,138 | 5.9 | 17,145 | 6.9 | 17,545 | 7.9 | 17,605 |
| 3.0 | 164 | 4.0 | 6,554 | 5.0 | 15,564 | 6.0 | 17,209 | 7.0 | 17,557 | 8.0 | 17,606 |
| 3.1 | 325 | 4.1 | 7,856 | 5.1 | 15,880 | 6.1 | 17,273 | 7.1 | 17,567 | 8.1 | 17,606 |
| 3.2 | 536 | 4.2 | 9,313 | 5.2 | 16,161 | 6.2 | 17,333 | 7.2 | 17,575 | 8.2 | 17,607 |
After obtaining these data excluding aftershocks, the logarithmic distribution relationship of magnitude frequency of the study samples was plotted, as shown in Figure 1.

Logarithmic distribution of earthquake magnitude frequency in the study area.
The second step was to take different magnitude-lower limits
Through the least-square method [31], the fitting correlation coefficient is given as follows:
The third step was to find the M corresponding to the maximum fitting correlation parameter. When it reaches its peak,
In fact, the whole process is an atlas with a step size of 0.1 from M = 2.3 to M = 5.0. Only representative cases of M = 2.5, M = 3.5 and finally obtained M = 4.5 are listed here, as shown in Figure 2(a)–(c) to illustrate the situation.

Logarithm of magnitude frequency in East Asia and its fitting G–R figure. (a) M = 2.5, (b) M = 3.5, and (c) M = 4.5.
As can be seen from Figure 2(a), when M = 2.5, the fitting correlation coefficient R = 0.763, which is low and the fitting linear relationship is poor. When M = 3.5, as shown in Figure 2(b), the fitting correlation coefficient has reached a relatively high value. At this point, R = 0.836, and the fitting linear relationship is much better than before. When M = 4.5, as shown in Figure 2(c), the fitting correlation coefficient R = 0.997 has reached a very high level, indicating that the fitting linear relationship is very good.
In the further experiment, when M ≥ 4.6, the value began to decline significantly. According to the theory, this is because with an increase in the value of

Diagram of fitting correlation coefficient R changing with the value of M.
Therefore, excluding the seismic data of M < 4.5 from all previous data, this is our final research data.
Due to the geographical scope of this study [32], we can’t use a single fractal and fractal dimension of parameters to describe. Even if getting ideal results under these methods, the concluded experimental results do not have a big reference value on regional earthquakes due to the combination of various regions. In addition, as the topography and landforms in East Asia are very complex, the whole sample will be regionally divided according to different geological structures.
Figure 4 shows the southeast corner of China, and each black dot in the image represents seismic data. We first divided China’s seismic belt into two large areas according to the blue line in Figure 4. To the left of the blue line is part one, and to the right of the blue line is part two. The terrain and geomorphology of the region where the first part is located are relatively complex, which cannot be divided into a separate whole but needs to be divided further.

The regional division diagram of the research object.
The division of the first part is mainly based on the seismic zone of mainland China. Seismic research in this article cannot easily divide all the traditional seismic zones for all the data included in the study, but it roughly divides according to the alignment of these areas, respectively: the seismic zone as the center, the center into the surrounding area formed by the division into blocks, each block in the separate seismic data including the research object, the piece of non-interference in each other’s data in different areas. The general division of the research area is shown in several sections in Figure 5. The figure shows the entire area of China. The four ends of China’s territory are as follows: the easternmost is at the intersection of the Central Line of the main waterway of Heilongjiang and Wusuli River (135°2′30″E), the westernmost is near the Pamir Plateau (73°29′59.79″E), the northernmost point is on the center line of heilongjiang Main Waterway north of Mohe (53°33′N, 124°20′E), and the southernmost is at the Ground ansha (3°31′00′N′, 112°17′09″E). Lidi Ansha or Lydi Shoal is the southernmost part of the de facto Chinese territory. At the lower right corner of the map is a map of South China Sea territory. If these are all represented in a large map, it will lead to uncoordinated proportions or a too large picture, so these are represented separately [33].

Schematic diagram of major earthquake zones in mainland China.
The first part is divided into four seismic zones, that is, the south–north earthquake zone of China, the earthquake zone of Xinjiang and its surrounding areas, the earthquake zones of the Qinghai–Tibet Plateau and The Himalayas, and the earthquake zone of north China. At the same time, the second part as a whole is an earthquake zone, known as the northwest Pacific Rim earthquake region.
3 Methods
The fractal theory has an important basic characteristic, namely, self-similarity [34]. Self-similarity refers to symmetry across different scales (including time scale and space scale).
Self-similarity or scale invariance can be mathematically expressed as follows:
A simple function that satisfies this property is a power function [32]:
Thus, it can be obtained that [35]:
For regular fractals, the scale-extended multiple
In seismology, the empirical relations to describe the main characteristics of seismic activity, such as Omori’s formula that the aftershock attenuates with time and the g–R relation, are distributed in the form of a power function. When Kagan and Kuopoff studied the local spatial distribution [35], they found that the number of earthquakes per unit volume, N, also has the following relationship with the focal distance r over a relatively wide scale:
Therefore, there is scale invariance between many parameters in seismology.
In determining simple fractal dimensions of irregular fractal, the box counting method is often used. The multifractal theory considers the slightly different physical quantities within the box. It is normalized by a statistical method and described by multifractal spectrum [36]. In this way, it is possible to restore the distortion of the final result caused by ignoring the differences within each box.
Renyi generalized that fractal dimension is the most common way to describe multifractals. It defines a q-degree probability moment from the perspective of information theory [15]:
When
where
When q = 1
When q ≠ 1
The selection of power parameter q (hereafter referred to as power parameter) is very important. The parameter defined in theory can be taken over the whole real number. The larger the range, the better, it can fully show the fractal dimension change. However, in practical application, with the increase of numerical value, the amount of calculation will also increase in the form of power, resulting in the overflow of calculation results and the failure of drawing. If the value range of the parameter is too small, the complete multifractal spectrum curve cannot be obtained, resulting in the loss of a significant amount of necessary information, and the multi-fractal characteristics of the object cannot be completely studied. Therefore, the selection of q needs to be determined by combining experience values and experiments.
Another set of methods to describe multifractals is the multifractal spectrum. The research object was divided into N regions
Here, f(α) is the component of alpha in the total distribution, and it is the continuous derivative of
Through Legendre transformation, the following can be obtained:
Let
It follows that
4 Results
In the study of multifractal, the sample size cannot be ignored. Many studies have shown that when the sample size is less than 200 times, the multifractal dimension presents a pseudo-multifractal characteristic with the variation in parameters, while when the sample size is much greater than 200 times, the calculated results can objectively reflect the properties of the samples [38]. By comparing the sample data of various regions in Table 3, it can be predicted that the amount of seismic data in the north China earthquake region is less than 200, so the seismic data set in this region cannot objectively reflect the multifractal structure either from the time series or from the spatial distribution series and may even show the pseudo-multifractal characteristics.
Sample size of seismic data in each region
| Seismic region | Sample size (M ≥ 4.5) |
|---|---|
| Earthquake zones in the north and south of China | 828 |
| Xinjiang and surrounding earthquake areas | 414 |
| The Qinghai–Tibet and Himalayan seismic regions | 869 |
| North China seismic region | 169 |
| The northwestern Pacific Rim earthquake zone | 2,664 |
During the study of seismic time series in this article, according to the selected seismic data and combining the empirical value and the results of multiple attempts, the final determined |q| is at most 10 and increments as ∆q = 0.1 in the range [−10,10]. The multifractal spectral curve of f(α) can approximately reflect the changing characteristics within the q ∈ (−∞, +∞) range.
In the specific model calculation, we first calculated the double logarithm ratio under different q values of the seismic time series obtained by the algorithm of counting box dimension. Figure 6 shows the logarithmic atlas of the time series of each earthquake region. Because when the power parameter is greater than 4, the linear relationship of the log–log graph in some areas becomes worse, for the convenience of comparison, we temporarily take q ∈ [−4,4] in the graph, and draw the ln X(q)–ln L graph with a step length of 0.5, where X(q) is the partition function, which is the sum of the q-power of the probability distribution set after the normalization of points in the time series. Each power parameter corresponds to a logarithmic curve.

It can be seen from Figure 6 that no matter the power parameter is less than or greater than 0, all the
In the figure, when the power parameter value is > 0,
After obtaining the logarithmic map of different power parameters in each region and verifying the multifractal characteristics of the earthquake time series, the slope of the
If the object of study is an irregular multifractal, the slope of
Finally, the slope of the line can be obtained as follows:
Then, according to the given power parameter value, we perform unitary linear regression fitting for each curve, calculate the value of
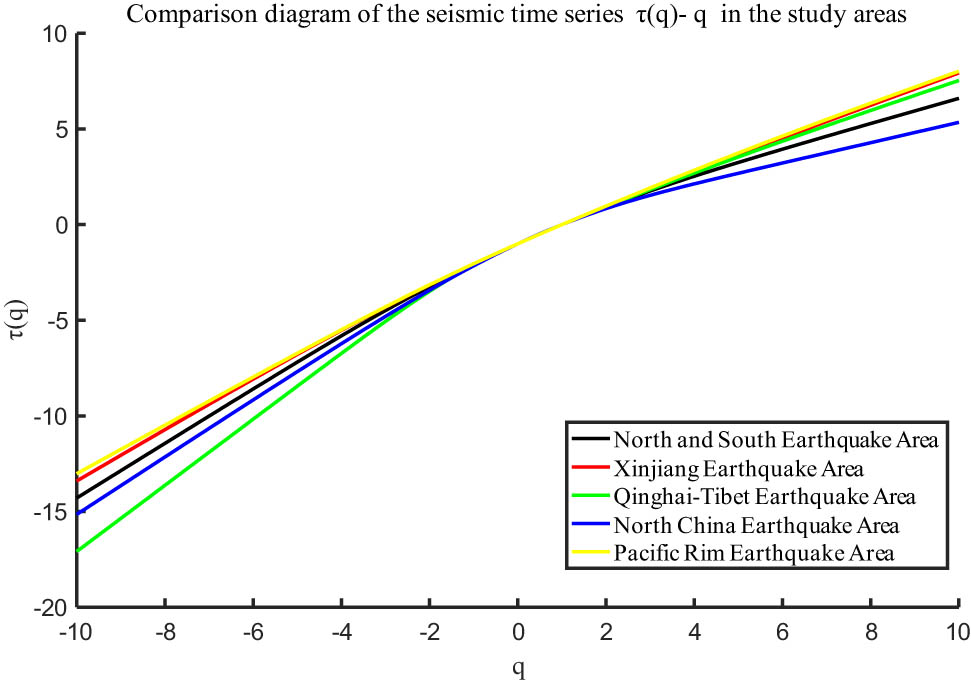
The comparison of time series
After the
First, let us focus on the
The

Time series
It can be seen that
| Seismic region |
|
|
|
ΔD |
|---|---|---|---|---|
| Earthquake zones in the north and south of China | 0.47 | 0.89 | 1.30 | 0.56 |
| Xinjiang and surrounding earthquake areas | 0.56 | 0.60 | 1.22 | 0.33 |
| The Qinghai–Tibet and Himalayan seismic regions | 0.55 | 0.84 | 1.55 | 0.71 |
| North China seismic region | 0.37 | 0.60 | 1.38 | 0.78 |
| The northwestern Pacific Rim earthquake zone | 0.58 | 0.89 | 1.18 | 0.29 |
Among them, ΔD can reflect the size of the multi-fractal complexity of a region. It can be seen that the values for north China, Qinghai-Tibet, and Himalayan earthquake regions are relatively high, while the northwest seismic region around the Pacific Ocean has the lowest value.
As mentioned before, due to the limitation of sample size, it is impossible for the north China seismic region to reflect the accurate multifractal characteristics in the algorithm of this article. Therefore, the high value of ΔD in north China is actually a pseudo-multifractal property. The rest of the region as the data samples are suitable and ensure the accuracy of the results. The high value of ΔD in the Tibetan and the Himalayan seismic area may be due to the uneven energy release cased by the regional tectonic belt under various stress, resulting in the higher multifractal complexity. The low values in the northwestern Pacific Rim earthquake zone may be due to a more uniform release of seismic energy in the region.
Non-uniform complex fractals need to be characterized by this set of dimensions {

Time series
It can be seen that although the
By comparing Figure 9, it can be seen that the seismic time series of the earthquake regions in Xinjiang and surrounding areas, the Qinghai–Tibet Plateau, and the Himalayan earthquake regions have the obvious characteristics of sparse multifractals. The seismic time series in the north China seismic region is slightly inclined to the intensive multifractal characteristics. The seismic time series of the north and south seismic regions of China and the northwest Pacific Rim are complex.
Unlike time series, seismic spatial distribution data need to be prepared for reserialization. The region of the grid is determined. In the processed data of the partition, the longitude and latitude information of each earthquake is included into a set, respectively, and the maximum and minimum values of the longitude and latitude of the set are found, thus determining the boundary of the rectangular region. Then, the rectangle is meshed in the rectangular area with a side length of 0.2°, so that each point of the seismic distribution falls into the grid. Then, the points of the grid are counted, and the set is serialized according to the sorting of the grid. After obtaining the sequence, take q ∈ [−4,4] and draw the ln X(q)–ln L diagram with a step length of 0.5.
It can be seen from Figure 10 that no matter the power parameter is less than or greater than 0, all the curves

The spatial distribution sequence
In Figure 10, when the power parameter value is >0,
As shown in Figure 11, the slopes of all the curves are obviously divided into two sections, indicating that the generalized energy time series of the earthquake does have multifractal characteristics, and the difference in the slopes represents the strength of the degree of multifractality. Figure 11 shows the comparison of the spatial distribution sequence

The comparison of spatial distribution sequence
Thus, the spatial distribution sequence

Spatial distribution sequence
According to the dynamic characteristics of the
| Seismic region |
|
|
|
ΔD |
|---|---|---|---|---|
| Earthquake zones in the north and south of China | 0.58 | 0.70 | 1.38 | 0.68 |
| Xinjiang and surrounding earthquake areas | 0.73 | 0.83 | 1.27 | 0.54 |
| The Qinghai-Tibet and Himalayan seismic regions | 0.62 | 0.80 | 2.42 | 1.62 |
| North China seismic region | 1.32 | 0.42 | 1.61 | 1.19 |
| The northwestern Pacific Rim earthquake zone | 0.84 | 0.60 | 1.91 | 1.31 |
It can be seen that the values of the Tibetan and Himalayan seismic regions are relatively high, which is consistent with the time series, indicating that the Tibetan and Himalayan tectonic belts are not uniformly released due to various stresses, resulting in a high multifractal complexity. The values of the Northwestern Pacific Rim earthquake zone are also high, which indicates that the energy release of this tectonic belt is more complex, which is in accordance with its geological tectonic background. The energy release in Xinjiang and its surrounding earthquake areas and the earthquake areas in the north and south of China is much more uniform than the previous two.
Figure 13 shows the

5 Discussion
In this article, the seismic catalog of seismic data in the longitude range of 80–140°E and latitude range of 20–60°N from 1970 to 2014 in the Chinese mainland is used as the basic research data. After data preprocessing, the study area is divided into separate research areas. The multifractal model of time series and spatial distribution series of each seismic region is established, and the logarithmic relationship graph of each seismic region with a power parameter of [−4,4] and a step size of 0.5 is shown. After that, the
Because the multifractal analysis based on the number box method has a minimum limit on the size of the sample size, a collection of <200 cannot accurately reflect the regional multifractal properties, so the sample size is only 169 out of the north China earthquake area, the results show that the area both in time series and spatial sequence shows the pseudo multifractal features, also certain degree to verify the theory need the support of large sample size. The following content focuses on the multi-fractal analysis of the remaining regions from the two perspectives of the relationship between
In the process of analysis, some defects of this study have also been fully exposed. First, the study of the earthquake region in north China cannot accurately reflect the characteristics of seismic space–time propagation due to the limitation of the sample size for multifractal analysis, so this region must be discussed by other methods. There are three methods to calculate a generalized fractal D spectrum with multifractal data, that is, number box method, fixed radius method, and fixed mass method. For the region, this study has abandoned the number box method. Besides, the fixed radius method for the sparse earthquake area has a big statistical error, which cannot be used. The methods of fixed quality and fixed radius asymptotic are equivalent but present the opposite statistical behavior; therefore, the area is suitable for further use for fixed quality standard of the multifractal spectrum analysis. The establishment of the model is very important, and the final calculation result depends on the specific calculation process in the model to a large extent. In this article, the selection of the minimum interval of the time series, the division of the maximum rectangular range of the spatial distribution sequence, the selection of the minimum grid and the final serialized grid order have a great impact on the calculation results, so the calculation accuracy cannot be determined finally. However, from the domestic and foreign research in this field, it is also a huge obstacle to the development of this field, so whether these fractal dimensions can more accurately describe the spatial and temporal propagation characteristics of earthquakes in a region has yet to be determined by the fractal dimension theory itself.
6 Conclusion
First, this article analyzes the catalog integrity of the original samples according to the G–R relationship. The fractal analysis has a high requirement on the size of the sample. In a fractal model, the required amount of data shall not be less than 200. In the research of earthquakes, especially the more remote area, due to the lack of historical data, many researchers do not have complete historical data, resulting in the final analysis result lost its reference significance. As the research object in this article has a large time span and a wide geographical scope of the research area, the data are relatively rich. In this case, the integrity of the original data is analyzed in this article and the minimum magnitude of the research object is determined.
Second, because the geographical scope of the object studied in this article is very wide and its geological background is very complex, if the unified fractal dimension is used as a parameter to describe the space–time characteristics of the whole object, the result will be distorted due to averaging out the local singularity. In order to more accurately describe the fractal dimension characteristics of each region, this article divides the research region into five research regions according to different geological structures and seismic zones.
On this basis, this article analyzes and calculates each area according to the theory of multifractal theory and discusses the final results according to the changes of important parameters. The multifractal model of time series and spatial distribution series of each seismic region is established respectively, and the logarithmic relation diagram of each seismic region with power parameter of [−4,4] and a step size of 0.5 is displayed. The
-
Funding information: This work was supported by the Sichuan Science and Technology Program (Grant No.: 2021YFQ0003).
-
Author contributions: Wenfeng Zheng contributed to the conception of the article and supervision. Ziyan Zhang performed the formal experiment. Changjiang Chen, Guoyong Liu contributed significantly to analysis and manuscript preparation. Jiawei Tian performed the data analyses and wrote the manuscript. Ziyan Zhang, Lirong Yin helped perform the analysis with constructive discussions. Shan Liu performed the formal analysis and revised the manuscript.
-
Conflict of interest: Authors state no conflict of interests.
References
[1] Liu Y, Tian J, Zheng W, Yin L. Spatial and temporal distribution characteristics of haze and pollution particles in China based on spatial statistics. Urban Clim. 2022;41:101031. 10.1016/j.uclim.2021.101031.Search in Google Scholar
[2] Xu J, Liu Z, Yin L, Liu Y, Tian J, Gu Y, et al. Grey correlation analysis of haze impact factor PM2.5. Atmosphere. 2021;12:1513. 10.3390/atmos12111513.Search in Google Scholar
[3] Yin L, Wang L, Huang W, Liu S, Yang B, Zheng W. Spatiotemporal analysis of haze in beijing based on the multi-convolution model. Atmosphere. 2021;12(11):1408. 10.3390/atmos12111408.Search in Google Scholar
[4] Zhang Z, Tian J, Huang W, Yin L, Zheng W, Liu S. A haze prediction method based on one-dimensional convolutional neural network. Atmosphere. 2021;12(10):1327.10.3390/atmos12101327Search in Google Scholar
[5] Tiryakioglu I, Yavasoglu H, Ugur MAU, Ozkaymak C, Yilmaz M, Kocaoglu H, et al. Analysis of October 23 (Mw 7.2) and November 9 (Mw 5.6), 2011 Van earthquakes using long-term GNSS time series. Earth Sci Res J. 2017;21(3):147–56.10.15446/esrj.v21n3.62812Search in Google Scholar
[6] Li X, Zheng W, Lam N, Wang D, Yin L, Yin Z. Impact of land use on urban water-logging disaster: a case study of Beijing and New York cities. Environ Eng Manag J (EEMJ). 2017;16(5):1211–16.10.30638/eemj.2017.127Search in Google Scholar
[7] Yang B, Liu C, Zheng W, Liu S. Motion prediction via online instantaneous frequency estimation for vision-based beating heart tracking. Inf Fusion. 2017;35:58–67.10.1016/j.inffus.2016.09.004Search in Google Scholar
[8] Li X, Zheng W, Wang D, Yin L, Wang Y. Predicting seismicity trend in southwest of China based on wavelet analysis. Int J Wavelets, Multiresolution Inf. 2015;13:1550011.10.1142/S0219691315500113Search in Google Scholar
[9] Zheng W, Liu X, Yin L. Research on image classification method based on improved multi-scale relational network. PeerJ Comput Sci. 2021;7:e613.10.7717/peerj-cs.613Search in Google Scholar PubMed PubMed Central
[10] Chen X, Yin L, Fan Y, Song L, Ji T, Liu Y, et al. Temporal evolution characteristics of PM2. 5 concentration based on continuous wavelet transform. Sci Total Environ. 2020;699:134244.10.1016/j.scitotenv.2019.134244Search in Google Scholar PubMed
[11] Jan B, Afridi FAK, Ali M, Yousufzai MAK. Study of the nonlinear character of ionospheric signals possessing critical frequency (foF2) at Pakistan air space. Arab J Geosci. 2021;14:190.10.1007/s12517-021-06495-8Search in Google Scholar
[12] Chen HX, Zhan YX, Ou HN, You YY, Li WY, Jiang SS, et al. Improving visual reasoning through semantic representation. IEEE Access. 2021;9:91476–86.10.1109/ACCESS.2021.3074937Search in Google Scholar
[13] Zheng W, Li X, Yin L, Yin Z, Yang B, Liu S, et al. Wavelet analysis of the temporal-spatial distribution in the Eurasia seismic belt. Int J Wavel Multiresolut Inf Process. 2017;15(03):1750018.10.1142/S0219691317500187Search in Google Scholar
[14] Mandelbrot BB, Aizenman M. Fractals: form, chance, and dimension. Phys Today. 1979;32(5):65–6.10.1063/1.2995555Search in Google Scholar
[15] Yin L, Li X, Zheng W, Yin Z, Song L, Ge L, et al. Fractal dimension analysis for seismicity spatial and temporal distribution in the circum-Pacific seismic belt. J Earth Syst Sci. 2019;128(1):22.10.1007/s12040-018-1040-2Search in Google Scholar
[16] Ding Y, Tian X, Yin L, Chen X, Liu S, Yang B, et al. Multi-scale relation network for few-shot learning based on meta-learning. In International Conference on Computer Vision Systems at Thessaloniki. Greece. Cham: Springer; 2019. p. 343–352.10.1007/978-3-030-34995-0_31Search in Google Scholar
[17] Zhang G, Cui P, Jin W, Zhang Z, Wang H, Bazai NA, et al. Seismic spatiotemporal characteristics in the Alpide Himalayan Seismic Belt. Earth Ence Inform. 2020;760:143349.Search in Google Scholar
[18] Kagan YY. Earthquake spatial distribution: the correlation dimension. Earth Planets Space. 1988;63(3):217.10.1111/j.1365-246X.2006.03251.xSearch in Google Scholar
[19] Hirabayashi T, Ito K, Yoshii T. Multifractal analysis of earthquakes. In Fractals and chaos in the earth sciences. Birkhäuser, Basel; 1992. p. 591–610.10.1007/978-3-0348-6191-5_5Search in Google Scholar
[20] Halsey TC, Jensen MH, Kadanoff LP, Procaccia II, Shraiman BI. Fractal measures and their singularities: The characterization of strange sets. Phys Rev A. 1986;33(2):1141–51.10.1103/PhysRevA.33.1141Search in Google Scholar
[21] Jain R, Rastogi BK, Dimri VP. Fractal dimension of the 1999 Chamoli earthquake from aftershock studies in Garhwal Himalaya. Pure Appl Geophys. 2003;160:2329–41.10.1007/s00024-003-2405-1Search in Google Scholar
[22] Michas G, Sammonds P, Vallianatos F. Dynamic Multifractality in Earthquake Time Series: Insights from the Corinth Rift, Greece. Pure Appl Geophysics. 2015;172(7):1909–21.10.1007/s00024-014-0875-ySearch in Google Scholar
[23] Yang D, Zhang C, Liu Y. Multifractal characteristic analysis of near-fault earthquake ground motions. Soil Dyn Earthq Eng. 2015;72:12–23.10.1016/j.soildyn.2015.01.020Search in Google Scholar
[24] Chamoli A, Yadav RBS. Multifractality in seismic sequences of NW Himalaya. Nat Hazards. 2015;77(1 Supplement):19–32.10.1007/s11069-013-0848-ySearch in Google Scholar
[25] Liu Z, Wang L, Qi S. Multifractal fluctuations of waiting time sequence of aftershocks. J Phys: Conf Ser. 2018;1053:012061.10.1088/1742-6596/1053/1/012061Search in Google Scholar
[26] Subhadra N, Padhy S, Dimri VP. Characterizing spatial heterogeneity based on the b-value and fractal analyses of the 2015 Nepal earthquake sequence. Tectonophysics. 2017;722:154–62.10.1016/j.tecto.2017.11.004Search in Google Scholar
[27] Pasten D. Fractals and complex networks applied to earthquakes. Basics Comput Geophys. 2021;139–51.10.1016/B978-0-12-820513-6.00021-7Search in Google Scholar
[28] Denisse P, Zbigniew C, Benjamin T. Time series analysis in earthquake complex networks. Chaos. 2018;28(8):083128.10.1063/1.5023923Search in Google Scholar
[29] Adagunodo TA, Lüning S, Adeleke AM, Omidiora JO, Aizebeokhai AP, Oyeyemi KD, et al. Evaluation of 0 ≤ M ≤ 8 earthquake data sets in African – Asian region during 1966–2015. Data Brief. 2018;17:588–603.10.1016/j.dib.2018.01.049Search in Google Scholar
[30] Richter V. Multi-dimensional local limit theorems for large deviations. Theory Probability Appl. 1958;3(1):100–6.10.1137/1103009Search in Google Scholar
[31] Fitzgibbon A, Pilu M, Fisher RB. Direct least square fitting of ellipses. IEEE Trans Patt Anal Mach Intell. 1999;21(5):476–80.10.1109/ICPR.1996.546029Search in Google Scholar
[32] Tang Y, Liu S, Li X, Fan Y, Deng Y, Liu Y, et al. Earthquakes spatio–temporal distribution and fractal analysis in the Eurasian seismic belt. Rendiconti Lincei. Scienze Fisiche Naturali. 2020;31(1):203–9.10.1007/s12210-020-00871-4Search in Google Scholar
[33] Zhang JK, Dong H, Cheng YP, Yue C, Liu K. Compilation of hydrogeological map of China. J Groundw Sci Eng. 2020;8(No.31(04)):80–94.Search in Google Scholar
[34] Zhang J, Zhu J, Wei J, Jiang S, Xu L, Qu L, et al. The generation and influence of Koch curve. Stud Philosophy Sci Technol. 2019;75:449–57.10.1161/HYPERTENSIONAHA.119.13822Search in Google Scholar
[35] Atsalis S. Spatial distribution and population composition of the Brown mouse lemur. Am J Primatol. 2019;51:61–78.10.1002/(SICI)1098-2345(200005)51:1<61::AID-AJP5>3.0.CO;2-2Search in Google Scholar
[36] Wang L, Lin ZQ, Wong A. Covid-net: A tailored deep convolutional neural network design for detection of covid-19 cases from chest X-ray images. Sci Rep. 2020;10(1):1–12.10.1038/s41598-020-76550-zSearch in Google Scholar PubMed PubMed Central
[37] Zhukov AS, Kamynin AV, Gavrikov IS, Barakhtin BK, Kuznetsov PA. Multifractal analysis and magnetic properties of magnetically hard Fe–Cr–Co alloy produced by selective laser melting. Russian Eng Res. 2021;41(4):325–8.10.3103/S1068798X21040250Search in Google Scholar
[38] Zhou Y, Zheng W, Shen Z. A new algorithm for distributed control problem with shortest-distance constraints. Math Probl Eng. 2016;2016:1–6.10.1155/2016/1604824Search in Google Scholar
[39] Huang W, Zheng W, Mo L. Distributed robust H∞ composite-rotating consensus of second-order multi-agent systems. Int J Distrib Sens Netw. 2017;13(7):1550147717722513.10.1177/1550147717722513Search in Google Scholar
© 2022 Ziyan Zhang et al., published by De Gruyter
This work is licensed under the Creative Commons Attribution 4.0 International License.
Articles in the same Issue
- Regular Articles
- Study on observation system of seismic forward prospecting in tunnel: A case on tailrace tunnel of Wudongde hydropower station
- The behaviour of stress variation in sandy soil
- Research on the current situation of rural tourism in southern Fujian in China after the COVID-19 epidemic
- Late Triassic–Early Jurassic paleogeomorphic characteristics and hydrocarbon potential of the Ordos Basin, China, a case of study of the Jiyuan area
- Application of X-ray fluorescence mapping in turbiditic sandstones, Huai Bo Khong Formation of Nam Pat Group, Thailand
- Fractal expression of soil particle-size distribution at the basin scale
- Study on the changes in vegetation structural coverage and its response mechanism to hydrology
- Spatial distribution analysis of seismic activity based on GMI, LMI, and LISA in China
- Rock mass structural surface trace extraction based on transfer learning
- Hydrochemical characteristics and D–O–Sr isotopes of groundwater and surface water in the northern Longzi county of southern Tibet (southwestern China)
- Insights into origins of the natural gas in the Lower Paleozoic of Ordos basin, China
- Research on comprehensive benefits and reasonable selection of marine resources development types
- Embedded deformation of the rubble-mound foundation of gravity-type quay walls and influence factors
- Activation of Ad Damm shear zone, western Saudi Arabian margin, and its relation to the Red Sea rift system
- A mathematical conjecture associates Martian TARs with sand ripples
- Study on spatio-temporal characteristics of earthquakes in southwest China based on z-value
- Sedimentary facies characterization of forced regression in the Pearl River Mouth basin
- High-precision remote sensing mapping of aeolian sand landforms based on deep learning algorithms
- Experimental study on reservoir characteristics and oil-bearing properties of Chang 7 lacustrine oil shale in Yan’an area, China
- Estimating the volume of the 1978 Rissa quick clay landslide in Central Norway using historical aerial imagery
- Spatial accessibility between commercial and ecological spaces: A case study in Beijing, China
- Curve number estimation using rainfall and runoff data from five catchments in Sudan
- Urban green service equity in Xiamen based on network analysis and concentration degree of resources
- Spatio-temporal analysis of East Asian seismic zones based on multifractal theory
- Delineation of structural lineaments of Southeast Nigeria using high resolution aeromagnetic data
- 3D marine controlled-source electromagnetic modeling using an edge-based finite element method with a block Krylov iterative solver
- A comprehensive evaluation method for topographic correction model of remote sensing image based on entropy weight method
- Quantitative discrimination of the influences of climate change and human activity on rocky desertification based on a novel feature space model
- Assessment of climatic conditions for tourism in Xinjiang, China
- Attractiveness index of national marine parks: A study on national marine parks in coastal areas of East China Sea
- Effect of brackish water irrigation on the movement of water and salt in salinized soil
- Mapping paddy rice and rice phenology with Sentinel-1 SAR time series using a unified dynamic programming framework
- Analyzing the characteristics of land use distribution in typical village transects at Chinese Loess Plateau based on topographical factors
- Management status and policy direction of submerged marine debris for improvement of port environment in Korea
- Influence of Three Gorges Dam on earthquakes based on GRACE gravity field
- Comparative study of estimating the Curie point depth and heat flow using potential magnetic data
- The spatial prediction and optimization of production-living-ecological space based on Markov–PLUS model: A case study of Yunnan Province
- Major, trace and platinum-group element geochemistry of harzburgites and chromitites from Fuchuan, China, and its geological significance
- Vertical distribution of STN and STP in watershed of loess hilly region
- Hyperspectral denoising based on the principal component low-rank tensor decomposition
- Evaluation of fractures using conventional and FMI logs, and 3D seismic interpretation in continental tight sandstone reservoir
- U–Pb zircon dating of the Paleoproterozoic khondalite series in the northeastern Helanshan region and its geological significance
- Quantitatively determine the dominant driving factors of the spatial-temporal changes of vegetation-impacts of global change and human activity
- Can cultural tourism resources become a development feature helping rural areas to revitalize the local economy under the epidemic? An exploration of the perspective of attractiveness, satisfaction, and willingness by the revisit of Hakka cultural tourism
- A 3D empirical model of standard compaction curve for Thailand shales: Porosity in function of burial depth and geological time
- Attribution identification of terrestrial ecosystem evolution in the Yellow River Basin
- An intelligent approach for reservoir quality evaluation in tight sandstone reservoir using gradient boosting decision tree algorithm
- Detection of sub-surface fractures based on filtering, modeling, and interpreting aeromagnetic data in the Deng Deng – Garga Sarali area, Eastern Cameroon
- Influence of heterogeneity on fluid property variations in carbonate reservoirs with multistage hydrocarbon accumulation: A case study of the Khasib formation, Cretaceous, AB oilfield, southern Iraq
- Designing teaching materials with disaster maps and evaluating its effectiveness for primary students
- Assessment of the bender element sensors to measure seismic wave velocity of soils in the physical model
- Appropriated protection time and region for Qinghai–Tibet Plateau grassland
- Identification of high-temperature targets in remote sensing based on correspondence analysis
- Influence of differential diagenesis on pore evolution of the sandy conglomerate reservoir in different structural units: A case study of the Upper Permian Wutonggou Formation in eastern Junggar Basin, NW China
- Planting in ecologically solidified soil and its use
- National and regional-scale landslide indicators and indexes: Applications in Italy
- Occurrence of yttrium in the Zhijin phosphorus deposit in Guizhou Province, China
- The response of Chudao’s beach to typhoon “Lekima” (No. 1909)
- Soil wind erosion resistance analysis for soft rock and sand compound soil: A case study for the Mu Us Sandy Land, China
- Investigation into the pore structures and CH4 adsorption capacities of clay minerals in coal reservoirs in the Yangquan Mining District, North China
- Overview of eco-environmental impact of Xiaolangdi Water Conservancy Hub on the Yellow River
- Response of extreme precipitation to climatic warming in the Weihe river basin, China and its mechanism
- Analysis of land use change on urban landscape patterns in Northwest China: A case study of Xi’an city
- Optimization of interpolation parameters based on statistical experiment
- Late Cretaceous adakitic intrusive rocks in the Laimailang area, Gangdese batholith: Implications for the Neo-Tethyan Ocean subduction
- Tectonic evolution of the Eocene–Oligocene Lushi Basin in the eastern Qinling belt, Central China: Insights from paleomagnetic constraints
- Geographic and cartographic inconsistency factors among different cropland classification datasets: A field validation case in Cambodia
- Distribution of large- and medium-scale loess landslides induced by the Haiyuan Earthquake in 1920 based on field investigation and interpretation of satellite images
- Numerical simulation of impact and entrainment behaviors of debris flow by using SPH–DEM–FEM coupling method
- Study on the evaluation method and application of logging irreducible water saturation in tight sandstone reservoirs
- Geochemical characteristics and genesis of natural gas in the Upper Triassic Xujiahe Formation in the Sichuan Basin
- Wehrlite xenoliths and petrogenetic implications, Hosséré Do Guessa volcano, Adamawa plateau, Cameroon
- Changes in landscape pattern and ecological service value as land use evolves in the Manas River Basin
- Spatial structure-preserving and conflict-avoiding methods for point settlement selection
- Fission characteristics of heavy metal intrusion into rocks based on hydrolysis
- Sequence stratigraphic filling model of the Cretaceous in the western Tabei Uplift, Tarim Basin, NW China
- Fractal analysis of structural characteristics and prospecting of the Luanchuan polymetallic mining district, China
- Spatial and temporal variations of vegetation coverage and their driving factors following gully control and land consolidation in Loess Plateau, China
- Assessing the tourist potential of cultural–historical spatial units of Serbia using comparative application of AHP and mathematical method
- Urban black and odorous water body mapping from Gaofen-2 images
- Geochronology and geochemistry of Early Cretaceous granitic plutons in northern Great Xing’an Range, NE China, and implications for geodynamic setting
- Spatial planning concept for flood prevention in the Kedurus River watershed
- Geophysical exploration and geological appraisal of the Siah Diq porphyry Cu–Au prospect: A recent discovery in the Chagai volcano magmatic arc, SW Pakistan
- Possibility of using the DInSAR method in the development of vertical crustal movements with Sentinel-1 data
- Using modified inverse distance weight and principal component analysis for spatial interpolation of foundation settlement based on geodetic observations
- Geochemical properties and heavy metal contents of carbonaceous rocks in the Pliocene siliciclastic rock sequence from southeastern Denizli-Turkey
- Study on water regime assessment and prediction of stream flow based on an improved RVA
- A new method to explore the abnormal space of urban hidden dangers under epidemic outbreak and its prevention and control: A case study of Jinan City
- Milankovitch cycles and the astronomical time scale of the Zhujiang Formation in the Baiyun Sag, Pearl River Mouth Basin, China
- Shear strength and meso-pore characteristic of saturated compacted loess
- Key point extraction method for spatial objects in high-resolution remote sensing images based on multi-hot cross-entropy loss
- Identifying driving factors of the runoff coefficient based on the geographic detector model in the upper reaches of Huaihe River Basin
- Study on rainfall early warning model for Xiangmi Lake slope based on unsaturated soil mechanics
- Extraction of mineralized indicator minerals using ensemble learning model optimized by SSA based on hyperspectral image
- Lithofacies discrimination using seismic anisotropic attributes from logging data in Muglad Basin, South Sudan
- Three-dimensional modeling of loose layers based on stratum development law
- Occurrence, sources, and potential risk of polycyclic aromatic hydrocarbons in southern Xinjiang, China
- Attribution analysis of different driving forces on vegetation and streamflow variation in the Jialing River Basin, China
- Slope characteristics of urban construction land and its correlation with ground slope in China
- Limitations of the Yang’s breaking wave force formula and its improvement under a wider range of breaker conditions
- The spatial-temporal pattern evolution and influencing factors of county-scale tourism efficiency in Xinjiang, China
- Evaluation and analysis of observed soil temperature data over Northwest China
- Agriculture and aquaculture land-use change prediction in five central coastal provinces of Vietnam using ANN, SVR, and SARIMA models
- Leaf color attributes of urban colored-leaf plants
- Application of statistical and machine learning techniques for landslide susceptibility mapping in the Himalayan road corridors
- Sediment provenance in the Northern South China Sea since the Late Miocene
- Drones applications for smart cities: Monitoring palm trees and street lights
- Double rupture event in the Tianshan Mountains: A case study of the 2021 Mw 5.3 Baicheng earthquake, NW China
- Review Article
- Mobile phone indoor scene features recognition localization method based on semantic constraint of building map location anchor
- Technical Note
- Experimental analysis on creep mechanics of unsaturated soil based on empirical model
- Rapid Communications
- A protocol for canopy cover monitoring on forest restoration projects using low-cost drones
- Landscape tree species recognition using RedEdge-MX: Suitability analysis of two different texture extraction forms under MLC and RF supervision
- Special Issue: Geoethics 2022 - Part I
- Geomorphological and hydrological heritage of Mt. Stara Planina in SE Serbia: From river protection initiative to potential geotouristic destination
- Geotourism and geoethics as support for rural development in the Knjaževac municipality, Serbia
- Modeling spa destination choice for leveraging hydrogeothermal potentials in Serbia