Evaluation of fractures using conventional and FMI logs, and 3D seismic interpretation in continental tight sandstone reservoir
-
Xiangliang Qiu
 ,
Yuanyuan Lu
,
Yuanyuan Lu


Abstract
Due to the complex pore structures and strong heterogeneity of fractured reservoirs, it is a hot and difficult point in petroleum geology to identify fractures using logging principles. In this paper, taking the tight sandstone reservoir of the Chang 8 Member in the Huanjiang Oilfield as an example, field outcrops, cores, thin sections, and logging identification methods were used for quantitative description and fine logging evaluation of fractures. The research shows that high-angle, medium-low-angle, near-vertical, and horizontal fractures are developed in the Chang 8 Member of the Huanjiang Oilfield. The main ones are high-angle fractures, followed by horizontal fractures with a low degree of fillings. Under the constraints of core and imaging logging data, three fracture sensitivity logging parameters of acoustic wave time difference, natural gamma, and dual induction-octalateral resistivity were optimized, and a comprehensive fracture probability index was proposed. Seventy-nine fracture development intervals were identified based on log curve characteristics and fracture probability indexes. The coincidence rate of fracture logging identification results with the core observation and imaging logging interpretation is 80.6%. The research results can provide a theoretical basis for the efficient development of fractured continental tight sandstone reservoirs in similar areas.
1 Introduction
Tight sandstone oil and gas reservoir has become an important field of global oil and gas production growth, and it has huge reserve growth potential in the future [1,2,3,4,5]. A large number of oilfield practices showed that the degree of fracture development is the key factor for the high and stable production of tight sandstone reservoirs [6,7,8,9]. Fractures can significantly increase the matrix permeability of low-permeability tight reservoirs, thereby increasing the hydrocarbon charging efficiency [10,11,12,13,14]. For example, regional tectonic fractures increased the permeability of the tight sandstone reservoirs in the Mesaverde Basin in the United States by two orders of magnitude compared to matrix permeability; moreover, regional structural fractures increased the permeability of the Jurassic tight reservoirs in Dibei, Kuqa Depression, China by 1–3 orders of magnitude [15,16,17,18,19]. For tight reservoirs, fractures can improve the effective storage spaces and seepage properties of underground fluids, so fractures always control the distribution of sweet spots in hydrocarbon-enriched areas [20,21,22,23,24].
It is difficult for tight reservoirs to accumulate large-scale hydrocarbons without fractures [25,26,27]. Therefore, the production capacity of tight reservoirs has a strong dependence on natural fractures [28,29,30]. In recent years, with the urgent need for refined development of tight reservoirs, the quantitative characterization technology of fractures has been rapidly developed [31,32,33]. Seismic and logging data are often used for fracture predictions in tight reservoirs [34,35,36]. The advantage of the seismic method lies in its large coverage area and deep longitudinal detection range, but its disadvantage lies in its low longitudinal resolution, so core-scale fractures cannot be effectively identified [37,38,39]. Well, logs have high resolution and are often used to predict fractures in tight reservoirs. Fracture logging identifications usually require a combination of logging parameters, such as lithology, porosity, resistivity, and acoustic wave time difference and imaging logging [40,41,42]. A large number of field practices showed that the response characteristics of conventional logging curves corresponding to fracture-developed intervals are different, and this difference provides the possibility for fracture prediction using conventional logging data [43,44,45].
In this paper, considering the tight sandstone reservoir of the Chang 8 Member in the Huanjiang Oilfield as an example, field outcrops, cores, thin sections, and logging identification methods were used for quantitative description and fine logging evaluation of fractures. A comprehensive fracture probability index was proposed, which effectively improved the signal-to-noise ratio of fracture identifications using logging data.
2 Geological background
The Huanjiang Oilfield is located in the Tianhuan Sag in the western part of the Ordos Basin (Figure 1a and b). This area is developed on the west-dipping monoclinic structure of the basin, and the stratum is gentle. A series of strike-slip faults developed in the Chang 8 reservoir in the study area due to multi-phase tectonic stresses. The Chang 8 oil layer group in the study area belongs to the sedimentary front of the braided river delta, and microfacies such as underwater distributary river channel, inter-channel bay, and sheet sand are developed (Figure 1c). The multi-stage channels are superimposed and developed in a striplike distribution form, and the channel sand bodies are the dominant reservoirs. The lithologies of the reservoir are mainly gray, light gray fine-grained feldspar sandstone, and feldspar lithic sandstone, and the compositional maturity of the rock is low. In addition, the reservoir in this area has poor petrophysical properties, with an average porosity of 8.7% and an average permeability of 0.32 mD. The development of natural fractures can effectively improve the seepage capacity of the reservoir. Therefore, fractures play an important role in controlling the migration and accumulation of oil and gas [46,47,48,49,50,51,52].
![Figure 1
The location, structure, and well distribution of the study area. (a) The location of the study area (modified after reference [52]); (b) contour map of the top surface of the Chang 8 Formation; and (c) histogram of stratigraphic units of the Yanchang Formation in the Huanjiang area.](/document/doi/10.1515/geo-2022-0372/asset/graphic/j_geo-2022-0372_fig_001.jpg)
The location, structure, and well distribution of the study area. (a) The location of the study area (modified after reference [52]); (b) contour map of the top surface of the Chang 8 Formation; and (c) histogram of stratigraphic units of the Yanchang Formation in the Huanjiang area.
The development practice in the research area has proved that some wells with poor reservoir properties but high production are closely related to natural fractures, such as Wells M119, B40, L306, and L152. In this paper, taking the tight sandstone reservoir of the Chang 8 Member in the Huanjiang Oilfield as an example, field outcrops, cores, thin sections and logging identification methods were used for quantitative description and fine logging evaluation of fractures. This study can provide scientific guidance for the scientific and rational development of tight oil reservoirs in similar areas.
3 Databases and methods
3.1 Core observation
In this paper, core observations and descriptions were conducted for 34 wells in the study area, with a total of 586.7 m in length, and 296 core photos were taken.
3.2 Thin section casting
The testing equipment for core casting thin sections was a LABORLUX-12POL polarizing microscope and a TIAS-2000 image analyzer. The test standard was based on SY/T 6103-2004, and the blue resin in the sheet was used for pore fillings. The experimental procedure for casting thin sections is as follows: Pigmented low-viscosity epoxy resins, casting agents, and dyes are poured into the pores of the rock; the curing reaction is then utilized to cross-link the linear epoxy resin into macromolecules of a network structure until it becomes a hard solid epoxy resin; finally, the production of casting thin slices is completed through procedures such as grinding and sticking.
3.3 Conventional and formation microscanner image (FMI) imaging logging
The equipment used for conventional logging tests is EILog, and the electrical imaging logging tool is MCI. The LEAD processing platform was used for the interpretation of conventional well log data. It used the cross-graph technique to analyze the lithological and physical parameters. MCI imaging data were processed and interpreted at the LEAD processing interface [43,44,45]. MCI electrical imaging was used for dynamic and static image generation, formation dip pickup, and fracture pickup. In fractured formations, the resistivity of fractures was significantly lower than that of surrounding rocks due to mud intrusion, which appears as dark streaks on imaging results [46,47,48,49,50,51,52]. Therefore, the fracture type, occurrence, and development degree could be identified using imaging logging data.
3.4 3D seismic interpretation
The discontinuity of seismic 3D data volume mainly reflects the changes in faults and lithology; the continuous data volume mainly reflects the homogeneity of lithology and the continuity of stratigraphy [43,44,45,46]. The 3D seismic data volume reflects the reflection of a regular network underground, and it calculates the similarity of waves in a certain time domain by the direction of the main and contact survey lines. When there are faults and discontinuous stratigraphic changes underground, some local seismic traces will show different reflection characteristics from adjacent seismic traces [47,48,49]. The extreme discontinuity in the correlation between tracks is the seismic dislocation generated by the fault. Using this principle, the structures of the target layer and the distribution of faults can be identified.
In addition, the 3D seismic data of Chang 8 Member were processed by the ant tracking algorithm. In this study, the inclination volume attributes after edge enhancement were used as input data, and Petrel software was used to extract the ant volume attributes of seismic data. Due to the poor quality of seismic data of frequently interbedded sand-mudstone formations, it will reduce the reliability of small faults identified in the ant data volume. Therefore, the ant data volume based on 3D seismic calculation was used as a reference for fracture prediction results.
4 Developmental characteristics of fractures
Based on observations of outcrops, cores, and imaging logging, the reservoirs in the Chang 8 Member of the Huanjiang Oilfield mainly develop structural and diagenetic fractures.
4.1 Outcrop fractures
The Jinsuoguan Profile is located in the northwest part of the Yintai District, Tongchuan City. Large-scale structural fractures are developed in the Chang 8 Member outcrops in this area, which mainly include near-vertical, high-angle, and horizontal bedding fractures (Figure 2). The horizontal spacing of two adjacent vertical fractures is usually between 4 and 15 m; bedding fractures are fractures formed by the fracture of rock mass along the bedding plane. The strike of the high-angle and vertical fractures of the Chang 8 Member is deflected to a certain extent with the change of the structural line; that is, it has a certain spatial twisting feature [50,51,52].

Development characteristics of outcrop fractures in the Chang 8 Member of the Yanchang Formation in the Jinluoguan Profile, Tongchuan. The geographic coordinates are: 35°08′19.5″N, 108°53′10.9″E (a) and (b) are vertical fractures; and (c) and (d) are high angle fractures.
4.2 Core fractures
The core observation of the 34 wells shows that natural fractures are relatively developed in the Chang 8 reservoir in the Huanjiang area. The fracture surface in Figure 3 has certain scratches or steps, which are formed on the fracture surface during the rupture process, and the fracture surface is filled with argillaceous and secondary minerals. The fractures of the target layer are mainly high-angle structural fractures, accompanied by a small number of oblique fractures (Figure 3), followed by near-horizontal bedding fractures. A total of 19 wells with developed fractures are observed in the cores, with a coring length of 326.67 m, and a total of 98 natural fractures are identified. The average number of fractures in a single well is 5.2, and the fracture density is 0.3/m.

Core images of fractures in the Chang 8 reservoir in Huanjiang Oilfield. (a) Well M120, 2681.06–2681.18 m, gray fine sandstone, high-angle fracture; (b) Well B162, 2618.00–2618.12 m, gray argillaceous siltstone, high-angle fracture; (c) Well B150, 2709.84–2709.95 m, gray fine sandstone, high-angle fracture; and (d) Well B150, 2709.13–2710.03 m, gray fine sandstone, vertical fracture.
The distribution of the core fracture types is shown in Figure 4. High-angle fractures are the most common, with a total of 42 (42.9%); in addition, 17 medium-low-angle fractures (17.3%), 11 near-vertical fractures (11.2%), and 28 horizontal bedding fractures (accounting for 28.6%) were observed. According to the statistical results of fracture filling degrees (Figure 5), unfilled fractures accounted for 42.8%, mainly horizontal fractures (21.4%), followed by high-angle fractures; half-filled fractures accounted for 57.2%, which were dominated by high-angle and near-vertical fractures.
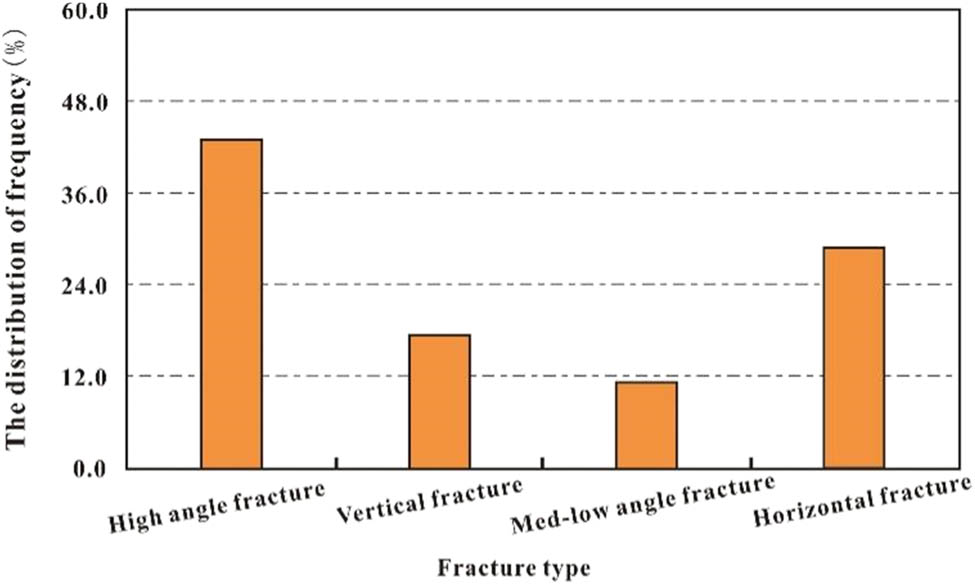
Statistical results of distribution of core fracture types.

Statistical results of filling degrees of core fractures.
4.3 Micro-fractures
Through observation of thin sections, micro-fractures are widely developed in the Chang 8 Member of the study area. Their formation is related to regional tectonic activity, sedimentation, and diagenesis [53,54,55]. The scale of micro-fractures is generally micron level, and the Chang 8 Member mainly develops structural and diagenetic micro-fractures (mainly bedding micro-fractures). Structural micro-fractures generally form anywhere in the formation of rock formations, and are formed by one or more stress failures in the rock [56,57]. Their specific performance is through-cut bedding, and there are friction marks on the fracture surfaces [58,59]. The opening of the micro-fractures is between 0.1 and 100 μm and the length is between 0.1 and 10 mm. Statistics show that 70% of the structural micro-fractures are half-filled, and most of the filling minerals are quartz, calcite, dolomite, etc., and a small part is filled with argillaceous components (Figure 6a–d). The diagenetic micro-fractures are distributed along the bedding, and they will bypass and show the characteristics of gradually pinching out when encountering mineral particles. The openings of the diagenetic micro-fractures are distributed in the range of 0.1–5 μm, and the fracture lengths are between 0.1 and 10 mm. Most of the diagenetic micro-fractures are not filled, and the filling degrees of some semi-filled fractures are 20%. The fillings are argillaceous, iron or quartz, feldspar, calcite, and other minerals (Figure 6e and f).

Photographs of cast thin sections of the Chang 8 reservoir in the study area. (a) Well L326, 2632.18 m, gray fine sandstone, a semi-filled micro-fracture; (b) Well B23, 2623.75 m, gray fine sandstone, a fully filled micro-fracture; (c) Well B19, 2728.97 m, gray fine sandstone, two unfilled micro-fractures; (d) Well L309, 2729.47 m, a semi-filled micro-fracture; (e) Well L146, 2675.38 m, muddy siltstone, one unfilled diagenetic micro-fracture; (f) Well B24, 2661.80 m, gray argillaceous siltstone, one unfilled diagenetic micro-fracture.
5 Fracture logging identification in tight sandstone reservoirs
5.1 Responses of fractures in imaging logging
Imaging logging is currently the most effective fracture identification method, which can provide intuitive high-resolution 360° omnidirectional petrophysical and two-dimensional image information around the borehole wall [60,61,62]. In general, when the formation fractures are open, the drilling fluid invades the fracture network, and the fracture development section shows abnormal high electrical conductivity, and the fractures fluctuate in the form of sinusoidal waves in imaging logging [63,64]. When the fracture angle is low, the sinusoidal amplitude is low; when the fracture angle is high, the sinusoidal amplitude is high; vertical fractures appear as symmetrical dark lines (Figure 7). When the formation fractures are completely filled or half filled, the color of the sinusoidal curve displayed on the electric imaging and acoustic imaging images is different depending on the filling degrees and the differences of the fillings. The bedding fractures have limited development in the range of imaging logging and are often closed. The sinusoidal wave-like fluctuation on the static image log and the cross-domain of the peak-to-valley spacing of structural fractures are relatively large.

Imaging log responses of fracture-developed intervals. (a) Section 2,675–2,679 m of Well L298; (b) Section 2,706–2,710 m of Well B150.
A comprehensive analysis of the imaging logging interpretation results of nine wells in the study area showed that the fracture strikes in the study area could be divided into three groups: NE, NW, and NSW strikes. The NE-trending fractures are widely distributed in the study area; the NNW-trending fractures are mainly concentrated in the western part of the study area, and the nearly NS-trending fractures are less developed and mainly distributed in the middle of the study area.
5.2 Identifications of fractures based on conventional logging
Compared with drilling coring, conventional logging data has the characteristics of strong data continuity and high resolution, so it has advantages in the process of reservoir fracture identification. For wells lacking imaging logging data, conventional logging data is the only way to identify fractures in the well. According to the different response degrees of logging sequences to fractures, the conventional logging data for identifying fractures generally include sonic logging, resistivity logging, nuclear logging, etc.
Conventional logging parameters are the comprehensive responses of features such as rocks, pores, fractures, and fluids around the wellbore. In this paper, the core and imaging logs were used as constraints, and the coupled conventional logs were used for fracture logging identifications.
5.2.1 Resistivity intrusion correction method
For cores developed with natural fractures, since the fluid resistivity is lower than that of the rock skeleton, the deep and shallow lateral resistivities both decrease, but the magnitude of the decrease is different [65,66]. When there are well-developed fractures, the mud filtrate has a greater impact on the shallow lateral but less on the deep lateral, so the decrease in the resistivity of the shallow lateral is greater. Cross plots of different types of resistivity parameters in fracture-developed sections showed that the influences of mud filtrate on deep induction and medium induction resistivity curves were greater (Figure 8).

Cross plots of different types of resistivity parameters in fracture-developed intervals. (a) Relationship between deep induction and eight lateral resistivities; and (b) relationship between deep induction and medium induction resistivities.
Based on the calibration of core and imaging log data, the resistivity invasion correction factor (R TC) was used to identify fractures. The calculation equation of R TC is shown in equation (1).
where R TC is the resistivity intrusion correction index, R t and R ILM are the true and medium lateral resistivities of formation, respectively. When fractures are developed in the formation, R TC > 0, when there are no fractures, R TC ≈ 0. The applicable condition of this method is that the depth of mud filtrate intrusion along the fracture is within the detection range of induction logging.
5.2.2 Fractal dimension method of acoustic wave time difference
For conventional logging curves, the complexity or inhomogeneity of its shape, amplitude, and other characteristics reflects the change of formation characteristics, and this characteristic is called fractal [66,67,68]. For tight formations, the more complex the reservoir lithology, petrophysical and fluid-bearing properties, and fracture pore space structures, the greater the fluctuations of the logging curves, the more obvious the relative abnormality of shape amplitudes, and the more complex the fractal features of the logging curves.
The calculation of the fractal dimension of the logging curve needs to first intensify the plane grid where the logging curve is located. If the number of grids that the curve passes through in sequence are N(L 1), N(L 2),…, N(L i), the statistical formula for the number of grids is
In the formula, n is the number of curve data points in this interval, and L i is the number of grids after the i-th grid refinement. 1 ≤ i ≤ j ≤ n, V is the logging value. V j , V j + 1 represent the j-th and j + 1st grid density additions, respectively, the acoustic wave time difference logging value; V max and V min represent the maximum and minimum values of the acoustic wave time difference curve in a certain interval, respectively. These data have a statistical relationship N(L) = CLD, and the logarithm on both sides has
In the formula, D is the fractal dimension, and C is the undetermined coefficient. The equation is used to fit data series with different grid numbers L i and the number of times the curve passes through the grid N(L i ), and then the fractal dimension D is obtained.
When fractures are developed in the reservoir, the heterogeneity of the reservoir increases; the acoustic wave time difference increases and it is prone to periodic jumps. Due to the small variation of the acoustic wave time difference of tight sandstone, the acoustic wave time difference amplitude R/S (R is the range and S is the standard deviation) and its fractal dimension were introduced to “amplify” the effective information of logging data. This makes it easier to identify the development of reservoir fractures. If the R/S curve deviates from the original straight line, that is, the fractal dimension increases, it means that the reservoir fractures are developed (Figure 9).
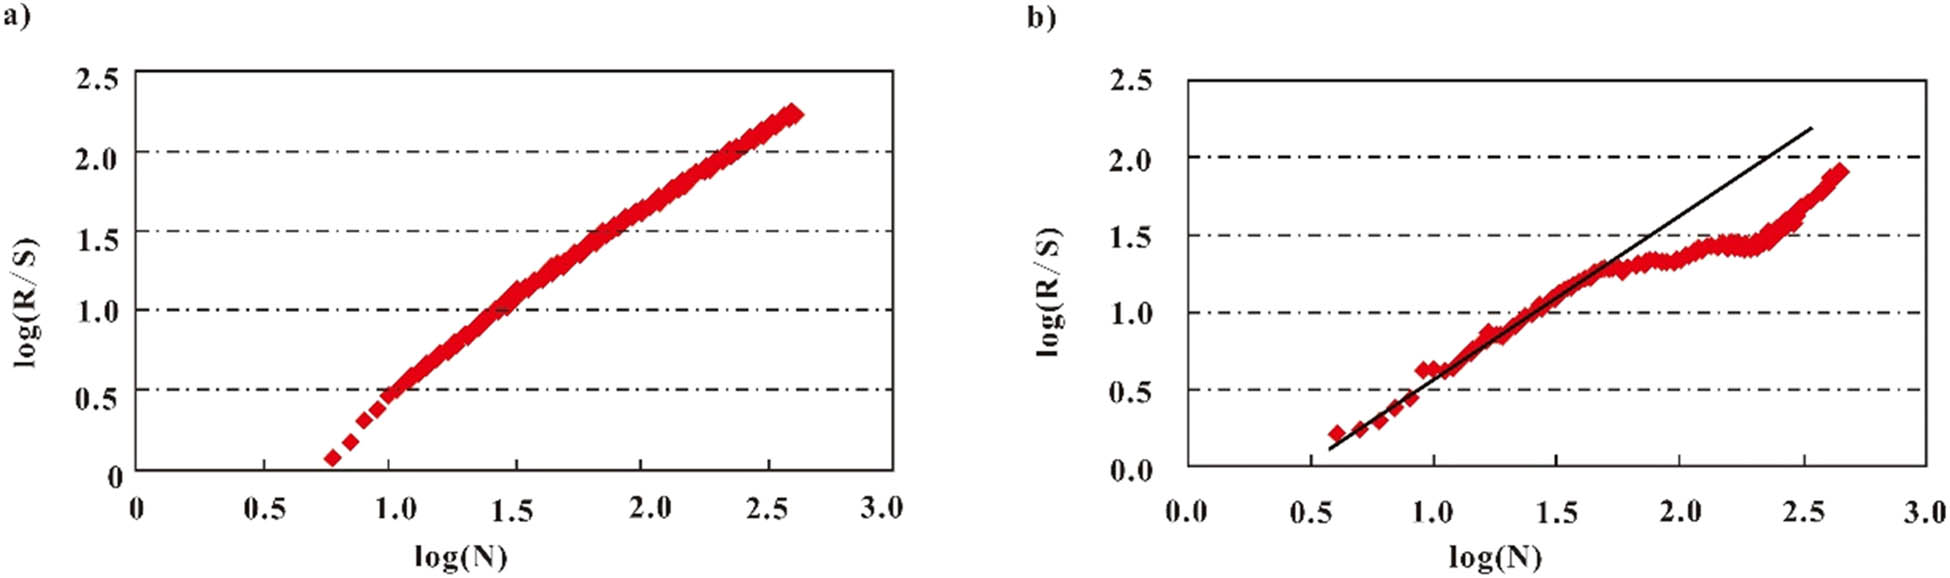
Calculation results of R/S fractal of acoustic wave time difference in Well L298. (a) R/S fractal results of fracture-undeveloped section (2672.8–2674.3 m); (b) R/S fractal results of fracture development section (2676.5–2677.8 m).
5.2.3 Comprehensive probability index method
The resistivity invasion correction difference ratio method and the time-difference shape dimension method cannot quantitatively describe the degree of fracture development in the reservoir. Therefore, this study introduces an index reflecting the abnormal change of fractures, which is used to quantitatively determine the development of reservoir fractures.
By comparing the logging parameters with the degree of fracture development, the logging parameters of acoustic wave time difference, natural gamma, dual-induction-eight lateral resistivity are optimized, and then the fracture index is constructed. First, the logging parameters are normalized:
In the formula, X max and X min are the maximum and minimum values of the sandstone logging parameters of the target interval in the conventional logging curve, respectively; X is the value of the logging curve; and XI is the index of the curve reflecting the abnormal degree of fracture development.
Using a single parameter to identify fractures can lead to large errors. By analyzing the sensitivity of each logging parameter to fractures, multiple fracture-sensitive logging curves were weighted to obtain the fracture indication parameter (CWP t ):
In the formula, n is the number of characteristic parameters reflecting fractures. Since the preferred fracture-indicating parameters in this study are acoustic wave time difference, natural gamma, and dual-induction-octalateral logging, so n = 3. A i is the weighting coefficient that reflects the value of characteristic parameters of fractures; XI i is the abnormal variation index reflecting fractures; CWP t is the arithmetically weighted fracture indicator parameter.
Mud components generally have the characteristics of high natural gamma, high acoustic time difference, and low resistance, ans they are close to the response characteristics of fractures. Therefore, the existence of mud components can easily interfere with the accuracy of fracture identification. In order to reduce the influence of shale in the formation on identifying fractures and improve the accuracy of fracture identification, a comprehensive probability index CWP is proposed, namely:
In the formula, CWP is the comprehensive fracture probability index; GR is the natural gamma curve value; GRmin is the minimum natural gamma value of the study interval.
The above treatments can effectively reduce the influence of reservoir shale components on fracture identification, reduce the interference of formation interface and shale laminae, and finally improve the accuracy of fracture identifications.
6 Case analysis
6.1 Analysis of fracture identification results
By comparing the results of imaging logging and core fracture observations, the fracture logging model proposed in this paper can identify fractures in Chang 8 reservoirs in the Huanjiang area with high precision. Comparing the results, the fractures identified by this method include high-angle fractures, near-vertical fractures, and horizontal fractures. Taking Well M110 as an example, the 2,520–2,534 m sandstone section is identified as a fracture-developed section under the calibration of core and imaging logging data (Figure 10). The corresponding resistivity intrusion correction difference ratio index RTC > 0, the fractal dimension of the acoustic transit time DFA ≈ 1, and the comprehensive fracture probability index CWP > 0.05 were obtained after filtering the shale content and the curve change rate (Figure 10a). Under the joint constraints of various parameters, No. 2 and No. 4 sand bodies were identified as fracture-developed intervals. And in this interval, multiple high-angle fractures were identified. Compared with the imaging logging data of this interval, fractures are relatively developed in the 2,518–2,531 m interval of Well M110 (Figure 10b), which further shows that the conventional logging fracture identification model proposed in this paper can accurately identify fractures.
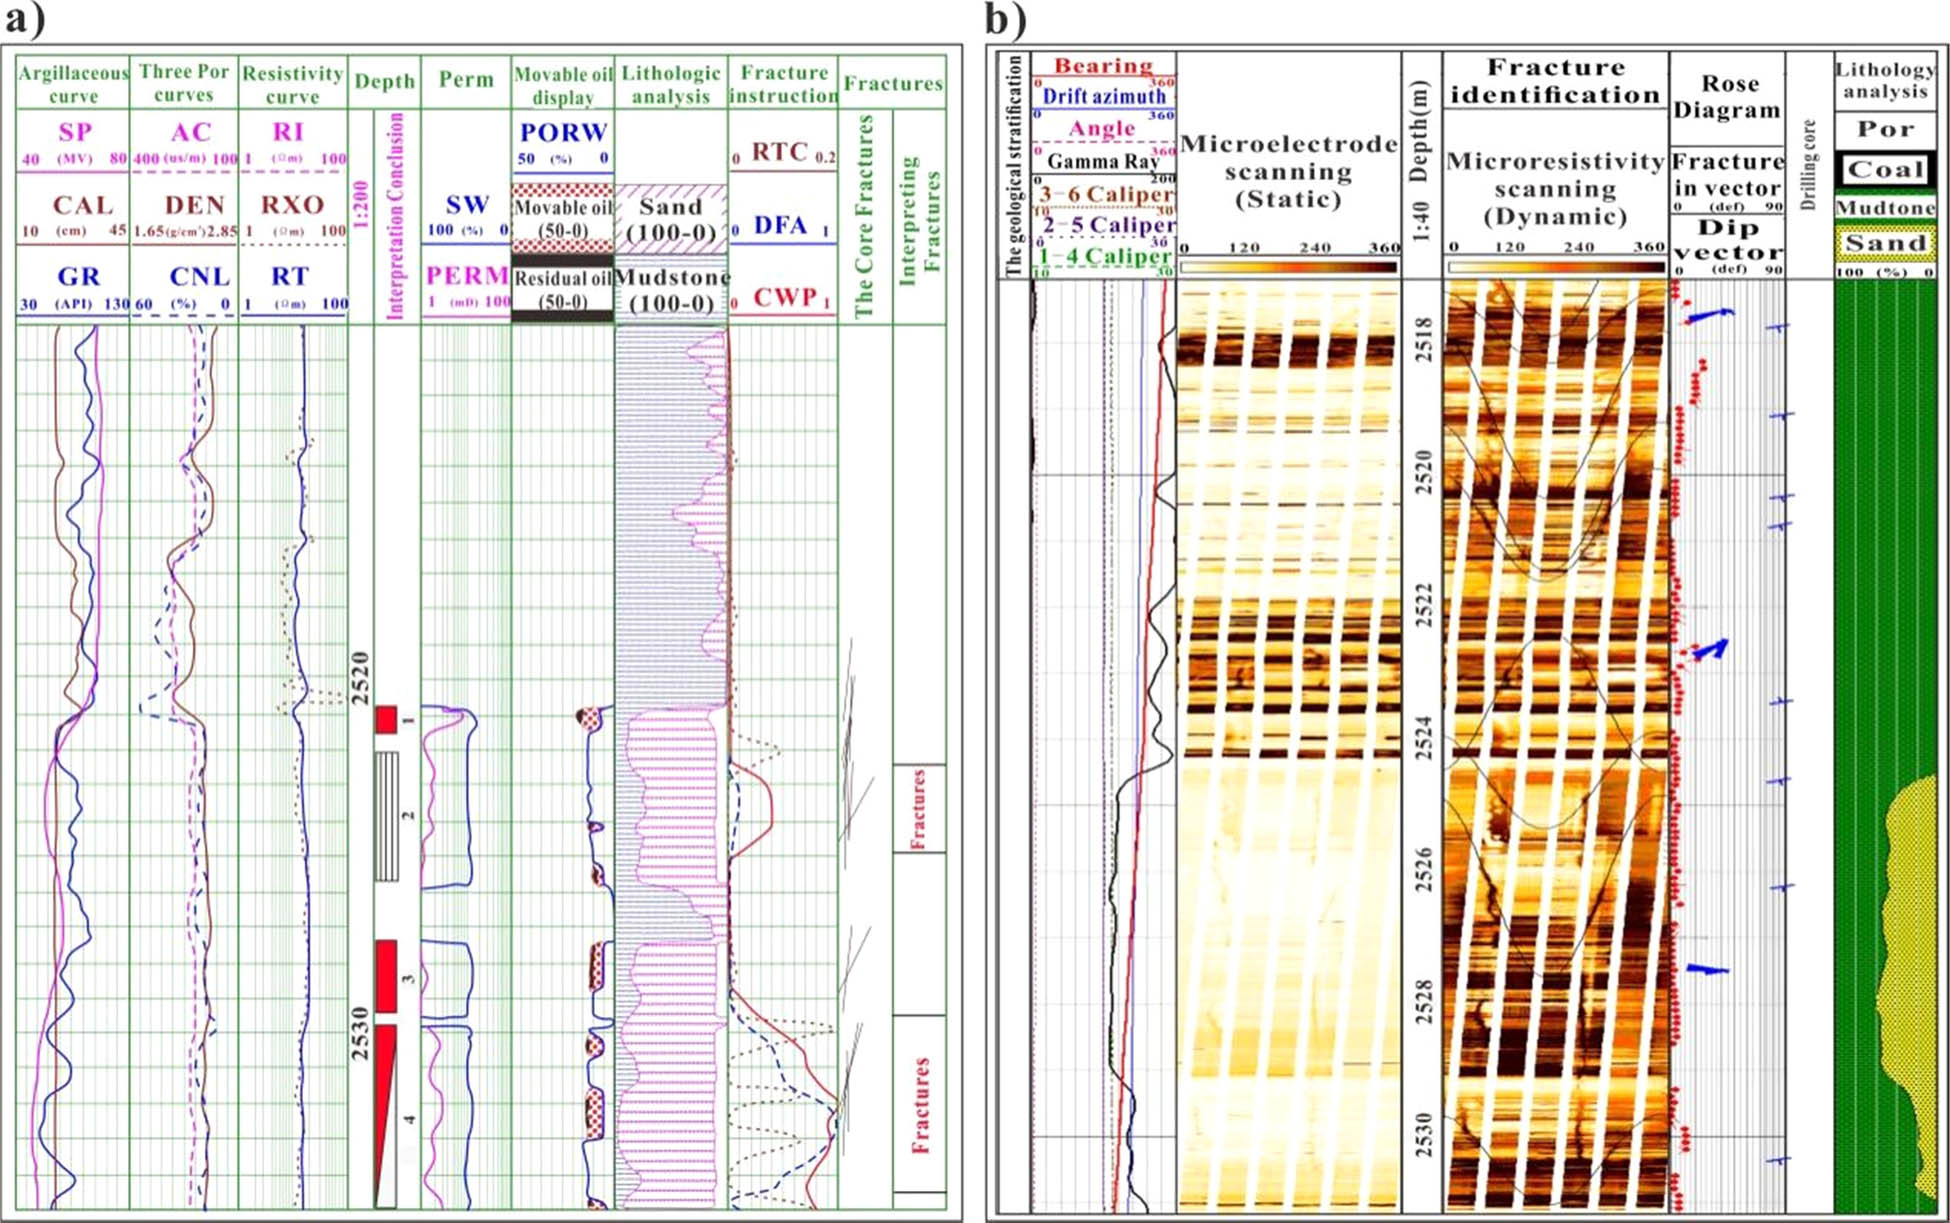
Comprehensive identification results of fractures in Well M110. (a) Identification results of fracture segments; (b) fracture identification results from imaging logs.
Through logging identifications of fractures in 19 wells in the study area, 79 fracture development segments were identified under the constraints of core observations and imaging logging interpretations. Among them, 64 fracture development intervals were consistent with the fractures interpreted by imaging logging and 3D seismic, and the comprehensive fracture recognition rate was 80.6%. Therefore, the comprehensive fracture recognition rate of the method proposed in this paper was 80.6%.
The comprehensive fracture identification method can also be applied to other types of sedimentary rock reservoirs. However, affected by different mineral compositions, the logging response characteristics of fractures will change accordingly [65,66,67,68,69,70]. Therefore, if the method is applied to other types of reservoirs, it is necessary to re-analyze the correlation between the fracture characteristics of the reservoir and the logging curves and to re-establish the corresponding formulas and physical models [71,72,73,74,75].
6.2 Influence of fractures on single well productivity
The Chang 8 oil reservoir in the Huanjiang Oilfield of the Ordos Basin is adjacent to the Chang 7 source rocks. Natural fractures are the main storage space and seepage channel of tight sandstone reservoirs and play an important role in controlling hydrocarbon migration and accumulation in source rocks. In tight oil reservoirs, favorable oil and gas traps are likely to be formed in areas with natural fractures [76,77,78,79,80].
Based on fracture logging identification results and 3D seismic ant tracking results, favorable areas for natural fractures in the Chang 8 Member of the study area were demarcated (Figure 11). The fracture development areas of Chang 8 reservoir in the study area are mainly located in the H42 area in the southwest, the M110 area in the southeast, and the B55 and B40 areas in the middle part. High-yield wells are mostly located in natural fracture development areas, such as near wells M110, M119, and B40. High-yield wells are mostly located in natural fracture development areas, such as near wells M110, M119, and B40. The average daily oil production of these wells exceeds 10 tons. These high-yield fracturing sections mainly develop high-angle fractures with low filling degrees.
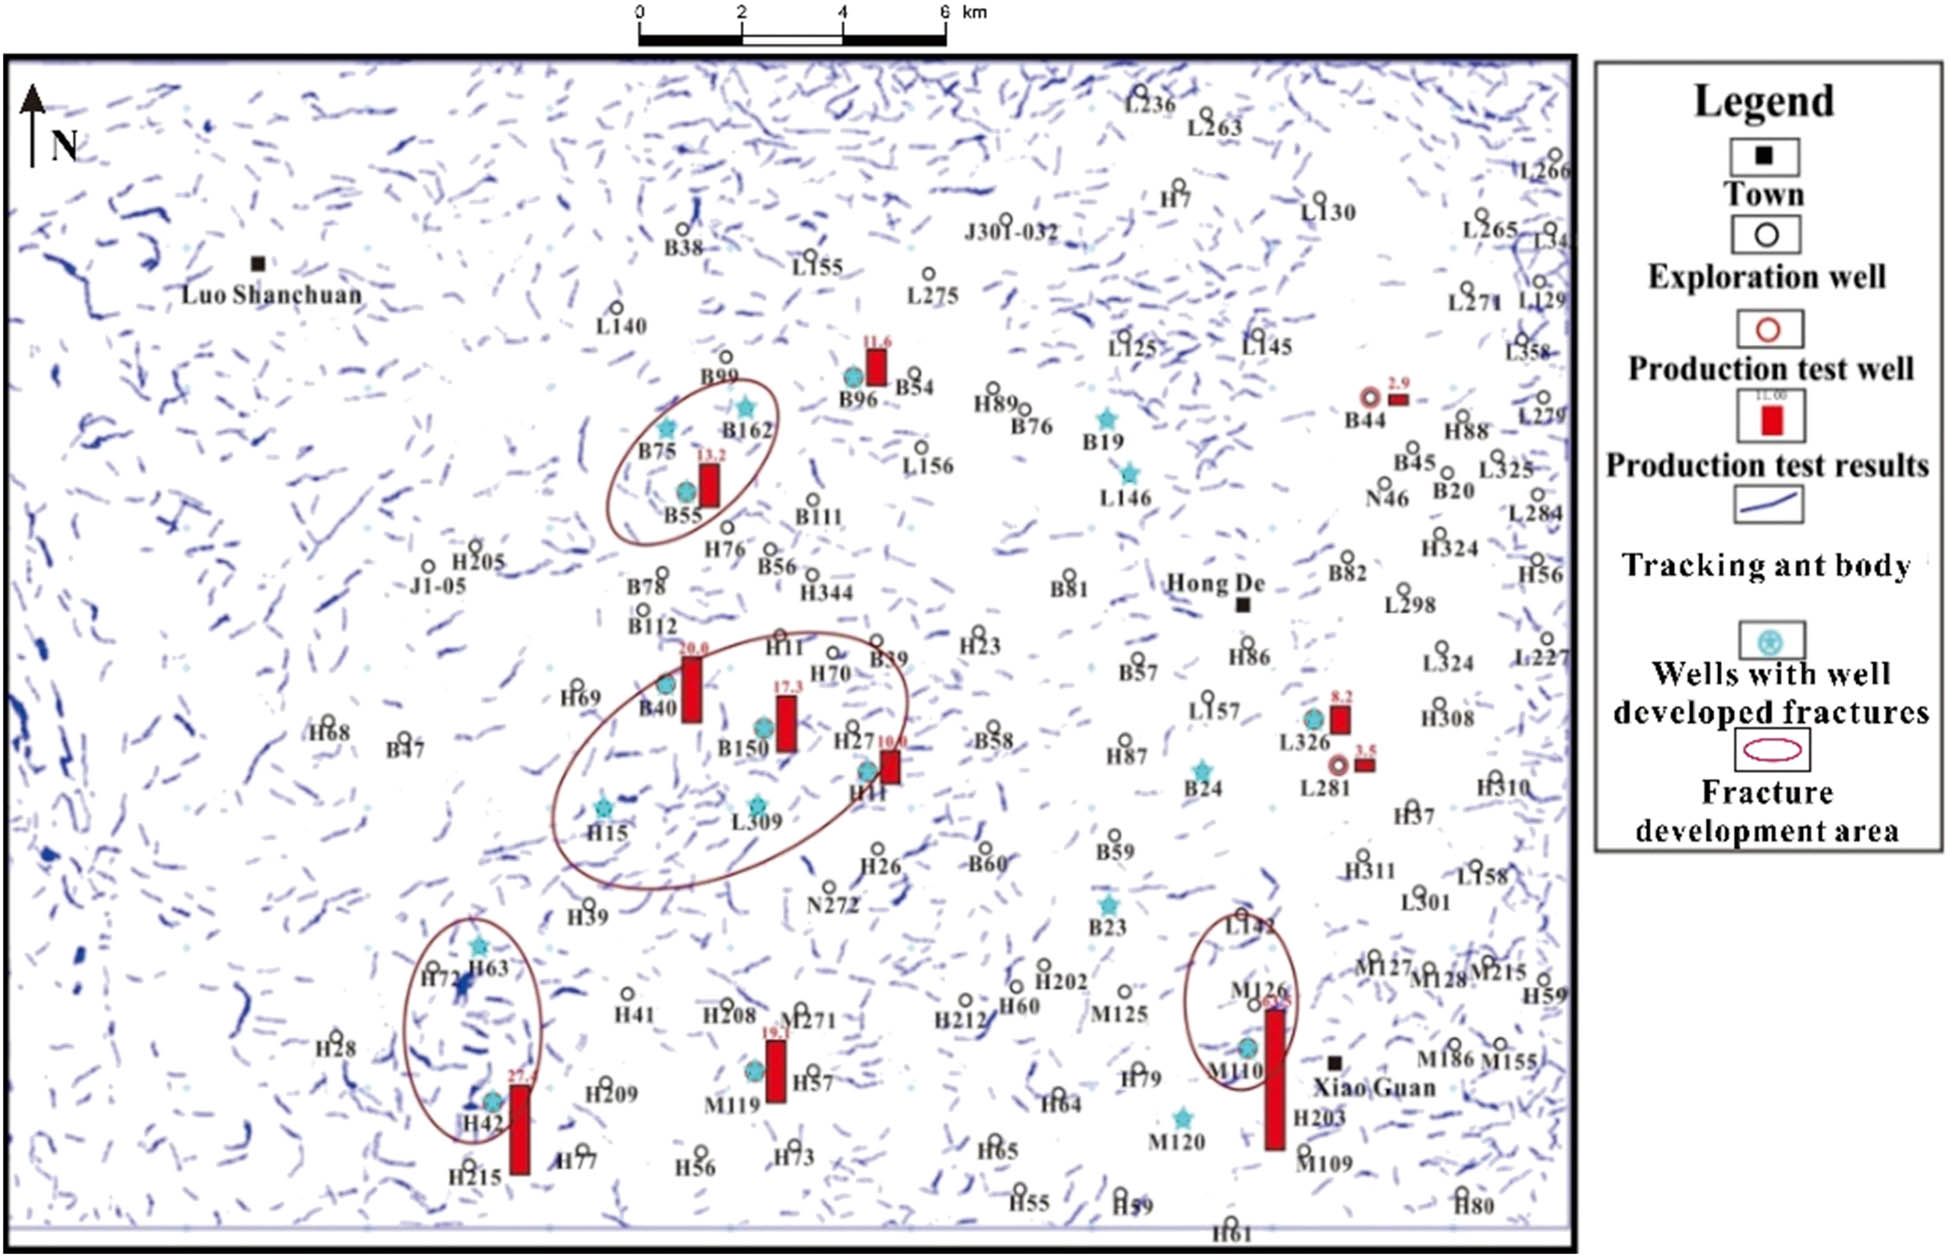
Distribution of fracture development areas and high-yield wells in Chang 8 reservoirs in the study area. The bottom image is the result of the ant tracking algorithm based on 3D seismic data for the Chang 8 Member.
7 Conclusions
High-angle fractures, medium-low-angle fractures, near-vertical fractures and horizontal fractures were developed in the Chang 8 Member of the Huanjiang Oilfield. The main ones are high-angle fractures, followed by horizontal fractures with a low degree of fillings. The probability of fracture development is 55.9%.
Statistical analysis of imaging logging interpretation results showed that the target layer mainly develops fractures with NE, NW, and NSW strikes. The NE-trending fractures are widely distributed in the study area; the NNW-trending fractures are mainly concentrated in the western part of the study area; the nearly NS-trending fractures are less developed and mainly distributed in the middle of the study area.
Under the constraints of core and imaging logging data, the fracture sensitivity logging parameters of the acoustic wave time difference, natural gamma, and dual induction-octalateral resistivity were optimized, and a comprehensive fracture probability index were proposed. Seventy-nine fracture development intervals were identified based on log curve characteristics and fracture probability index. The coincidence rate of fracture logging identification results with core observation and imaging logging interpretation is 80.6%.
Most of the high-yield wells in the Chang 8 reservoir in the study area are located in areas where natural fractures are developed, and the daily oil production of a single well is more than 10 tons. The fracturing intervals in such wells usually develop high-angle and horizontal fractures with low filling degrees.
-
Conflict of interest: The authors declare that they have no known competing financial interests or personal relationships that could have appeared to influence the work reported in this paper.
-
Data availability statement: Some or all data, models, or code generated or used during the study are proprietary or confidential in nature and may only be provided with restrictions.
References
[1] Hanif S, Tariq A, Ahmed AI, Hanif A. Ant tracking algorithm for surface discontinuity extraction-faults detection. Int Conf Robot Emerg Allied Technol Eng. 2014;4:235–42. 10.1109/iCREATE.2014.6828371.Search in Google Scholar
[2] Zhao ZY, Lu S. Geological conditions of tight sandstone gas accumulation by diffusion in sulige gasfield, ordos basin, china. Acta Geol Sin. 2016;87:222–5.10.1111/1755-6724.12304_2Search in Google Scholar
[3] Zhang J, Wong TF, Davis DM. Micromechanics of pressure-induced grain crushing in porous rocks. J Geophys Res. 1990;95:341–52.10.1029/JB095iB01p00341Search in Google Scholar
[4] Fan CH, Li H, Qin QR, Shang L, Yuan YF, Li Z. Formation mechanisms and distribution of weathered volcanic reservoirs: a case study of the carboniferous volcanic rocks in northwest junggar basin, china. Energy Sci Eng. 2020;8(8):2841–58.10.1002/ese3.702Search in Google Scholar
[5] Fan CH, Zhong C, Zhang Y, Qin QR, He S. Geological factors controlling the accumulation and high yield of marine-facies shale gas: case study of the wufeng-longmaxi formation in the dingshan area of southeast sichuan, china. Acta Geol Sin Engl. 2019;93(3):530–60.10.1111/1755-6724.13857Search in Google Scholar
[6] Zeng LB, Liu HT. Influence of fractures on the development of low-permeability sandstone reservoirs: a case study from the taizhao district, daqing oilfield, china. J Pet Sci Eng. 2010;72:120–7.10.1016/j.petrol.2010.03.009Search in Google Scholar
[7] Santosh M, Feng ZQ. New horizons in energy geoscience. Energy Geosci. 2020;1(1–2):1–2. 10.1016/j.engeos.2020.05.005.Search in Google Scholar
[8] Wei YJ, Lallit A. On micro-cracking, inelastic dilatancy, and the brittle-ductile transition in compact rocks: a micro-mechanical study. Solids Struct. 2008;45:2785–98.10.1016/j.ijsolstr.2007.11.028Search in Google Scholar
[9] Vernik L, Hamman J. Modeling elastic properties of siliciclastic rocks. Geophysics. 2010;75(6):171–82.10.1190/1.3494031Search in Google Scholar
[10] Gao FQ. Influence of hydraulic fracturing of strong roof on mining-induced stress insight from numerical simulation. J Min Strata Control Eng. 2021;3(2):023032. 10.13532/j.jmsce.cn10-1638/td.20210329.001.Search in Google Scholar
[11] Li Y, Zhou D, Wang W, Jiang T, Xue Z. Development of unconventional gas and technologies adopted in China. Energy Geosci. 2020;1(1–2):55–68. 10.1016/j.engeos.2020.04.004.Search in Google Scholar
[12] Sun YF. Seismic signatures of rock pore structure. Appl Geophys. 2004;35(1):42–9.10.1007/s11770-004-0029-6Search in Google Scholar
[13] Nelson PH. Pore- throat size in sandstones, tight sandstones, and shales. AAPG Bull. 2009;93(3):329–40.10.1306/10240808059Search in Google Scholar
[14] Menendez B, Zhu W, Wong TF. Micromechanics of brittle faulting and cataclastic flow in berea sandstone. J Struct Geol. 1996;18:1–16.10.1016/0191-8141(95)00076-PSearch in Google Scholar
[15] Mavko G, Mukerji T, Dvorkin J. The rock physics handbook: Tools for seismic analysis in porous media. London: Cambridge University Press; 1998. p. 45–7.Search in Google Scholar
[16] Zhao KK, Jiang PF, Feng YJ, Sun XD, Cheng LX, Zheng JW. Investigation of the characteristics of hydraulic fracture initiation by using maximum tangential stress criterion. J Min Strata Control Eng. 2021;3(2):023520. 10.13532/j.jmsce.cn10-1638/td.20201217.001.Search in Google Scholar
[17] Li HB, Zhang JJ. Analytical approximations of bulk and shear moduli for dry rock based on the differential effective medium theory. Geophys Prospect. 2012;60(2):281–92.10.1111/j.1365-2478.2011.00980.xSearch in Google Scholar
[18] Hong D, Cao J, Wu T, Dang S, Hu W, Yao S. Authigenic clay minerals and calcite dissolution influence reservoir quality in tight sandstones: insights from the central junggar basin, NW China. Energy Geosci. 2020;1(1–2):8–19. 10.1016/j.engeos.2020.03.001.Search in Google Scholar
[19] Hamid A, Sun YF. Rock-physics-based estimation of critical-clay-volume fraction and its effect on seismic velocity and petrophysical properties. Geophysics. 2014;79(3):175–85.10.1190/geo2012-0510.1Search in Google Scholar
[20] Farrell NJC, Healy D, Taylor CW. Anisotropy of permeability in faulted porous sandstones. J Struct Geol. 2014;63:50–67.10.1016/j.jsg.2014.02.008Search in Google Scholar
[21] Li L, Li SJ. Evolution rule of overlying strata structure in repeat mining of shallow close distance seams based on schwarz alternating procedure. J Min Strata Control Eng. 2021;3(2):023515. 10.13532/j.jmsce.cn10-1638/td.20210225.001.Search in Google Scholar
[22] Rock-physics-based carbonate pore type characterization and reservoir permeability heterogeneity evaluation, upper san andres reservoir, permian basin, West Texas. J Appl Geophys. 2011;74:8–1810.1016/j.jappgeo.2011.02.010Search in Google Scholar
[23] Mahmud H, Hisham M, Mahmud M, Leong V, Shafiq M. Petrophysical interpretations of subsurface stratigraphic correlations, baram delta, sarawak, malaysia. Energy Geosci. 2020;1(3–4):100–14. 10.1016/j.engeos.2020.04.005.Search in Google Scholar
[24] Ding WL, Zhu DW, Cai JJ, Gong ML, Chen FY. Analysis of the developmental characteristics and major regulating factors of fractures in marine-continental transitional shale-gas reservoirs: A case study of the Carboniferous- Permian strata in the southeastern Ordos Basin, central China. 2013;45:121–33.10.1016/j.marpetgeo.2013.04.022Search in Google Scholar
[25] Ding WL, Fan TL, B. S. Yu, Huang XB, Liu C. Ordovician carbonate reservoir fracture characteristics and fracture distribution forecasting in the tazhong area of tarim basin, Northwest China. J Pet Sci Eng. 2012;86-87:62–70.10.1016/j.petrol.2012.03.006Search in Google Scholar
[26] Desbois G, Urai JL, Kukla PA, Konstanty J, Baerle C. High –resolution 3D fabric and porosity model in a tight gas sandstone reservoir: A new approach to investigate micro structures from mm- to nm-scale combining argon beam cross-sectioning and SEM imaging. J Pet Sci Eng. 2011;78:243–57.10.1016/j.petrol.2011.06.004Search in Google Scholar
[27] Guo LL, Zhou DW, Zhang DM. Deformation and failure of surrounding rock of a roadway subjected to mining-induced stresses. J Min Strata Control Eng. 2021;3(2):023038. 10.13532/j.jmsce.cn10-1638/td.20200727.001.Search in Google Scholar
[28] Dong S, Zeng L, Lyu W, Xia D, Liu G, Wu Y, et al. Fracture identification and evaluation using conventional logs in tight sandstones: a case study in the ordos basin, China. Energy Geosci. 2020;1(3–4):115–23. 10.1016/j.engeos.2020.06.003.Search in Google Scholar
[29] Bieniawski ZT. Mechanism of brittle fracture of rock, part II – experimental studies. Int J Rock Mech Min Sci. 1967;4:407–23.10.1016/0148-9062(67)90031-9Search in Google Scholar
[30] Ding WL, Zhu DW, Cai JJ, Gong ML, Chen FY. Analysis of the developmental characteristics and major regulating factors of fractures in marine-continental transitional shale-gas reservoirs. A case study Carboniferous-Permian strata Southeast. Ordos Basin, central China. 2013;45:121–33.Search in Google Scholar
[31] Chen ZM, Zhang SL, Wan LG. Gulong qingshankou mudstone north of structural cracks and reservoir distribution and prediction. Pet Technol. 1988;9:5–7.Search in Google Scholar
[32] Corbett KP, Friedman M, Spang J. Fracture development and mechanical stratigraphy of austin chalk, texas. Am Assoc Pet Geol. 1987;71:17–28.10.1306/94886D35-1704-11D7-8645000102C1865DSearch in Google Scholar
[33] Ding WL, Fan TL, Yu BS, Huang XB, Liu C. Ordovician carbonate reservoir fracture characteristics and fracture distribution forecasting in the tazhong area of tarim basin, Northwest China. J Pet Sci Eng. 2012;86-87:86–7.10.1016/j.petrol.2012.03.006Search in Google Scholar
[34] Ding WL, Zhu DW, Cai JJ, Gong ML, Chen FY. Analysis of the developmental characteristics and major regulating factors of fractures in marine- continental transitional shale-gas reservoirs: a case study of the carboniferous-permian strata in the southeastern ordos basin. Central China. Mar Pet Geol. 2013;45:121–33.10.1016/j.marpetgeo.2013.04.022Search in Google Scholar
[35] Chen GB, Li T, Yang L, Zhang GH, Li JW, Dong HJ. Mechanical properties and failure mechanism of combined bodies with different coal-rock ratios and combinations. J Min Strata Control Eng. 2021;3(2):023522. 10.13532/j.jmsce.cn10-1638/td.20210108.001.Search in Google Scholar
[36] Yoshida M, Santosh M. Energetics of the solid earth: an integrated perspective. Energy Geosci. 2020;1(1–2):28–35. 10.1016/j.engeos.2020.04.001.Search in Google Scholar
[37] John CL, Jenny LS, David SS. Natural fractures in the spraberry formation, midland basin, texas: the effects of mechanical stratigraphy on fracture variability and reservoir behavior. Am Assoc Pet Geol Bull. 2002;86:505–24.Search in Google Scholar
[38] Lorenz JC, Finley SJ. Regional fractures: fracturing of Mesaverde reservoirs in the piceance basin, colorado. Am Assoc Pet Geol Bull. 1991;75:1738–57.10.1306/0C9B29ED-1710-11D7-8645000102C1865DSearch in Google Scholar
[39] Mckinnon SD, Barra IG. Fracture initiation, growth and effect on stress field: a numerical investigation. J Struct Geol. 1998;20:1663–72.10.1016/S0191-8141(98)00080-7Search in Google Scholar
[40] Nelson RA. Geologic analysis of naturally fractured reservoirs. Boston: Gulf Professional Publications; 2001. p. 1–4.10.1016/B978-088415317-7/50004-XSearch in Google Scholar
[41] Peggy R, Michele LC. Role of shale thickness in vertical connectivity of fracture: application of crack-bridging theory to the austin chalk, texas. Tectonophysics. 2001;337(1):17–133.10.1016/S0040-1951(01)00107-XSearch in Google Scholar
[42] Xue F, Liu XX, Wang TZ. Research on anchoring effect of jointed rock mass based on 3D printing and digital speckle technology. J Min Strata Control Eng. 2021;3(2):023013. 10.13532/j.jmsce.cn10-1638/td.20201020.001.Search in Google Scholar
[43] Shi DS, Li MW, Pang XQ, Chen DX, Zhang SW, Wang YS, et al. Fault-fracture mesh petroleum plays in the zhanhua depressio, bohai bay basin: part2. oil-source correlation and secondary migration mechanisms. Org Geochem. 2004;36:203–23.10.1016/j.orggeochem.2004.09.003Search in Google Scholar
[44] Mirzaei-Paiaman A, Ghanbarian B. A new methodology for grouping and averaging capillary pressure curves for reservoir models. Energy Geosci. 2021;2(1):52–62. 10.1016/j.engeos.2020.09.001.Search in Google Scholar
[45] Tong KJ, Zhao CM, Lu ZB, Zhang YC, Zheng H, Xu SN, et al. Reservoir evaluation and fracture chracterization of the metamorphic buried hill reservoir in bohai bay basin. Pet Explor Dev. 2012;39:62–9.10.1016/S1876-3804(12)60015-9Search in Google Scholar
[46] Zeng LB, Li XY. Fractures in sandstone reservoirs with ultra-low perme-ability: a case study of the upper triassic yanchang formation in the ordos basin, china. Am Assoc Pet Geol Bull. 2009;93:461–77.10.1306/09240808047Search in Google Scholar
[47] Zhang LY, Liu Q, Zhu RF, Li Z, Lu XC. Source rocks in mesozoic–cenozoic continental rift basins, east china: a case from dongying depression, bohai bay basin. Org Geochem. 2009;40:229–42.10.1016/j.orggeochem.2008.10.013Search in Google Scholar
[48] Qie L, Shi YN, Liu JS. Experimental study on grouting diffusion of gangue solid filling bulk materials. J Min Strata Control Eng. 2021;3(2):023011. 10.13532/j.jmsce.cn10-1638/td.20201111.001.Search in Google Scholar
[49] Zeng WT, Zhang JC, Ding WL, Zhao S, Zhang YQ, Liu ZJ, et al. Fracture development in paleozoic shale of chongqing area (south china). part one: fracture characteristics and comparative analysis of main controlling factors. J Asian Earth Sci. 2013;75:251–66.10.1016/j.jseaes.2013.07.014Search in Google Scholar
[50] Ding F, Xie C, Zhou X, Jiang C, Li K, Wan L, et al. Defining stratigraphic oil and gas plays by modifying structural plays: a case study from the Xihu Sag, east china sea shelf basin. Energy Geosci. 2021;2(1):41–51. 10.1016/j.engeos.2020.08.002.Search in Google Scholar
[51] Zhi FQ, Li Q, Fan DH, Zhang CM. Study on migration and accumulation of oil and gas in fractured shale reservoir in zhanhua sag. Pet Geol Recovery Effic. 2004;11:27–9.Search in Google Scholar
[52] Yin S, Dong L, Yang X, Wang R. Experimental investigation of the petrophysical properties, minerals, elements and pore structures in tight sandstones. J Nat Gas Sci Eng. 2020;76:103189.10.1016/j.jngse.2020.103189Search in Google Scholar
[53] Yin S, Lv DW, Ding WL. New method for assessing microfracture stress sensitivity in tight sandstone reservoirs based on acoustic experiments. Int J Geomech. 2018;18(4):1–16.10.1061/(ASCE)GM.1943-5622.0001100Search in Google Scholar
[54] Zhang B, Shen B, Zhang J. Experimental study of edge-opened cracks propagation in rock-like materials. J Min Strata Control Eng. 2020;2(3):033035. 10.13532/j.jmsce.cn10-1638/td.20200313.001.Search in Google Scholar
[55] Decker AD, Coates JM, Wicks DE. Stratigraphy, gas occur-rence, formation evaluation and fracture characterization of the antrim shale, michigan basin. GRI Topical Report No GRI. 1992;92/0258:153–4.Search in Google Scholar
[56] Jarvie DM, Hill RJ, Pollastro RM, Wavrek DA, Claxton BL, Tobey MH. Evaluation of unconventional natural gas prospects in the barnett shale: fractured shale gas model. In: European Asso-ciation of International Organic Geochemists Meeting, Poland,S eptember 8–12. Poland, Krakow; 2003.Search in Google Scholar
[57] Yin S, Ding WL. Evaluation indexes of coalbed methane accumulation in the strong deformed strike-slip fault zone considering tectonics and fractures: A 3D geomechanical simulation study. Geol Mag. 2019;156(6):1–17.10.1017/S0016756818000456Search in Google Scholar
[58] Yin S, Zhao J, Wu Z, Ding W. Strain energy density distribution of a tight gas sandstone reservoir in a low amplitude tectonic zone and its effect on gas well productivity: A 3D FEM study. J Pet Sci Eng. 2018;170:89–104.10.1016/j.petrol.2018.06.057Search in Google Scholar
[59] Wang J, Wang XL. Seepage characteristic and fracture development of protected seam caused by mining protecting strata. J Min Strata Control Eng. 2021;3(3):033511. 10.13532/j.jmsce.cn10-1638/td.20201215.001.Search in Google Scholar
[60] Martini AM, Walter LM, Ku TCW, Budai JM, McIntosh JC, Martin S. Microbial production and modification of gases in sedimentary basins: a geochemical case study from a Devonian shale gas play, Michigan basin. AAPG Bull. 2003;87(8):1355–75.10.1306/031903200184Search in Google Scholar
[61] Nelson RA. Geologic analysis of naturally fractured reservoirs: contributions in petroleum geology and engineering. Houston: Gulf Publishing Company; 1985. p. 320.Search in Google Scholar
[62] Price NJ. Fault and joint development in brittle and semi-brittle rock. Oxford, EnglandPergamon Press; 1966. p. 221–40.10.1016/B978-0-08-011275-6.50007-0Search in Google Scholar
[63] Ji S, Zhu Z, Wang Z. Relationship between joint spacing and bed thickness in sedimentary rocks: effect of interbed slip. Geol Mag. 1998;135:637–55.10.1017/S0016756898001459Search in Google Scholar
[64] John CL, Jenny LS, David SS, Chris LW, Jerry LJ. Natural fractures in the spraberry formation, midland basin, texas: the effects of mechanical stratigraphy on fracture variability and reservoir behavior. AAPG Bull. 2002;86:505–24.10.1306/61EEDB20-173E-11D7-8645000102C1865DSearch in Google Scholar
[65] Nelson RA. Geologic analysis of naturally fractured reservoires. Houston: Gulf Publishing Company; 1985. p. 352–3.Search in Google Scholar
[66] Lan SR, Song DZ, Li ZL, Liu Y. Experimental study on acoustic emission characteristics of fault slip process based on damage factor. J Min Strata Control Eng. 2021;3(3):033024. 10.13532/j.jmsce.cn10-1638/td.20210510.002.Search in Google Scholar
[67] Van Golf-Racht TD. Fundamentals of fractured reservoir engineering. Amsterdam: Developments in Petroleum Science No.12. Elsevier Scientific Pub. Co; 1982. p. 732.Search in Google Scholar
[68] Yuan SY, Song XM, Ran QQ. Development technology of fractured reservoirs (in Chinese). Beijing: Petroleum Industry Press; 2004. p. 336–7.Search in Google Scholar
[69] Yin S, Xie RC, Wu ZH, Liu J, Ding WL. In situ stress heterogeneity in a highly developed strike-slip fault zone and its effect on the distribution of tight gases: A 3D finite element simulation study. Mar Pet Geol. 2019;99(1):75–91.10.1016/j.marpetgeo.2018.10.007Search in Google Scholar
[70] Yin S, Wu Z. Geomechanical simulation of low-order fracture of tight sandstone. Mar Pet Geol. 2020;100:1–16.10.1016/j.marpetgeo.2020.104359Search in Google Scholar
[71] Yang JX, Luo MK, Zhang XW, Huang N, Hou SJ. Mechanical properties and fatigue damage evolution of granite under cyclic loading and unloading conditions. J Min Strata Control Eng. 2021;3(3):033016. 10.13532/j.jmsce.cn10-1638/td.20210510.001.Search in Google Scholar
[72] Zeng LB, Qi JF, Li YG. The relationship between fractures and tectonic stress field in the extra low-permeability sandstone reservoir at the south of western Sichuan depression. J Chin Univ Geosci. 2007;18:223–31.10.1016/S1002-0705(08)60003-5Search in Google Scholar
[73] Tong KJ, Zhao CM, Lu ZB, Zhang YC, Zheng H, Xu SN, et al. Reservoir evaluation and fracture chracterization of the metamorphicburied hill reservoir in Bohai Bay Basin. Pet Explor Dev. 2012;39:62–9.10.1016/S1876-3804(12)60015-9Search in Google Scholar
[74] Liu J, Zhang G, Bai J, Ding W, Yang H, Liu Y. Quantitative prediction of the drilling azimuth of horizontal wells in fractured tight sandstone based on reservoir geomechanics in the Ordos Basin, central China. Mar Pet Geol. 2022;136:105439.10.1016/j.marpetgeo.2021.105439Search in Google Scholar
[75] Liu J, Ding W, Yang H, Liu Y. Quantitative multiparameter prediction of fractured tight sandstone reservoirs: a case study of the Yanchang Formation of the Ordos Basin, Central China. SPE J. 2021;26(5):3342–73.10.2118/205495-PASearch in Google Scholar
[76] Liu J, Yang H, Bai J, Wu K, Zhang G, Liu Y, et al. Numerical simulation to determine the fracture aperture in a typical basin of China. Fuel. 2020;283:118952.10.1016/j.fuel.2020.118952Search in Google Scholar
[77] Chen L, Wang G, Yang Y, Jing C, Chen M, Tan X. Geochemical characteristics of bentonite and its influence on shale reservoir quality in wufeng-longmaxi formation, south sichuan basin, china. Energy Fuels. 2019;33(12):12366–73.10.1021/acs.energyfuels.9b03510Search in Google Scholar
[78] Chen L, Jiang Z, Liu Q, Jiang S, Liu K, Tan J, et al. Mechanism of shale gas occurrence: insights from comparative study on pore structures of marine and lacustrine shales. Mar Pet Geol. 2019;104:200–16.10.1016/j.marpetgeo.2019.03.027Search in Google Scholar
[79] Chen L, Jiang Z, Liu K, Tan J, Gao F, Wang P. Pore structure characterization for organic-rich lower silurian shale in the upper yangtze platform, south China: a possible mechanism for pore development. J Nat Gas Sci Eng. 2017;46:1–15.10.1016/j.jngse.2017.07.009Search in Google Scholar
[80] Liu B, He S, Meng L, Fu X, Gong L, Wang H. Sealing mechanisms in volcanic faulted reservoirs in Xujiaweizi extension, Northern Songliao Basin, Northeastern China. AAPG Bull. 2021;105:1721–43. 10.1306/03122119048.Search in Google Scholar
© 2022 Xiangliang Qiu et al., published by De Gruyter
This work is licensed under the Creative Commons Attribution 4.0 International License.
Articles in the same Issue
- Regular Articles
- Study on observation system of seismic forward prospecting in tunnel: A case on tailrace tunnel of Wudongde hydropower station
- The behaviour of stress variation in sandy soil
- Research on the current situation of rural tourism in southern Fujian in China after the COVID-19 epidemic
- Late Triassic–Early Jurassic paleogeomorphic characteristics and hydrocarbon potential of the Ordos Basin, China, a case of study of the Jiyuan area
- Application of X-ray fluorescence mapping in turbiditic sandstones, Huai Bo Khong Formation of Nam Pat Group, Thailand
- Fractal expression of soil particle-size distribution at the basin scale
- Study on the changes in vegetation structural coverage and its response mechanism to hydrology
- Spatial distribution analysis of seismic activity based on GMI, LMI, and LISA in China
- Rock mass structural surface trace extraction based on transfer learning
- Hydrochemical characteristics and D–O–Sr isotopes of groundwater and surface water in the northern Longzi county of southern Tibet (southwestern China)
- Insights into origins of the natural gas in the Lower Paleozoic of Ordos basin, China
- Research on comprehensive benefits and reasonable selection of marine resources development types
- Embedded deformation of the rubble-mound foundation of gravity-type quay walls and influence factors
- Activation of Ad Damm shear zone, western Saudi Arabian margin, and its relation to the Red Sea rift system
- A mathematical conjecture associates Martian TARs with sand ripples
- Study on spatio-temporal characteristics of earthquakes in southwest China based on z-value
- Sedimentary facies characterization of forced regression in the Pearl River Mouth basin
- High-precision remote sensing mapping of aeolian sand landforms based on deep learning algorithms
- Experimental study on reservoir characteristics and oil-bearing properties of Chang 7 lacustrine oil shale in Yan’an area, China
- Estimating the volume of the 1978 Rissa quick clay landslide in Central Norway using historical aerial imagery
- Spatial accessibility between commercial and ecological spaces: A case study in Beijing, China
- Curve number estimation using rainfall and runoff data from five catchments in Sudan
- Urban green service equity in Xiamen based on network analysis and concentration degree of resources
- Spatio-temporal analysis of East Asian seismic zones based on multifractal theory
- Delineation of structural lineaments of Southeast Nigeria using high resolution aeromagnetic data
- 3D marine controlled-source electromagnetic modeling using an edge-based finite element method with a block Krylov iterative solver
- A comprehensive evaluation method for topographic correction model of remote sensing image based on entropy weight method
- Quantitative discrimination of the influences of climate change and human activity on rocky desertification based on a novel feature space model
- Assessment of climatic conditions for tourism in Xinjiang, China
- Attractiveness index of national marine parks: A study on national marine parks in coastal areas of East China Sea
- Effect of brackish water irrigation on the movement of water and salt in salinized soil
- Mapping paddy rice and rice phenology with Sentinel-1 SAR time series using a unified dynamic programming framework
- Analyzing the characteristics of land use distribution in typical village transects at Chinese Loess Plateau based on topographical factors
- Management status and policy direction of submerged marine debris for improvement of port environment in Korea
- Influence of Three Gorges Dam on earthquakes based on GRACE gravity field
- Comparative study of estimating the Curie point depth and heat flow using potential magnetic data
- The spatial prediction and optimization of production-living-ecological space based on Markov–PLUS model: A case study of Yunnan Province
- Major, trace and platinum-group element geochemistry of harzburgites and chromitites from Fuchuan, China, and its geological significance
- Vertical distribution of STN and STP in watershed of loess hilly region
- Hyperspectral denoising based on the principal component low-rank tensor decomposition
- Evaluation of fractures using conventional and FMI logs, and 3D seismic interpretation in continental tight sandstone reservoir
- U–Pb zircon dating of the Paleoproterozoic khondalite series in the northeastern Helanshan region and its geological significance
- Quantitatively determine the dominant driving factors of the spatial-temporal changes of vegetation-impacts of global change and human activity
- Can cultural tourism resources become a development feature helping rural areas to revitalize the local economy under the epidemic? An exploration of the perspective of attractiveness, satisfaction, and willingness by the revisit of Hakka cultural tourism
- A 3D empirical model of standard compaction curve for Thailand shales: Porosity in function of burial depth and geological time
- Attribution identification of terrestrial ecosystem evolution in the Yellow River Basin
- An intelligent approach for reservoir quality evaluation in tight sandstone reservoir using gradient boosting decision tree algorithm
- Detection of sub-surface fractures based on filtering, modeling, and interpreting aeromagnetic data in the Deng Deng – Garga Sarali area, Eastern Cameroon
- Influence of heterogeneity on fluid property variations in carbonate reservoirs with multistage hydrocarbon accumulation: A case study of the Khasib formation, Cretaceous, AB oilfield, southern Iraq
- Designing teaching materials with disaster maps and evaluating its effectiveness for primary students
- Assessment of the bender element sensors to measure seismic wave velocity of soils in the physical model
- Appropriated protection time and region for Qinghai–Tibet Plateau grassland
- Identification of high-temperature targets in remote sensing based on correspondence analysis
- Influence of differential diagenesis on pore evolution of the sandy conglomerate reservoir in different structural units: A case study of the Upper Permian Wutonggou Formation in eastern Junggar Basin, NW China
- Planting in ecologically solidified soil and its use
- National and regional-scale landslide indicators and indexes: Applications in Italy
- Occurrence of yttrium in the Zhijin phosphorus deposit in Guizhou Province, China
- The response of Chudao’s beach to typhoon “Lekima” (No. 1909)
- Soil wind erosion resistance analysis for soft rock and sand compound soil: A case study for the Mu Us Sandy Land, China
- Investigation into the pore structures and CH4 adsorption capacities of clay minerals in coal reservoirs in the Yangquan Mining District, North China
- Overview of eco-environmental impact of Xiaolangdi Water Conservancy Hub on the Yellow River
- Response of extreme precipitation to climatic warming in the Weihe river basin, China and its mechanism
- Analysis of land use change on urban landscape patterns in Northwest China: A case study of Xi’an city
- Optimization of interpolation parameters based on statistical experiment
- Late Cretaceous adakitic intrusive rocks in the Laimailang area, Gangdese batholith: Implications for the Neo-Tethyan Ocean subduction
- Tectonic evolution of the Eocene–Oligocene Lushi Basin in the eastern Qinling belt, Central China: Insights from paleomagnetic constraints
- Geographic and cartographic inconsistency factors among different cropland classification datasets: A field validation case in Cambodia
- Distribution of large- and medium-scale loess landslides induced by the Haiyuan Earthquake in 1920 based on field investigation and interpretation of satellite images
- Numerical simulation of impact and entrainment behaviors of debris flow by using SPH–DEM–FEM coupling method
- Study on the evaluation method and application of logging irreducible water saturation in tight sandstone reservoirs
- Geochemical characteristics and genesis of natural gas in the Upper Triassic Xujiahe Formation in the Sichuan Basin
- Wehrlite xenoliths and petrogenetic implications, Hosséré Do Guessa volcano, Adamawa plateau, Cameroon
- Changes in landscape pattern and ecological service value as land use evolves in the Manas River Basin
- Spatial structure-preserving and conflict-avoiding methods for point settlement selection
- Fission characteristics of heavy metal intrusion into rocks based on hydrolysis
- Sequence stratigraphic filling model of the Cretaceous in the western Tabei Uplift, Tarim Basin, NW China
- Fractal analysis of structural characteristics and prospecting of the Luanchuan polymetallic mining district, China
- Spatial and temporal variations of vegetation coverage and their driving factors following gully control and land consolidation in Loess Plateau, China
- Assessing the tourist potential of cultural–historical spatial units of Serbia using comparative application of AHP and mathematical method
- Urban black and odorous water body mapping from Gaofen-2 images
- Geochronology and geochemistry of Early Cretaceous granitic plutons in northern Great Xing’an Range, NE China, and implications for geodynamic setting
- Spatial planning concept for flood prevention in the Kedurus River watershed
- Geophysical exploration and geological appraisal of the Siah Diq porphyry Cu–Au prospect: A recent discovery in the Chagai volcano magmatic arc, SW Pakistan
- Possibility of using the DInSAR method in the development of vertical crustal movements with Sentinel-1 data
- Using modified inverse distance weight and principal component analysis for spatial interpolation of foundation settlement based on geodetic observations
- Geochemical properties and heavy metal contents of carbonaceous rocks in the Pliocene siliciclastic rock sequence from southeastern Denizli-Turkey
- Study on water regime assessment and prediction of stream flow based on an improved RVA
- A new method to explore the abnormal space of urban hidden dangers under epidemic outbreak and its prevention and control: A case study of Jinan City
- Milankovitch cycles and the astronomical time scale of the Zhujiang Formation in the Baiyun Sag, Pearl River Mouth Basin, China
- Shear strength and meso-pore characteristic of saturated compacted loess
- Key point extraction method for spatial objects in high-resolution remote sensing images based on multi-hot cross-entropy loss
- Identifying driving factors of the runoff coefficient based on the geographic detector model in the upper reaches of Huaihe River Basin
- Study on rainfall early warning model for Xiangmi Lake slope based on unsaturated soil mechanics
- Extraction of mineralized indicator minerals using ensemble learning model optimized by SSA based on hyperspectral image
- Lithofacies discrimination using seismic anisotropic attributes from logging data in Muglad Basin, South Sudan
- Three-dimensional modeling of loose layers based on stratum development law
- Occurrence, sources, and potential risk of polycyclic aromatic hydrocarbons in southern Xinjiang, China
- Attribution analysis of different driving forces on vegetation and streamflow variation in the Jialing River Basin, China
- Slope characteristics of urban construction land and its correlation with ground slope in China
- Limitations of the Yang’s breaking wave force formula and its improvement under a wider range of breaker conditions
- The spatial-temporal pattern evolution and influencing factors of county-scale tourism efficiency in Xinjiang, China
- Evaluation and analysis of observed soil temperature data over Northwest China
- Agriculture and aquaculture land-use change prediction in five central coastal provinces of Vietnam using ANN, SVR, and SARIMA models
- Leaf color attributes of urban colored-leaf plants
- Application of statistical and machine learning techniques for landslide susceptibility mapping in the Himalayan road corridors
- Sediment provenance in the Northern South China Sea since the Late Miocene
- Drones applications for smart cities: Monitoring palm trees and street lights
- Double rupture event in the Tianshan Mountains: A case study of the 2021 Mw 5.3 Baicheng earthquake, NW China
- Review Article
- Mobile phone indoor scene features recognition localization method based on semantic constraint of building map location anchor
- Technical Note
- Experimental analysis on creep mechanics of unsaturated soil based on empirical model
- Rapid Communications
- A protocol for canopy cover monitoring on forest restoration projects using low-cost drones
- Landscape tree species recognition using RedEdge-MX: Suitability analysis of two different texture extraction forms under MLC and RF supervision
- Special Issue: Geoethics 2022 - Part I
- Geomorphological and hydrological heritage of Mt. Stara Planina in SE Serbia: From river protection initiative to potential geotouristic destination
- Geotourism and geoethics as support for rural development in the Knjaževac municipality, Serbia
- Modeling spa destination choice for leveraging hydrogeothermal potentials in Serbia