Study on observation system of seismic forward prospecting in tunnel: A case on tailrace tunnel of Wudongde hydropower station
-
Senlin Yang
 ,
Xinji Xu
,
Xinji Xu

Abstract
Seismic method is a major approach for detecting the seismic geological features ahead of the tunnel, understanding the distribution of unfavorable geology, and ensuring the safety of tunnel construction. Observation system is the key for seismic detection, many studies have been conducted to optimize the observation system; however, most of them focused on the surface seismic investigation and numerical simulation rather than in tunnel field environment (limited aperture and full space environment). How to obtain better wavefield information with limited observation aperture is a great challenge. In this study numerical simulation and instrumental techniques (GPR, DC, etc.) were implemented to further check the result of seismic detection at the 1# tailrace tunnel at the Wudongde hydropower station. In the field case, observation detectors were arranged spatially in the tunnel and source points were placed in four ways: linearly along a single side, on the tunnel face, in front of the detectors, and behind the detectors. Then, after data acquisition, the data processing is conducted to carry out the migration results. The imaging results indicate that the observation system with sources and detectors in liner arrangement (with equal interval) helps to suppress artifacts, further supporting the advantages of spatial observation system with liner observation line (detectors). Moreover, the study provides suggestions for geological prospecting in similar tunnel projects.
1 Introduction
The rapid and sustained economic development has increased the requirements for road traffic engineering, water conservation, and hydropower projects. This development leads the trend that the country builds more and more constructions in the underground environment [1]. Taking China as an example, in the field of transportation, 16,331 km railway tunnels are in operation, and 7,465 km tunnels are under construction, as well as 15,634 km tunnels are under design or planning by the end of 2018 [2]. In the field of water conservation and hydropower, more than 40 key hydropower projects are planned or under construction as well as dozens of long-distance water transfer projects [3]. Besides, urban underground and underwater tunnels have also been rapidly constructed along with the development of urban subways [4]. During tunnel excavation, geological disasters such as water inrush and collapses easily occur during tunnel construction without accurate information of adverse geology in advance [5,6,7].
It is crucial to acquire information such as the location, scale, and category of seismic geological features in advance to guarantee the safety of the construction and personnel. Although possible fractured areas and fault conditions can be preliminarily estimated through surface surveys, the resolution of the location and scale of such anomalous bodies may not be enough [8,9]. Therefore, geological detection methods used in tunnel have been developed to improve the exploration accuracy of seismic geological features, including geological drilling, seismic methods, electromagnetic methods, and resistivity methods [1]. Among these methods, tunnel seismic detection method is a typical geophysical exploration approach, which can deduce the properties (wave impedance), scale, and shape of geological structures in front of the tunnel face. By analyzing the response (reflected waves) of the adverse geologies, the interface with the difference in wave impedance could be estimated, such as cave, fault, and fractured zones. The seismic method has been widely used in tunnel geological exploration owing to its sensitivity to faults and caves, as well as its long detection distance [6]. Representative tunnel seismic methods are tunnel seismic prediction (TSP) [10,11], true reflection tomography (TRT) [12], seismic ahead-prospecting (SAP) [6], the true reflection underground seismic technique (TRUST) [13], etc.
As the basis of tunnel seismic detection method, the observation system plays an important role on the accuracy of the detection results. To support a good detection result, researchers proposed several observation systems for seismic detection in tunnel environment. For example, TSP places the source points and detectors along a straight line, and uses an explosion in the drilling hole to excite a seismic wave for detection [10]. Differently, TRT, SAP, and TRUST use space observation system for observing the seismic waves, and the hammer is adopted to excite seismic waves. Among them, TRT places the sources and detectors in multiple rings on the tunnel sidewall [12], TRUST sets the detectors in a ring and arranges the sources in a straight line [13], and SAP places the sources in a ring and linearly arranges the detectors [6,14]. In other words, with the improvement in signal processing technique, the forms of observation system are gradually increasing.
Due to the important role of observation system on data processing and migration, many studies have been conducted to optimize and improve the observation arrangement. The main approaches are numerical study and field test. In general, most studies are conducted to recognize the advantages of spatial observation system (compared to the one-dimensional observation system) [14,15,16]; meanwhile, the comparison studies are mainly based on the numerical ways. Therefore, actual data analysis and comparison are still needed. Hence, a detailed comparative analysis of spatial observation systems was carried out in this study based on the tailrace tunnel of Wudongde hydropower station in China, revealing the wavefield characteristics and providing more evidences. First, the general background of the Wudongde hydropower station and the geological condition are introduced; Second, four typical spatial observation systems are designed and applied for data processing and geological imaging (as well as the detailed processing methods, including pre-processing, filtering, wavefield separation, migration, etc.); Third, comparative analysis on observed seismic records and imaging results is carried out; Finally, comprehensive detection based on other geophysical methods, including ground penetrating radar (GPR), the direct current (DC) electric method, and the transient electromagnetic method (TEM), are conducted to further check the imaging results using different observation systems. In other words, based on an actual tunnel environment, this study evaluates the observed data and imaging characteristics using different observation system, and estimates the geological conditions ahead of the tunnel face, helping for better understanding the geological conditions.
2 Site description
Wudongde hydropower station is located at the Jinsha River, which is the junction of Huidong County (Sichuan Province) and Luquan County (Yunnan Province), China (Figure 1). It is the first station of the four-stage hydropower stations (including Wudongde hydropower station, Baihetan hydropower station, Xiluodu hydropower station, and Xiangjiaba hydropower station) in the lower reaches of the Jinsha River. The Wudongde hydropower project has a drainage area of 406,100 km2. Double-curved arch dam was constructed to stop water in this station and make a reservoir with the water storage level of 975 m and the total storage capacity of 7.408 billion cubic meters. This station is of significant importance for increasing the power generation and output, promoting the flood prevention and local economic development. The Wudongde hydropower station is located at the position with complex geological condition by terrain, which is located at a deep and steep canyon. The slope has the height of about 1,500–1,800 m, as well as a grade of 60–70°. The underground project mainly consists of large caverns, water tunnels, tailrace tunnels, diversion tunnels, and flood discharge tunnels [17], most of them are long and large (cavern groups).
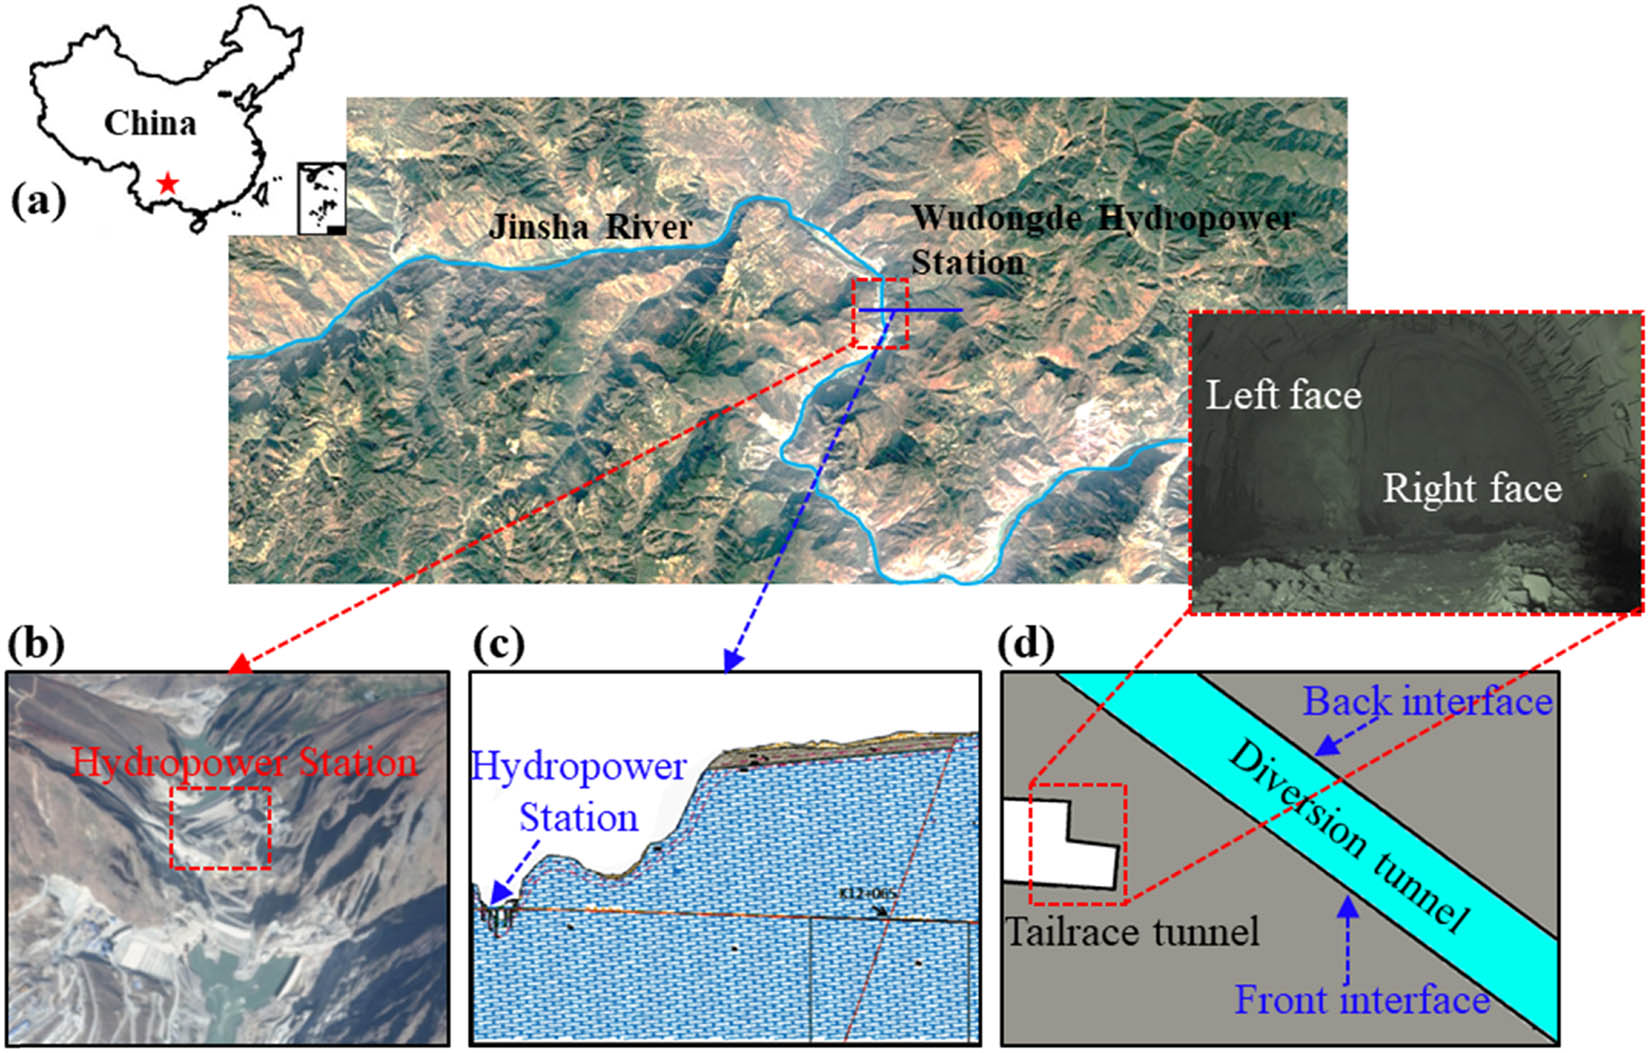
Project overview of the #1 Tailrace Tunnel of Wudongde hydropower station: (a and b) location of Wudongde hydropower station, (c) geological profile diagram, and (d) relative position of #1 Tailrace Tunnel and #2 Diversion Tunnel.
The 1# tailrace tunnel is located at the left of Jinsha River, which has thick gray and dark gray layers, as well as discontinuous phyllite strips. In general, the stratigraphic lithology is mainly medium- and thick-bedded tuffs, marble, and dolomite; meanwhile, intermittent faults are developed [18]. As Figure 1(c) shows, the 2# diversion tunnel is located approximately at 38–83 m in front of the 1# tailrace tunnel when 1# tailrace tunnel was being excavated at the mileage of 1 + 151 m. Meanwhile, when this diversion tunnel is in operation and water overflows, the diversion tunnel can be regarded to be an underground river or water-filled cave in detection field test, providing a good environment for observation system study.
3 Observation systems and methodology
3.1 Observation systems for data acquisition
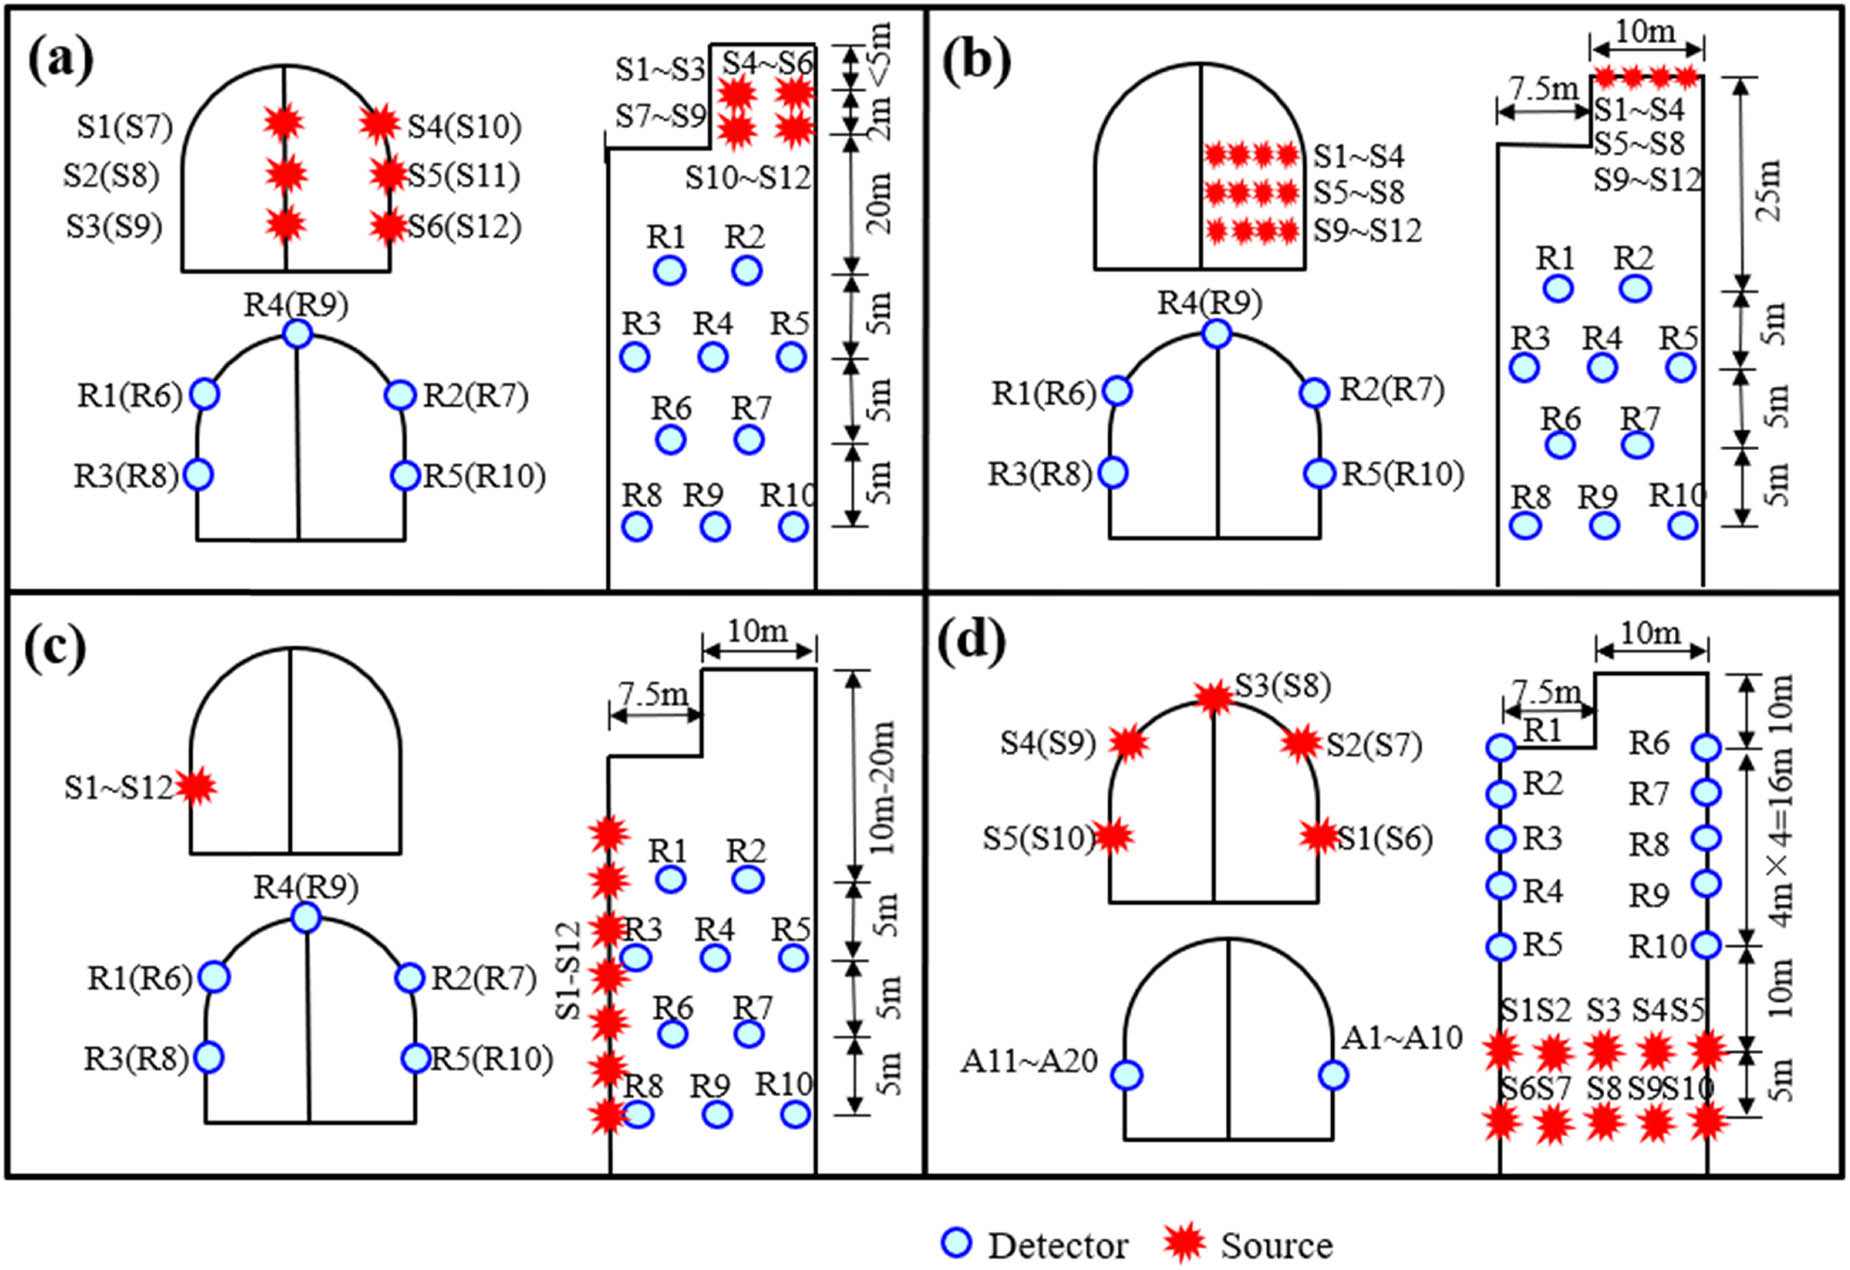
In this study, sufficient seismic data were observed by several typical observation systems. Then, the data analysis was carried out and incorporated to provide guidance for comparison and selection of spatial observation system. In view of the traditional observation systems and on-site conditions, four typical spatial observation systems were designed (Figure 2).

Four tunnel seismic observation systems: (a) observation system A, (b) observation system B, (c) observation system C, and (d) observation system D.
Spatial observation system A is designed, as shown in Figure 2(a), such that source points (S1–S12) are mounted on two rings (six source points per ring) at the position 5 and 7 m far away from the tunnel face. And ten detectors are placed on four rings (two or three detectors per ring) at the position 25–40 m far away from the tunnel face. Among them, detectors R1, R2, R6, and R7 are on the shoulder of the tunnel, while detectors R3, R5, R8, and R10 are on the haunch of the tunnel, and detectors R4 and R9 are on the vault of the tunnel. The spacing of these four rings is 5 m in the tunnel axial direction.
Observation systems B and C have the same arrangement of detectors, but the source positions are different. Figure 2(b) shows the observation system B, which places 12 source points on the tunnel face with a spacing of 2 m. Figure 2(c) shows the spatial observation system C, which arranges 12 source points at the haunch of the tunnel sidewall within the range of 18–41 m from the tunnel face (the source points are in a straight line with a spacing of 2 m).
Figure 2(d) shows the spatial observation system D, in which the detectors are arranged on the left and right side of the tunnel (five detectors in one side) and the distances from the detectors to the tunnel face are 10, 14, 18, 22, and 26 m, respectively. 12 sources are arranged in 2 rings, which are 36 and 41 m far away from the tunnel face, respectively.
For these four observation systems, an eight-pound sledge hammer was used to excite the seismic waves at different locations in the field. Then, the seismic wave information was collected by detectors installed on the sidewall of the tunnel.
3.2 Data processing methods
In addition to the direct analysis of the acquired raw seismic signals, it is important to perform the necessary data processing and imaging analysis before evaluating the observation system. In this study, the seismic-ahead prospecting method [6] is used for data processing. The geological imaging results of different observation systems were obtained through filtering, wavefield separation, velocity analysis, migration imaging, etc.
The flow of main data processing is shown in Table 1, in which the first arrivals of the original seismic records are picked and the velocity of direct wave is estimated; then, the band-pass filtering is adopted to remove noise with higher or lower frequency than the dominant frequency. The trace equalization is adopted to balance the amplitude of the signals of different traces. The automatic gain control (AGC) and de-convolution are used to increase the amplitude and improve the resolution. The f-k filtering is used to separate the P- and S-waves, and diffraction stack migration is adopted to image the geological features ahead of the tunnel face.
Data processing flow
| No. | Process method |
|---|---|
| 1 | First arrival time picking |
| 2 | Direct wave velocity analysis |
| 3 | Mute direct waves |
| 4 | Bandpass filtering |
| 5 | Trace equalization |
| 6 | Deconvolution |
| 7 | AGC |
| 8 | Wave field separation |
| 9 | Migration |
4 Case study
4.1 Data acquisition
To evaluate the feasibility of the above observation systems, data acquisition was carried out at the tailrace tunnel of the Wudongde hydropower station. Considering the bad influence of drill-and-blast excavation on the shape control of the tunnel, the observation system was adjusted to achieve the actual in-tunnel data acquisition, especially, for the condition that the left part of the tunnel face is located 10 m behind the right part of the tunnel face. In that case, observation systems are modified and shown in Figure 3. For the observation system A, 12 source points were placed close to the tunnel face (5–7 m away from right part of the tunnel face). All source points were set in the chamber of the right part of the tunnel face. For observation system B, 12 source points were set on the right part of the tunnel face with a spacing of 2 m.
Actual observation systems of tunnel site data acquisition: observation systems (a) A, (b) B, (c) C, and (d) D.
Observation systems C and D are similar to those in Figure 2. The sampling time interval and length were 0.1 ms and 409.6 ms, respectively. An eight-pound sledgehammer was adopted to excite the seismic waves at source points S1–S12. Besides, to observe vibration better, geophones are mounted on the tunnel sidewall by a small borehole with fast-drying cement materials.
Figure 4 shows the seismic records of the common source gather when source is at point S1. It is easy to find the direct wave with large amplitude and width. Figure 4(a) shows the seismic records of the observation system A. It indicates that the seismic event is hard to be identified due to the discrete arrangement of the detectors and source points. Figure 4(b) shows the seismic records of the observation system B. Due to the scattering effect of the breaking points (reflector between the left part and right part of the tunnel face), the direct wave received on the left sidewall of the tunnel is more complicated and generally overlaps the scattered waves. In that case, it is difficult to distinguish the wave field. Figure 4(c) shows the seismic records of the observation system C, which indicates that the direct wave changes significantly (amplitude and arrival time), and the signal amplitude on the right side wall is much smaller than that on the left side (due to the sources being located on the left sidewall). Figure 4(d) illustrates the seismic records of observation system D, which shows that the events are clear and easily distinguishable. Besides, to better understand the difference in seismic signals by different source positions, the frequency of the data was then analyzed. Figure 5 shows the frequency spectrums, which indicates that the dominant frequencies of the observation systems A, C, and D are similar (approximately 200–500 Hz). Differently, the dominant frequency of the observation system B is lower obviously. In other words, compared to the observation systems A, B, and C, the observation system D helps to observe the seismic data with clear event, which is better for the wavefield identification and separation.

Original data of source S1 collected in the tunnel field: seismic records collected by observation systems (a) A, (b) B, (c) C, and (d) D.

Frequency spectrogram of field data in the tunnel site: seismic records collected by observation systems (a) A, (b) B, (c) C, and (d) D.
4.2 Migration imaging results
For data collected by these four observation systems, the imaging results were carried out by filtering, wavefield separation, velocity analysis, migration imaging, etc. Figure 6 shows the migration results of geological features ahead of the tunnel face.

Migration imaging results of tunnel seismic method for observations (a) A, (b) B, (c) C, and (d) D.
Figure 6(a) shows the imaging result using the observation system A. No obvious reflection exists in the mileage of 1 + 151 m to 1 + 176 m. Several reflections with large amplitude exist at the mileage of 1 + 176 m to 1 + 211 m, as well as reflection located at the mileage of 1 + 226 m.
Figure 6(b) shows the imaging result using the observation system B. No obvious reflection exists in the mileage of 1 + 151 m to 1 + 167 m. Several reflections with strong amplitude exist at the mileage of 1 + 167 m to 1 + 201 m, particularly in the mileage of 1 + 174 m to 1 + 179 m and 1 + 196 m to + 201 m.
Figure 6(c) shows the imaging result using the observation system C. There are many reflections existing in the migration result. Several reflections with strong amplitude exist at the mileage of 1 + 151 m to 1 + 176 m. Numerous reflections are located at the mileage of 1 + 176 m to 1 + 226 m.
Figure 6(d) shows the imaging result using the observation system D. A clear reflection exists at the mileage of 1 + 151 m to 1 + 166 m. Numerous reflections exist at the mileage of 1 + 166 m to 1 + 191 m, particularly at the mileage of 1 + 171 m to 1 + 176 m and 1 + 186 to 1 + 191 m.
4.3 Summary
To evaluate the seismic detection results using different observation systems, field experiments were analyzed both in the raw data and imaging features. The effectiveness of the four observation systems was analyzed by comparing them with known large geological structures (pre-excavated tunnel), which indicates that the observation system D helps to get the more accurate imaging result. The detailed difference in the study was summarized in Table 2 and the characteristics are as follows:
Comparison between imaging results
| Observation system | Target | Actual position (m) | Predicted position (m) | Error (%) | Actual dip angle (°) | Predicted dip angle (°) | Deviation value (°) |
|---|---|---|---|---|---|---|---|
| A | Front interface of diversion tunnel | 38 | 40 | 5 | 30 | 56 | 26 |
| Back interface of diversion tunnel | 85 | 71 | 16 | 30 | 56 | 26 | |
| B | Front interface of diversion tunnel | 38 | 44 | 15 | 30 | 50 | 20 |
| Back interface of diversion tunnel | 85 | 60 | 29 | 30 | 50 | 20 | |
| C | Front interface of diversion tunnel | 38 | 35 | 8 | 30 | 67 | 37 |
| Back interface of diversion tunnel | 85 | 71 | 16 | 30 | 55 | 25 | |
| D | Front interface of diversion tunnel | 38 | 44 | 15 | 30 | 29 | 1 |
| Back interface of diversion tunnel | 85 | 80 | 6 | 30 | 35 | 5 |
(1) Four observation systems can be used to detect the large geological structures ahead of the tunnel face in this case (the tunnel face is divided into two parts with different positions), and the reflection of the pre-excavated tunnel has large amplitude and is easy to be identified.
(2) The reflection of the front interface of the pre-excavated tunnel has more accurate position than the reflection of the rear interface. The position error of the interface using the observation system B is large (over 15%), and the position errors using the observation systems A, C, and D are smaller.
(3) For the estimation of interface inclination, the front interface and rear interface are slightly different. The imaging results using the observation systems A, B, and C have large error of inclination angles (over 20°), and the observation system D has the smallest error.
5 Results and discussion
By field experiment analysis, the observation system D helps to get the clear imaging result, which is consistent with the major geological structures (the pre-excavated tunnel ahead of the tunnel face). However, in addition to the strong reflections of the pre-excavated tunnel, it is easy to find several randomly distributed reflections existing in these four imaging results (Figure 6). To understand whether these reflections are real fractured zones or artifact, the integrated detection using GPR, the DC electric method, and the TEM were combined to realize the geological features ahead and further evaluate these seismic detection results using different observation system. Besides, the numerical simulation was conducted to analyze the reason.
5.1 Test by integrated geophysical detection
To verify the seismic wave detection results of the four observation systems, GPR, the DC electric method, and the TEM were employed. In principle, GPR can estimate the spatial position and shape of the underground target body by using transmit high-frequency electromagnetic waves with the detection distance of 30 m [19]. The DC electric method can estimate the water body 30 m ahead of the tunnel face [20] by analyzing the electric field, while TEM can detect the water body ahead at a distance of 50 m.
Combined with the results of the above three methods, as shown in Figure 7, the inferred results are as follows:
(1) In the mileage of 1 + 151 m to 1 + 170 m, the GPR result shows that the reflection is weak. The DC result shows the apparent high resistivity zone, and the TEM result also shows the apparent high resistivity. It can be deduced that the rock mass in this zone is similar to that of the tunnel face (the rock mass is integrity).
(2) In the mileage of 1 + 170 m to 1 + 181 m, the GPR result shows a strong reflection in the mileage of 1 + 170 m to 1 + 181 m. The DC result shows the apparent low resistivity in the mileage of 1 + 173 m to 1 + 181 m, and the TEM result also shows the apparent low resistivity in the mileage of 1 + 170 m to 1 + 176 m. In that case, the rock mass can be deduced as the pre-excavated tunnel.
(3) In the mileage of 1 + 181 m to 1 + 201 m, the TEM result shows apparent high resistivity, which could be deduced as the rock mass with good integrity.
According to the integrated geophysical detection, the positional relationship between the pre-excavated tunnel and the tailrace tunnel can be estimated. It was also confirmed that the rock mass between the tunnel face and the pre-excavated tunnel is integrity without unfavorable geological body. By comparing with the seismic detection results, it can be found that the imaging result using the observation system D is more accurate. And there are more false artifacts in the imaging results of other three observation systems. However, there is also false artifact in the imaging results using the observation system D, although the number is small.
It can be inferred that, in addition to the reflection of the diversion tunnel, false anomalies are caused by scattered waves at the breaking points of the left and right steps of the tunnel and by the converted wave at the diversion tunnel interface. Therefore, a numerical simulation of the forward modeling must be carried out to better reveal the source of false anomalies in the detection results and the reason for this needs further study.

Geophysical integrated detection results: (a) GPR, (b) DC, and (c) TEM results.
5.2 Test by numerical simulation
To evaluate the artifacts in the imaging result, two-dimensional forward modeling and imaging were studied based on the finite-difference method. The geological model (in homogenic and elastic materials) is shown in Figure 8, which has the size of 200 m × 200 m and grid of 0.5 m. The tunnel has a width of 14 m. The parameters of the tunnel are V p = 340 m/s and V s = 2 m/s; the parameters of rock mass are V P1 = 4,000 m/s and V S1 = 2,300 m/s; the parameters of pre-excavated tunnel are V P2 = 1,500 m/s and V S2 = 866 m/s. The pre-excavated tunnel is 38 m ahead of the tunnel face with the width of 45 m. In simulation, Ricker wavelet with 300 Hz was adopted as the source, and the spatial observation systems in Figure 3 were used to collect the data.

2D forward modeling geological model.
Figure 9(a) shows the seismic records of the observation system A. The direct wave has a large amplitude. However, it is difficult to recognize reflections in the seismic records. Figure 9(b) shows the forward seismic records of the observation system B. When the source is located on the tunnel face, the direct wave on the left side of the tunnel is poor due to the influence of the scattered waves by the breaking points (point L and M), resulting in a complicated wavefield. Figure 9(c) shows the seismic records of the observation system C. The arrival time of the direct wave varies with the change in the source location. When the sources are located in front of the detector, the apparent velocity direction of the direct waves is the same as that of the reflected waves. On the contrary, the apparent velocity direction of the direct waves is opposite to that of the reflected waves. Figure 9(d) shows the seismic records of the observation system D. Because the detectors are linearly arranged, the reflected waves of the diversion tunnel and the scattered waves by the breaking points of the tunnel face can be distinguished. Meanwhile, the apparent velocity direction of the reflected waves is opposite that of the direct waves. Therefore, wavefield separation can be achieved by the f-k or τ-p filtering, supporting to get the clear imaging result.

Seismic records of forward modeling using tunnel seismic method: observation systems (a) A, (b) B, (c) C, and (d) D.
Figure 10(a) shows the imaging result of the observation system A. There are strong reflections at the position of the pre-excavated tunnel interfaces. Two false anomalies are present in the middle of the front and back interfaces. According to the analysis of propagation snapshots, the false anomalies occur due to the discrete arrangement. The scattered waves, converted waves, and transverse waves are hard to be removed. Figure 10(b) shows the imaging result of the observation system B. Due to that the scattered waves are generated at the breaking points L and M of the tunnel face, the artifact exists in the imaging result. Similarly, the artifacts caused by the breaking points of the tunnel face exist both in the imaging results of the observation system C (Figure 10c) and the observation system D (Figure 10d).

Forward imaging results of tunnel seismic method: observation systems (a) A, (b) B, (c) C, and (d) D.
6 Discussion
Tests carried out using the integrated geophysical detection and numerical simulation, it is easy to find that the observation system D is beneficial for seismic detection in tunnel.
Influenced by an irregular tunnel face, scattered waves are generated at the breaking points between two different tunnel faces and sidewalls. The arrangement of detectors or sources along a line is conducive to suppressing the interference waves and improving the signal-to-noise ratio, which is beneficial to the reflected wave recognition and wave separation.
The observation system C arranges the sources on the left side of the tunnel, which is favorable for the identification of the left interface reflection. However, due to the anomalous body being unknown in field, it is necessary to arrange the sources both on the left and right sidewall of the tunnel.
7 Significance of the findings
The findings are (1) the SAP method was adopted in tunnel to estimate the geological conditions ahead of the tunnel face, (2) the characteristics of raw data and imaging result were analyzed to optimize the observation system suitable for this tunnel environment, and (3) the characteristics of the breaking points on the tunnel face were analyzed, providing assistance in the interpretation of seismic detection results in a similar tunnel.
8 Conclusion
In this study, the SAP method was adopted to understand the geological conditions ahead of the tunnel face at the 1# tailrace tunnel of Wudongde hydropower station. Based on the tunnel project, four typical observation systems were designed and applied in this project. And the better observation system was evaluated by analysis using the integrated geophysical detection and numerical study. The main conclusions are as follows:
(1) The typical spatial observation systems are designed and analyzed; then, seismic ahead prospecting method was carried out at the tailrace tunnel to predict the geological condition ahead of the tunnel face. The analysis of seismic records and migration results shows that the four methods can help detect the major geological structures ahead of the tunnel face (such as the interfaces of pre-excavated tunnel ahead of the tunnel face of the tailrace tunnel).
(2) Integrated detection, consisting of GPR, DC, and TEM, was conducted to estimate the geological condition ahead of the tunnel face. The detection results further evaluate the integrated rock mass between the tunnel face and the pre-excavated tunnel (the diversion tunnel). Then, the numerical simulation was carried out that revealed the characteristics and imaging results of seismic waves, proving the advantages of the observation system D in suppressing the interference and obtaining more accurate results.
This article provides references and guidance for the selection of observation systems in similar cases of tunnel engineering. In future, the observation system should be further verified in numerous tunnel engineering. And the Reverse Time Migration and Full Waveform Inversion should be studied to further suppress the artifacts.
-
Conflict of interest: Authors state no conflict of interest in this paper.
References
[1] Li SC, Liu B, Sun HF, Nie LC, Zhong SH, Su MX, et al. State of art and trends of advanced geological prediction in tunnel construction. Chinese J Rock Mech Eng. 2014;33(6):1090–113.Search in Google Scholar
[2] Zhao Y, Tian SM. Statistics of railway tunnels in china as of end of 2018. Tunn Constr. 2019;39(2):324–35.Search in Google Scholar
[3] National Energy Administration of China. Hydropower development “13th Five-Year Plan” (2016–2020). Beijing: National Energy Administration of China; 2016.Search in Google Scholar
[4] Wang MS. Current developments and technical issues of underwater traffic tunnel – discussion on construction scheme of Taiwan strait undersea railway tunnel. Chinese J Rock Mech Eng. 2008;27(11):2161–72.Search in Google Scholar
[5] Li S, Liu B, Xu X, Nie L, Liu Z, Song J, et al. An overview of ahead geological prospecting in tunneling. Tunn Undergr Sp Tech. 2017;63:69–94.10.1016/j.tust.2016.12.011Search in Google Scholar
[6] Liu B, Chen L, Li S, Song J, Xu X, Li M, et al. Three-dimensional seismic ahead-prospecting method and application in TBM tunneling. J Geotech Geoenviron. 2017a;143(12):04017090.10.1061/(ASCE)GT.1943-5606.0001785Search in Google Scholar
[7] Chen L, Zhang FK, Ren YX, Xu XJ, Yang ZC, Li M. Tunnel prospecting based on integrated interpretation of geophysical data: Xiangyun Tunnel, Yunnan Province, China. J Environ Eng Geoph. 2019;24(1):63–75.10.2113/JEEG24.1.63Search in Google Scholar
[8] Banks D, Rohr-Torp E, Skarphagen H. Groundwater resources in hard rock: experiences from the Hyvaler study, southeastern Norway. Appl Hydrogeol. 1994;2(2):33–42.10.1007/s100400050040Search in Google Scholar
[9] Mabee SB, Curry P, Hardcastle KC. Correlation of lineaments to ground water inflows in bedrock tunnel. Ground Water. 2002;40(1):37–43.10.1111/j.1745-6584.2002.tb02489.xSearch in Google Scholar PubMed
[10] Alimoradi A, Moradzadeh A, Naderi R, Saleha MZ, Etemadi A. Prediction of geological hazardous zones in front of a tunnel face using TSP-203 and artificial neural networks. Tunn Undergr Sp Tech. 2008;23(6):711–7.10.1016/j.tust.2008.01.001Search in Google Scholar
[11] Liu ZG, Liu XF. TSP application and development in tunnel lead forecast. Chinese J Rock Mech Eng. 2003;22(8):1399–402.Search in Google Scholar
[12] Otto R, Button EA, Bretterbner H, Schwab P. The application of TRT (true reflection tomography) at the underworld tunnel. Geophys. 2002;20(2):51–6.Search in Google Scholar
[13] Benecke N, Dombrowski BA, Lehmann B. Trust-exploration ahead of the tunnel face for reducing tunneling risks and supporting decision-making. World Tunnel Congress 2008: Underground Facilities for Better Environment and Safety. India; 2008. p. 1124–9.Search in Google Scholar
[14] Liu B, Chen L, Li SC, Xu XJ, Liu LB, Song J, et al. A new 3D observation system designed for a seismic ahead prospecting method in tunneling. B Eng Geol Environ. 2017b;6:1–19.10.1007/s10064-017-1131-3Search in Google Scholar
[15] Bellino A. Advanced methods for rock discontinuities estimation in tunneling. Doctoral Dissertation. Turin: Politecnico di Torino; 2013.Search in Google Scholar
[16] Yamamoto T, Shirasagi S, Yokota Y, Koizumi Y. Imaging geological conditions ahead of a tunnel face using three-dimensional seismic reflector tracing system. Int J JCRM. 2011;6:23–31.Search in Google Scholar
[17] Zhang JQ, Chen M, Cai JX, Ding LQ, Tan XJ. Application of comprehensive geophysical detection in construction of Wudongde Hydropower Station. Yangtze River. 2014;20:59–63.Search in Google Scholar
[18] Dong ZH, Niu XQ, Ding XL, Weng YH, Huang SL, Pei QT, et al. Deformation characteristics and feedback analysis of surrounding rock of underground powerhouse at left bank of Wudongde Hydropower Station. Rock Soil Mech. 2018;39:326–36.Search in Google Scholar
[19] Xue GQ, Li X, Di QY. The progress of TEM in theory and application. Prog Geophys. 2007;22(4):1195–200.Search in Google Scholar
[20] Singh A, Sharma SP, Akca I, Baran VC. Fuzzy constrained LP-norm inversion of direct current resistivity data. Geophys. 2017;83(1):1–56.10.1190/geo2017-0040.1Search in Google Scholar
© 2022 Senlin Yang et al., published by De Gruyter
This work is licensed under the Creative Commons Attribution 4.0 International License.
Articles in the same Issue
- Regular Articles
- Study on observation system of seismic forward prospecting in tunnel: A case on tailrace tunnel of Wudongde hydropower station
- The behaviour of stress variation in sandy soil
- Research on the current situation of rural tourism in southern Fujian in China after the COVID-19 epidemic
- Late Triassic–Early Jurassic paleogeomorphic characteristics and hydrocarbon potential of the Ordos Basin, China, a case of study of the Jiyuan area
- Application of X-ray fluorescence mapping in turbiditic sandstones, Huai Bo Khong Formation of Nam Pat Group, Thailand
- Fractal expression of soil particle-size distribution at the basin scale
- Study on the changes in vegetation structural coverage and its response mechanism to hydrology
- Spatial distribution analysis of seismic activity based on GMI, LMI, and LISA in China
- Rock mass structural surface trace extraction based on transfer learning
- Hydrochemical characteristics and D–O–Sr isotopes of groundwater and surface water in the northern Longzi county of southern Tibet (southwestern China)
- Insights into origins of the natural gas in the Lower Paleozoic of Ordos basin, China
- Research on comprehensive benefits and reasonable selection of marine resources development types
- Embedded deformation of the rubble-mound foundation of gravity-type quay walls and influence factors
- Activation of Ad Damm shear zone, western Saudi Arabian margin, and its relation to the Red Sea rift system
- A mathematical conjecture associates Martian TARs with sand ripples
- Study on spatio-temporal characteristics of earthquakes in southwest China based on z-value
- Sedimentary facies characterization of forced regression in the Pearl River Mouth basin
- High-precision remote sensing mapping of aeolian sand landforms based on deep learning algorithms
- Experimental study on reservoir characteristics and oil-bearing properties of Chang 7 lacustrine oil shale in Yan’an area, China
- Estimating the volume of the 1978 Rissa quick clay landslide in Central Norway using historical aerial imagery
- Spatial accessibility between commercial and ecological spaces: A case study in Beijing, China
- Curve number estimation using rainfall and runoff data from five catchments in Sudan
- Urban green service equity in Xiamen based on network analysis and concentration degree of resources
- Spatio-temporal analysis of East Asian seismic zones based on multifractal theory
- Delineation of structural lineaments of Southeast Nigeria using high resolution aeromagnetic data
- 3D marine controlled-source electromagnetic modeling using an edge-based finite element method with a block Krylov iterative solver
- A comprehensive evaluation method for topographic correction model of remote sensing image based on entropy weight method
- Quantitative discrimination of the influences of climate change and human activity on rocky desertification based on a novel feature space model
- Assessment of climatic conditions for tourism in Xinjiang, China
- Attractiveness index of national marine parks: A study on national marine parks in coastal areas of East China Sea
- Effect of brackish water irrigation on the movement of water and salt in salinized soil
- Mapping paddy rice and rice phenology with Sentinel-1 SAR time series using a unified dynamic programming framework
- Analyzing the characteristics of land use distribution in typical village transects at Chinese Loess Plateau based on topographical factors
- Management status and policy direction of submerged marine debris for improvement of port environment in Korea
- Influence of Three Gorges Dam on earthquakes based on GRACE gravity field
- Comparative study of estimating the Curie point depth and heat flow using potential magnetic data
- The spatial prediction and optimization of production-living-ecological space based on Markov–PLUS model: A case study of Yunnan Province
- Major, trace and platinum-group element geochemistry of harzburgites and chromitites from Fuchuan, China, and its geological significance
- Vertical distribution of STN and STP in watershed of loess hilly region
- Hyperspectral denoising based on the principal component low-rank tensor decomposition
- Evaluation of fractures using conventional and FMI logs, and 3D seismic interpretation in continental tight sandstone reservoir
- U–Pb zircon dating of the Paleoproterozoic khondalite series in the northeastern Helanshan region and its geological significance
- Quantitatively determine the dominant driving factors of the spatial-temporal changes of vegetation-impacts of global change and human activity
- Can cultural tourism resources become a development feature helping rural areas to revitalize the local economy under the epidemic? An exploration of the perspective of attractiveness, satisfaction, and willingness by the revisit of Hakka cultural tourism
- A 3D empirical model of standard compaction curve for Thailand shales: Porosity in function of burial depth and geological time
- Attribution identification of terrestrial ecosystem evolution in the Yellow River Basin
- An intelligent approach for reservoir quality evaluation in tight sandstone reservoir using gradient boosting decision tree algorithm
- Detection of sub-surface fractures based on filtering, modeling, and interpreting aeromagnetic data in the Deng Deng – Garga Sarali area, Eastern Cameroon
- Influence of heterogeneity on fluid property variations in carbonate reservoirs with multistage hydrocarbon accumulation: A case study of the Khasib formation, Cretaceous, AB oilfield, southern Iraq
- Designing teaching materials with disaster maps and evaluating its effectiveness for primary students
- Assessment of the bender element sensors to measure seismic wave velocity of soils in the physical model
- Appropriated protection time and region for Qinghai–Tibet Plateau grassland
- Identification of high-temperature targets in remote sensing based on correspondence analysis
- Influence of differential diagenesis on pore evolution of the sandy conglomerate reservoir in different structural units: A case study of the Upper Permian Wutonggou Formation in eastern Junggar Basin, NW China
- Planting in ecologically solidified soil and its use
- National and regional-scale landslide indicators and indexes: Applications in Italy
- Occurrence of yttrium in the Zhijin phosphorus deposit in Guizhou Province, China
- The response of Chudao’s beach to typhoon “Lekima” (No. 1909)
- Soil wind erosion resistance analysis for soft rock and sand compound soil: A case study for the Mu Us Sandy Land, China
- Investigation into the pore structures and CH4 adsorption capacities of clay minerals in coal reservoirs in the Yangquan Mining District, North China
- Overview of eco-environmental impact of Xiaolangdi Water Conservancy Hub on the Yellow River
- Response of extreme precipitation to climatic warming in the Weihe river basin, China and its mechanism
- Analysis of land use change on urban landscape patterns in Northwest China: A case study of Xi’an city
- Optimization of interpolation parameters based on statistical experiment
- Late Cretaceous adakitic intrusive rocks in the Laimailang area, Gangdese batholith: Implications for the Neo-Tethyan Ocean subduction
- Tectonic evolution of the Eocene–Oligocene Lushi Basin in the eastern Qinling belt, Central China: Insights from paleomagnetic constraints
- Geographic and cartographic inconsistency factors among different cropland classification datasets: A field validation case in Cambodia
- Distribution of large- and medium-scale loess landslides induced by the Haiyuan Earthquake in 1920 based on field investigation and interpretation of satellite images
- Numerical simulation of impact and entrainment behaviors of debris flow by using SPH–DEM–FEM coupling method
- Study on the evaluation method and application of logging irreducible water saturation in tight sandstone reservoirs
- Geochemical characteristics and genesis of natural gas in the Upper Triassic Xujiahe Formation in the Sichuan Basin
- Wehrlite xenoliths and petrogenetic implications, Hosséré Do Guessa volcano, Adamawa plateau, Cameroon
- Changes in landscape pattern and ecological service value as land use evolves in the Manas River Basin
- Spatial structure-preserving and conflict-avoiding methods for point settlement selection
- Fission characteristics of heavy metal intrusion into rocks based on hydrolysis
- Sequence stratigraphic filling model of the Cretaceous in the western Tabei Uplift, Tarim Basin, NW China
- Fractal analysis of structural characteristics and prospecting of the Luanchuan polymetallic mining district, China
- Spatial and temporal variations of vegetation coverage and their driving factors following gully control and land consolidation in Loess Plateau, China
- Assessing the tourist potential of cultural–historical spatial units of Serbia using comparative application of AHP and mathematical method
- Urban black and odorous water body mapping from Gaofen-2 images
- Geochronology and geochemistry of Early Cretaceous granitic plutons in northern Great Xing’an Range, NE China, and implications for geodynamic setting
- Spatial planning concept for flood prevention in the Kedurus River watershed
- Geophysical exploration and geological appraisal of the Siah Diq porphyry Cu–Au prospect: A recent discovery in the Chagai volcano magmatic arc, SW Pakistan
- Possibility of using the DInSAR method in the development of vertical crustal movements with Sentinel-1 data
- Using modified inverse distance weight and principal component analysis for spatial interpolation of foundation settlement based on geodetic observations
- Geochemical properties and heavy metal contents of carbonaceous rocks in the Pliocene siliciclastic rock sequence from southeastern Denizli-Turkey
- Study on water regime assessment and prediction of stream flow based on an improved RVA
- A new method to explore the abnormal space of urban hidden dangers under epidemic outbreak and its prevention and control: A case study of Jinan City
- Milankovitch cycles and the astronomical time scale of the Zhujiang Formation in the Baiyun Sag, Pearl River Mouth Basin, China
- Shear strength and meso-pore characteristic of saturated compacted loess
- Key point extraction method for spatial objects in high-resolution remote sensing images based on multi-hot cross-entropy loss
- Identifying driving factors of the runoff coefficient based on the geographic detector model in the upper reaches of Huaihe River Basin
- Study on rainfall early warning model for Xiangmi Lake slope based on unsaturated soil mechanics
- Extraction of mineralized indicator minerals using ensemble learning model optimized by SSA based on hyperspectral image
- Lithofacies discrimination using seismic anisotropic attributes from logging data in Muglad Basin, South Sudan
- Three-dimensional modeling of loose layers based on stratum development law
- Occurrence, sources, and potential risk of polycyclic aromatic hydrocarbons in southern Xinjiang, China
- Attribution analysis of different driving forces on vegetation and streamflow variation in the Jialing River Basin, China
- Slope characteristics of urban construction land and its correlation with ground slope in China
- Limitations of the Yang’s breaking wave force formula and its improvement under a wider range of breaker conditions
- The spatial-temporal pattern evolution and influencing factors of county-scale tourism efficiency in Xinjiang, China
- Evaluation and analysis of observed soil temperature data over Northwest China
- Agriculture and aquaculture land-use change prediction in five central coastal provinces of Vietnam using ANN, SVR, and SARIMA models
- Leaf color attributes of urban colored-leaf plants
- Application of statistical and machine learning techniques for landslide susceptibility mapping in the Himalayan road corridors
- Sediment provenance in the Northern South China Sea since the Late Miocene
- Drones applications for smart cities: Monitoring palm trees and street lights
- Double rupture event in the Tianshan Mountains: A case study of the 2021 Mw 5.3 Baicheng earthquake, NW China
- Review Article
- Mobile phone indoor scene features recognition localization method based on semantic constraint of building map location anchor
- Technical Note
- Experimental analysis on creep mechanics of unsaturated soil based on empirical model
- Rapid Communications
- A protocol for canopy cover monitoring on forest restoration projects using low-cost drones
- Landscape tree species recognition using RedEdge-MX: Suitability analysis of two different texture extraction forms under MLC and RF supervision
- Special Issue: Geoethics 2022 - Part I
- Geomorphological and hydrological heritage of Mt. Stara Planina in SE Serbia: From river protection initiative to potential geotouristic destination
- Geotourism and geoethics as support for rural development in the Knjaževac municipality, Serbia
- Modeling spa destination choice for leveraging hydrogeothermal potentials in Serbia