Landscape tree species recognition using RedEdge-MX: Suitability analysis of two different texture extraction forms under MLC and RF supervision
-
Huaipeng Liu
 ,
Xiaoyan Su
,
Xiaoyan Su

Abstract
The size of the texture extraction window impacts image tree species classification, and the determination of the optimal texture extraction window requires the supervision of a specific classifier for accuracy. Therefore, it is necessary to analyse which kind of classifier is more suitable and should be to choose. In this study, we extracted eight types of textures, namely mean, variance, homogeneity, contrast, dissimilarity, entropy, second moment and correlation, changed the window size by gradient increase and used maximum likelihood classification (MLC) and random forest (RF) to supervise and determine their optimal extraction windows, respectively. Finally, the optimised time consumption and classification accuracy for tree species classification was identified. The time consumption of MLC was significantly less than that of RF; however, neither was very long; for most textures, the optimal texture extraction window determined by MLC supervision was larger than that determined by RF supervision; in the classification of most feature sets, the overall accuracy obtained by MLC was less than that of RF. Because the time consumption of the texture extraction was much greater than that of the image classification, the comprehensive trade-off indicates that using RF supervision to determine the optimal window for texture extraction was more conducive to tree species recognition.
1 Introduction
Textures of remote sensing images are important features in tree species recognition. Using textures to classify tree species can significantly improve the classification accuracy compared with the use of other features such as spectral band and spectral index. When the textures are combined with these features, the accuracy of tree species classification will be improved more than using textures alone [1,2,3,4,5,6]. Textures play a very important role in tree species classification; however, extracting them with an inappropriate window size will affect tree species identification. When an undersized window is used, it will fail to fully exploit the textural arrangement of the tree species, whereas an oversized window will result in blurring of the tree species boundary [7]. Therefore, determining the optimal window size for texture extraction is very important.
To find the optimal window for texture extraction, scholars usually start with a small window, such as 3 × 3 and then gradually increase the window by odd numbers [3,8,9]. With the increase in extraction window, the recognition accuracy of the tree species also increases. After reaching a certain critical window, the recognition accuracy of the tree species no longer increases and decreases significantly. This critical window will be used as the optimal window for texture extraction [3,8,9]. The best texture feature set for tree species classification can be constructed by combining different types of textures extracted with their optimal windows [3,9,10,11]. In terms of optimal window selection for texture extraction, some scholars use the same window for all types of textures to obtain the same optimal window [3,7,8,10,11]. However, other scholars search for the optimal window for each type of texture [9,11]. The optimal texture feature sets obtained by the two forms generally have different classification accuracy in tree species recognition, and the optimal texture feature set constructed by searching the optimal windows for each type of texture will achieve slightly higher accuracy [11]. The supervisors used to determine the optimal window for texture extraction are mainly maximum likelihood classification (MLC) [3,10], support vector machine (SVM) [7,9] and random forest (RF) [8,11]. MLC and RF are less time consuming than SVM in model training and image classification.
In the current research of identifying tree species by remote sensing, we try to identify tree species using unmanned aerial vehicle (UAV) RedEdge-MX data because the sensor can obtain a digital surface model (DSM) image containing elevation information of the trees and a digital orthophoto map (DOM) image with five-band containing colour and texture information. We are also interested in understanding the effect of combining the DOM texture extracted under the optimal window with the DOM spectral bands and DSM. When determining the optimal window for texture extraction, scholars choose a single classifier to supervise, and there is no performance comparison between multiple classifiers. Therefore, it is not clear which classifier for supervising and determining the optimal window for texture extraction will be relatively small (because a small window means less time consumption), or which classifier supervising and determining the best texture feature set/mixed feature set will achieve a high tree species recognition accuracy.
This study uses the RedEdge-MX images as the data source to classify typical greening tree species and grass. Less time-consuming MLC and RF were used to supervise and determine the optimal extraction windows of eight types of textures commonly used in tree species recognition, namely mean (MEA), variance (VAR), homogeneity (HOM), contract (CON), dissimilarity (DIS), entropy (ENT), second moment (SM) and correlation (COR) [1,3,12]. The time consumption of texture extraction, model training, image classification and classification accuracy of the related data sets were comprehensively analysed to determine the classifier that should be used for optimal window selection during RedEdge-MX texture extraction. The study will provide basic information for the selection of suitable classifiers to determine the optimal window for texture extraction in tree species classification.
2 Materials and methods
2.1 Data and pre-processing
The data used in this study were taken by a UAV RedEdge-MX sensor that has five bands of blue, green, red, red edge and near infra-red, which can obtain high spatial resolution images [13]. The detailed parameters of the sensor obtained data are shown in Table 1. The location of the imaged site is the Luoyang Normal University of China. The imaging time was between 11:00 a.m. and 12:00 a.m. on 3 January 2020.
Band parameters of the UAV multispectral data
| Band number | Band name | Spatial resolution (cm) | Wavelength range (μm) | Central wavelength |
|---|---|---|---|---|
| 1 | Blue | 15.00 | 0.465–0.485 | 0.475 |
| 2 | Green | 0.550–0.570 | 0.560 | |
| 3 | Red | 0.663–0.673 | 0.668 | |
| 4 | Red edge | 0.712–0.722 | 0.717 | |
| 5 | Near infra-red | 0.820–0.860 | 0.840 |
After the data acquisition, basic pre-processing, such as image mosaic, band synthesis and image clipping, was performed. An image with a spatial resolution of 16.285 cm covering the whole campus of Luoyang Normal University, with an area of about 2.03 km2, was created. The false colour display effect of the image (RGB vs bands 532) is shown in Figure 1.

Location of the study area and distribution of the sample data.
2.2 Tree species investigation and sample collection
The pre-processed image was cut into two parts vertically from the middle and printed on two sheets of 104 cm × 60 cm and 106 cm × 60 cm papers. The paper images were created for the tree species investigation. We identified the trees corresponding to the paper images in the actual environment, circled the tree crown and recorded their names in the paper image. The results show that there are eight typical tree species that do not lose their leaves in winter. The photos are shown in Figure 2a–h.
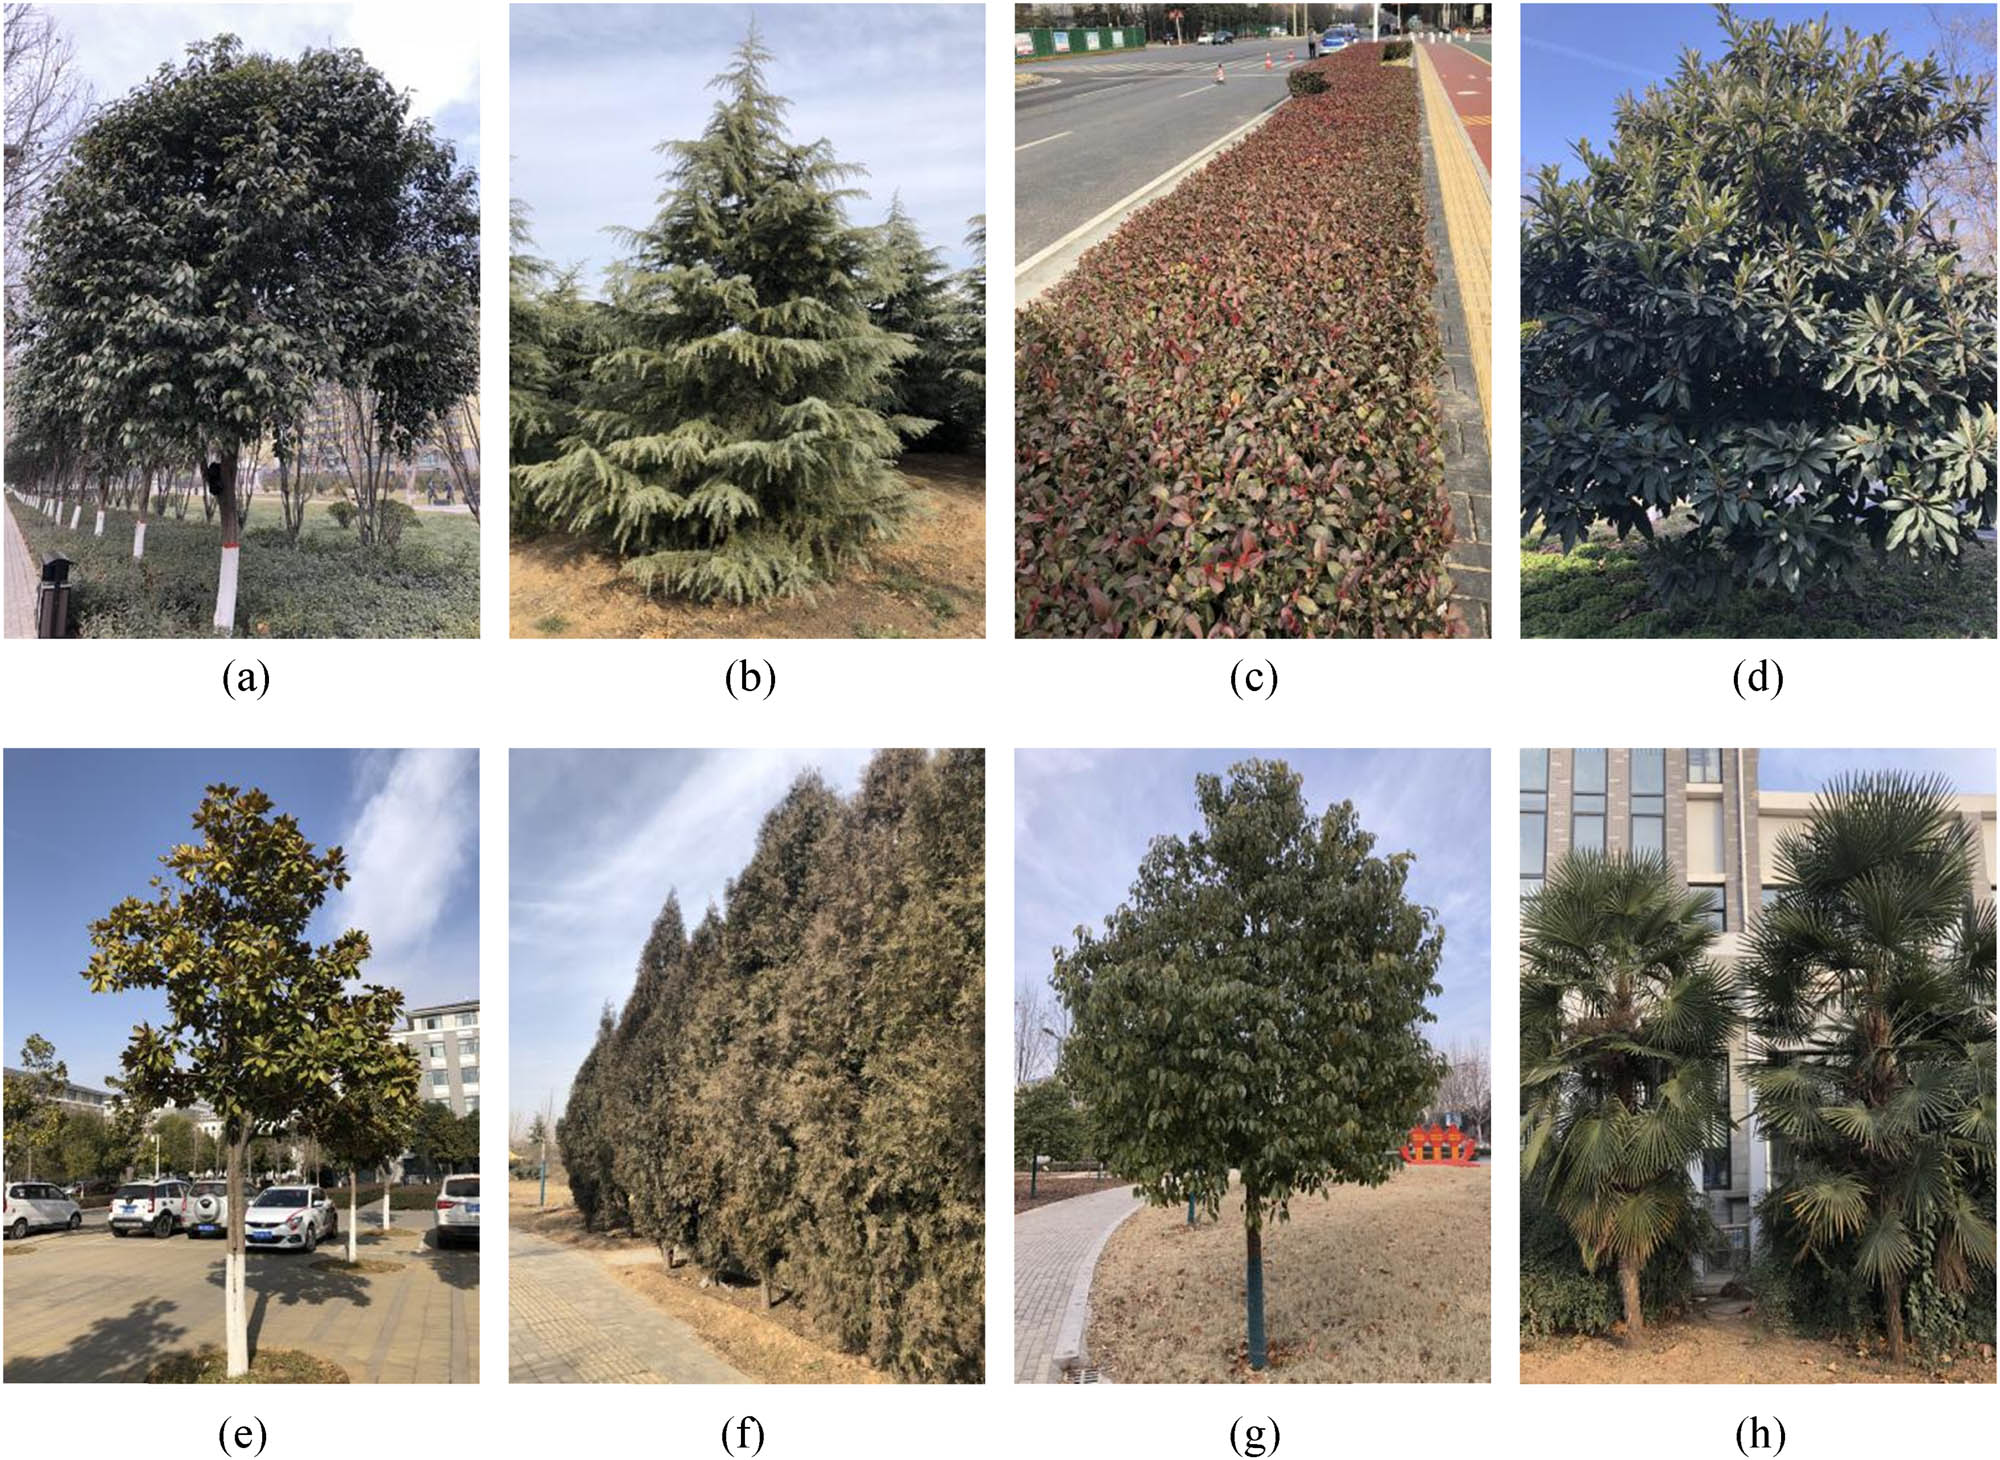
Images of eight kinds of tree species that were captured on 2 January 2021. (a) Ligustrum lucidum, (b) Cedrus deodara, (c) Ligustrum lucidum, (d) Eriobotrya japonica, (e) Magnolia grandiflora, (f) Platycladus orientalis, (g) Cinnamomum camphora and (h) Trachycarpus fortune.
After the investigation, we marked the tree species that were recorded in the paper image on the electronic image in the form of a region of interest, and parts of the tree were used as training samples (TSs), and other parts were used as precision validation samples. Detailed information on the surveyed tree species and pixels of training and validation samples are shown in Table 2.
Surveyed tree species and pixel samples
| Latin names | Leaf type and phenology | Pixel number of TS | Precision validation pixels |
|---|---|---|---|
| Ligustrum lucidum | Evergreen broad-leaf tree | 993 | 4,491 |
| Cedrus deodara | Evergreen conifer | 996 | 4,591 |
| Photinia serrulata | Evergreen broad-leaf tree | 971 | 4,535 |
| Eriobotrya japonica | Evergreen broad-leaf tree | 991 | 4,589 |
| Magnolia grandiflora | Evergreen broad-leaf tree | 922 | 4,632 |
| Platycladus orientalis | Evergreen conifer | 996 | 4,483 |
| Cinnamomum camphora | Evergreen broad-leaf tree | 994 | 4,522 |
| Trachycarpus fortunei | Evergreen broad-leaf tree | 978 | 3,896 |
| Grass | — | 990 | 4,535 |
2.3 Extraction of vegetation from image
The DSM threshold of [133, 187.89] was used to initially mask the buildings and extract the building contour lines. The lines were then imported to MapGIS, and mismatched places were modified to make the vector lines more consistent with the building boundaries. The updated building contour lines were then used to build a mask, and the buildings were masked. Third, the generated mask file was used to mask the normalised difference vegetation index (NDVI) image, then edge-based segmentation was performed on the masked NDVI images (the best scale is 60.2), and a full Lambda schedule was used to merge (the best scale is 99) the segment patches. Finally, the object-oriented rule-based method was used, the threshold [0.11664, 0.63974] was set to extract the vegetation in the image and the vegetation parts were retained.
2.4 Determination of the optimal window for texture extraction
2.4.1 Texture images generation
The co-occurrence measures of the ENVI 5.4 software were used to extract the eight textures that are often used in tree species classification. The textures are MEA, VAR, HOM, CON, DIS, ENT, SM and COR. The window size for texture extraction starts from 3 × 3 and increases with odd gradients. The eight types of texture images were then generated from the 5-band RedEdge-MX data. Textures of the same type extracted under different window sizes would be used one by one for subsequent tree species classification.
2.4.2 Selection of the TS size
The size of the TS may affect the time and accuracy of image classification by different classifiers, as well as the size of the optimal window for texture extraction. Therefore, we randomly selected nine times from the TS in the form of gradient increasing by 10% to form nine subsets of 10–90% TS. These TS subsets were then used to classify the DOM image, and the time consumption and accuracy of the classifiers were analysed. According to the experimental results, two typical samples that cause a large difference in time consumption or classification accuracy were selected for the TS to determine the optimal window for texture extraction. The influence of the sample size on the determination of the optimal window for texture extraction and differences between different classifiers were further analysed.
2.4.3 Supervision of the optimal window selection
When a texture was extracted under a specific window, based on the extracted texture, MLC or RF [14] was used to classify the tree species, and the overall accuracy (OA) was recorded. With a larger texture extraction window, the OA generally increased as well. When the texture extraction window increased, the extracted texture was used to classify the tree species; the obtained OA was no longer improved and instead decreased significantly. We then stopped using a larger window to extract the texture and determined the texture extraction window corresponding to the maximum OA as the optimal window for this texture extraction. We determined the optimal extraction windows for different types of textures, classifiers and TS sizes using the same approach.
2.5 Analysis of the suitable classifier for optimal window determination
Two types of TSs with the largest difference in time consumption or classification accuracy were used as m × 10% TS and n × 10% TS (m and n are coefficients of the TS size; the values of m and n are between 2–10 and 1–9, respectively; m is greater than n). The best texture feature sets determined by MLC under the large and small TSs were recorded as TexM-m × 10% TS and TexM-n × 10% TS, respectively, and the two types of optimal feature sets determined by RF supervision were recorded as TexR-m × 10% TS and TexR-n × 10% TS, respectively. Large and small TS to classifying tree species based on the best texture feature sets and mixed feature sets were formed by combining them with DOM and DSM, and the difference in accuracy obtained by the two classifiers was analysed. Combining the time consumption of the two classifiers in model training, image classification and supervision for texture extraction, the supervised classifier that is more suitable for RedEdge-MX texture extraction in the tree species classification was determined.
3 Results
3.1 Classification analysis of different sample sizes
Under different TS sizes, the time consumption and OA obtained by the two classifiers for DOM image processing are shown in Table 3.
Time consumption and classification OA obtained by the two classifiers under different TS gradients
| Proportion of TS (%) | MLC | RF | |||
|---|---|---|---|---|---|
| Classification time (minute:second) | OA% | Training time (minute:second) | Classification time (minute:second) | OA% | |
| 10 | 0:34 | 60.87 | 0:13 | 4:52 | 59.53 |
| 20 | 0:33 | 62.53 | 0:21 | 5:19 | 63.42 |
| 30 | 0:33 | 61.95 | 0:30 | 5:22 | 65.29 |
| 40 | 0:33 | 63.27 | 0:38 | 5:38 | 64.50 |
| 50 | 0:33 | 62.59 | 0:47 | 5:37 | 65.83 |
| 60 | 0:32 | 62.02 | 0:56 | 5:47 | 66.65 |
| 70 | 0:33 | 62.55 | 1:05 | 5:46 | 67.16 |
| 80 | 0:33 | 62.69 | 1:15 | 5:50 | 66.94 |
| 90 | 0:33 | 62.57 | 1:23 | 5:59 | 67.32 |
| 100 | 0:33 | 62.61 | 1:33 | 6:00 | 67.77 |
As shown in Table 3, for MLC, the time consumption of DOM image classification was relatively stable at different sample scales. However, the OA obtained at 10% TS scale was slightly less than, though not significantly, values obtained at other scales. However, for RF, with the increase in TS size, the time consumption of model training and image classification shows an increasing trend, and the OA of classification results also shows an increasing trend. The large and small TSs were 100% TS and 10% TS, respectively (m and n are 10 and 1, respectively).
3.2 Best texture extraction window analysis
With the increase in different types of texture extraction windows, the OA changes in tree species classification using MLC and RF at two sizes of TSs are shown in Figures 3 and 4, respectively.

OA of tree species classification obtained using eight textures under different extraction windows at two training sizes, MLC based.

OA of tree species classification obtained based on RF using eight textures under different extraction windows at the two training sizes.
As shown in Figure 3, eight types of textures have different optimal texture extraction windows in tree species classification using TS. The optimal extraction window for some texture features were small (e.g. 9 × 9 for MEA) and for some texture features were large (e.g. 45 × 45 for HOM). There were obvious differences in the size of the optimal extraction window for different textures. The maximum OA obtained by each type of texture feature was different. The highest OA (68.50%) was obtained using MEA, and the lowest classification accuracy (37.36%) was obtained using COR, and the OA of other types of texture features was among these two OA.
Although the OA obtained using 10% TS in most classifications under different window scales was less than that of the TS used, the change rule of the OA obtained using the 10% TS in the texture extraction window changes was similar to that of the TS used.
As shown in Figure 4, TS based on RF, the optimal texture extraction window for eight types of texture was also different (except ENT and SM), and the OA obtained by these textures with optimal extraction window was also different. When 10% TS was used to determine the optimal texture extraction window, the variation trend of OA obtained by various textures was generally consistent with that from TS. However, in almost all windows, the OA obtained with 10% TS was significantly less than that obtained with TS.
Based on MLC and RF, under two different scales of TS used, the optimal window for eight types of texture extraction and the corresponding OA obtained under these optimal windows are shown in Table 4.
Optimal extraction window of eight textures under two TSs with different pixels
| Texture type | MLC | RF | ||||||
|---|---|---|---|---|---|---|---|---|
| TS | OA% | 10% TS | OA% | TS | OA% | 10% TS | OA% | |
| MEA | 9 × 9 | 68.50 | 9 × 9 | 67.21 | 5 × 5 | 73.14 | 9 × 9 | 65.11 |
| VAR | 33 × 33 | 48.98 | 35 × 35 | 49.36 | 21 × 21 | 69.15 | 21 × 21 | 59.94 |
| HOM | 47 × 47 | 56.27 | 47 × 47 | 55.75 | 45 × 45 | 63.82 | 47 × 47 | 58.13 |
| CON | 37 × 37 | 46.43 | 39 × 39 | 45.28 | 15 × 15 | 64.21 | 15 × 15 | 55.14 |
| DIS | 27 × 27 | 54.91 | 29 × 29 | 54.92 | 23 × 23 | 62.61 | 27 × 27 | 56.59 |
| ENT | 23 × 23 | 54.91 | 23 × 23 | 55.06 | 25 × 25 | 64.76 | 25 × 25 | 57.79 |
| SM | 33 × 33 | 43.79 | 29 × 29 | 42.80 | 25 × 25 | 60.48 | 21 × 21 | 54.03 |
| COR | 15 × 15 | 37.36 | 11 × 11 | 36.14 | 27 × 27 | 67.67 | 31 × 31 | 59.54 |
As shown in Table 4, with the exception of a few types of textures (SM and COR for MLC, SM for RF), the optimal extraction windows for the other textures obtained with 10% TS were not smaller than those obtained with TS, whether based on MLC or RF. The best texture feature set for tree species classification using 10% TS may require a large window to extract texture features.
In addition, using MLC and RF to obtain the optimal extraction window (used TS) for eight types of texture in tree species classification also has many differences. First, different classifiers in the optimal window of the same texture were different. The optimal extraction window of MEA, VAR, HOM, CON, DIS and SM using MLC was larger than that used for RF; however, the ENT and COR was smaller than that of the RF. Using the same texture for tree species classification, the OA achieved by MLC was less than that of RF. The importance ranking (according to OA) of the eight types of textures determined by the MLC was: MEA, HOM, DIS, ENT, VAR, CON, SM and COR. However, the order based on RF was: MEA, VAR, COR, ENT, CON, HOM, DIS and SM.
3.3 Optimal feature set combined with other features
After texture feature sets of TexM-TS, TexM-10% TS, TexR-TS and TexR-10% TS were constructed, they were used and combined with DOM and DSM for tree species classification. The OA of these classifications is shown in Table 5.
OA statistics of the best texture feature set and their combination with DOM and DSM in tree species classification under different training size samples
| Supervision form | Data sets | MLC | RF | ||
|---|---|---|---|---|---|
| TS | 10% TS | TS | 10% TS | ||
| — | DOM | 62.6061 | 60.8681 | 67.7733 | 59.5322 |
| DOM + DSM | 68.2103 | 67.4331 | 75.9150 | 65.7918 | |
| MLC | TexM-TS | 80.6724 | 70.5790 | 81.3751 | 74.9094 |
| TexM-10% TS | 79.5675 | 69.2581 | 82.0902 | 75.6021 | |
| TexM-TS + DOM + DSM | 83.8904 | 76.5332 | 83.6992 | 74.9839 | |
| TexM-10% TS + DOM + DSM | 82.7854 | 76.8312 | 83.8879 | 75.7809 | |
| RF | TexR-TS | 77.7623 | 69.1861 | 81.8915 | 74.5369 |
| TexR-10% TS | 79.0460 | 70.5790 | 82.0058 | 75.8877 | |
| TexR + DOM + DSM | 81.3329 | 73.9062 | 83.1206 | 76.2576 | |
| TexR-10% TS + DOM + DSM | 82.1051 | 75.1006 | 83.4161 | 76.8362 | |
As shown in Table 5, the classification accuracy of the tree species based on the four texture feature sets was greater than that of DOM, and the combination of DOM and DSM, regardless of whether it used MLC or RF for classifying. Therefore, the best extraction window to construct texture feature sets plays a very important role in tree species classification. In particular, in all datasets using TS for tree species classification, the obtained OA was greater than that of 10% TS, whether based on MLC or RF. The best texture feature sets and mixed feature sets constructed using 10% TS supervision achieved better accuracy than those constructed using TS. Whether it was the best texture feature sets or mixed feature sets constructed by MLC or RF supervision, in general, RF would achieve better accuracy than MLC; however, TexM-TS + DOM + DSM, MLC achieved relatively better accuracy than RF.
Overall, using the supervision form of MLC with large TS to determine the optimal texture extraction window and construct the best texture feature set, the mixed feature set for tree species classification was a good approach, where both MLC (83.8904%) and RF (83.6992%) achieved a high OA. In the supervision form of RF with large TS to determine the optimal texture extraction window and construct the best texture feature set, a mixed feature set for tree species classification is also a good approach; it does not achieve much lower accuracy than that obtained by MLC.
3.4 Confusion matrix of the optimal classification results
Based on the mixed feature sets of RedEdge-MX UAV images, the classification of eight tree species and grass using MLC produced the best results, and the confusion matrix of the best result is shown in Table 6.
Confusion matrix of the optimal classification result
| Type | Ligustrum lucidum | Cedrus deodara | Photinia serrulata | Eriobotrya japonica | Magnolia grandiflora | Platycladus orientalis | Cinnamomum camphora | Trachycarpus fortunei | Grass |
|---|---|---|---|---|---|---|---|---|---|
| Ligustrum lucidum | 3,880 | 39 | 181 | 77 | 607 | 272 | 552 | 26 | 168 |
| Cedrus deodara | 17 | 4,233 | 59 | 236 | 13 | 260 | 55 | 54 | 66 |
| Photinia serrulata | 178 | 42 | 4,055 | 561 | 584 | 416 | 77 | 100 | 44 |
| Eriobotrya japonica | 5 | 231 | 11 | 3,581 | 263 | 0 | 7 | 21 | 1 |
| Magnolia grandiflora | 36 | 0 | 21 | 12 | 3,030 | 106 | 0 | 95 | 0 |
| Platycladus orientalis | 0 | 0 | 0 | 0 | 3 | 3,415 | 3 | 0 | 0 |
| Cinnamomum camphora | 345 | 20 | 91 | 24 | 22 | 14 | 3,828 | 2 | 44 |
| Trachycarpus fortunei | 12 | 23 | 69 | 86 | 110 | 0 | 0 | 3,598 | 46 |
| Grass | 18 | 3 | 48 | 12 | 0 | 0 | 0 | 0 | 4,166 |
| Total column | 4,491 | 4,591 | 4,535 | 4,589 | 4,632 | 4,483 | 4,522 | 3,896 | 4,535 |
| Total row | 5,802 | 4,993 | 6,057 | 4,120 | 3,300 | 3,421 | 4,390 | 3,944 | 4,247 |
| Producer accuracy (%) | 86.40 | 92.20 | 89.42 | 78.03 | 65.41 | 76.18 | 84.65 | 92.35 | 91.86 |
| User accuracy (%) | 66.87 | 84.78 | 66.95 | 86.92 | 91.82 | 99.82 | 87.20 | 91.23 | 98.09 |
Overall accuracy = (33,786/40,274) = 83.8904%, Kappa coefficient = 0.8187.
As shown in Table 6, the producer accuracy of the tree species recognition ranged from 65.41% (Magnolia grandiflora) to 92.35% (Trachycarpus fortunei). Furthermore, the user accuracy of the tree species recognition ranged from 66.87% (Ligustrum lucidum) to 99.82% (Platycladus orientalis). Large differences among the various tree species were observed in producer accuracies and user accuracies. Large differences were observed between the producer and user accuracies for the same tree species (e.g. L. lucidum, Photinia serrulata, M. grandiflora and P. orientalis). The classification effect of the whole image was not particularly ideal in this group of features.
3.5 Image of the best classification results
Under the optimal feature combination, the landscape tree species classification results of the whole RedEdge-MX image are shown in Figure 5.

Classification map of the best feature combination.
As shown in Figure 5, the grassland area on the campus is relatively large and well-identified. The landscape tree species L. lucidum is mainly distributed on the side of the road, and it had a good recognition effect. P. serrulata is distributed on the edge of the grass and is planted individually in blocks on the campus, which can also be well-identified. In addition to scattered distribution in the campus, Cedrus deodara is planted in a large area in the south of the campus, which can be detected effectively. Eriobotrya japonica, M. grandiflora, P. orientalis, Cinnamomum camphora and T. fortunei are scattered on the campus and can also be effectively detected.
4 Discussion and conclusions
The number of pixels in a TS has little or no impact on the time consumption and accuracy of MLC; however, it has a great impact on RF. With the increased number of pixels in the TS, the training time and classification time of RF were continually increased, and the sum of the training and classification time was more than ten times the MLC. However, with the increase in pixel content of the TS, the accuracy of the RF classification also increased, which was significantly greater than that of MLC. In terms of time consumption, in the face of sample changes, MLC is better than RF. However, in terms of classification accuracy, RF is better than MLC.
In texture feature extraction, using a large window is more time consuming than using a small window. For example, it takes more than 10 h to extract a 5-band HOM under a 47 × 47 window and approximately 0.5 h under a 3 × 3 window. In this study, for most types of textures, the optimal windows for texture extraction found with small TS were larger than with large TS. Using small TS to find the optimal window for texture extraction takes more time than using large TS, which means that the search for the optimal window should be done with large TS.
In tree species classification based on the best texture feature sets and mixed feature sets, although the MLC obtains slightly better accuracy than RF in the classification of TexM-TS + DOM + DSM, the accuracy of RF classification is better than the MLC for most data sets. In addition, the optimal window of texture extraction found by MLC supervision is larger than that by RF supervision. Although the time consumption of MLC in image classification is smaller than that of RF, the texture extraction is longer than that of RF. Overall, RF is more time-efficient. Therefore, considering the impact of the TS scale, the time consumption of the texture extraction and training/classification and classification accuracy of the datasets, the RF should be more suitable for determining the optimal window of texture extraction in tree species classification based on RedEdge-MX data.
When using the two classifiers to supervise and determine the optimal window for texture extraction, we only used the data of one period, which may not be representative. In addition, because of the large amount of calculation, there is a lack of testing of larger windows and repeated experiments. These are shortcomings of this study. In future research, we will improve the experimental design and further clarify the use of a suitable classifier to determine the optimal window for texture extraction.
To analyse whether the RedEdge-MX image is suitable for MLC or RF to supervise and determine the optimal window for texture extraction, the data first acquired on 3 January 2020 were used as an example to classify eight tree species and grass using two TS of different sizes and to evaluate the use of appropriate supervisors from the aspects of time consumption and classification accuracy. The size of the TS had little effect on the time consumption and accuracy of MLC; however, it had a greater impact on RF. The large-size TS increased the time consumption and classification accuracy of RF; the optimal window for texture extraction obtained using a small TS was larger than that obtained with a large TS. Under MLC supervision, the optimal window for texture extraction is generally larger than that under RF supervision. The classification accuracy of RF in most feature sets was greater than that of MLC, and the determination of the best window for RedEdge-MX texture extraction should be conducted by RF.
Acknowledgments
We want to provide our gratitude to the editors and the anonymous reviewers.
-
Funding information: This work was supported by the Natural Science Foundation of Henan Province (Grant No. 202300410293), the National Nature Science Foundation of China (Grant Nos. 32001250 and 42071198) and the Scientific and Technological Project of Henan Province (Grant No. 212102310433).
-
Author contributions: Huaipeng Liu: investigation, methods, visualization, results analysis, writing – original draft, project administration; Xiaoyan Su, Chuancai Zhang and Huijun An: investigation, resources.
-
Conflict of interest: The authors state that they have no conflict of interest.
-
Data availability statement: The datasets produced for this study are available from the corresponding author on reasonable request.
References
[1] Ghosh A, Joshi PK. A comparison of selected classification algorithms for mapping bamboo patches in lower Gangetic plains using very high resolution WorldView 2 imagery. Int J Appl Earth Obs Geoinf. 2014;26:298–311. 10.1016/j.jag.2013.08.011.Search in Google Scholar
[2] Dian Y, Li Z, Pang Y. Spectral and texture features combined for forest tree species classification with airborne hyperspectral imagery. J Indian Soc Remote Sens. 2015;43(1):101–7. 10.1007/s12524-014-0392-6.Search in Google Scholar
[3] Liu HP, An HJ, Wang B, Zhang QL. Tree species classification using WorldView-2 images based on recursive texture feature elimination. J Beijing Univ. 2015;37(8):53–9 (in Chinese with English abstract). 10.13332/j.1000-1522.20140311.Search in Google Scholar
[4] Gini R, Sona G, Ronchetti G, Passoni D, Pinto L. Improving tree species classification using UAS multispectral images and texture measures. ISPRS Int J Geo-Inf. 2018;7(8):315. 10.3390/ijgi7080315.Search in Google Scholar
[5] Ferreira MP, Wagner FH, Arago LEOC, Shimabukuro YES, Filho CRDS. Tree species classification in tropical forests using visible to shortwave infrared worldview-3 images and texture analysis. ISPRS J Photogramm Remote Sens. 2019;149:119–31. 10.1016/j.isprsjprs.2019.01.019.Search in Google Scholar
[6] Tian XM, Chen L, Zhang XL. Classifying tree species in the plantations of southern china based on wavelet analysis and mathematical morphology. Comput Geosci. 2021;151:104757. 10.1016/j.cageo.2021.104757.Search in Google Scholar
[7] Wang T, Zhang H, Lin H, Fang C. Textural-spectral feature-based species classification of mangroves in mai po nature reserve from Worldview-3 imagery. Remote Sens. 2015;8(1):24. 10.3390/rs8010024.Search in Google Scholar
[8] Wang X, Wang Y, Zhou C, Yin L, Feng X. Urban forest monitoring based on multiple features at the single tree scale by uav. Urban Urban Green. 2020;58:126958. 10.1016/j.ufug.2020.126958.Search in Google Scholar
[9] Wu YS, Zhang XL. Object-oriented tree species classification with multi-scale texture features based on airborne hyperspectral images. J Beijing Univ. 2020;42(6):91–101 (in Chinese with English abstract).10.12171/j.1000−1522.20190155.Search in Google Scholar
[10] Wang N, Peng SK, Li MS. High-resolution remote sensing of textural images for tree species classification. J Zhejiang A&F Univ. 2012;29(2):210–7 (in Chinese with English abstract). 10.11833/j.issn.2095-0756.2012.02.010.Search in Google Scholar
[11] Liu H, Su X, An H. Typical landscape tree species recognition based on RedEdge-MX: suitability analysis of two texture extraction forms under random forest supervision. Pol J Env Stud. 2022;31(2):1475–84. 10.15244/pjoes/141815.Search in Google Scholar
[12] Shi YF, Wang TJ, Skidmore AK, Heurich M. Improving LiDAR-based tree species mapping in Central European mixed forests using multi-temporal digital aerial colour-infrared photographs. Int J Appl Earth Obs Geoinf. 2020;84:101197. 10.1016/j.jag.2019.101970.Search in Google Scholar
[13] Agarwal A, Kumar S, Singh D. An adaptive technique to detect and remove shadow from drone data. J Indian Soc Remote Sens. 2021;49:491–8. 10.1007/s12524-020-01227-z.Search in Google Scholar
[14] Van der Linden S, Rabe A, Held M, Jakimow B, Leitão PJ, Okujeni A, et al. The EnMAP-Box—A toolbox and application programming interface for EnMAP data processing. Remote Sens. 2015;7(9):11249–66. 10.3390/rs70911249.Search in Google Scholar
© 2022 Huaipeng Liu et al., published by De Gruyter
This work is licensed under the Creative Commons Attribution 4.0 International License.
Articles in the same Issue
- Regular Articles
- Study on observation system of seismic forward prospecting in tunnel: A case on tailrace tunnel of Wudongde hydropower station
- The behaviour of stress variation in sandy soil
- Research on the current situation of rural tourism in southern Fujian in China after the COVID-19 epidemic
- Late Triassic–Early Jurassic paleogeomorphic characteristics and hydrocarbon potential of the Ordos Basin, China, a case of study of the Jiyuan area
- Application of X-ray fluorescence mapping in turbiditic sandstones, Huai Bo Khong Formation of Nam Pat Group, Thailand
- Fractal expression of soil particle-size distribution at the basin scale
- Study on the changes in vegetation structural coverage and its response mechanism to hydrology
- Spatial distribution analysis of seismic activity based on GMI, LMI, and LISA in China
- Rock mass structural surface trace extraction based on transfer learning
- Hydrochemical characteristics and D–O–Sr isotopes of groundwater and surface water in the northern Longzi county of southern Tibet (southwestern China)
- Insights into origins of the natural gas in the Lower Paleozoic of Ordos basin, China
- Research on comprehensive benefits and reasonable selection of marine resources development types
- Embedded deformation of the rubble-mound foundation of gravity-type quay walls and influence factors
- Activation of Ad Damm shear zone, western Saudi Arabian margin, and its relation to the Red Sea rift system
- A mathematical conjecture associates Martian TARs with sand ripples
- Study on spatio-temporal characteristics of earthquakes in southwest China based on z-value
- Sedimentary facies characterization of forced regression in the Pearl River Mouth basin
- High-precision remote sensing mapping of aeolian sand landforms based on deep learning algorithms
- Experimental study on reservoir characteristics and oil-bearing properties of Chang 7 lacustrine oil shale in Yan’an area, China
- Estimating the volume of the 1978 Rissa quick clay landslide in Central Norway using historical aerial imagery
- Spatial accessibility between commercial and ecological spaces: A case study in Beijing, China
- Curve number estimation using rainfall and runoff data from five catchments in Sudan
- Urban green service equity in Xiamen based on network analysis and concentration degree of resources
- Spatio-temporal analysis of East Asian seismic zones based on multifractal theory
- Delineation of structural lineaments of Southeast Nigeria using high resolution aeromagnetic data
- 3D marine controlled-source electromagnetic modeling using an edge-based finite element method with a block Krylov iterative solver
- A comprehensive evaluation method for topographic correction model of remote sensing image based on entropy weight method
- Quantitative discrimination of the influences of climate change and human activity on rocky desertification based on a novel feature space model
- Assessment of climatic conditions for tourism in Xinjiang, China
- Attractiveness index of national marine parks: A study on national marine parks in coastal areas of East China Sea
- Effect of brackish water irrigation on the movement of water and salt in salinized soil
- Mapping paddy rice and rice phenology with Sentinel-1 SAR time series using a unified dynamic programming framework
- Analyzing the characteristics of land use distribution in typical village transects at Chinese Loess Plateau based on topographical factors
- Management status and policy direction of submerged marine debris for improvement of port environment in Korea
- Influence of Three Gorges Dam on earthquakes based on GRACE gravity field
- Comparative study of estimating the Curie point depth and heat flow using potential magnetic data
- The spatial prediction and optimization of production-living-ecological space based on Markov–PLUS model: A case study of Yunnan Province
- Major, trace and platinum-group element geochemistry of harzburgites and chromitites from Fuchuan, China, and its geological significance
- Vertical distribution of STN and STP in watershed of loess hilly region
- Hyperspectral denoising based on the principal component low-rank tensor decomposition
- Evaluation of fractures using conventional and FMI logs, and 3D seismic interpretation in continental tight sandstone reservoir
- U–Pb zircon dating of the Paleoproterozoic khondalite series in the northeastern Helanshan region and its geological significance
- Quantitatively determine the dominant driving factors of the spatial-temporal changes of vegetation-impacts of global change and human activity
- Can cultural tourism resources become a development feature helping rural areas to revitalize the local economy under the epidemic? An exploration of the perspective of attractiveness, satisfaction, and willingness by the revisit of Hakka cultural tourism
- A 3D empirical model of standard compaction curve for Thailand shales: Porosity in function of burial depth and geological time
- Attribution identification of terrestrial ecosystem evolution in the Yellow River Basin
- An intelligent approach for reservoir quality evaluation in tight sandstone reservoir using gradient boosting decision tree algorithm
- Detection of sub-surface fractures based on filtering, modeling, and interpreting aeromagnetic data in the Deng Deng – Garga Sarali area, Eastern Cameroon
- Influence of heterogeneity on fluid property variations in carbonate reservoirs with multistage hydrocarbon accumulation: A case study of the Khasib formation, Cretaceous, AB oilfield, southern Iraq
- Designing teaching materials with disaster maps and evaluating its effectiveness for primary students
- Assessment of the bender element sensors to measure seismic wave velocity of soils in the physical model
- Appropriated protection time and region for Qinghai–Tibet Plateau grassland
- Identification of high-temperature targets in remote sensing based on correspondence analysis
- Influence of differential diagenesis on pore evolution of the sandy conglomerate reservoir in different structural units: A case study of the Upper Permian Wutonggou Formation in eastern Junggar Basin, NW China
- Planting in ecologically solidified soil and its use
- National and regional-scale landslide indicators and indexes: Applications in Italy
- Occurrence of yttrium in the Zhijin phosphorus deposit in Guizhou Province, China
- The response of Chudao’s beach to typhoon “Lekima” (No. 1909)
- Soil wind erosion resistance analysis for soft rock and sand compound soil: A case study for the Mu Us Sandy Land, China
- Investigation into the pore structures and CH4 adsorption capacities of clay minerals in coal reservoirs in the Yangquan Mining District, North China
- Overview of eco-environmental impact of Xiaolangdi Water Conservancy Hub on the Yellow River
- Response of extreme precipitation to climatic warming in the Weihe river basin, China and its mechanism
- Analysis of land use change on urban landscape patterns in Northwest China: A case study of Xi’an city
- Optimization of interpolation parameters based on statistical experiment
- Late Cretaceous adakitic intrusive rocks in the Laimailang area, Gangdese batholith: Implications for the Neo-Tethyan Ocean subduction
- Tectonic evolution of the Eocene–Oligocene Lushi Basin in the eastern Qinling belt, Central China: Insights from paleomagnetic constraints
- Geographic and cartographic inconsistency factors among different cropland classification datasets: A field validation case in Cambodia
- Distribution of large- and medium-scale loess landslides induced by the Haiyuan Earthquake in 1920 based on field investigation and interpretation of satellite images
- Numerical simulation of impact and entrainment behaviors of debris flow by using SPH–DEM–FEM coupling method
- Study on the evaluation method and application of logging irreducible water saturation in tight sandstone reservoirs
- Geochemical characteristics and genesis of natural gas in the Upper Triassic Xujiahe Formation in the Sichuan Basin
- Wehrlite xenoliths and petrogenetic implications, Hosséré Do Guessa volcano, Adamawa plateau, Cameroon
- Changes in landscape pattern and ecological service value as land use evolves in the Manas River Basin
- Spatial structure-preserving and conflict-avoiding methods for point settlement selection
- Fission characteristics of heavy metal intrusion into rocks based on hydrolysis
- Sequence stratigraphic filling model of the Cretaceous in the western Tabei Uplift, Tarim Basin, NW China
- Fractal analysis of structural characteristics and prospecting of the Luanchuan polymetallic mining district, China
- Spatial and temporal variations of vegetation coverage and their driving factors following gully control and land consolidation in Loess Plateau, China
- Assessing the tourist potential of cultural–historical spatial units of Serbia using comparative application of AHP and mathematical method
- Urban black and odorous water body mapping from Gaofen-2 images
- Geochronology and geochemistry of Early Cretaceous granitic plutons in northern Great Xing’an Range, NE China, and implications for geodynamic setting
- Spatial planning concept for flood prevention in the Kedurus River watershed
- Geophysical exploration and geological appraisal of the Siah Diq porphyry Cu–Au prospect: A recent discovery in the Chagai volcano magmatic arc, SW Pakistan
- Possibility of using the DInSAR method in the development of vertical crustal movements with Sentinel-1 data
- Using modified inverse distance weight and principal component analysis for spatial interpolation of foundation settlement based on geodetic observations
- Geochemical properties and heavy metal contents of carbonaceous rocks in the Pliocene siliciclastic rock sequence from southeastern Denizli-Turkey
- Study on water regime assessment and prediction of stream flow based on an improved RVA
- A new method to explore the abnormal space of urban hidden dangers under epidemic outbreak and its prevention and control: A case study of Jinan City
- Milankovitch cycles and the astronomical time scale of the Zhujiang Formation in the Baiyun Sag, Pearl River Mouth Basin, China
- Shear strength and meso-pore characteristic of saturated compacted loess
- Key point extraction method for spatial objects in high-resolution remote sensing images based on multi-hot cross-entropy loss
- Identifying driving factors of the runoff coefficient based on the geographic detector model in the upper reaches of Huaihe River Basin
- Study on rainfall early warning model for Xiangmi Lake slope based on unsaturated soil mechanics
- Extraction of mineralized indicator minerals using ensemble learning model optimized by SSA based on hyperspectral image
- Lithofacies discrimination using seismic anisotropic attributes from logging data in Muglad Basin, South Sudan
- Three-dimensional modeling of loose layers based on stratum development law
- Occurrence, sources, and potential risk of polycyclic aromatic hydrocarbons in southern Xinjiang, China
- Attribution analysis of different driving forces on vegetation and streamflow variation in the Jialing River Basin, China
- Slope characteristics of urban construction land and its correlation with ground slope in China
- Limitations of the Yang’s breaking wave force formula and its improvement under a wider range of breaker conditions
- The spatial-temporal pattern evolution and influencing factors of county-scale tourism efficiency in Xinjiang, China
- Evaluation and analysis of observed soil temperature data over Northwest China
- Agriculture and aquaculture land-use change prediction in five central coastal provinces of Vietnam using ANN, SVR, and SARIMA models
- Leaf color attributes of urban colored-leaf plants
- Application of statistical and machine learning techniques for landslide susceptibility mapping in the Himalayan road corridors
- Sediment provenance in the Northern South China Sea since the Late Miocene
- Drones applications for smart cities: Monitoring palm trees and street lights
- Double rupture event in the Tianshan Mountains: A case study of the 2021 Mw 5.3 Baicheng earthquake, NW China
- Review Article
- Mobile phone indoor scene features recognition localization method based on semantic constraint of building map location anchor
- Technical Note
- Experimental analysis on creep mechanics of unsaturated soil based on empirical model
- Rapid Communications
- A protocol for canopy cover monitoring on forest restoration projects using low-cost drones
- Landscape tree species recognition using RedEdge-MX: Suitability analysis of two different texture extraction forms under MLC and RF supervision
- Special Issue: Geoethics 2022 - Part I
- Geomorphological and hydrological heritage of Mt. Stara Planina in SE Serbia: From river protection initiative to potential geotouristic destination
- Geotourism and geoethics as support for rural development in the Knjaževac municipality, Serbia
- Modeling spa destination choice for leveraging hydrogeothermal potentials in Serbia