The spatial-temporal pattern evolution and influencing factors of county-scale tourism efficiency in Xinjiang, China
-
Yiwan Yang
 ,
Ziwei Qin
,
Ziwei Qin

Abstract
Scientific evaluation of the development efficiency of the regional tourism industry has important practical significance in promoting the high-quality development of the industry. This study calculated the county tourism efficiency and total factor productivity (TFP) for 86 counties and cities in Xinjiang, China, from 2011 to 2019 based on the SBM-data envelopment analysis model and the Malmquist productivity index model, which determines the respective temporal changes and spatial differences. The factors affecting the evolution of the spatial–temporal pattern of the tourism industry efficiency were also analyzed using the geographic detector model. The results show that: (1) The average tourism efficiency of Xinjiang county from 2011 to 2019 was at a low level of 0.382. During the study period, the evolution trend of the tourism efficiency fluctuated. There was a positive spatial autocorrelation in the tourism efficiency. The difference between cold and hot spots was evident by “hot-in-the-north and cold-in-the-South” characteristics. (2) The TFP maintained an upward trend during the research period, with an average annual growth rate of 28.7%. The number of counties and cities with an increased TFP was much higher than those with a decreased TFP, and its growth was mainly attributed to the progress of technical efficiency. (3) The county tourism efficiency was mainly affected by the level of economic development, tourism resource endowment, market scale, and government policies. There were large differences in the intensity and space among various influencing factors. During the research period, the influence of the economic development level and market scale gradually weakened, and the influence of tourism resource endowment and government policies continuously strengthened.
1 Introduction
After more than 40 years of rapid development, the tourism industry has achieved a leap in that China, which was once a large country of tourism resources, has grown to be a large tourism economy. Currently, China is in a critical period of transformation from “quantity” expansion to “quality” improvement. Promoting the high-quality development of tourism is an important proposition for the development of China’s tourism industry.
The concept of “efficiency” was first proposed by the economist Farrell in 1957 and was mainly used in the field of economics [1]. Later, it was improved by operational researchers such as Charnes et al. [2], who proposed the use of the linear programming method to evaluate the efficiency of decision-making units, that is, data envelopment analysis (DEA), which is widely used in many disciplines because of its superiority in dealing with problems with multiple inputs and outputs. The combination of the concept of “efficiency” and “tourism industry research” has brought new ideas for evaluating the quality of tourism development. From the perspective of research content, previous studies mainly focused on the operation and management of hotels [3,4,5] and tourism agencies [6,7,8]. More recently, research was extended to scenic spots [9,10], tourism transportation [11,12,13], tourism ecology [14,15,16], and other aspects. The spatial scope of the research has also gradually expanded from focusing on only a single element of the tourism industry to the development efficiency of the whole industry. In terms of research methods, DEA [17,18,19], the Malmquist index model [20,21,22], and the stochastic frontier function [23,24,25,26] are widely used. In terms of the evaluation index selection, different countries from different studies will be selected according to the actual local tourism development indicators [27,28,29], such as in the production index to join the government policy on the influence of tourism development, which not only increases the mechanism explanation for the formation principle and impact of tourism efficiency but also structures research in line with the actual development of local industries. In terms of research scale, countries [30,31], provinces [32,33,34], urban agglomerations [35,36], and cities [37,38] are the main research areas, and there are currently few medium and micro studies considering development efficiency on a county scale.
As the most basic and stable administrative division in China, the county is an important guarantee for the national economy. Against the background of the regional tourism development, county tourism (with rural tourism at the core) is becoming an important supporting structure and new direction for China’s tourism development. County tourism (the most dynamic unit of the county economy) plays a direct and indirect role in the development level and structural optimization of the county economy. In recent years, tourism in Xinjiang has developed rapidly and has become a pillar industry and an emerging engine that promotes high-quality economic development, which continues to play a leading role in the economic, social, and cultural development of Xinjiang. In addition, most studies on tourism efficiency concentrated in the economically developed eastern coastal areas, with less research in the economically underdeveloped northwestern areas.
Therefore, it is of great significance to study the efficiency of tourism development in Xinjiang on the county and city scale. The research results can help us understand the development status of county tourism in Xinjiang and the driving factors for high-quality development of county tourism industry, and avoid the losses caused by investment mistakes and resource mismatches for future development. This study analyzed and reviewed Xinjiang’s county-scale tourism efficiency and provided a reference for future research on the temporal and spatial evolution law and impact mechanisms of county tourism efficiency.
2 Materials and methods
2.1 Overview of the study area
As one of the regions with the richest tourism resources in China, Xinjiang has evolved into an attractive tourist destination. It is unique in that it is rich in geomorphic types, including the Taklimakan Desert, Kunlun Mountains, Tarim Basin, Bosten Lake, etc., all of which are known as “the best in China.” Xinjiang not only has a unique and attractive natural landscape but also is steeped in culture. The historic “Silk Road,” which connected China to the rest of the world, passed through Xinjiang, dotting the 5,000 km long ancient road with priceless treasures. In addition, Xinjiang is also a multi-ethnic settlement, characterized by a wide variety of ethnic folk culture with deep roots. As of June 2021, Xinjiang had 16 5A scenic spots, ranking first in the western region and third in the country. During the 13th Five-Year Plan period, the number of tourists received in Xinjiang achieved a sustained and rapid growth, with an average annual growth rate of 38.08%. In 2019, the number of tourists who visited Xinjiang exceeded 200 million, and the contribution rate to GDP reached 13.95% (Figure 1).

Administrative division of Xinjiang, China.
2.2 Indicator selection and data sources
The accuracy of the measurement of tourism efficiency is greatly influenced by the selection of input and output indicators; however, there is no unified standard for the selection of tourism efficiency evaluation indicators in academia. Land, capital, and labor are considered as the most basic factors of production in economic activities. As one of the economic activities, tourism activities also contain basic factors of production [39,40]. Due to the wide range of tourism activities and strong randomness, the area of “tourism land” is difficult to measure by absolute calculation, and land use data lack the statistics for “tourism land”; therefore, with reference to previous studies, the land factor was not included in the input index system [41]. The fixed capital stock, the number of tourism institutions and star-rated hotels, and the attraction of tourism resources were selected as the capital investment indicators. Although the total social fixed asset investment cannot fully represent the tourism capital investment, it can reflect the relevance of the county tourism industry [42]. The social fixed capital stock was calculated using the perpetual inventory method [43], and the attractiveness of the tourism resources was obtained by multiplying the number of scenic spots rated 3A and above in the study area by the corresponding scores of the scenic spots at each level in the relevant national standards. The number of employees in the tourism industry can most directly reflect the labor factors invested in tourism activities. However, most counties and cities in Xinjiang lack this part of the data. Based on the availability of data, the labor factor input was represented by the number of employees in the tertiary industry.
The tourism revenue and the number of tourists are the most representative indicators of the value created by the tourism industry and the level of regional tourism development and are mostly used in academia; therefore, these two indicators were selected as the output indicators. To eliminate the influence of prices on the measurement results, all variables involving prices in this study were deflated using the GDP price deflator with a 2011 base period.
Most of the data in this article were obtained from the Xinjiang Statistical Yearbook, China Counties Statistical Yearbook, Xinjiang Yearbook, Xinjiang Statistical Bulletin on National Economic and Social Development, Xinjiang Counties, and Cities Government Work Report. Due to the large amount of data and long study period, for some counties and cities with missing data in some years, an interpolation method was adopted to fill in the missing data; for the remaining counties and cities with a larger portion of missing data, these were treated as missing data. Finally, complete data were obtained for 86 counties and cities.
2.3 Research method
2.3.1 DEA-SBM efficiency measurement method
DEA is a nonparametric efficiency evaluation method that operates with multiple input and output indicators; the traditional DEA model fails to fully consider the slackness of input and output, resulting in deviation in efficiency measurement. Tone proposed a nonradial SBM model based on the traditional DEA model [44]: The SBM-DEA model, unlike the traditional DEA model, can solve the problem that the efficiency of the evaluation object is overestimated. Therefore, this study used the SBM-DEA model to measure the tourism efficiency of 86 counties and cities in Xinjiang to further analyze the gap between the different county tourism efficiencies. The calculation formula is as follows:
In the aforementioned formulas,
2.3.2 Malmaquist productivity index model
The tourism total factor productivity (TFP) refers to the extent to which the tourism industry changes over time due to advances in technological progress, business management, and resource coordination that affect the tourism output [45]. The DEA model can only measure the relative stationary efficiency of the tourism industry in a certain period. To better analyze the long-term change characteristics and the reasons for tourism efficiency in Xinjiang counties and to make up for the shortcomings of the DEA model (which cannot be continuously compared between different time periods), this study used the Malmquist productivity index model to measure the TFP and decomposition rate of change in the tourism industry in 86 counties and cities in Xinjiang from 2011 to 2019, which is calculated according to the following formula:
where
2.3.3 Spatial correlation analysis
Global spatial autocorrelation is used to describe the spatial distribution of attribute values throughout the study area and to determine whether elements have the presence of aggregation characteristics in space. Therefore, this article uses the global spatial autocorrelation as an important tool to explore whether the county-scale tourism efficiency in Xinjiang is characterized by spatial correlation and agglomeration.
Local spatial autocorrelation is used to identify high and low value aggregations and spatial outliers in the observed space, which can describe the spatial differentiation of county tourism efficiency in Xinjiang in more detail. This article uses the local spatial autocorrelation to explore the local characteristics of tourism efficiency and identify the spatial pattern of cold spots and hot spots.
2.3.4 Geographical detector method
The geographic detector model can detect the possibility of causality between two variables by checking the consistency of spatial distribution of two variables [46]. It is an important method to detect spatial differentiation and explain its driving force. Tourism efficiency is affected by tourism resource endowment, economic development level, market size, and other factors, and many assumptions need to be considered when using traditional methods, while geographical detectors are less constrained in assumptions. In addition, the relationship between independent variables and dependent variables established by using geographical detectors is more reliable than classical regression [47]. Therefore, this article intends to use the divergence and factor detector in the geographical detector method to explore the driving factors of spatial divergence of tourism efficiency, which is calculated as follows:
where h is the number of gradations of variable Y or factor X; N
h
and N are the number of gradations and Xinjiang counties and cities units, respectively;
3 Results and analysis
3.1 Spatial and temporal pattern evolution of county-scale tourism efficiency in Xinjiang
The tourism efficiency in 86 counties and cities in Xinjiang was measured using the Max-DEA software, graded in reference to existing studies, and then divided into four efficiency levels: extremely low efficiency, low efficiency, high efficiency, and extremely high efficiency with cutoff points of 0.4, 0.6, 0.8, and 1, respectively.
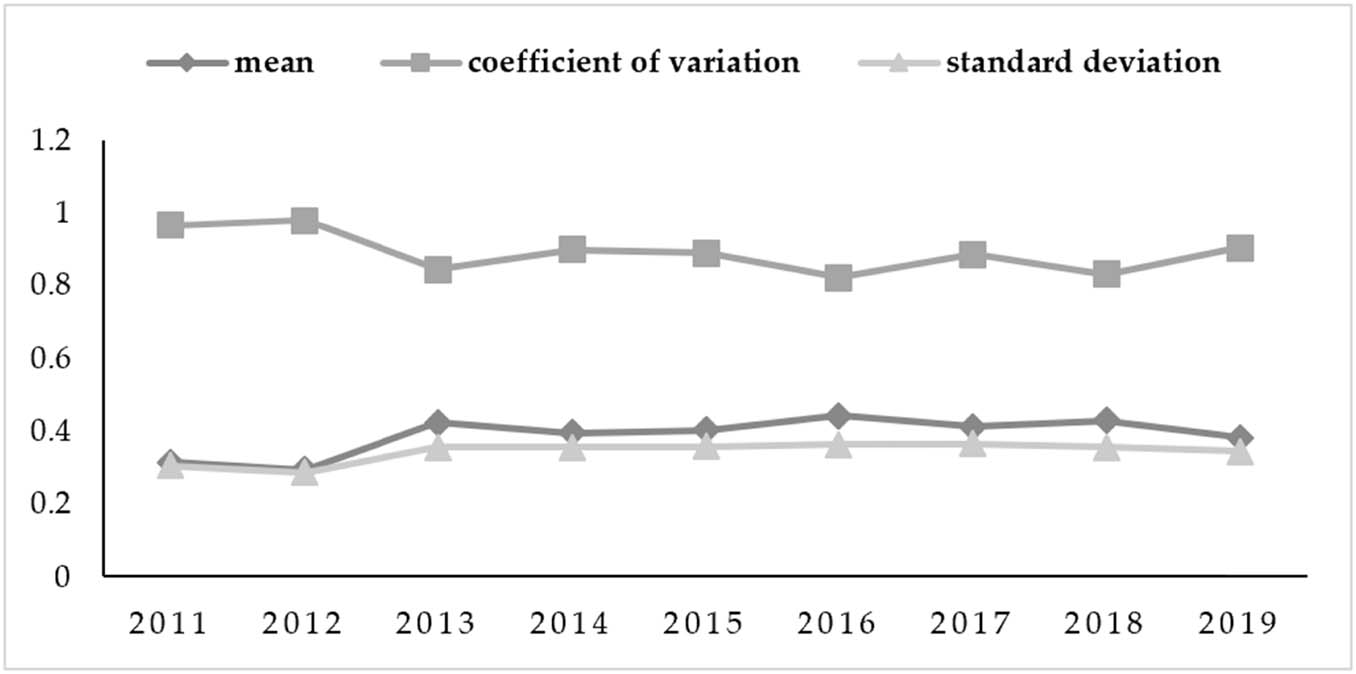
The efficiency of tourism in the Xinjiang counties during the study period was generally at a low level, and the overall trend in change showed a fluctuating increase (Table 1; Figure 2). Specifically, the results showed the following: (1) The average value of the tourism industry efficiency of 86 provinces and cities in Xinjiang in 2011−2019 was 0.388, indicating that under certain input factors, it only reached 38.8% of the optimal level, which was an extremely low-level efficiency. The average value of the pure technical efficiency was lower (0.459) than that of the scale efficiency (0.863), indicating that the scale efficiency had a greater impact on the tourism efficiency. (2) The tourism efficiency of counties and cities fluctuated between 0.293 and 0.442. From 2011 to 2012, the efficiency dropped significantly and reached the lowest point. From 2012 to 2013, the efficiency increased and then showed a downward trend from 2013 to 2014. From 2014 to 2016, the efficiency continued to increase until it reached a peak and then fluctuated and decreased. During the study period, the change in trend was regular and showed a similar “W”-shaped change pattern. (3) The standard deviation of the tourism industry efficiency in the Xinjiang counties varied between 0.228 and 0.364 during the study period, with a small variation, indicating that the dispersion of the tourism efficiency in the counties was small, and the development was more stable. The coefficient of variation varied between 0.83 and 0.978, indicating a high index of variation, which can be explained by two reasons: (1) the large differences in the tourism efficiency and strong nonequilibria among counties and cities and (2) the fact that the mean value of the tourism efficiency was low. However, the variation range of the coefficient of variation was not large, which indicates that the county tourism efficiency in Xinjiang formed a relatively stable spatial pattern in the study period (Table 2).
Input–output measurement index system of tourism efficiency
| Evaluation content | Indicator type | Primary indicators | Secondary indicators | Indicator description | Unit |
|---|---|---|---|---|---|
| Tourism efficiency | Input indicators | Capital elements | Fixed capital stock | Fixed capital stock of the whole society | RMB100mn |
| Number of travel agencies | Number of travel agencies | Number | |||
| Number of star rated hotels | Number of star rated hotels | Number | |||
| The attraction of tourism resources | Sum of weighted quantity of scenic spots above 3A level | Score | |||
| Labor elements | Number of employees in the tertiary industry | Number of employees in the tertiary industry | Ten thousand people | ||
| Output indicators | Efficiency output | Tourism revenue | Total of direct tourism income and indirect tourism income | RMB100mn | |
| Number of tourists | The sum of domestic tourism reception and international tourism reception | Ten thousand people |
Diachronic changes in county-scale tourism efficiency in Xinjiang.
Changes in efficiency of county-scale tourism industry in Xinjiang from 2011 to 2019
| Years | 2011 | 2012 | 2013 | 2014 | 2015 | 2016 | 2017 | 2018 | 2019 | Mean |
|---|---|---|---|---|---|---|---|---|---|---|
| Technical efficiency | 0.315 | 0.293 | 0.422 | 0.395 | 0.403 | 0.442 | 0.411 | 0.428 | 0.382 | 0.388 |
| Pure technical efficiency | 0.438 | 0.406 | 0.476 | 0.472 | 0.462 | 0.496 | 0.459 | 0.500 | 0.446 | 0.459 |
| Scale efficiency | 0.791 | 0.783 | 0.918 | 0.867 | 0.890 | 0.896 | 0.906 | 0.883 | 0.836 | 0.863 |
To further explore the spatial pattern and evolution characteristics of the tourism industry efficiency in Xinjiang counties, ArcGIS 10.3 software was used to select the level of tourism industry efficiency in Xinjiang counties in 2011, 2015, and 2019 for visualization and analysis (Figure 3). The results are as follows: (1) In 2011, the tourism efficiency of Xinjiang counties and cities was mainly divided into two levels: extremely low-level and extremely high-level efficiency. The percentage of the extremely low-level efficiency counties and cities reached 80%. The extremely high-level efficiency counties and cities, such as Urumqi, Fukang, Hutubi, Manas, Shihezi, and Shawan, were spatially concentrated and mainly distributed along the northern slope of the Tianshan Mountain. (2) In 2015, the number of counties and cities with low and extremely high efficiencies increased, but the overall number of those with an extremely low efficiency still dominated (accounting for 60.5% of the region). The counties and cities with extremely high-efficiency levels were mainly distributed in northern Xinjiang. There were a few extremely high-level efficiency counties and cities, such as Korla, Bohu, Alar, and Aksu, scattered in southern Xinjiang. (3) In 2019, the number of low-level efficiency counties and cities decreased sharply, and the tourism efficiency levels in the study area were mainly at two levels: extremely low-level efficiency and extremely high-level efficiency, with extremely low-efficiency levels dominating (accounting for 72% of the region). The distribution of extremely high-efficiency counties and cities showed a pattern of “large-scattering and small-clustering.”

Spatial distribution of county-scale tourism efficiency in Xinjiang. (a) 2011, (b) 2015, and (c) 2019.
3.2 Spatial correlation characteristics of the county-scale tourism industry efficiency in Xinjiang
ArcGIS 10.3 software was used to calculate and test Moran’s I index from 2011 to 2019; the results are summarized in Table 3. For the period 2011−2019, Moran’s I of the Xinjiang counties’ tourism industry efficiencies were positive, and all exceeded the 1% significance test, indicating that the county tourism industry in Xinjiang had a positive spatial correlation, i.e., counties and cities with similar efficiency values were clustered. During the study period, Moran’s I index fluctuated and decreased, which indicated that the agglomeration trend of the county tourism efficiency gradually weakened, and the polarization of the high- and low-value centers gradually decreased with the overall development of the tourism industry.
2011–2019 Moran’s I index of Xinjiang county-scale tourism efficiency
| Years | 2011 | 2012 | 2013 | 2014 | 2015 | 2016 | 2017 | 2018 | 2019 |
|---|---|---|---|---|---|---|---|---|---|
| Moran’sⅠ | 0.122 | 0.071 | 0.068 | 0.069 | 0.076 | 0.067 | 0.060 | 0.036 | 0.035 |
| Z value | 3.413 | 2.041 | 2.036 | 2.036 | 2.211 | 2.030 | 1.828 | 1.211 | 1.210 |
| P value | 0.000 | 0.042 | 0.042 | 0.042 | 0.027 | 0.026 | 0.023 | 0.026 | 0.026 |
Global spatial autocorrelation can only reflect the overall correlation and change in the tourism efficiency in space; therefore, the local correlation and change characteristics cannot be reflected. Therefore, this study used ArcGIS 10.3 software to measure the Getis-Ord Gi* index in 2011, 2015, and 2019, and also used the natural fracture point method (Jenks) to divide the Gi* index of each county and city into five regions in the order from low to high: cold spots, sub-cold spots, sub-hot spots, hot spots, and nonsignificant areas (Figure 4). As Figure 3 shows, the results are as follows: (1) during 3 years, the distribution pattern of the hot and cold spots was in a “cold-in-the-north and hot-in-the-south” pattern and showed a certain hierarchy, that is, the sub-cold and sub-hot spots were commonly evident around the cold and hot spots. (2) The four types of comprehensive efficiency of county-scale tourism industry in Xinjiang have the characteristics of regional transformation. Throughout 3 years, the number of counties and cities in the cold spot area, the sub-cold spots area, and the hot spot area is decreasing significantly, and the number of counties and cities in the sub-hot spots area and the insignificant area is increasing. Most of the nonsignificant areas comprised counties and cities that were previously located in the cold or the sub-cold spot areas, such as Kashi City, Shufu County, Shule County, and Pishan County, which are located in Kashi and Hetian regions in southwestern Xinjiang; the number of counties and cities located in the sub-hot area is also gradually increasing, and most of them are transformed from counties and cities previously located in the hot spot area, such as Karamay City, Korla City, Fuyun County, and Wujiaqu City.

Spatial distribution of county-scale tourism efficiency hot spots and cold spots in Xinjiang. (a) 2011, (b) 2015, and (c) 2019.
3.3 Spatial and temporal evolutionary characteristics of the Malmquist productivity index of the county-scale tourism industry in Xinjiang
To further explore the dynamic change characteristics of tourism efficiency in Xinjiang counties, the results of a year-by-year change in TFP of 86 counties and cities in Xinjiang from 2011 to 2019 were calculated.
As shown in Table 4, the average value of the TFP of the tourism industry in the Xinjiang counties during the 9 years, from 2011 to 2019, was 1.287, which indicates that the TFP of the tourism industry during the study period increased by 28.7% annually; this indicates that the tourism industry in the Xinjiang counties developed well during this period, the utilization of the various input production factors for the tourism industry was reasonable and adequate, and the utilization efficiency of the tourism industry was realized by a year-by-year increment. The TFP of Xinjiang’s county tourism industry increased the most during the period 2017−2019. In 2018, the tourism industry in Xinjiang had ushered in an unprecedented historical opportunity with the introduction of the tourism development strategy, and the counties and cities took the initiative to grasp the development opportunity combined with the implementation of rural revitalization, tourism poverty alleviation, and other strategies to develop the county tourism industry.
TFP index and its decomposition index of county-scale tourism industry in Xinjiang from 2011 to 2019
| Years | Technical efficiency changes
|
Technological progress changes
|
Pure technical efficiency changes
|
Scale efficiency changes
|
TFP changes |
|---|---|---|---|---|---|
| 2011–2012 | 1.056 | 1.023 | 1.083 | 1.191 | 1.393 |
| 2012–2013 | 1.019 | 1.076 | 2.347 | 1.853 | 1.095 |
| 2013–2014 | 1.072 | 0.947 | 1.127 | 0.979 | 1.017 |
| 2014–2015 | 1.377 | 1.037 | 1.415 | 1.105 | 1.169 |
| 2015–2016 | 1.361 | 0.994 | 1.356 | 1.058 | 1.269 |
| 2016–2017 | 1.141 | 1.249 | 1.104 | 1.044 | 1.409 |
| 2017–2018 | 1.772 | 1.2 | 1.924 | 1.003 | 1.501 |
| 2018–2019 | 1.172 | 1.338 | 1.187 | 0.972 | 1.443 |
| Mean | 1.246 | 1.108 | 1.442 | 1.151 | 1.287 |
By decomposing the TFP index of the tourism efficiency, it was determined that the average value of the technical efficiency index
To further study the spatial differences and evolutionary patterns in the TFP indices of the county tourism industry in Xinjiang, the cross-sectional data from 2012, 2015, and 2019 were selected for visual analysis, and the TFP indices were divided into three grades: low grade (TFP indices less one), medium grade (TFP indices greater than one and less than that of the nine-year average), and high grade (TFP indices greater than that of the 9-year average). As shown in Figure 5, the TFP of the county tourism industry had a clear distribution pattern overall, and its spatial characteristics were as follows: (1) TFP of the tourism industry, in a considerable number of counties and cities, showed spatial clustering with a high–high and low–low clustering pattern. (2) The TFP index levels of the counties and cities were in constant change. From 2011 to 2019, the number of counties and cities with a low TFP index decreased from 44 to 29, while those with a high TFP index increased from 24 to 39, further indicating that the development of the tourism industry in the Xinjiang counties was improving, and the overall tourism efficiency was beginning to increase. In terms of the index rank changes in the counties and cities, there were 41 counties and cities with increasing TFP index ranks and 24 counties and cities with decreasing ranks, which indicates that the proportion of the counties and cities with an increasing TFP was higher than those with a regressing TFP. (3) The distribution pattern of the counties and cities with different TFP index ranks was constantly changing; the number of low-ranking counties and cities in Northern Xinjiang changed from being concentrated in the Altai region to being concentrated in the Tacheng region, and in Southern Xinjiang, the number of low-ranking counties and cities changed from being concentrated in the Kashgar-Hotan region to being concentrated in the Hetian-Aksu region. In 2011, most of the high-level counties and cities were located in Northern Xinjiang and concentrated around Ili Kazak Autonomous Prefecture. In 2019, the number of high-ranking counties and cities in Southern Xinjiang increased and was essentially the same as the number of counties and cities in Northern Xinjiang, such as Shufu County, Shule County, and Yecheng County in the Kashi region.

Spatial distribution of Malmquist productivity index of county-scale tourism in Xinjiang. (a) 2011, (b) 2015, and (c) 2019.
3.4 Analysis of the factors influencing the tourism efficiency
3.4.1 Selection of influencing factors
The spatial differences, dynamic changes, and evolutionary characteristics of the county tourism efficiency in Xinjiang during the study period were a result of various factors. Based on existing research results, this study comprehensively considered the availability of data and selected six indicators for the local economic development level, tourism development quality, tourism resource endowment, market scale, government policies, and infrastructure as the exploration factors to analyze the temporal and spatial changes in the county tourism efficiency for empirical research. The following procedure was followed: (1) The per capita GDP was selected to express the level of economic development, which is an important basic condition for tourism development that directly affects the input and demand of tourism. (2) The tourism development level was expressed as the ratio of the total tourism revenue to the GDP, which reflects the degree of the contribution of the tourism industry to local economic development; it, thus, reflects the level of development of the industry in that local area. The level of the development of the industry tends to influence the input and transfer of local resources. (3) The quality of tourism resources was represented by the sum of the number of scenic spots above the 4A level in each county and city multiplied by the corresponding score. Good tourism resources are important for tourist attraction and the basis for developing the tourism industry. (4) The total social consumption of goods was selected to express the market size. Tourism consumption is a high-level consumption demand that differs from the basic living consumption and is influenced by the consumption demand and level in the region. (5) The general fiscal expenditure was selected to express government policy; the investment of the government in urban construction, transportation conditions, environmental management, and human resources is closely related to the development of the tourism industry. (6) The proportion of the total fixed asset investment in the GDP was selected to express infrastructure. The improvement of professional tourism infrastructure can meet the diversified tourism needs of tourists. At the same time, from the perspective of all tourism activities, the realization of tourism requires service provision from multiple industry departments, which includes not only core tourism enterprises, such as hotels, tourism agencies, and scenic spots, but also from various industries such as finance, communications, insurance, and construction. Finally, the geographical detector method is implemented using R language. The geographical detector method needs to discretize the data, and different grading results will affect the factor exploration results. Using R language to implement the geographical detector method can find the optimal data discretization results, and so this study uses R language to implement the geographical detector method to obtain the final results.
3.4.2 Analysis of influencing factors
Table 5 presents that there were apparent differences in the influence and significance levels of the factors influencing the tourism efficiency in different years. The tourism efficiency in 2011 was mainly affected by the level of economic development, industrial structure, and market scale. Tourism resource endowment had little impact on the tourism efficiency, and neither government policy nor infrastructure passed the significance test. In 2015, the role of tourism resource endowment and government policies became evident, and the impact of the economic development level and market scale on the county tourism efficiency decreased. In 2019, tourism resource endowment had the greatest impact on the tourism efficiency, while the impact of the economic level and market scale on tourism efficiency decreased significantly. According to the research results of the geographical detectors, it was determined that the level of economic development, market scale, tourism resource endowment, and government policies were the main factors influencing the development of the county tourism efficiency.
Impact factors results of county-scale tourism efficiency in Xinjiang
| Indicators | 2011 q-value | 2015 q-value | 2019 q-value | Mean | Ranking |
|---|---|---|---|---|---|
| Local economic development level | 0.2392** | 0.2065** | 0.1405** | 0.1954 | 1 |
| Tourism development quality | 0.1066 | 0.1774* | 0.0746 | 0.1195 | 5 |
| Tourism resource endowment | 0.0823 * | 0.0836* | 0.2807** | 0.1489 | 3 |
| Market size | 0.2310** | 0.2057 ** | 0.1023** | 0.1797 | 2 |
| Government policies | 0.1179 | 0.1194* | 0.1835** | 0.1403 | 4 |
| Infrastructure | 0.0276 | 0.1245* | 0.1289* | 0.0937 | 6 |
Note: ** and * indicate that the influence is significant at the level of 1 and 5%.
All four main influencing factors reached significance at the 1% level in 2019; therefore, 2019 was used as the study year in the bivariate local autocorrelation tool in ArcGIS 10.3 software, which was used to generate bivariate local autocorrelation aggregation maps to explore the spatial correlation between the four main influencing factors and tourism efficiency. The results of the spatial correlation analysis are as follows (Figure 6): (1) The tourism efficiency and economic development level had distinct low-value aggregation areas around the Kashi region, Hetian region, and Kizilsu Kyrgyz Autonomous Prefecture in southwestern Xinjiang. The economic development level of these areas were backward, since it is difficult to support the high-quality development of the tourism industry; however, there were also some counties and cities with a low economic development level but high tourism efficiency, such as Shule county in the Kashi region and Tashikuergan Tajik Autonomous Prefecture, indicating that the economic development level is not a decisive factor in the development of the tourism industry in a county. Essentially, if the economic development level is backward, but a county has a good management ability, then by improving the ability to use the input factors of the tourism industry and reducing the input redundancy, it can also promote efficient and high-quality development of the tourism industry. (2) As can be seen from the spatial aggregation diagram of the tourism efficiency-tourism resource endowment, the high-value aggregation area was located in Changji Hui Autonomous Prefecture, Yili Kazak Autonomous Prefecture, and Karamay city in northern Xinjiang. The areas with better resource endowment were more attractive to tourists, and the development input costs were relatively low. Low-value agglomerations were located in the Hetian region in southern Xinjiang, where tourism resources are scarce and the development capacity is weaker. (3) As can be seen from the spatial aggregation diagram of the tourism efficiency-market size, the high-value aggregation area was located in Urumqi and its surrounding Changji Hui Autonomous Prefecture. Urumqi is not only the largest city in Xinjiang but also the largest tourist dispersion center. Urumqi has a strong market location advantage, which not only promotes the efficient development of the tourism industry in the region but also radiates it to the surrounding areas. (4) As can be seen from the spatial aggregation diagram of the tourism efficiency-government policies, the low-value aggregation areas were most noticeably distributed in both northern and southern Xinjiang.

Local spatial autocorrelation aggregation distribution of county-scale tourism efficiency and influencing factors in 2019. (a) Tourism efficiency-economic development, (b) tourism efficiency-tourism resource endowment, (c) tourism efficiency-market size, and (d) tourism efficiency-government policy.
To further analyze the changes in the spatio-temporal characteristics of the tourism efficiency, in relation to the four main influencing factors, the results of the geographic detector and analysis of the bivariate local autocorrelation were combined to classify the high tourism efficiency counties and cities into four types: economy driven, resource driven, market driven, and policy driven. As presented in Table 5, the number of economically driven counties and cities decreased, which indicates that the influence of the economic development level on the tourism efficiency of counties and cities gradually decreased. In contrast, the number of resource-driven and policy-driven counties and municipalities increased, indicating that with the development of the tourism industry, superior tourism resources and strong government support for the tourism industry were effective in improving tourism efficiency. In 2011, 2015, and 2019, the counties and cities with high tourism efficiency all the year round, such as Urumqi, Karamay, and Korla, mostly belong to four types at the same time. However, in recent years, the tourism efficiency had significantly improved and the counties and cities that had high tourism efficiencies were mostly resource driven and policy driven, such as in Nilek county and Wujiaqu city. The results show that the development and utilization of tourism resources and macro-control of government policies are gradually reducing the developmental disadvantages caused by the backward economy and regional conditions of those counties and cities (Table 6).
County classification of high-level tourism efficiency in Xinjiang from 2011 to 2019
| Type | 2011 | 2015 | 2019 |
|---|---|---|---|
| Economy driven | Urumqi, Karamay, Fukang, Hutubi, Manas, Shihezi | Urumqi, Karamay, Kashi, Yining, Alaer | Urumqi, Fukang, Korla, Karamay, Iwu County |
| Market driven | Urumqi, Shihezi | Urumqi, Karamay, Fukang, Manas, Korla, Ruoqiang, Kuitun, Alar | Urumqi, Korla, Karamay, Hami, Yining |
| Resource driven | Urumqi, Turpan, Turpan, Habahe | Qitai, Karamay, Korla, Urumqi | Urumqi, Nilak, Hami, Karamay, Kuqa |
| Policy driven | Urumqi, Karamay | Urumqi, Turpan, Fukang, Yining, Burjin, Fuyun | Urumqi, Wujiaqu, Korla, Moyu, Alar, Karamay |
4 Conclusions and discussion
4.1 Conclusions
This study used the SBM-DEA model, Malamquist productivity index model, and geographical detector method to calculate and analyze the spatial and temporal patterns, trends, and drivers of the tourism industry efficiency in 86 counties and cities in Xinjiang during the period 2011−2019. The following conclusions were drawn: (1) The average value of the comprehensive efficiency of tourism in the Xinjiang counties from 2011 to 2019 was 0.382, which was categorized as the low-level efficiency class, and the contribution of scale efficiency to the comprehensive efficiency was generally greater than that of pure technical efficiency. From a temporal perspective, the evolution of the comprehensive efficiency during the study period fluctuated with a “W”-type upward trend, low magnitude, and stable development. The spatial pattern of the efficiency of the county tourism followed a “high-in-the-north and low-in-the-south” pattern. Extremely low-level tourism efficiency counties and cities accounted for a relatively high proportion, but these numbers gradually decreased. The number of extremely high-efficiency counties and cities gradually increased, while the distribution changed from clustering to “large-dispersion and small-clustering” in northern Xinjiang. (2) Based on the spatial correlation analysis, it was noted that the tourism efficiency of the Xinjiang counties and cities showed apparent spatial dependence during the study period, but its agglomeration gradually weakened. The spatial pattern of the local spatial correlation was characterized by a “hot-in-the-north and cold-in-the-south” trend and shows a certain hierarchy. (3) The TFP of the Xinjiang county tourism industry had an average annual growth of 28.7%, indicating a rapid growth trend during the research period. The Xinjiang county tourism industry can utilize the various input factors and realize the sustainable growth of the tourism industry efficiency. In terms of spatial characteristics, the TFP of the county tourism in Xinjiang was in a state of fluctuating growth, and the number of counties and cities with the rapid improvement increased. In addition, during the study period, the distribution of counties and cities with high-speed upgrading had also changed greatly from being mainly distributed in Northern Xinjiang to being evenly distributed in Southern and Northern Xinjiang. (4) The spatial and temporal evolution of the county tourism efficiency was mainly influenced by the level of economic development, market size, tourism resource endowment, and government policies. There were some differences in the level of influence and significance of each factor on the tourism efficiency in different years. The level of economic development had the greatest influence on tourism efficiency, but its influence gradually weakened in recent years, and the influence of tourism resource endowment and government policies steadily increased.
4.2 Policy recommendations
Based on the aforementioned findings, the following development suggestions are put forward: (1) The complementary advantages between counties and cities should be supported to balance the differences in industrial development [42]. On the one hand, according to the characteristics of tourism development, the characteristics of regional tourism resource endowment fully highlight the comparative advantages of counties and cities to avoid homogenization of the tourism market. On the other hand, counties and cities should break administrative barriers and adopt the idea of whole-area development and integration; strengthen the exchange and collaboration with other counties and cities in terms of talent resources, technological innovation, consumer market, technology development, etc.; seek broader development space; enhance the flow of tourism resource elements in the county and city configuration capacity; and improve the efficiency of the regional tourism industry synergy development. (2) The efficiency improvement path should be determined according to the technical efficiency, TFP, and main influencing factors of each county and city. Due to the differences between counties and cities, in terms of economic development level, technological innovation capacity, and tourism industry scale, the structural configuration of these input factors and the choice of paths to improve efficiency should also be different [48]. For example, if counties and cities have a high scale efficiency, and if the average value of the scale efficiency index increases year by year, then these counties and cities should timely adjust to the industrial structure to expand the scale of the industry. Conversely, if the number of counties and cities with a low level of TFP is relatively large (as was the case in southern Xinjiang), these counties and cities should not only increase the input of resources but also improve their ability to transform the input factors while maintaining a reasonable input. (3) The government’s tourism management and control functions should be fully incorporated to promote high-quality and coordinated development of tourism [49]: First, the management and control functions of the government are reflected in the macro planning of the tourism industry; therefore, the government should implement refined tourism management planning, accelerate the progress of tourism resources development and integration, encourage the diversification and innovative development of tourism products and patterns, focus on the systematization and standardization of management planning, and make timely benefit assessments and program adjustments. Second, the management and control functions of government are reflected in the management of various industries that are related to the tourism industry. On the one hand, tourism enterprises should be guided to adjust the industrial structure and play an active role in major project investments, guaranteeing financing, and capital operations; on the other hand, it can be used to improve tourism infrastructure, maintain the order of the tourism market, and provide a healthy environment for the high-quality development of tourism.
4.3 Discussion
The conclusions of this article show that the TFP maintained an upward trend during the research period, with an average annual growth rate of 28.7%, and its growth was mainly attributed to the progress of technical efficiency. This conclusion is consistent with previous views [50]. The average value of the comprehensive efficiency of tourism in Xinjiang counties from 2011 to 2019 was 0.382, which was categorized as the low-level efficiency class. This conclusion is contrary to the previous views [50,51,52]. The difference in the research scale is one reason, and the other reason is that Xinjiang has a vast territory, the counties and cities in prefectures are far apart, and the differences in the internal economic and social development are also large. Previous studies on the tourism efficiency in Xinjiang were mostly at the prefecture level; although research at this level can reflect the current situation of the tourism industry development in Xinjiang to a certain extent, it ignores the impact of the differences within the prefectures. This study comprehensively analyzed the measurement, spatio-temporal differences, and influencing factors of county-scale tourism efficiency in Xinjiang, which more accurately reflected the actual situation of the regional tourism development; thus, it comprehensively highlighted the deep-seated problems of tourism development at the grass-roots unit and provides a more targeted guidance for development planning, policy formulation, and improving the tourism industry in the future.
This article also had the following shortcomings: (1) Because the selection of tourism efficiency measurement indicators has not been standardized yet and the data of small-scale research units are limited, side data were selected for the characterization of some indicators. For example, the number of employees in the tertiary industry was selected to represent the number of tourism employees; although it affects the accuracy of the research results to a certain extent, it does not affect the reference value. (2) The Malmquist productivity index method generally needs to analyze long time series data. This study used a limited study period, and therefore, the results had some limitations. In future research, select input–output indicators that can more directly represent the tourism industry, build a more perfect tourism efficiency measurement system, and consider introducing innovative data acquisition methods (network data crawling technology) to make up for the problems such as imperfect measurement system construction and insufficient research period span caused by lack of data.
-
Funding information: This research was funded by the High-Level Talents Research Project of Shihezi University (Grant number RCSK2018C06) and the Corps Social Science Foundation (Grant number 22YB08).
-
Author contributions: Y.Y.: conceptualization, software, validation, data curation, and writing – original draft preparation; C.Z.: methodology, resources, writing – review and editing, supervision, project administration, and funding acquisition; Z.Q.: formal analysis and investigation; Y.C.: visualization. All authors have read and agreed to the published version of the manuscript.
-
Conflict of interest: The authors declare no conflict of interest.
-
Data availability statement: Not applicable.
References
[1] Farrell MJ. The measurement of productive efficiency. J R Stat Soc. 1957;120(3):253–90.10.2307/2343100Search in Google Scholar
[2] Charnes A, Cooper WW, Rhodes E. Measuring the efficiency of decision making units. Eur J Oper Res. 1978;2(6):429–4.10.1016/0377-2217(78)90138-8Search in Google Scholar
[3] Deng Z, Gao Y, Liang B, Morrison AM. Efficiency evaluation of hotel operations in Mainland China based on the superefficiency SBM model. Tour Econ. 2020;26(2):276–98.10.1177/1354816618816787Search in Google Scholar
[4] Dong H, Peypoch N, Zhang L. Do contextual factors matter? Evidence from Chinese hotel productivity with heterogeneity. Tour Econ. 2020;26(2):257–75.10.1177/1354816619856239Search in Google Scholar
[5] Kim C, Chung K. Measuring customer satisfaction and hotel efficiency analysis: An approach based on data envelopment analysis. Cornell Hospitality Q. 2022;63(2):257–66.10.1177/1938965520944914Search in Google Scholar
[6] Parte L, Alberca P. Business performance and sustainability in cultural and rural tourism destinations. Mathematics. 2021;9(8):892.10.3390/math9080892Search in Google Scholar
[7] Huang H, Liu Y, Lu D. Proposing a model for evaluating market efficiency of OTAs: Theoretical approach. Tour Econ. 2020;26(6):958–75.10.1177/1354816619853114Search in Google Scholar
[8] Sano AVD, Nindito H, Madyatmadja ED, Sianipar CPM, Ieee, editors. Modeling Prim’s algorithm for tour agencies’ minimum traveling paths to increase profitability. 5th International Conference on Information Management and Technology (ICIMTech). Bina Nusantara Univ, Sch Informat Syst, ELECTR NETWORK2020; 2020 Aug 13–14.Search in Google Scholar
[9] Li Y, Zhang L. Ecological efficiency management of tourism scenic spots based on carbon footprint analysis. Int J Low-Carbon Technol. 2020;15(4):550–4.10.1093/ijlct/ctaa023Search in Google Scholar
[10] Yang X, Wang Z-J. Intuitionistic fuzzy hierarchical multi-criteria decision making for evaluating performances of low-carbon tourism scenic spots. Int J Environ Res Public Health. 2020;17(17):6259.10.3390/ijerph17176259Search in Google Scholar PubMed PubMed Central
[11] Husain N, Abdullah M, Kuman S. Evaluating public sector efficiency with data envelopment analysis (DEA): A case study in Road Transport Department, Selangor, Malaysia. Total Qual Manag. 2000;11(4–6):830–6.10.1080/09544120050008282Search in Google Scholar
[12] Wang Y, Wang M, Li K, Zhao J. Analysis of the relationships between tourism efficiency and transport accessibility-A case study in Hubei Province, China. Sustainability. 2021;13(15):8649.10.3390/su13158649Search in Google Scholar
[13] Liu M, Li Y, de los Angeles Perez-Sanchez M, Luo J, Bu N, Chen Y, et al. Empirical study on the sustainable development of mountain tourism in the early stage of high-speed railways-taking the southwest mountainous region of China as an example. Sustainability. 2022;14(3):1058.10.3390/su14031058Search in Google Scholar
[14] Castilho D, Fuinhas JA, Marques AC. The impacts of the tourism sector on the eco-efficiency of the Latin American and Caribbean countries. Socio-econ Plan Sci. 2021;78:101089.10.1016/j.seps.2021.101089Search in Google Scholar
[15] Wang R, Xia B, Dong S, Li Y, Li Z, Ba D, et al. Research on the spatial differentiation and driving forces of eco-efficiency of regional tourism in China. Sustainability. 2021;13(1):280.10.3390/su13010280Search in Google Scholar
[16] Zha J, Yuan W, Dai J, Tan T, He L. Eco-efficiency, eco-productivity and tourism growth in china: a non-convex metafrontier DEA-based decomposition model. J Sustain Tour. 2020;28(5):663–85.10.1080/09669582.2019.1699102Search in Google Scholar
[17] Ji J, Wang D. Regional differences, dynamic evolution, and driving factors of tourism development in Chinese coastal cities. Ocean Coast Manag. 2022;226:106262.10.1016/j.ocecoaman.2022.106262Search in Google Scholar
[18] Kabil M, AbdAlmoity EA, Csoban K, David LD. Tourism centres efficiency as spatial unites for applying blue economy approach: A case study of the Southern Red Sea region, Egypt. Plos One. 2022;17(7):e0268047.10.1371/journal.pone.0268047Search in Google Scholar PubMed PubMed Central
[19] Xu L, Yu H, Zhou B. Decline or Rejuvenation? Efficiency Development of China’s National Scenic Areas. Forests. 2022;13(7):995.10.3390/f13070995Search in Google Scholar
[20] Zha J, Zhu Y, He D, Tan T, Yang X. Sources of tourism growth in Mainland China: An extended data envelopment analysis-based decomposition analysis. Int J Tour Res. 2020;22(1):54–70.10.1002/jtr.2318Search in Google Scholar
[21] Yang J, Wu Y, Wang J, Wan C, Wu Q. A study on the efficiency of tourism poverty alleviation in ethnic regions based on the staged DEA model. Front Psychol. 2021;12:642966.10.3389/fpsyg.2021.642966Search in Google Scholar PubMed PubMed Central
[22] Tzeremes P, Tzeremes NG. Productivity in the hotel industry: An order-alpha Malmquist productivity indicator. J Hospitality Tour Res. 2021;45(1):133–50.10.1177/1096348020974419Search in Google Scholar
[23] Zhang D, Tu J, Zhou L, Yu Z. Higher tourism specialization, better hotel industry efficiency? Int J Hospitality Manag. 2020;87:102509.10.1016/j.ijhm.2020.102509Search in Google Scholar PubMed PubMed Central
[24] Perez-Granja U, Inchausti-Sintes F. On the analysis of efficiency in the hotel sector: Does tourism specialization matter? Tour Econ. 2021:1–24. 10.1177/13548166211039301.Search in Google Scholar
[25] Liu H, Tsai H. A stochastic frontier approach to assessing total factor productivity change in China’s star-rated hotel industry. J Hospitality Tour Res. 2021;45(1):109–32.10.1177/1096348020946363Search in Google Scholar
[26] Algieri B, Alvarez A. Assessing the ability of regions to attract foreign tourists: The case of Italy. Tour Econ. 2022. 10.1177/13548166211068669.Search in Google Scholar
[27] Cesar Herrero-Prieto L, Gomez-Vega M. Cultural resources as a factor in cultural tourism attraction: Technical efficiency estimation of regional destinations in Spain. Tour Econ. 2017;23(2):260–80.10.1177/1354816616656248Search in Google Scholar
[28] Zhang P, Yu H, Shen M, Guo W. Evaluation of Tourism Development Efficiency and Spatial Spillover Effect Based on EBM Model: The Case of Hainan Island, China. Int J Environ Res Public Health. 2022;19(7):3755.10.3390/ijerph19073755Search in Google Scholar PubMed PubMed Central
[29] Tang R. Does trade facilitation promote the efficiency of inbound tourism? -The empirical test based on Japan. Int J Tour Res. 2021;23(1):39–55.10.1002/jtr.2390Search in Google Scholar
[30] Radovanov B, Dudic B, Gregus M, Horvat AM, Karovic V. Using a two-stage DEA model to measure tourism potentials of EU countries and Western Balkan countries: An approach to sustainable development. Sustainability. 2020;12(12):4903.10.3390/su12124903Search in Google Scholar
[31] Liu Z, Lu C, Mao J, Sun D, Li H, Lu C. Spatial-temporal heterogeneity and the related influencing factors of tourism efficiency in China. Sustainability. 2021;13(11):5825.10.3390/su13115825Search in Google Scholar
[32] Wang Z, Liu Q, Xu J, Fujiki Y. Evolution characteristics of the spatial network structure of tourism efficiency in China: A province-level analysis. J Destination Mark Manag. 2020;18:100509.10.1016/j.jdmm.2020.100509Search in Google Scholar
[33] Haibo C, Ke D, Fangfang W, Ayamba EC. The spatial effect of tourism economic development on regional ecological efficiency. Environ Sci Pollut Res. 2020;27(30):38241–58.10.1007/s11356-020-09004-8Search in Google Scholar PubMed
[34] He L, Zha J, Loo HA. How to improve tourism energy efficiency to achieve sustainable tourism: evidence from China. Curr Issues Tour. 2020;23(1):1–16.10.4324/9781003133568-14Search in Google Scholar
[35] Sun Y, Hou G, Huang Z, Zhong Y. Spatial-temporal differences and influencing factors of tourism eco-efficiency in China’s three major urban agglomerations based on the super-EBM model. Sustainability. 2020;12(10):4156.10.3390/su12104156Search in Google Scholar
[36] Li Y, Li R, Ruan W, Liu C-H. Research of the effect of tourism economic contact on the efficiency of the tourism industry. Sustainability. 2020;12(14):5652.10.3390/su12145652Search in Google Scholar
[37] Wang H, Xu S, Xie Q, Fan J, Zhou N. Study on the temporal and spatial differentiation of provincial tourism efficiency in Eastern China and influencing factors. Complexity. 2021;2021:4580917.10.1155/2021/4580917Search in Google Scholar
[38] Sun Y, Hou G. Analysis on the spatial-temporal evolution characteristics and spatial network structure of tourism eco-efficiency in the Yangtze River Delta Urban Agglomeration. Int J Environ Res Public Health. 2021;18(5):2577.10.3390/ijerph18052577Search in Google Scholar PubMed PubMed Central
[39] Li KX, Jin M, Shi W. Tourism as an important impetus to promoting economic growth: A critical review. Tour Manag Perspect. 2018;26:135–42.10.1016/j.tmp.2017.10.002Search in Google Scholar
[40] Wu K-J, Zhu Y, Chen Q, Tseng M-L. Building sustainable tourism hierarchical framework: Coordinated triple bottom line approach in linguistic preferences. J Clean Prod. 2019;229:157–68.10.1016/j.jclepro.2019.04.212Search in Google Scholar
[41] Dong X, Zhenfang H, Xiaohai H, Long L, Fangdong C. The spatial pattern evolution and its influencing factors of county-scale tourism efficiency in Zhejiang province. Econ Geogr. 2018;38(5):197–207.Search in Google Scholar
[42] Qiu-ling P, Yu-qiang S, Le C, Zhi-kui P. The spatial pattern and influencing factors of county-scale tourism efficiency in Shaanxi province. J Nat Resour. 2021;36(4):866–78.10.31497/zrzyxb.20210405Search in Google Scholar
[43] Cao F, Huang Z, Jin C, Xu M. Chinese national scenic areas’ tourism efficiency: Multi-scale fluctuation, prediction and optimization. Asia Pac J Tour Res. 2016;21(5):570–95.10.1080/10941665.2015.1068190Search in Google Scholar
[44] Tone K. A slacks-based measure of efficiency in data envelopment analysis. Eur J Oper Res. 2001;130(3):498–509.10.1016/S0377-2217(99)00407-5Search in Google Scholar
[45] Malmquist S. Index numbers and indifference surfaces. Trabajos De Estadistica. 1953;4(2):209–42.10.1007/BF03006863Search in Google Scholar
[46] Jinfeng W, Chengdong X. Geodetector: Principle and prospective. Acta Geog Sin. 2017;72(1):116–34.Search in Google Scholar
[47] Cao F, Ge Y, Wang J-F. Optimal discretization for geographical detectors-based risk assessment. Gisci Remote Sens. 2013;50(1):78–92.10.1080/15481603.2013.778562Search in Google Scholar
[48] Gao J, Shao C, Chen S. Evolution and driving factors of the spatiotemporal pattern of tourism efficiency at the provincial level in China based on SBM-DEA model. Int J Environ Res Public Health. 2022;19(16):10118.10.3390/ijerph191610118Search in Google Scholar PubMed PubMed Central
[49] Hall CM. Constructing sustainable tourism development: The 2030 agenda and the managerial ecology of sustainable tourism. J Sustain Tour. 2019;27(7):1044–60.10.4324/9781003140542-12Search in Google Scholar
[50] Yunfeng P. Research on the spatio and temporal evolution and influencing factors of Xinjiang Tourism industry efficiency. Master thesis. Xinjiang: Xinjiang University; 2021.Search in Google Scholar
[51] Wanbo Z. Spatio-temporal evolution characteristics and influencing factors of tourism efficiency in Xinjiang. Master thesis. Xinjiang: Xinjiang University; 2021.Search in Google Scholar
[52] Le Y. Study on the evaluation of Xinjiang regional tourism efficiency and its spatiotemporal evolution. Master thesis. Xinjiang: Xinjiang University of Finance and Economics; 2020.Search in Google Scholar
© 2022 Yiwan Yang et al., published by De Gruyter
This work is licensed under the Creative Commons Attribution 4.0 International License.
Articles in the same Issue
- Regular Articles
- Study on observation system of seismic forward prospecting in tunnel: A case on tailrace tunnel of Wudongde hydropower station
- The behaviour of stress variation in sandy soil
- Research on the current situation of rural tourism in southern Fujian in China after the COVID-19 epidemic
- Late Triassic–Early Jurassic paleogeomorphic characteristics and hydrocarbon potential of the Ordos Basin, China, a case of study of the Jiyuan area
- Application of X-ray fluorescence mapping in turbiditic sandstones, Huai Bo Khong Formation of Nam Pat Group, Thailand
- Fractal expression of soil particle-size distribution at the basin scale
- Study on the changes in vegetation structural coverage and its response mechanism to hydrology
- Spatial distribution analysis of seismic activity based on GMI, LMI, and LISA in China
- Rock mass structural surface trace extraction based on transfer learning
- Hydrochemical characteristics and D–O–Sr isotopes of groundwater and surface water in the northern Longzi county of southern Tibet (southwestern China)
- Insights into origins of the natural gas in the Lower Paleozoic of Ordos basin, China
- Research on comprehensive benefits and reasonable selection of marine resources development types
- Embedded deformation of the rubble-mound foundation of gravity-type quay walls and influence factors
- Activation of Ad Damm shear zone, western Saudi Arabian margin, and its relation to the Red Sea rift system
- A mathematical conjecture associates Martian TARs with sand ripples
- Study on spatio-temporal characteristics of earthquakes in southwest China based on z-value
- Sedimentary facies characterization of forced regression in the Pearl River Mouth basin
- High-precision remote sensing mapping of aeolian sand landforms based on deep learning algorithms
- Experimental study on reservoir characteristics and oil-bearing properties of Chang 7 lacustrine oil shale in Yan’an area, China
- Estimating the volume of the 1978 Rissa quick clay landslide in Central Norway using historical aerial imagery
- Spatial accessibility between commercial and ecological spaces: A case study in Beijing, China
- Curve number estimation using rainfall and runoff data from five catchments in Sudan
- Urban green service equity in Xiamen based on network analysis and concentration degree of resources
- Spatio-temporal analysis of East Asian seismic zones based on multifractal theory
- Delineation of structural lineaments of Southeast Nigeria using high resolution aeromagnetic data
- 3D marine controlled-source electromagnetic modeling using an edge-based finite element method with a block Krylov iterative solver
- A comprehensive evaluation method for topographic correction model of remote sensing image based on entropy weight method
- Quantitative discrimination of the influences of climate change and human activity on rocky desertification based on a novel feature space model
- Assessment of climatic conditions for tourism in Xinjiang, China
- Attractiveness index of national marine parks: A study on national marine parks in coastal areas of East China Sea
- Effect of brackish water irrigation on the movement of water and salt in salinized soil
- Mapping paddy rice and rice phenology with Sentinel-1 SAR time series using a unified dynamic programming framework
- Analyzing the characteristics of land use distribution in typical village transects at Chinese Loess Plateau based on topographical factors
- Management status and policy direction of submerged marine debris for improvement of port environment in Korea
- Influence of Three Gorges Dam on earthquakes based on GRACE gravity field
- Comparative study of estimating the Curie point depth and heat flow using potential magnetic data
- The spatial prediction and optimization of production-living-ecological space based on Markov–PLUS model: A case study of Yunnan Province
- Major, trace and platinum-group element geochemistry of harzburgites and chromitites from Fuchuan, China, and its geological significance
- Vertical distribution of STN and STP in watershed of loess hilly region
- Hyperspectral denoising based on the principal component low-rank tensor decomposition
- Evaluation of fractures using conventional and FMI logs, and 3D seismic interpretation in continental tight sandstone reservoir
- U–Pb zircon dating of the Paleoproterozoic khondalite series in the northeastern Helanshan region and its geological significance
- Quantitatively determine the dominant driving factors of the spatial-temporal changes of vegetation-impacts of global change and human activity
- Can cultural tourism resources become a development feature helping rural areas to revitalize the local economy under the epidemic? An exploration of the perspective of attractiveness, satisfaction, and willingness by the revisit of Hakka cultural tourism
- A 3D empirical model of standard compaction curve for Thailand shales: Porosity in function of burial depth and geological time
- Attribution identification of terrestrial ecosystem evolution in the Yellow River Basin
- An intelligent approach for reservoir quality evaluation in tight sandstone reservoir using gradient boosting decision tree algorithm
- Detection of sub-surface fractures based on filtering, modeling, and interpreting aeromagnetic data in the Deng Deng – Garga Sarali area, Eastern Cameroon
- Influence of heterogeneity on fluid property variations in carbonate reservoirs with multistage hydrocarbon accumulation: A case study of the Khasib formation, Cretaceous, AB oilfield, southern Iraq
- Designing teaching materials with disaster maps and evaluating its effectiveness for primary students
- Assessment of the bender element sensors to measure seismic wave velocity of soils in the physical model
- Appropriated protection time and region for Qinghai–Tibet Plateau grassland
- Identification of high-temperature targets in remote sensing based on correspondence analysis
- Influence of differential diagenesis on pore evolution of the sandy conglomerate reservoir in different structural units: A case study of the Upper Permian Wutonggou Formation in eastern Junggar Basin, NW China
- Planting in ecologically solidified soil and its use
- National and regional-scale landslide indicators and indexes: Applications in Italy
- Occurrence of yttrium in the Zhijin phosphorus deposit in Guizhou Province, China
- The response of Chudao’s beach to typhoon “Lekima” (No. 1909)
- Soil wind erosion resistance analysis for soft rock and sand compound soil: A case study for the Mu Us Sandy Land, China
- Investigation into the pore structures and CH4 adsorption capacities of clay minerals in coal reservoirs in the Yangquan Mining District, North China
- Overview of eco-environmental impact of Xiaolangdi Water Conservancy Hub on the Yellow River
- Response of extreme precipitation to climatic warming in the Weihe river basin, China and its mechanism
- Analysis of land use change on urban landscape patterns in Northwest China: A case study of Xi’an city
- Optimization of interpolation parameters based on statistical experiment
- Late Cretaceous adakitic intrusive rocks in the Laimailang area, Gangdese batholith: Implications for the Neo-Tethyan Ocean subduction
- Tectonic evolution of the Eocene–Oligocene Lushi Basin in the eastern Qinling belt, Central China: Insights from paleomagnetic constraints
- Geographic and cartographic inconsistency factors among different cropland classification datasets: A field validation case in Cambodia
- Distribution of large- and medium-scale loess landslides induced by the Haiyuan Earthquake in 1920 based on field investigation and interpretation of satellite images
- Numerical simulation of impact and entrainment behaviors of debris flow by using SPH–DEM–FEM coupling method
- Study on the evaluation method and application of logging irreducible water saturation in tight sandstone reservoirs
- Geochemical characteristics and genesis of natural gas in the Upper Triassic Xujiahe Formation in the Sichuan Basin
- Wehrlite xenoliths and petrogenetic implications, Hosséré Do Guessa volcano, Adamawa plateau, Cameroon
- Changes in landscape pattern and ecological service value as land use evolves in the Manas River Basin
- Spatial structure-preserving and conflict-avoiding methods for point settlement selection
- Fission characteristics of heavy metal intrusion into rocks based on hydrolysis
- Sequence stratigraphic filling model of the Cretaceous in the western Tabei Uplift, Tarim Basin, NW China
- Fractal analysis of structural characteristics and prospecting of the Luanchuan polymetallic mining district, China
- Spatial and temporal variations of vegetation coverage and their driving factors following gully control and land consolidation in Loess Plateau, China
- Assessing the tourist potential of cultural–historical spatial units of Serbia using comparative application of AHP and mathematical method
- Urban black and odorous water body mapping from Gaofen-2 images
- Geochronology and geochemistry of Early Cretaceous granitic plutons in northern Great Xing’an Range, NE China, and implications for geodynamic setting
- Spatial planning concept for flood prevention in the Kedurus River watershed
- Geophysical exploration and geological appraisal of the Siah Diq porphyry Cu–Au prospect: A recent discovery in the Chagai volcano magmatic arc, SW Pakistan
- Possibility of using the DInSAR method in the development of vertical crustal movements with Sentinel-1 data
- Using modified inverse distance weight and principal component analysis for spatial interpolation of foundation settlement based on geodetic observations
- Geochemical properties and heavy metal contents of carbonaceous rocks in the Pliocene siliciclastic rock sequence from southeastern Denizli-Turkey
- Study on water regime assessment and prediction of stream flow based on an improved RVA
- A new method to explore the abnormal space of urban hidden dangers under epidemic outbreak and its prevention and control: A case study of Jinan City
- Milankovitch cycles and the astronomical time scale of the Zhujiang Formation in the Baiyun Sag, Pearl River Mouth Basin, China
- Shear strength and meso-pore characteristic of saturated compacted loess
- Key point extraction method for spatial objects in high-resolution remote sensing images based on multi-hot cross-entropy loss
- Identifying driving factors of the runoff coefficient based on the geographic detector model in the upper reaches of Huaihe River Basin
- Study on rainfall early warning model for Xiangmi Lake slope based on unsaturated soil mechanics
- Extraction of mineralized indicator minerals using ensemble learning model optimized by SSA based on hyperspectral image
- Lithofacies discrimination using seismic anisotropic attributes from logging data in Muglad Basin, South Sudan
- Three-dimensional modeling of loose layers based on stratum development law
- Occurrence, sources, and potential risk of polycyclic aromatic hydrocarbons in southern Xinjiang, China
- Attribution analysis of different driving forces on vegetation and streamflow variation in the Jialing River Basin, China
- Slope characteristics of urban construction land and its correlation with ground slope in China
- Limitations of the Yang’s breaking wave force formula and its improvement under a wider range of breaker conditions
- The spatial-temporal pattern evolution and influencing factors of county-scale tourism efficiency in Xinjiang, China
- Evaluation and analysis of observed soil temperature data over Northwest China
- Agriculture and aquaculture land-use change prediction in five central coastal provinces of Vietnam using ANN, SVR, and SARIMA models
- Leaf color attributes of urban colored-leaf plants
- Application of statistical and machine learning techniques for landslide susceptibility mapping in the Himalayan road corridors
- Sediment provenance in the Northern South China Sea since the Late Miocene
- Drones applications for smart cities: Monitoring palm trees and street lights
- Double rupture event in the Tianshan Mountains: A case study of the 2021 Mw 5.3 Baicheng earthquake, NW China
- Review Article
- Mobile phone indoor scene features recognition localization method based on semantic constraint of building map location anchor
- Technical Note
- Experimental analysis on creep mechanics of unsaturated soil based on empirical model
- Rapid Communications
- A protocol for canopy cover monitoring on forest restoration projects using low-cost drones
- Landscape tree species recognition using RedEdge-MX: Suitability analysis of two different texture extraction forms under MLC and RF supervision
- Special Issue: Geoethics 2022 - Part I
- Geomorphological and hydrological heritage of Mt. Stara Planina in SE Serbia: From river protection initiative to potential geotouristic destination
- Geotourism and geoethics as support for rural development in the Knjaževac municipality, Serbia
- Modeling spa destination choice for leveraging hydrogeothermal potentials in Serbia