Forest cover assessment using remote-sensing techniques in Crete Island, Greece
-
Mohamed Elhag
 ,
Silevna Boteva
,
Silevna Boteva

Abstract
Remote-sensing satellite images provided rapid and continuous spectral and spatial information of the land surface in the Sougia River catchment by identifying the major changes that have taken place over 20 years (1995–2015). Vegetation indices (VIs) of normalized difference vegetation index (NDVI), enhanced vegetation index (EVI) and leaf area index were derived for monitoring and mapping variations in vegetation cover. The quantified decrease in NDVI was found to be 4% between 1995 and 2005, and further decreased by 77.1% between 2005 and 2015; it declined back to almost the initial status of 1995. EVI results were inconsistent suggesting that seasonal crops influence the temporal distribution of vegetation cover. The temporal variations in the VIs were important input parameters for the modelling and management of the catchment’s hydrological behaviour. Image classification found that the 4- and the 6-class classifications between 1995 and 2005 were unstable and produced, respectively, a 13.8% and 16.2% total change between classes. Meanwhile, the 8-, 10- and the 12-class showed an almost horizontal line with a minor fluctuation of less than 0.05%. The results of the post-classification change detection analysis indicated a land degradation in terms of natural vegetation losses with sparser or even with no natural vegetation cover.
1 Introduction
In several Mediterranean countries, integrated catchment management is further restricted by a lack of quality and quantity of appropriate data as well as insufficient capacity in human resources [1,2]. Such issues create challenges and so it is even more important to develop tools that could be used to define and apply the policies and strategies at least at the regional scale to effectively deal with catchment management problems. The main tool in this regard is a catchment hydrological model [3,4] developed within the framework of the driving forces pressures state impacts responses [5,6].
Catchment areas and their proper management have become a major issue of concern for resource managers worldwide. This growing level of concern was prompted by an increase in the number of major catchment areas being deteriorated by flooding and soil erosion [7,8,9,10,11]. These and other catchment problems are not only isolated in solving water management issues but also include engineering, biophysical, economic, social, environmental, political and institutional issues. Resolving these problems requires the integration of interdisciplinary organizations for acquiring all necessary resources.
Satellite remote-sensing technology has come a long way since the launch of the world’s first satellite, Sputnik, in 1957. In 1972, Landsat Multi-spectral Scanner System, a high spatial resolution satellite was launched and the use of its data that became widely available enabled significant advances in the field of earth monitoring [12]. In 1984, spatial, geometrical and radiometric resolutions were significantly enhanced with the launch of Landsat-4 and its thematic mapper (TM) sensor. Since then, consecutive developments of Landsat series kept on going ever since until the existence of Landsat Operational Land Imager (OLI)-8 and other sensors.
Since the launch of Landsat and generally medium spatial resolution satellites for monitoring vegetation, the application of remote sensing in land use mapping has increasingly gained recognition. Consequently, the remote-sensing applications in land management and forest fire mapping, which are achieved using various spatial resolutions in more adequate environmental monitoring [13,14,15,16].
For land management, data on reflective, thermal and dielectric properties of the Earth’s surface can be provided using a variety of sensors [17,18]. On the other hand, in the case of forest cover, remote-sensing techniques measure vegetational variables indirectly; and hence, the electromagnetic variables have to be related to the vegetation variables empirically or with transfer functions. Additionally, in the case of vegetation models that are not structured to receive and directly analyse remotely sensed data, advanced computer hardware and software have to be used for imagery storage, analysis and interpretation [19,20].
Land degradation is a major concern due to the degradation that undermines the productive capacity of an ecosystem. Moreover, it affects the global climate through alterations in the balance of water and energy and disruptions in the cycle of carbon, nitrogen, sulphur and other elements [21,22]. Through its impact on agricultural productivity and environment, soil degradation leads to political and social instability, enhanced rate of deforestation, intensive use of marginal and fragile lands, accelerated overland flow, runoff and soil erosion, pollution of natural waters and emission of natural greenhouse gases into the atmosphere. In fact, land degradation affects the mere activities of mankind [23,24].
Vegetation indices (VIs) are mathematical representations of band ratios conducted from remote-sensing data on the pixel level that monitors a certain condition of the vegetation condition, foliage, cover and phenology [25,26,27,28]. Consequently, the conducted VIs must be calibrated using ground truth data to ensure the data validity for the long-term monitoring of natural vegetation assessments integrated with the edaphic-related processes [29,30,31]. The different VIs were extensively implemented in various vegetation parameter estimation such as fractional vegetation cover, leaf area index (LAI), water supply vegetation index, crop water shortage index, and drought severity index [25,32].
The objectives of the present research are to develop a probabilistic vegetation loss model as well as the identification and spatial quantification of priority areas for soil erosion protection and the finding of the optimal soil conservation techniques to manage them. The land use land cover (LULC) map reflects the forest degradation process and its status aspect. Considering the consequences cited above, land cover degradation is regarded as a serious environmental issue and there is a need for immediate action to stop and/or to reduce the processes of land degradation. This can be done by assessment followed by the management of degraded areas.
2 Materials and methods
2.1 Study area description
Greece is a Mediterranean country with serious soil erosion problems related to land degradation. In Greece, based on the Coordination Of Information On The Environment (CORINE) data set assessment [33], high and moderate actual soil erosion risks represent 20% and 38% of the total area of the country, respectively [34]. Within Greece, the land degradation processes are more active in the islands because of the additional effect of overpopulation mainly during the summer period [35].
The work reported was carried out in Sougia river watershed located in the western part of Crete island about 40 km south of Chania (Figure 1). The area covered by the watershed lies between Longitude 23°56′E and Latitude 35°22′N. The climate is the sub-humid Mediterranean with mild to cold winters in the high altitudes. The annual rainfall is about 955 mm, most of it falls in autumn, winter and early spring, while the summers are quite dry. The mean air temperature is about 17°C, with January and July being the coldest and the warmest months, respectively. The dominant land use is rangeland and occupies about 42% of the total study watershed [36]. It is divided into two sub-categories: open shrubs occupying 28% of them and a mixed vegetation dominance of medium to a high density of shrubs occupying the rest. The second land use category is that of the olive groves which occupy almost 14% of the total study area. The forest cover is counted for 26% of the total designated study area and almost 23% of those forests are categorized as an open forest where the crown cover is ranging from 10% to 40%. The latter is used as rangeland and only the remaining (3%) represents coniferous forest with medium to high density. The remaining 18% of the total area represents bare rock (9%), riverine vegetation (2%), arable land (6.6%) and urban (0.3%) areas [37].
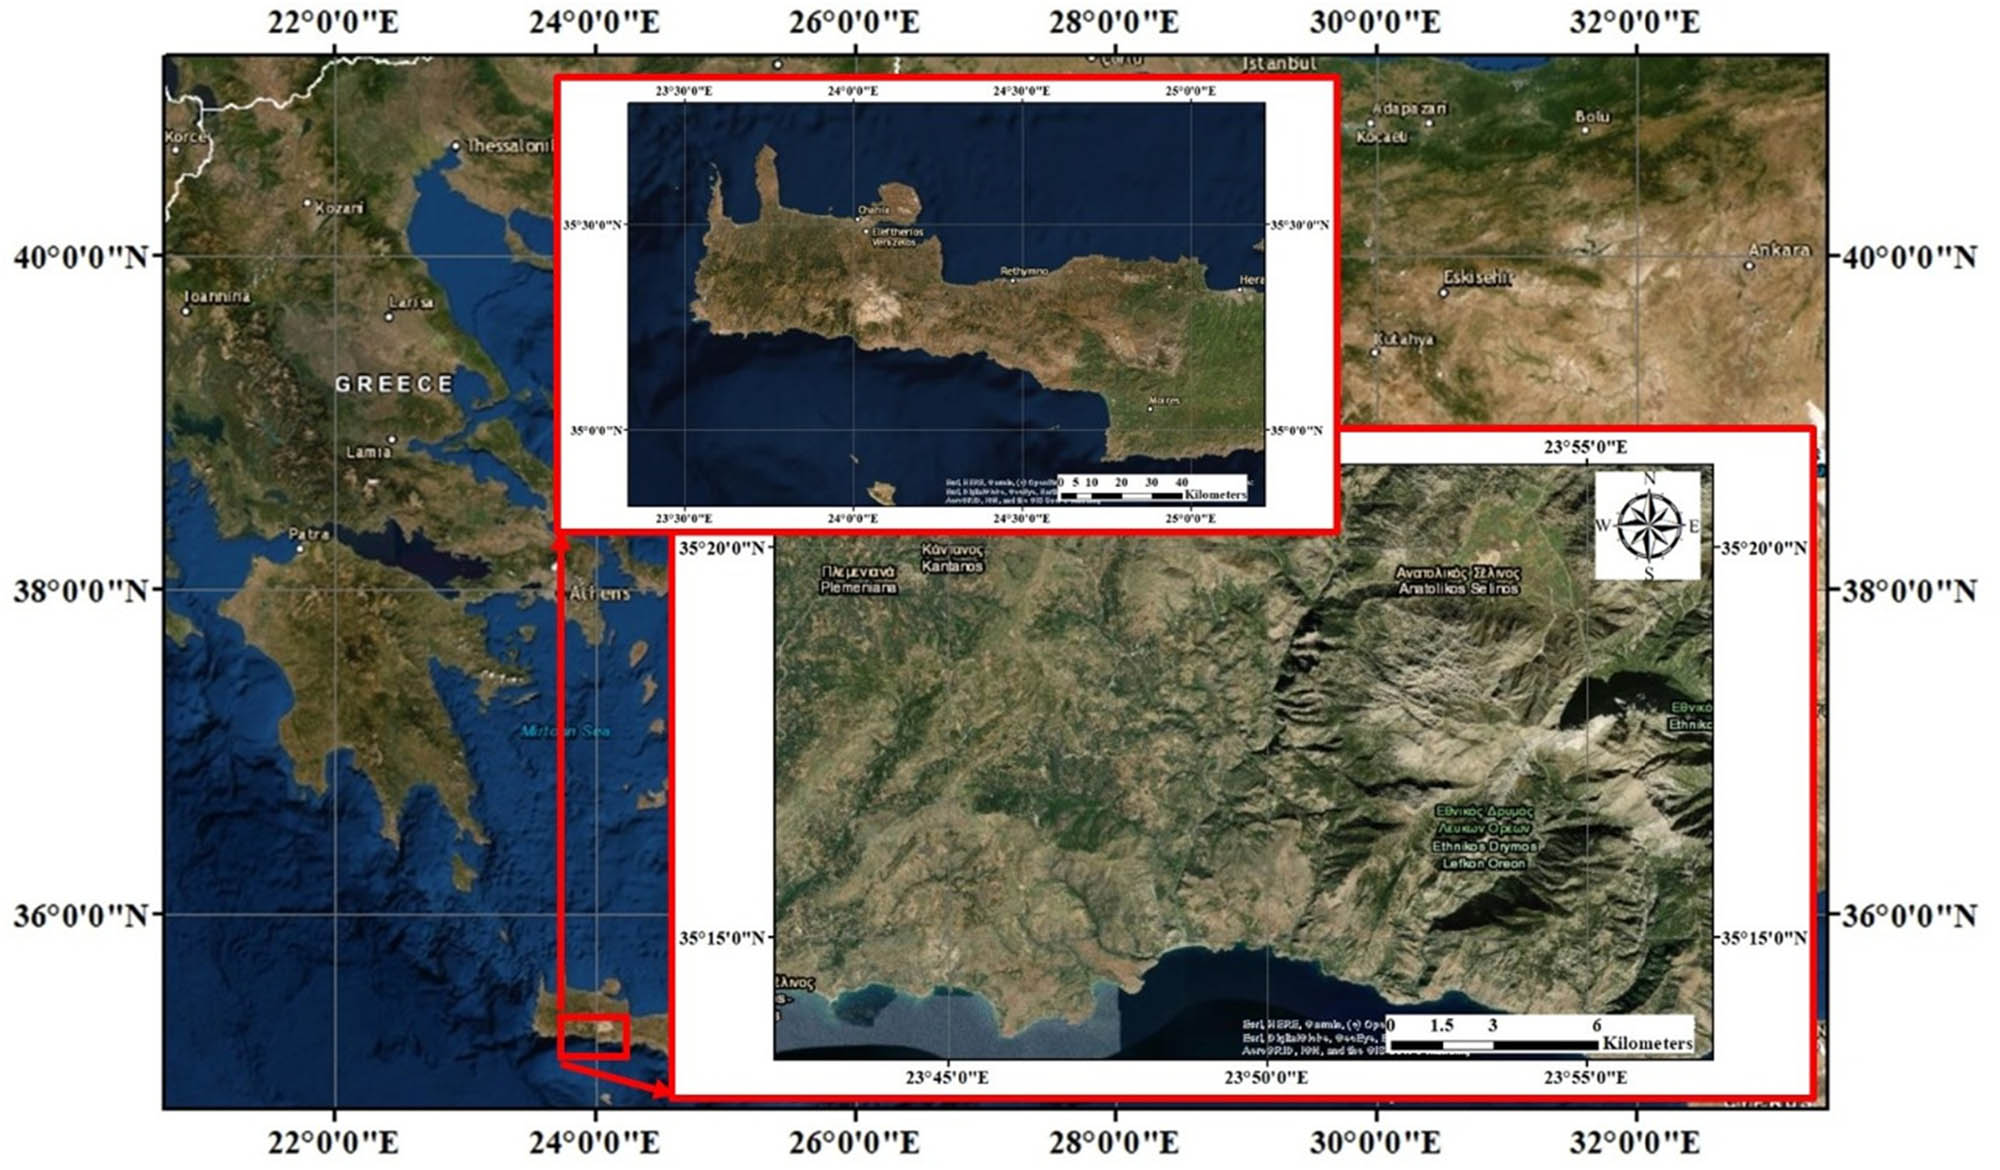
Location of the Sougia catchment, Crete island, Greece.
2.2 Remote-sensing data
The cloud-free images were acquired from the earth observation satellites in 10-year intervals, starting from 1995 and lasting for three decades. In particular, images were available from the Landsat series for land cover mapping since they provide multi-spectral data at 30 m resolution and spatially enhanced 15 m resolution for OLI-8. Besides, moderate resolution imaging spectroradiometer (MODIS) (MOD13Q1) images of 250 m resolution were selected to analyze the vegetation patterns deriving VIs.
2.3 Remote-sensing data pre-processing
Pre-processing of satellite images before image classification and change detection is essential. This is due to the inherent errors such as line dropout, stripping noise, distraction spatial and spectral, coordinate projections encountered in the remote-sensing data acquisition process that change digital values. If not corrected before classification or change detection, misclassification can occur or even areas identified as “transformed” will not represent real changes. Consequently, image processing systems and geographic information system (GIS) could be used to correct these errors by applying functions such as radiometric and geometric, normalization, image registration and masking.
The radiometric correction of the time series images was carried out following Song et al. [38]. The geometric correction was carried out according to Singh [39]. A relative calibration between image dates can be performed by applying a band-by-band linear transformation to one image date to “calibrate” it to the second date [40]. Accurate geometric registration of a multi-temporal image set, with root mean square error (RMSE) of 0.25–0.5 pixels or 1 pixel at the most, is necessary for accurate change detection [41,42,43]. Generally, atmospheric correction is performed to minimize scattering and absorption effects due to the atmosphere. To facilitate these procedures, several algorithms have been developed to correct variations in atmospheric transmission. Dark pixel regression adjustment is the adopted method in the current research and carried out according to Lu et al. [44].
The Terra MODIS images were first projected to UTM WGS 84 North, for consistency with the Landsat data. Then the images were corrected/adjusted for brightness with normalization techniques, adjusting them for better correlation. Sub-setting followed, focusing on the area of interest using the catchment boundary to trim the images [45].
2.4 Conceptual framework and data processing
To assess the LULC instabilities of the catchment, several environmental phenomena need to be considered. These phenomena were derived from remote-sensing data to comprehend inter-phenomena relationships.
2.4.1 Vegetation indices
The VIs such as normalized difference vegetation index (NDVI), enhanced vegetation index (EVI) and LAI were derived from remotely sensed data to aid in understanding the vegetation cover impacts on the catchment system. The NDVI [46] was derived from Landsat data, and MODIS data were used as an optimized index. EVI [47] was derived from MODIS time series data and were used to map and identify vegetation changes in the catchment. LAI [48,49] was derived using the Landsat NDVI derivatives to categorize the study area vegetation cover.
where NIR is the near-infrared atmospherically corrected band, R is the red atmospherically corrected band, B is the blue atmospherically corrected band, and C1, C2 and L are coefficients to correct for the atmospheric condition of MODIS EVI product, L = 1, C 1 = 6 and C 2 = 7.5.
The NDVI images for each of the Landsat images acquired were created as illustrated in the schematic in Figure 2 where the associated histograms show the NDVI peak point for each year, respectively. The NDVI values ranged from (−1) to (+1) and were coded to unsigned 8-bit data to reduce the size of the data files and speed up the processing time [50]. Therefore, the NDVI value of (−1) is represented by 0 and the NDVI value of (+1) by 255 in the new coded images (NDVI coded). This led to a reduced image size compared to the original one. The NIR band and the NDVI images were useful to distinguish the vegetated areas and the soil areas. The NDVI results are listed in Table 1 and an explanation of the NDVI value range was provided according to Riva et al. [51].
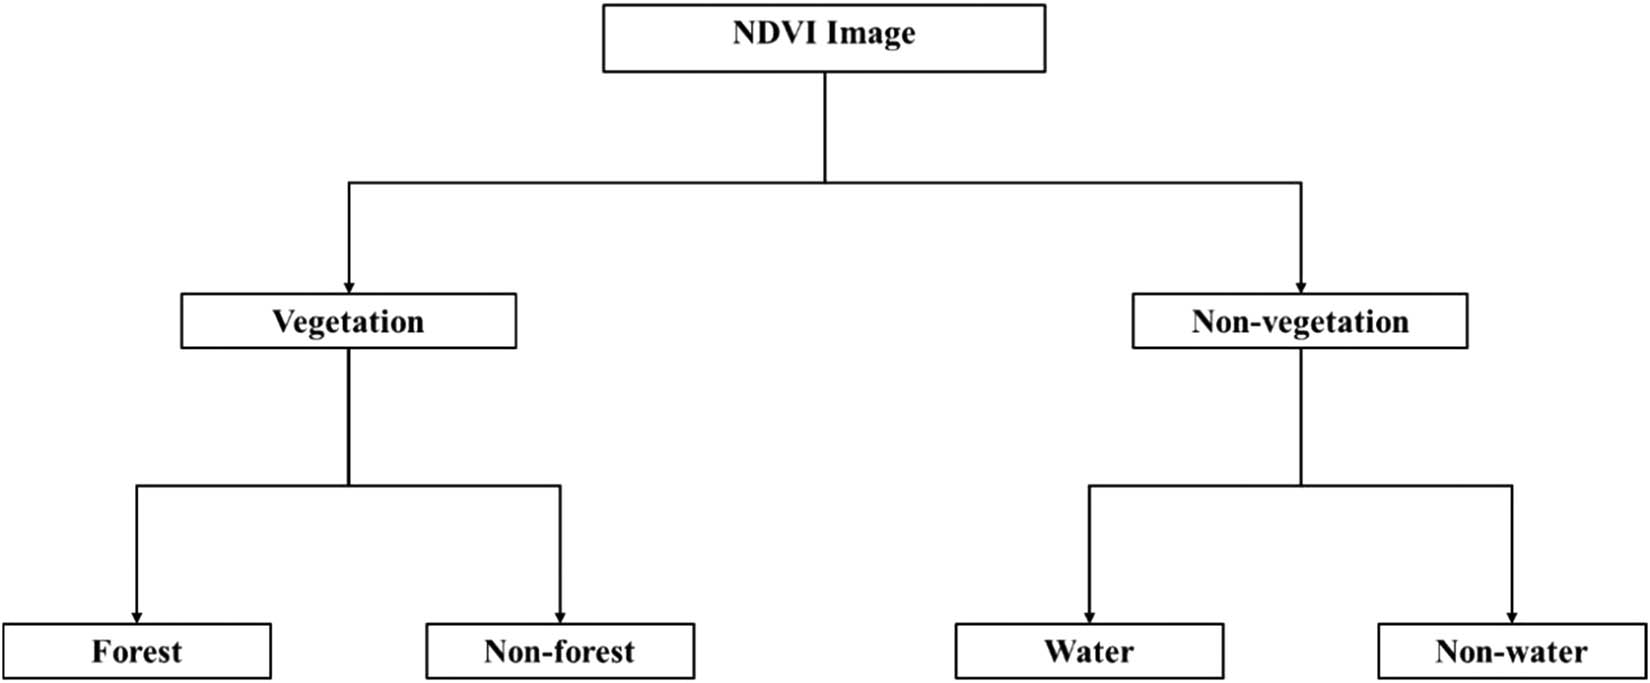
Hierarchical tree structure, showing the normalized difference vegetation index layer distinguished into vegetation and non-vegetation.
Normalized difference vegetation index change detection between 1995 and 2005, 2005 and 2015 and 1995 and 2015
| Year | Land cover type | LAI change | % LAI change |
|---|---|---|---|
| 1995–2005 | Forest | −0.11 | −4.06 |
| Agriculture | +0.27 | 43.50 | |
| Scrub and or herbaceous associations | +0.01 | 1.28 | |
| 2005–2015 | Forest | +0.53 | 16.93 |
| Agriculture | −0.28 | −45.16 | |
| Scrub and or herbaceous associations | +0.02 | 2.50 | |
| 1995–2015 | Forest | +0.42 | 13.42 |
| Agriculture | −0.01 | −2.86 | |
| Scrub and or herbaceous associations | +0.03 | 3.75 |
Minus and plus signs indicate, respectively, reductions and increases in vegetation cover.
LAI: leaf area index.
2.4.2 Land cover classification and accuracy
Land cover classification results depend to a great extent on the number of classes selected. Fewer class numbers with aggregated pixels of a wide spectral range represent different land cover types that coexist in one class. Thus, the resulted classes are a mixture of major land cover types and such classification is very coarse. On the other hand, a large number of classes can result in the same land cover type being represented with more than one class. Support vector machine (SVM) classification algorithm is the adopted classifier in the current research. SVM is performed according to Dong et al. [52] to the two-layer neural net using the following inner product kernel:
where
The classified areas on the produced land cover maps were compared with the actual land cover categories determined from CORINE maps. The classes that do not match the ground truthing CORINE classes are considered inaccurate. The selected sample areas of each cluster matched well with the associated land cover types in the ground truth data. K
hat statistics is an accuracy measure agreement. This measure of agreement is based on Congalton and Mead [53] findings. It is defined as the maximum likelihood estimation from the multinomial distribution.
where r is the number of rows and columns in the error matrix, x ii is the number of observations in row i and column i (the diagonal elements), x i+ is the marginal total of row i, x +i is the marginal total of column i, and N is the total number of observations in the matrix.
2.4.3 Forests change detection
Post-classification comparison is one technique used for change detection, where images are compared at the pixel level [54]. Using this method, it is possible to see directly which classes have changed into what class. This method was used herein and the changes in images between (a) 1995 and 2005, (b) 2005 and 2015 and (c) 1995 and 2015 were identified. The NDVI images derived from the 1995 Landsat TM were used to map forest and non-forest areas. The involved methodology is illustrated in Figure 3 and consists of discriminating between vegetation and non-vegetation regions using the threshold values on the NDVI images. Further discrimination of non-vegetation into water and non-water areas was not undertaken as the aim here was to detect and map forest areas alone from the NDVI image.
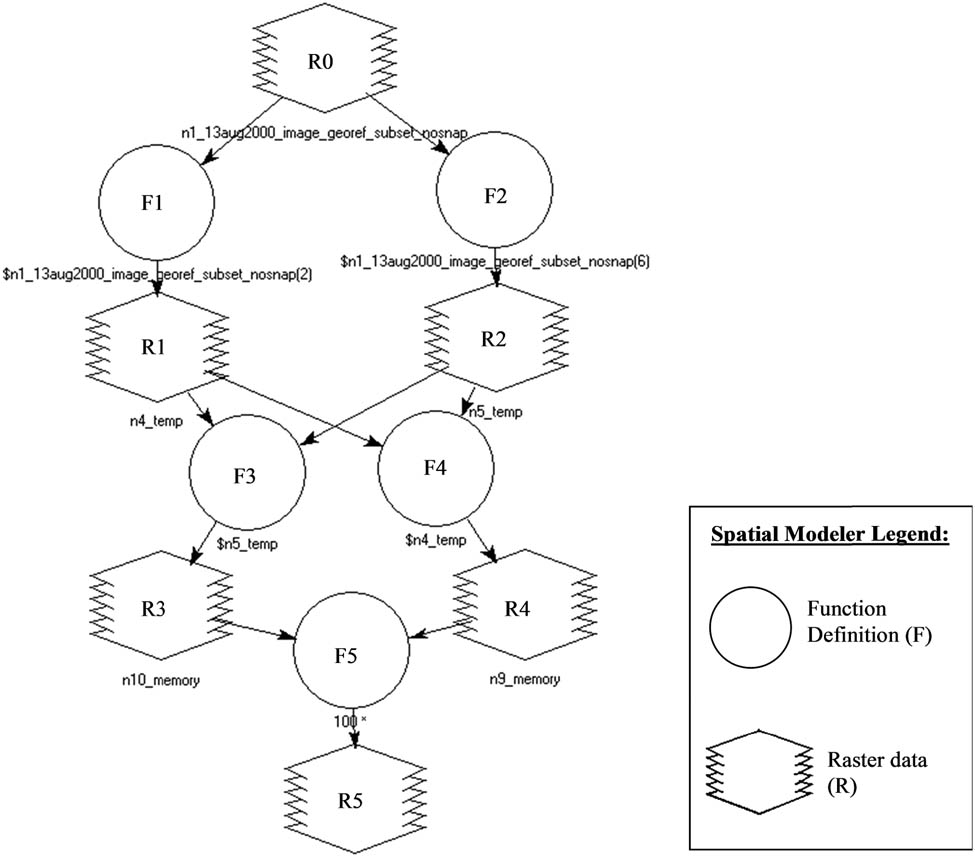
Schematic illustration of the created bare soil index model. Where R0 = 13 August 2015 georeferenced and subset, R1, F1 = OLI-3 Float; R2, F2 = OLI-7 Float; R3, F3 = (OLI-7 – OLI-3) Float; R4, F4 = (OLI-7 + OLI-3) Float; R5, F5 = 100 * (OLI-7 – OLI-3)/(OLI-7 + OLI-3) + 100.
2.4.4 Soil erosion potential
Different bare soil indices have been developed for multi-spectral imagery using combination and relationships of bands. The bare soil index (BSI) was satisfactorily developed and implemented by Nandy et al. [55]. An improved BSI model was created as illustrated schematically in Figure 4 and was applied to the Landsat OLI-8 imagery acquired on 13 August 2015.
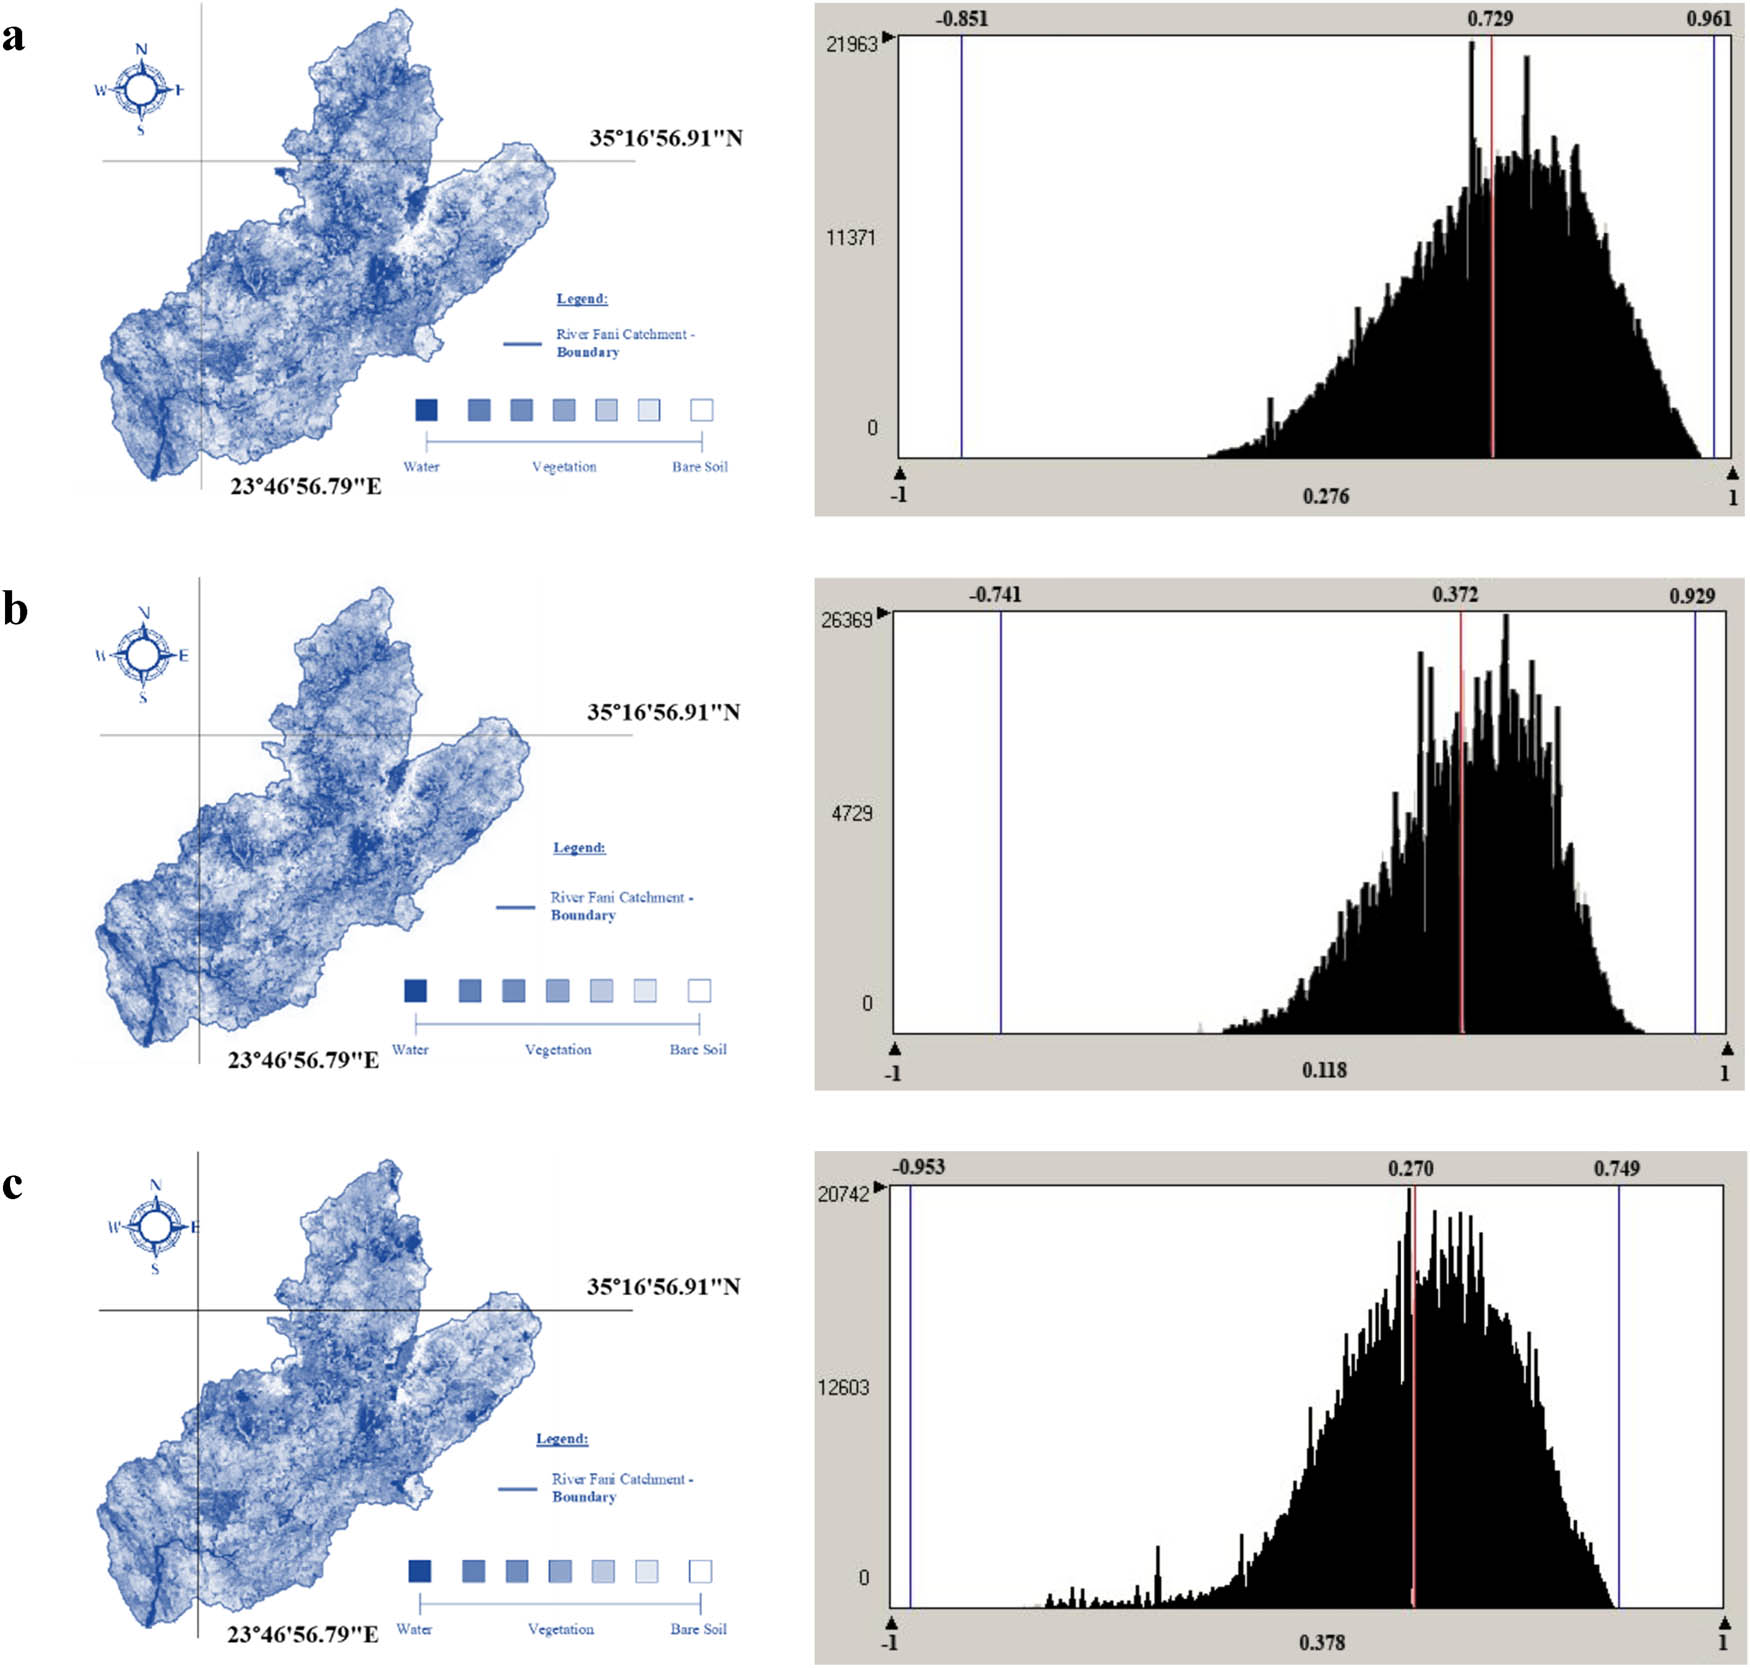
Normalized difference vegetation index (NDVI) derived from the temporal Landsat imagery (a–c) for the catchment and the corresponding NDVI histogram for the acquisition dates of 1995, 2005 and 2015, respectively.
The values of the BSI model vary from 0 to 77. A definition of threshold values was needed to successfully apply the BSI based on a Structured Query Language applied to the resulted images [56,57].
3 Results and discussion
3.1 Vegetation indices
Visual interpretation of the images shows that the 1995 NDVI image of Sougia catchment is much brighter (higher values) than the 2005 NDVI image [58]. This indicates that the 1995 image has more vegetation cover. A comparison between the 2005 and the 2015 NDVI images shows again that the 2005 image has brighter values than the 2015 image, but some darker areas appear as well. These observations imply that vegetation has significantly decreased between 1995 and 2005 and continued to decrease in 2015, with some minor areas showing slightly increased vegetation.
The results obtained from the NDVI analysis correspond to the visual interpretation. It was found that the 1995 image has the highest NDVI value of 0.43, which according to Table 1 represents dense vegetation canopy, whereas the NDVI value of the 2005 image was slightly lower at 0.38. This corresponds to a 12% reduction in vegetation cover from 1995 to 2005. The NDVI value of 2015 was further decreased to 0.27 which corresponds to a 29% reduction in vegetation cover.
The NDVI value by Chen et al. [59] is associated with shrub and grassland but does not mean that the forests have disappeared completely from the catchment and only shrub and grassland exist but rather shows that forests and dense vegetation have been reduced and therefore the associated reduction in the mean NDVI value. The decrease in NDVI values between the years suggests a reduction in the vegetation cover in the catchment. The expected results reinforce the allegations of local people as well as enhance the deforestation issues documented by different authors [28,60]. Deforestation is an important change that has the potential to alter water infiltration and runoff and should, therefore, be further examined. Visual comparison of the three NDVI images gives a good indication of the vegetation cover changes from 1995 to 2015.
Figure 5 shows the EVI for December 2010 instead of winter 2010, because data for January and February were not available. The black pixels show no vegetation cover, which increases in the greyscale to white, indicating the highest vegetation cover. The winter images are noticeably darker than the spring ones; the autumn images are likewise darker than the images acquired during the summer season. This indicates that the brighter summer images have higher vegetation cover in comparison with the winter satellite images.
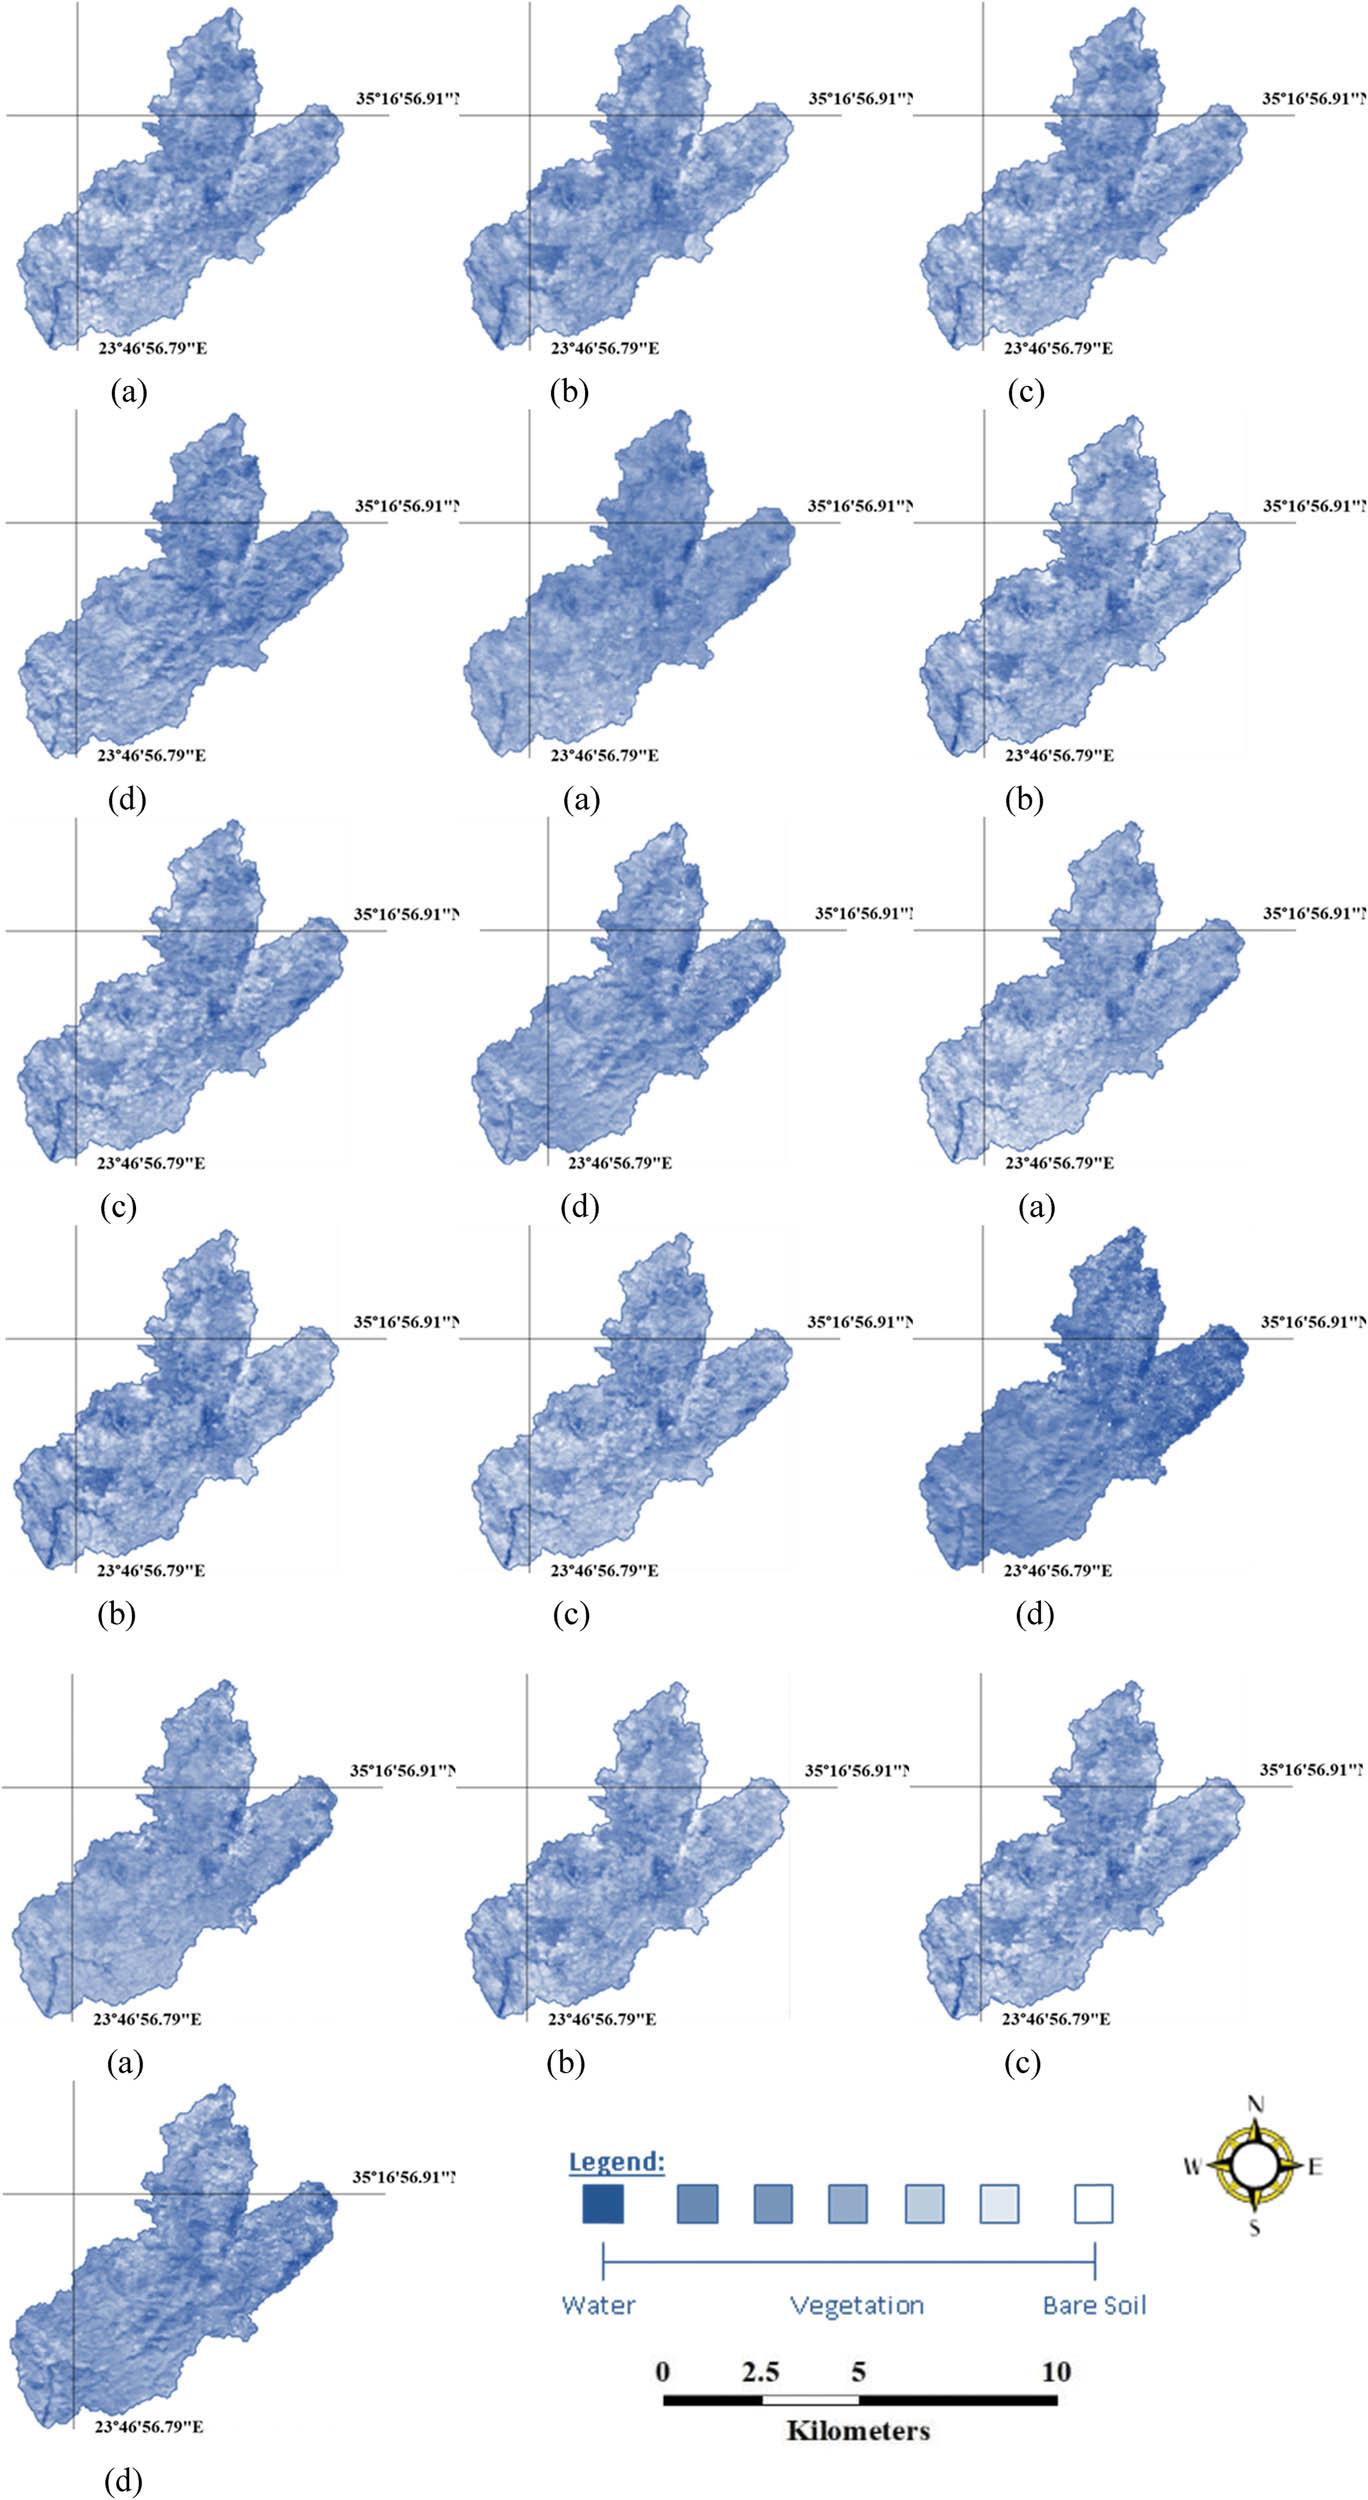
MODIS seasonal enhanced vegetation index for 2010–2013, showing vegetation strength. (a) Spring 2010–2013, (b) Summer 2010–2013, (c) Autumn 2010–2013 and (d) Winter 2010–2013.
The respective EVI histograms illustrated in Figure 6 clearly show this. However, for a Mediterranean catchment, a typical vegetation trend should have revealed higher vegetation cover in winter and lower in the dry summer period. This behaviour is satisfied with ancillary information which reveals that the Mediterranean region is an agricultural territory and farming practices are the main source of employment [61,62].
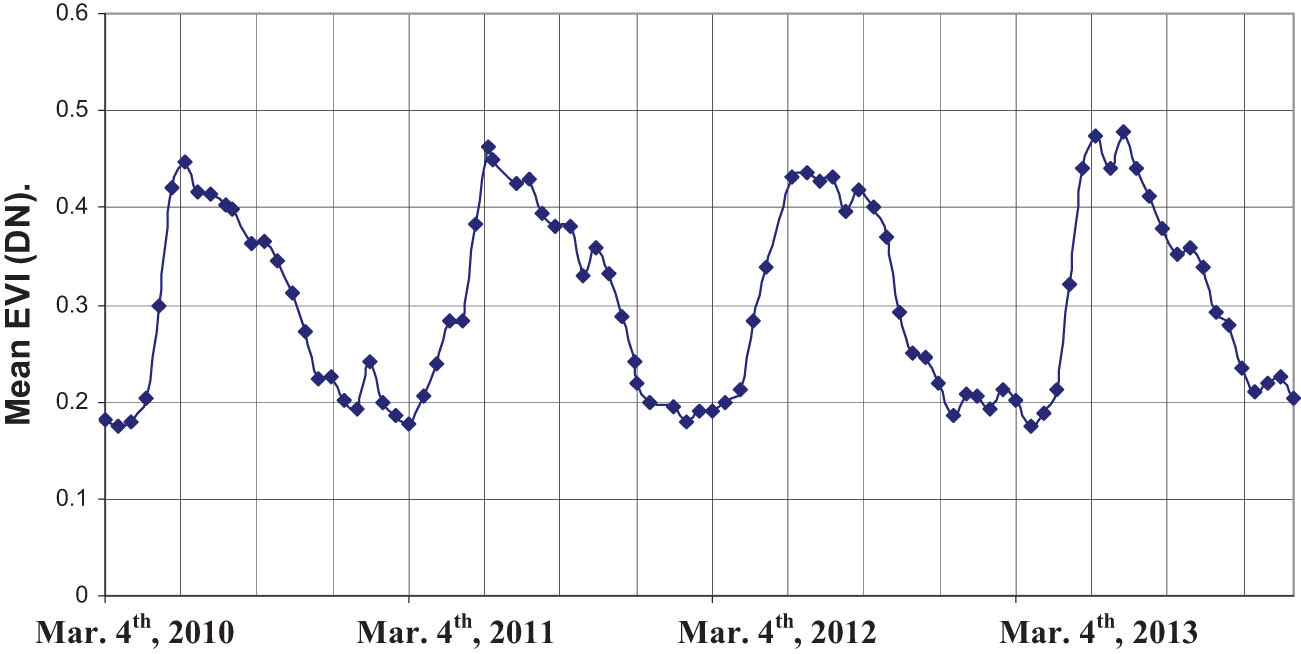
Variation in the 16-day mean enhanced vegetation index of the catchment spanning from 2010 to 2013.
The mean EVI results oscillate between 0.18 (winter) and 0.48 (summer). During the summer, the mean EVI values range from 0.36 to 0.48 and gradually decrease during autumn to reach their minimum values in winter (values range from 0.18 to 0.24). The values gradually increase again during spring producing repetitive seasonal cycles, with each set of seasons giving a similar peak. The minor fluctuations recorded during the successive yearly cycles are due to the changes in weather conditions [28,63].
These results suggest that in winter where the peak of the precipitation occurs in the mountainous Mediterranean catchment, the EVI is at its lower value which suggests very low vegetation (large areas with bare soil). On the contrary, summer EVI values are at its peak, suggesting dense vegetation canopy which could be justified by cultivated crops.
The seasonal variations in vegetation cover in the catchment are observed to be comparatively similar for the period 2010‒2013 (Figure 5), with the maximum values reached in June. The exception is shown on the 2013 summer EVI maximum values which are reached during July. From 2010 to 2013, no significant changes occurred in the vegetation cover except for some small fluctuations and a minor increase in the EVI values.
The results of the LAI analysis were illustrated in Table 2. Typically, LAI values range from 0 for the bare ground to 6 m2 m−2 for dense forest. The highest LAI value is 3.13 m2 m−2 for mixed forests within the catchment area during 2015. Mixed forests according to the LAI obtained were decreased during the transition from 1995 to 2005 and then increased by 2015. A 77.1% increase in agriculture was recorded between 1995 and 2005. By 2015, it declined back to the status it used to be in 1995. The scrub and or herbaceous associations show an almost constant LAI value with small increments from 1995 to 2005 and 2015. A small decrease in the forest was noted between 1995 and 2005, and by 2015 a 20.4% increase is observed. Pinty et al. [64] suggested that VIs reach a saturation level with higher LAI values. Gitelson et al. [65] explain that when LAI exceeds 2, NDVI is generally insensitive to LAI not only in forests canopies with a dense understory but also in grasses, cereal crops and broadleaf crops [66,67]. They also report that the linkage between surface reflectance and LAI is not straightforward and at present, it appears that no satisfactory algorithm exists for remote retrieval of moderate to high LAI (LAI > 2). If this is the case, then the LAI results for the forest canopies might have been affected.
Leaf area index (LAI) results for the major land cover types in the catchment
| Image acquisition date | LAI (m2 m−2) forest | LAI (m2 m−2) agriculture | LAI (m2 m−2) scrub and or herbaceous associations |
|---|---|---|---|
| 10/09/1995 | 2.71 | 0.35 | 0.77 |
| 30/09/2005 | 2.60 | 0.62 | 0.78 |
| 13/08/2015 | 3.13 | 0.34 | 0.80 |
3.2 Land cover classification
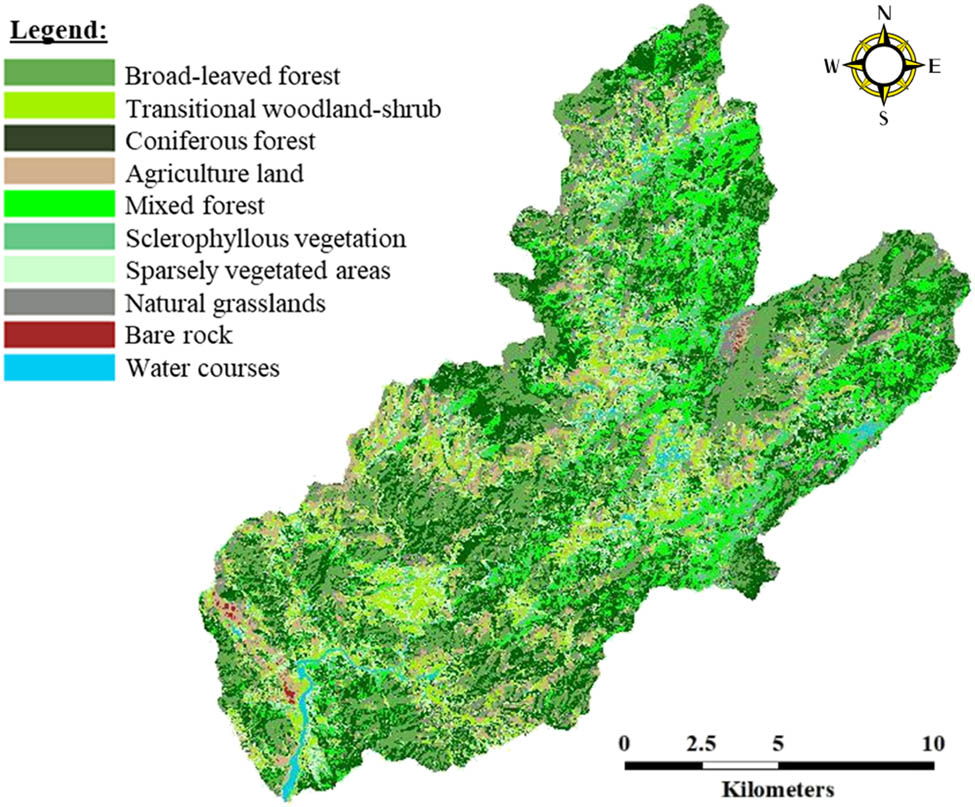
Land cover maps have been created for the catchment from the classification techniques applied to the remote-sensing data (Figures 7–9). The area of each land cover class for all three maps was calculated (in km2 and %) and is presented in Table 3. The results indicate significant land cover changes between the different classes in the catchment from 1995 to 2005 and 2015. In particular, the reduction of the coniferous forests between 1995 and 2015 is evident and an increase in natural grassland for the same period. The summary of the accuracy assessments is shown in Table 4.
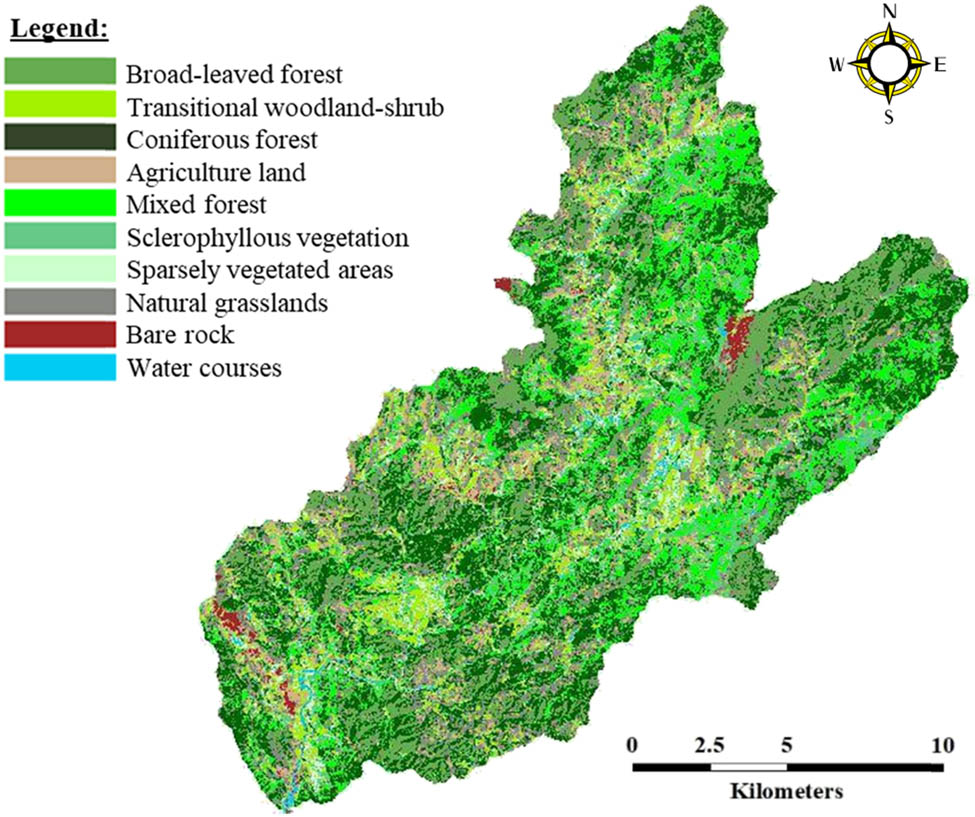
Land Use Land Cover classes of the catchment in 1995.
Land Use Land Cover classes of the catchment in 2005.
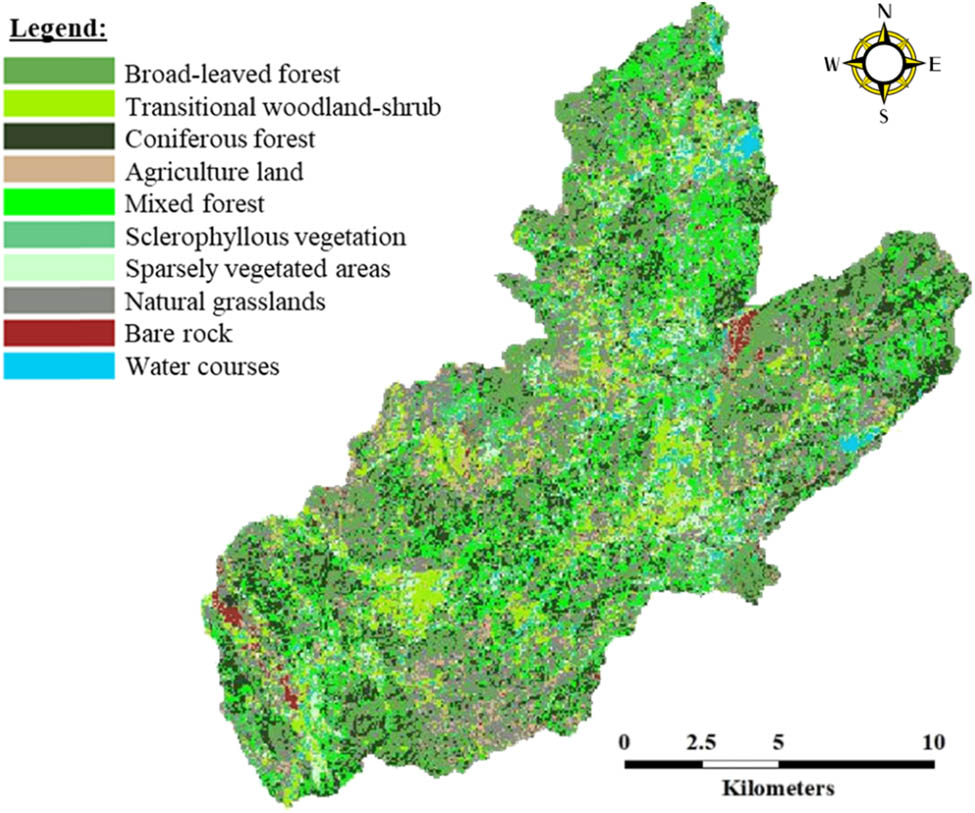
Land Use Land Cover classes of the catchment in 2015.
Land cover classes of the Landsat data series of the catchment and their associated area covered in square kilometres and percentage values
| Land cover | 1995 | 2005 | 2015 | |||
|---|---|---|---|---|---|---|
| Area (km2) | Area (%) | Area (km2) | Area (%) | Area (km2) | Area (%) | |
| Broad-leaved forest | 158.45 | 15.01 | 193.55 | 18.33 | 194.48 | 18.42 |
| Transitional woodland shrub | 92.52 | 8.76 | 105.38 | 9.98 | 104.73 | 9.92 |
| Coniferous forest | 281.09 | 26.63 | 285.49 | 27.04 | 135.60 | 12.84 |
| Land occupied by agriculture | 66.28 | 6.28 | 69.82 | 6.61 | 47.22 | 4.47 |
| Mixed forest | 141.54 | 13.41 | 121.47 | 11.51 | 161.28 | 15.28 |
| Sclerophyllous vegetation | 98.70 | 9.35 | 72.88 | 6.90 | 101.07 | 9.57 |
| Sparsely vegetated areas | 42.22 | 4.00 | 108.68 | 10.29 | 60.84 | 5.76 |
| Natural grasslands | 157.29 | 14.90 | 84.78 | 8.03 | 227.60 | 21.56 |
| Bare rock | 10.14 | 0.96 | 1.35 | 0.13 | 9.51 | 0.90 |
| Water courses | 7.45 | 0.71 | 12.28 | 1.16 | 13.37 | 1.27 |
| SUM | 1055.68 | 100 | 1055.68 | 100 | 1055.68 | 100 |
Overall accuracies and Kappa statistics of support vector machine classification algorithm
| Year of acquisition | 1995 | 2005 | 2015 | |||
|---|---|---|---|---|---|---|
| Classification algorithm | Overall | Kappa | Overall | Kappa | Overall | Kappa |
| Support vector machine | 87.77% | 0.8421 | 93.12% | 0.9141 | 95.27% | 0.9393 |
The ground truthing based solely on CORINE LULC maps would unavoidably encompass a degree of error. This is because CORINE LULC maps were generated from remote-sensing data/information; and consequently, some generalization techniques would entail certain degree of error which will unavoidably propagate through the ground truthing of the land cover classification results [33,68]. Owing to this, further validation of the land cover classification results was carried based on the knowledge of the area after found control points collected within the catchment and from the use of photographs and ancillary maps of the area which aided in the identifying key point areas. The comparison of image classes shows the spatial improvement in the classification accuracy of the Landsat images which resulted from proper pixel training and cluster number optimization [69]. Ground truthing, given the time and equipment at the time, could have been conducted based on a GPS, a task that would improve the confidence levels in land cover classification results [70].
3.3 Forest change detection
A comparison between the 1995, 2005 and 2015 land cover classes as can be seen in Table 5. It is quite revealing that changes occurred during the study duration. Reductions in the first six classes and increases in the remaining four classes can have an adverse effect on the vegetation cover processes of the catchment in terms of forest densities. From the first six categories, significant reduction is observed in the coniferous forest cover of the year 2015 compared to 1995 (−14%). Additionally, in the latter four categories, a significant increase is observed in natural grassland (between 1995 and 2015) which is equivalent to approximately 7%.
Change detection between the 10 land use classes of the catchment
| Land use | 1995–2005 | 2005–2015 | 1995–2015 | |||
|---|---|---|---|---|---|---|
| Area diff. (km2) | Area diff. (%) | Area diff. (km2) | Area diff. (%) | Area diff. (km2) | Area diff. (%) | |
| Broad-leaved forest | 35.09 | 3.32 | 0.93 | 0.09 | 36.03 | 3.41 |
| Transitional woodland-shrub | 12.86 | 1.22 | −0.65 | −0.06 | 12.21 | 1.16 |
| Coniferous forest | 4.40 | 0.42 | −149.89 | −14.20 | −145.49 | −13.78 |
| Land used for agriculture | 3.54 | 0.34 | −22.60 | −2.14 | −19.06 | −1.81 |
| Mixed forest | −20.06 | −1.90 | 39.81 | 3.77 | 19.74 | 1.87 |
| Sclerophyllous vegetation | −25.82 | −2.45 | 28.19 | 2.67 | 2.37 | 0.22 |
| Sparsely vegetated areas | 66.46 | 6.30 | −47.84 | −4.53 | 18.62 | 1.76 |
| Natural grasslands | −72.51 | −6.87 | 142.82 | 13.53 | 70.31 | 6.66 |
| Bare rock | −8.79 | −0.83 | 8.15 | 0.77 | −0.63 | −0.06 |
| Water courses | 4.83 | 0.46 | 1.09 | 0.10 | 5.92 | 0.56 |
3.4 Bare soil index
The different pixels were tested on known water and vegetation areas and some approximate threshold values were identified. The BSI values for the catchment were between 0 and 40 water, shadows, between 40 and 80 for grass and vegetation and more than 90 indicates bare soil types [71,72]. Nevertheless, because the threshold values had not been calibrated at this point, the BSI image in Figure 10 shows high vegetation in dark blue areas while, the bare soils were expressed in light blue and white. The catchment is between low and medium erosion vulnerability. Approximately, the half eastern part of the catchment has low erosion, whereas the other part has medium erosion vulnerability.
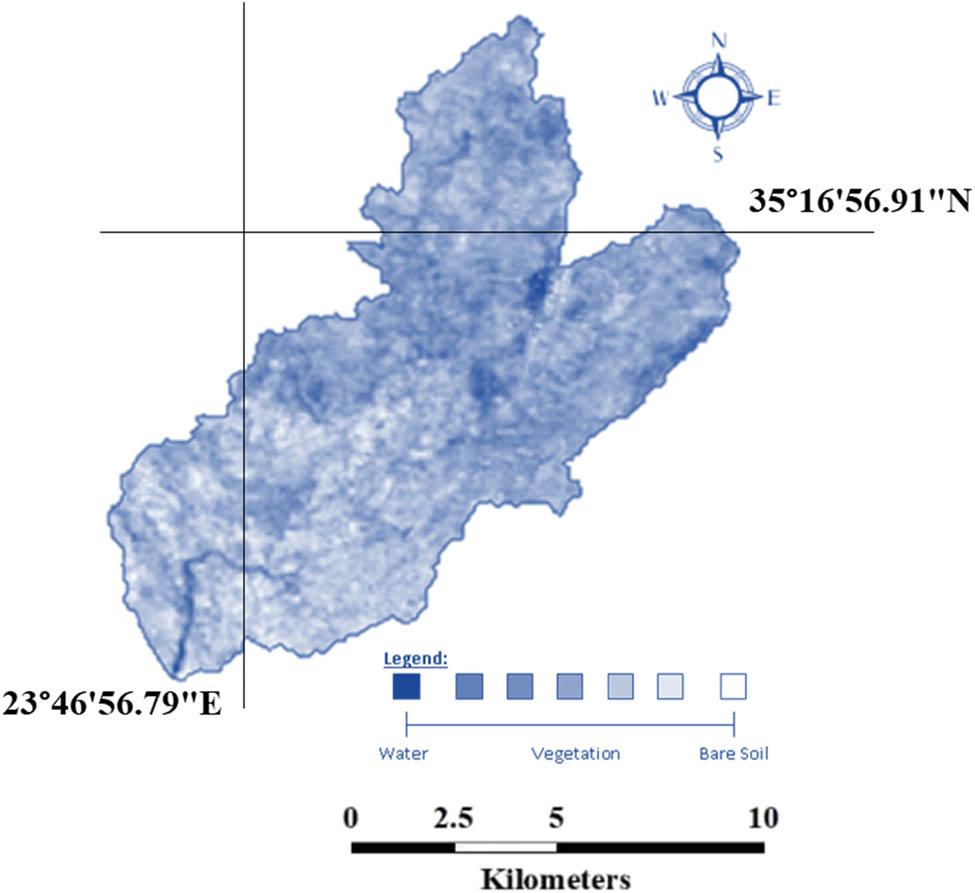
Bare soil index of the designated study area.
Selecting an optimum number of classes in land cover classification was crucial. Not only it would facilitate a better description of the catchment’s different land cover classes but would also aid in giving better and more detailed results in changes among classes between the years in the post-classification change detection. A small number of classes are more generalized as each class can be a mixture of different smaller classes and consequently, post-classification will result in large changes that are not representative of the actual ones and which cannot be discriminated. On the other hand, many classes could result in a too-detailed situation where changes would be quite small and unnecessary and could result in time-consuming procedures [73,74]. Therefore, the sensitivity of 4, 6, 8, 10 and 12 classes was tested on the 1995 and 2015 images and was found that a 10-class is optimum to be used for the catchment.
Spatio-temporal changes in the different land cover classes were investigated with change detection analysis. In the analysis, the actual Catchment area was decreased by a small number of pixels. This was due to clouds covering some areas in the 2015 OLI image that were masked before delineating land cover areas. Consequently, for correct correlation and accurate comparison of the land cover classes of the Catchment, the 1995 and the 2005 image were masked to the same area used on the 2015 image. The decreased total catchment area used for change detection did not affect in any way the calculations. On the contrary, the area and the percentage of each land cover class of the catchment were comparable for all three images [75].
4 Conclusions and recommendations
The Sougia river watershed was chosen because the watershed is typical of many other upland areas of Crete in terms of topography, relief and land use; therefore, the information on land degradation assessment would be useful for other similar watersheds of Crete. Remote-sensing use was imperative for this study in deriving VIs, mapping and characterizing the spatio-temporal land cover distribution, mapping BSI and in identifying the major changes which have taken place over 20 years (1995–2015) in the catchment. VIs of NDVI, EVI and LAI were derived for monitoring and mapping variations in vegetation cover. Three thematic NDVI maps and their corresponding histograms were created. The NDVI results suggest that a gradual decrease in vegetation cover occurred in the Catchment from 1995 to 2015, with 1995 having the highest mean NDVI value. The quantified decrease was found to be 4% between 1995 and 2005 and 7% between 2005 and 2015. LAI values were calculated for the forest, agriculture and scrubs and/or herbaceous associations. It was found that between 1995 and 2005, the agriculture was increased by 77.1%, and by 2015, it declined back to the status it used to be in 1995. Nevertheless, the LAI results obtained for the forest cover are prone to variations due to the high LAI and its linkage to surface reflectance. The NDVI becomes insensitive to LAI when LAI exceeds 2 m2 m−2. The EVI-time series of 16-day composites and the seasonal means show a comparable repeated seasonal behaviour with low winter values and higher values in summer. EVI results are inconsistent suggesting that seasonal crops influence the temporal distribution of vegetation cover. The results have shed light on deforestation effects that have contributed to the soil erosion and flooding problems in the catchment. The temporal dynamic changes of the research findings are important input parameters for the hydrological modelling and management of the catchment. In particular, the impact of land cover changes on the catchment runoff, which is of major interest. Application of the Landsat images interpretation and GIS can provide effective and efficient tools to reveal useful information on forest conditions and its distribution across the landscape. Data on the LULCs are necessary for further environmental studies and helpful for applying policies such as watershed management.
Acknowledgements
This project was funded by the Deanship of Scientific Research (DSR), King Abdulaziz University, Jeddah, under grant no. (G-71-155-1441). The authors, therefore, acknowledge with thanks DSR technical and financial support.
-
Conflict of interest: The authors declare no conflicts of interest.
References
[1] Batchelor C. Improving water use efficiency as part of integrated catchment management. Agric Water Manag. 1999;40:249–63.10.1016/S0378-3774(98)00125-5Search in Google Scholar
[2] Hughes AO, Quinn JM. Before and after integrated catchment management in a headwater catchment: changes in water quality. Environ Manag. 2014;54:1288–305.10.1007/s00267-014-0369-9Search in Google Scholar PubMed
[3] Farid HU, Mahmood-Khan Z, Ali A, Mubeen M, Anjum MN. Site-specific aquifer characterization and identification of potential groundwater areas in Pakistan. Pol J Environ Stud. 2017;26(1):17–27.10.15244/pjoes/64645Search in Google Scholar
[4] Farid HU, Mahmood-Khan Z, Ahmad I, Shakoor A, Anjum MN, Iqbal MM, et al. Estimation of infiltration models parameters and their comparison to simulate the onsite soil infiltration characteristics. Int J Agric Biol Eng. 2019;12:84–91.10.25165/j.ijabe.20191203.4015Search in Google Scholar
[5] Pirrone N, Trombino G, Cinnirella S, Algieri A, Bendoricchio G, Palmeri L. The driver-pressure-state-impact-response (DPSIR) approach for integrated catchment-coastal zone management: preliminary application to the Po catchment-Adriatic Sea coastal zone system. Reg Environ Change. 2005;5:111–37.10.1007/s10113-004-0092-9Search in Google Scholar
[6] Elhag M, Bahrawi JA. Consideration of geo-statistical analysis in soil pollution assessment caused by leachate breakout in the municipality of Thermi, Greece. Desalin Water Treat. 2016;57:27879–89.10.1080/19443994.2016.1168583Search in Google Scholar
[7] Ganoulis J. Risk-based floodplain management: A case study from Greece. Int J River Basin Manag. 2003;1:41–7.10.1080/15715124.2003.9635191Search in Google Scholar
[8] Gelsomino A, Badalucco L, Ambrosoli R, Crecchio C, Puglisi E, Meli SM. Changes in chemical and biological soil properties as induced by anthropogenic disturbance: A case study of an agricultural soil under recurrent flooding by wastewaters. Soil Biol Biochem. 2006;38:2069–80.10.1016/j.soilbio.2005.12.025Search in Google Scholar
[9] Malik I, Matyja M. Bank erosion history of a mountain stream determined by means of anatomical changes in exposed tree roots over the last 100 years (Bílá Opava River – Czech Republic). Geomorphology. 2008;98:126–42.10.1016/j.geomorph.2007.02.030Search in Google Scholar
[10] Pignatelli C, Sansò P, Mastronuzzi G. Evaluation of tsunami flooding using geomorphologic evidence. Mar Geol. 2009;260:6–18.10.1016/j.margeo.2009.01.002Search in Google Scholar
[11] Elhag M, Bahrawi JA. Potential rainwater harvesting improvement using advanced remote sensing applications. Sci World J. 2014;2014:806959.10.1155/2014/806959Search in Google Scholar PubMed PubMed Central
[12] Rogan J, Chen D. Remote sensing technology for mapping and monitoring land-cover and land-use change. Prog Plan. 2004;61:301–25.10.1016/S0305-9006(03)00066-7Search in Google Scholar
[13] Chuvieco E, Salas J, Vega C. Remote sensing and GIS for long-term fire risk mapping. A review of remote sensing methods for the study of large wildland fires. Alcalá de Henares, Spain; 1997. p. 91–108.Search in Google Scholar
[14] Franklin J, Woodcock CE, Warbington R. Multi-attribute vegetation maps of forest service lands in California supporting resource management decisions. Photogramm Eng Remote Sens. 2000;66:1209–18.Search in Google Scholar
[15] Foody GM. Remote sensing of tropical forest environments: towards the monitoring of environmental resources for sustainable development. Int J Remote Sens. 2003;24:4035–46.10.1080/0143116031000103853Search in Google Scholar
[16] Nese Y, Elhag M, Ülkühan Y. Consideration of phytoplankton composition and water quality of Anamur (Dragon) Creek, Turkey. Desalin Water Treat. 2017;91:386–94.10.5004/dwt.2017.20844Search in Google Scholar
[17] Shi J, Chen K-S, Li Q, Jackson TJ, O’Neill PE, Tsang L. A parameterized surface reflectivity model and estimation of bare-surface soil moisture with L-band radiometer. IEEE Trans Geosci Remote Sens. 2002;40:2674–86.10.1109/TGRS.2002.807003Search in Google Scholar
[18] Reddy GO. Satellite remote sensing sensors: principles and applications. Geospatial technologies in land resources mapping, monitoring and management. Berlin, Germany: Springer; 2018. p. 21–43.10.1007/978-3-319-78711-4_2Search in Google Scholar
[19] Elmore AJ, Mustard JF, Manning SJ, Lobell DB. Quantifying vegetation change in semiarid environments: precision and accuracy of spectral mixture analysis and the normalized difference vegetation index. Remote Sens Environ. 2000;73:87–102.10.1016/S0034-4257(00)00100-0Search in Google Scholar
[20] Elhag M. Sensitivity analysis assessment of remotely based vegetation indices to improve water resources management. Environ Dev Sustain. 2014;16:1209–22.10.1007/s10668-014-9522-0Search in Google Scholar
[21] Barbier EB. The economic linkages between rural poverty and land degradation: some evidence from Africa. Agric Ecosyst Environ. 2000;82:355–70.10.1016/S0167-8809(00)00237-1Search in Google Scholar
[22] Cowie AL, Orr BJ, Sanchez VM, Chasek P, Crossman ND, Erlewein A, et al. Land in balance: the scientific conceptual framework for land degradation neutrality. Environ Sci Policy. 2018;79:25–35.10.1016/j.envsci.2017.10.011Search in Google Scholar
[23] Johnson DL, Ambrose SH, Bassett TJ, Bowen ML, Crummey DE, Isaacson JS, et al. Meanings of environmental terms. J Environ Qual. 1997;26:581–9.10.2134/jeq1997.00472425002600030002xSearch in Google Scholar
[24] Obalum S, Chibuike G, Peth S, Ouyang Y. Soil organic matter as sole indicator of soil degradation. Environ Monit Assess. 2017;189:176.10.1007/s10661-017-5881-ySearch in Google Scholar PubMed
[25] Pettorelli N, Vik JO, Mysterud A, Gaillard J-M, Tucker CJ, Stenseth NC. Using the satellite-derived NDVI to assess ecological responses to environmental change. Trends Ecol & Evol. 2005;20:503–10.10.1016/j.tree.2005.05.011Search in Google Scholar PubMed
[26] Kerr JT, Ostrovsky M. From space to species: ecological applications for remote sensing. Trends Ecol Evol. 2003;18:299–305.10.1016/S0169-5347(03)00071-5Search in Google Scholar
[27] Huete A, Didan K, van Leeuwen W, Miura T, Glenn E. MODIS vegetation indices. Land remote sensing and global environmental change. Berlin, Germany: Springer; 2010. p. 579–602.10.1007/978-1-4419-6749-7_26Search in Google Scholar
[28] Elhag M, Yimaz N, Bahrawi J, Boteva S. Evaluation of optical remote sensing data in burned areas mapping of Thasos Island. Greece: Earth Systems and Environment; 2020.10.1007/s41748-020-00195-1Search in Google Scholar
[29] Glenn EP, Huete AR, Nagler PL, Nelson SG. Relationship between remotely-sensed vegetation indices, canopy attributes and plant physiological processes: What vegetation indices can and cannot tell us about the landscape. Sensors. 2008;8:2136–60.10.3390/s8042136Search in Google Scholar PubMed PubMed Central
[30] Chamling M, Bera B. Spatio-temporal patterns of land use/land cover change in the Bhutan–Bengal foothill region between 1987 and 2019: Study towards geospatial applications and policy making. Earth Syst Environ. 2020;4:117–30.10.1007/s41748-020-00150-0Search in Google Scholar
[31] Mukherjee F, Singh D. Assessing land use–land cover change and its impact on land surface temperature using LANDSAT data: a comparison of two urban areas in India. Earth Syst Environ. 2020;4:385–407.10.1007/s41748-020-00155-9Search in Google Scholar
[32] El-Shirbeny MA, Ali AM, Savin I, Poddubskiy A, Dokukin P. Agricultural water monitoring for water management under pivot irrigation system using spatial techniques. Earth Syst Environ. 2020.10.1007/s41748-020-00164-8Search in Google Scholar
[33] Feranec J, Jaffrain G, Soukup T, Hazeu G. Determining changes and flows in European landscapes 1990–2000 using CORINE land cover data. Appl Geogr. 2010;30:19–35.10.1016/j.apgeog.2009.07.003Search in Google Scholar
[34] Prasannakumar V, Vijith H, Abinod S, Geetha N. Estimation of soil erosion risk within a small mountainous sub-watershed in Kerala, India, using revised universal soil loss equation (RUSLE) and geo-information technology. Geosci Front. 2012;3:209–15.10.1016/j.gsf.2011.11.003Search in Google Scholar
[35] Elhag M, Yilmaz N. Insights of remote sensing data to surmount rainfall/runoff data limitations of the downstream catchment of Pineios River. Greece Environ Earth Sci. 2021;80:35.10.1007/s12665-020-09289-5Search in Google Scholar
[36] Elhag M, Bahrawi JA. Deliberation of hilly areas for water harvesting application in Western Crete, Greece. Glob Nest J. 2016;18:621–9.10.30955/gnj.001978Search in Google Scholar
[37] Elhag M, Yilmaz N, Dumitrache A. Post-fire fuel and vegetation dynamics in an ungrazed phryganic community of Crete, Greece. Appl Ecol Environ Res. 2018;16:3289–303.10.15666/aeer/1603_32893303Search in Google Scholar
[38] Song C, Woodcock CE, Seto KC, Lenney MP, Macomber SA. Classification and change detection using Landsat TM data: when and how to correct atmospheric effects? Remote Sens Environ. 2001;75:230–44.10.1016/S0034-4257(00)00169-3Search in Google Scholar
[39] Singh A. Review article digital change detection techniques using remotely-sensed data. Int J Remote Sens. 1989;10:989–1003.10.1080/01431168908903939Search in Google Scholar
[40] Caselles V, Lopez Garcia M. An alternative simple approach to estimate atmospheric correction in multitemporal studies. Int J Remote Sens. 1989;10:1127–34.10.1080/01431168908903951Search in Google Scholar
[41] Mouat DA, Mahin GG, Lancaster J. Remote sensing techniques in the analysis of change detection. Geocarto Int. 1993;8:39–50.10.1080/10106049309354407Search in Google Scholar
[42] Unger Holtz TS. Introductory digital image processing: A remote sensing perspective. Assoc Environ Eng Geol. 2007;13(1):89–90.10.2113/gseegeosci.13.1.89Search in Google Scholar
[43] Hussain S, Mubeen M, Akram W, Ahmad A, Habib-ur-Rahman M, Ghaffar A, et al. Study of land cover/land use changes using RS and GIS: a case study of Multan district, Pakistan. Environ Monit Assess. 2020;192:2.10.1007/s10661-019-7959-1Search in Google Scholar PubMed
[44] Lu D, Mausel P, Brondizio E, Moran E. Assessment of atmospheric correction methods for Landsat TM data applicable to Amazon basin LBA research. Int J Remote Sens. 2002;23:2651–71.10.1080/01431160110109642Search in Google Scholar
[45] Kashaigili J, Majaliwa A. Integrated assessment of land use and cover changes in the Malagarasi river catchment in Tanzania. Phys Chem Earth, Parts A/B/C. 2010;35:730–41.10.1016/j.pce.2010.07.030Search in Google Scholar
[46] Singh D. Evaluation of long-term NDVI time series derived from Landsat data through blending with MODIS data. Atmósfera. 2012;25:43–63.Search in Google Scholar
[47] Pan Y, Li L, Zhang J, Liang S, Zhu X, Sulla-Menashe D. Winter wheat area estimation from MODIS-EVI time series data using the crop proportion phenology index. Remote Sens Environ. 2012;119:232–42.10.1016/j.rse.2011.10.011Search in Google Scholar
[48] Hmimina G, Dufrêne E, Pontailler J-Y, Delpierre N, Aubinet M, Caquet B. Evaluation of the potential of MODIS satellite data to predict vegetation phenology in different biomes: An investigation using ground-based NDVI measurements. Remote Sens Environ. 2013;132:145–58.10.1016/j.rse.2013.01.010Search in Google Scholar
[49] Sultana SR, Ali A, Ahmad A, Mubeen M, Zia-Ul-Haq M, Ahmad S, et al. Normalized difference vegetation index as a tool for wheat yield estimation: a case study from Faisalabad, Pakistan. Sci World J. 2014;2014.10.1155/2014/725326Search in Google Scholar PubMed PubMed Central
[50] Senay G, Elliott R. Combining AVHRR-NDVI and landuse data to describe temporal and spatial dynamics of vegetation. For Ecol Manag. 2000;128:83–91.10.1016/S0378-1127(99)00275-3Search in Google Scholar
[51] Riva MJ, Daliakopoulos IN, Eckert S, Hodel E, Liniger H. Assessment of land degradation in Mediterranean forests and grazing lands using a landscape unit approach and the normalized difference vegetation index. Appl Geogr. 2017;86:8–21.10.1016/j.apgeog.2017.06.017Search in Google Scholar
[52] Dong L, Li X, Xie G. Nonlinear methodologies for identifying seismic event and nuclear explosion using random forest, support vector machine, and naive Bayes classification. Abstr Appl Anal. 2014;2014.10.1155/2014/459137Search in Google Scholar
[53] Congalton RG, Mead RA. A quantitative method to test for consistency and correctness in photointerpretation. Photogramm Eng Remote Sens. 1983;49:69–74.Search in Google Scholar
[54] Nichol J, Wong M. Satellite remote sensing for detailed landslide inventories using change detection and image fusion. Int J Remote Sens. 2005;26:1913–26.10.1080/01431160512331314047Search in Google Scholar
[55] Nandy S, Joshi P, Das K. Forest canopy density stratification using biophysical modeling. J Indian Soc Remote. 2003;31:291–7.10.1007/BF03007349Search in Google Scholar
[56] Goh P-C. A graphic query language for cartographic and land information systems. Int J Geogr Inf Syst. 1989;3:245–55.10.1080/02693798908941511Search in Google Scholar
[57] Elhag M, Bahrawi JA. Sedimentation mapping in shallow shoreline of arid environments using active remote sensing data. Nat Hazards. 2019;99:879–94.10.1007/s11069-019-03780-4Search in Google Scholar
[58] Hussain S, Mubeen M, Ahmad A, Akram W, Hammad HM, Ali M, et al. Using GIS tools to detect the land use/land cover changes during forty years in Lodhran District of Pakistan. Environ Sci Pollut Res. 2019;1–17.10.1007/s11356-019-06072-3Search in Google Scholar PubMed
[59] Chen P-Y, Fedosejevs G, Tiscareno-Lopez M, Arnold JG. Assessment of MODIS-EVI, MODIS-NDVI and VEGETATION-NDVI composite data using agricultural measurements: An example at corn fields in western Mexico. Environ Monit Assess. 2006;119:69–82.10.1007/s10661-005-9006-7Search in Google Scholar PubMed
[60] Hostert P, Röder A, Hill J. Coupling spectral unmixing and trend analysis for monitoring of long-term vegetation dynamics in Mediterranean rangelands. Remote Sens Environ. 2003;87:183–97.10.1016/S0034-4257(03)00145-7Search in Google Scholar
[61] Zalidis G, Stamatiadis S, Takavakoglou V, Eskridge K, Misopolinos N. Impacts of agricultural practices on soil and water quality in the Mediterranean region and proposed assessment methodology. Agric Ecosyst Environ. 2002;88:137–46.10.1016/S0167-8809(01)00249-3Search in Google Scholar
[62] Elhag M, Boteva S. Conceptual assessment of energy input-output analysis and data envelopment analysis of greenhouse crops in Crete Island, Greece. Environ Sci Pollut Res. 2019;26(35):35377–86.10.1007/s11356-019-05544-wSearch in Google Scholar PubMed
[63] Nastos P, Zerefos C. Spatial and temporal variability of consecutive dry and wet days in Greece. Atmos Res. 2009;94:616–28.10.1016/j.atmosres.2009.03.009Search in Google Scholar
[64] Pinty B, Leprieur C, Verstraete MM. Towards a quantitative interpretation of vegetation indices Part 1: Biophysical canopy properties and classical indices. Remote Sens Rev. 1993;7:127–50.10.1080/02757259309532171Search in Google Scholar
[65] Gitelson AA, Viña A, Arkebauer TJ, Rundquist DC, Keydan G, Leavitt B. Remote estimation of leaf area index and green leaf biomass in maize canopies. Geophys Res Lett. 2003;30(5):521–4.10.1029/2002GL016450Search in Google Scholar
[66] Myneni RB, Hall FG, Sellers PJ, Marshak AL. The interpretation of spectral vegetation indexes. IEEE Trans Geosci Remote Sens. 1995;33:481–6.10.1109/36.377948Search in Google Scholar
[67] Myneni RB, Ramakrishna R, Nemani R, Running SW. Estimation of global leaf area index and absorbed PAR using radiative transfer models. IEEE Trans Geosci Remote Sens. 1997;35:1380–93.10.1109/36.649788Search in Google Scholar
[68] Sari H, Ozsahin E. Spatiotemporal change in the LULC (Landuse/Landcover) characteristics of Tekirdag Province based on the CORINE (Thrace, Turkey). Fresenius Environ Bull. 2016;25:4694–707.Search in Google Scholar
[69] Omran MG, Engelbrecht AP, Salman A. Image classification using particle swarm optimization. Recent advances in simulated evolution and learning. Singapore: World Scientific; 2004. p. 347–65.10.1142/9789812561794_0019Search in Google Scholar
[70] Kloser R, Bax N, Ryan T, Williams A, Barker B. Remote sensing of seabed types in the Australian South East Fishery; development and application of normal incident acoustic techniques and associated’ground truthing’. Mar Freshw Res. 2001;52:475–89.10.1071/MF99181Search in Google Scholar
[71] Major D, Baret F, Guyot G. A ratio vegetation index adjusted for soil brightness. Int J Remote Sens. 1990;11:727–40.10.1080/01431169008955053Search in Google Scholar
[72] Piyoosh AK, Ghosh SK. Development of a modified bare soil and urban index for Landsat 8 satellite data. Geocarto Int. 2018;33:423–42.10.1080/10106049.2016.1273401Search in Google Scholar
[73] Drăguţ L, Blaschke T. Automated classification of landform elements using object-based image analysis. Geomorphology. 2006;81:330–44.10.1016/j.geomorph.2006.04.013Search in Google Scholar
[74] Alharthi A, El-Sheikh MA, Elhag M, Alatar AA, Abbadi GA, Abdel-Salam EM, et al. Remote sensing of 10 years changes in the vegetation cover of the northwestern coastal land of Red Sea, Saudi Arabia. Saudi. J Biol Sci. 2020;27:3169–79.10.1016/j.sjbs.2020.07.021Search in Google Scholar PubMed PubMed Central
[75] Elhag M. Consideration of Landsat-8 spectral band combination in typical mediterranean forest classification in Halkidiki, Greece. Open Geosci. 2017;9:468–79.10.1515/geo-2017-0036Search in Google Scholar
© 2021 Mohamed Elhag et al., published by De Gruyter
This work is licensed under the Creative Commons Attribution 4.0 International License.
Articles in the same Issue
- Regular Articles
- Lithopetrographic and geochemical features of the Saalian tills in the Szczerców outcrop (Poland) in various deformation settings
- Spatiotemporal change of land use for deceased in Beijing since the mid-twentieth century
- Geomorphological immaturity as a factor conditioning the dynamics of channel processes in Rządza River
- Modeling of dense well block point bar architecture based on geological vector information: A case study of the third member of Quantou Formation in Songliao Basin
- Predicting the gas resource potential in reservoir C-sand interval of Lower Goru Formation, Middle Indus Basin, Pakistan
- Study on the viscoelastic–viscoplastic model of layered siltstone using creep test and RBF neural network
- Assessment of Chlorophyll-a concentration from Sentinel-3 satellite images at the Mediterranean Sea using CMEMS open source in situ data
- Spatiotemporal evolution of single sandbodies controlled by allocyclicity and autocyclicity in the shallow-water braided river delta front of an open lacustrine basin
- Research and application of seismic porosity inversion method for carbonate reservoir based on Gassmann’s equation
- Impulse noise treatment in magnetotelluric inversion
- Application of multivariate regression on magnetic data to determine further drilling site for iron exploration
- Comparative application of photogrammetry, handmapping and android smartphone for geotechnical mapping and slope stability analysis
- Geochemistry of the black rock series of lower Cambrian Qiongzhusi Formation, SW Yangtze Block, China: Reconstruction of sedimentary and tectonic environments
- The timing of Barleik Formation and its implication for the Devonian tectonic evolution of Western Junggar, NW China
- Risk assessment of geological disasters in Nyingchi, Tibet
- Effect of microbial combination with organic fertilizer on Elymus dahuricus
- An OGC web service geospatial data semantic similarity model for improving geospatial service discovery
- Subsurface structure investigation of the United Arab Emirates using gravity data
- Shallow geophysical and hydrological investigations to identify groundwater contamination in Wadi Bani Malik dam area Jeddah, Saudi Arabia
- Consideration of hyperspectral data in intraspecific variation (spectrotaxonomy) in Prosopis juliflora (Sw.) DC, Saudi Arabia
- Characteristics and evaluation of the Upper Paleozoic source rocks in the Southern North China Basin
- Geospatial assessment of wetland soils for rice production in Ajibode using geospatial techniques
- Input/output inconsistencies of daily evapotranspiration conducted empirically using remote sensing data in arid environments
- Geotechnical profiling of a surface mine waste dump using 2D Wenner–Schlumberger configuration
- Forest cover assessment using remote-sensing techniques in Crete Island, Greece
- Stability of an abandoned siderite mine: A case study in northern Spain
- Assessment of the SWAT model in simulating watersheds in arid regions: Case study of the Yarmouk River Basin (Jordan)
- The spatial distribution characteristics of Nb–Ta of mafic rocks in subduction zones
- Comparison of hydrological model ensemble forecasting based on multiple members and ensemble methods
- Extraction of fractional vegetation cover in arid desert area based on Chinese GF-6 satellite
- Detection and modeling of soil salinity variations in arid lands using remote sensing data
- Monitoring and simulating the distribution of phytoplankton in constructed wetlands based on SPOT 6 images
- Is there an equality in the spatial distribution of urban vitality: A case study of Wuhan in China
- Considering the geological significance in data preprocessing and improving the prediction accuracy of hot springs by deep learning
- Comparing LiDAR and SfM digital surface models for three land cover types
- East Asian monsoon during the past 10,000 years recorded by grain size of Yangtze River delta
- Influence of diagenetic features on petrophysical properties of fine-grained rocks of Oligocene strata in the Lower Indus Basin, Pakistan
- Impact of wall movements on the location of passive Earth thrust
- Ecological risk assessment of toxic metal pollution in the industrial zone on the northern slope of the East Tianshan Mountains in Xinjiang, NW China
- Seasonal color matching method of ornamental plants in urban landscape construction
- Influence of interbedded rock association and fracture characteristics on gas accumulation in the lower Silurian Shiniulan formation, Northern Guizhou Province
- Spatiotemporal variation in groundwater level within the Manas River Basin, Northwest China: Relative impacts of natural and human factors
- GIS and geographical analysis of the main harbors in the world
- Laboratory test and numerical simulation of composite geomembrane leakage in plain reservoir
- Structural deformation characteristics of the Lower Yangtze area in South China and its structural physical simulation experiments
- Analysis on vegetation cover changes and the driving factors in the mid-lower reaches of Hanjiang River Basin between 2001 and 2015
- Extraction of road boundary from MLS data using laser scanner ground trajectory
- Research on the improvement of single tree segmentation algorithm based on airborne LiDAR point cloud
- Research on the conservation and sustainable development strategies of modern historical heritage in the Dabie Mountains based on GIS
- Cenozoic paleostress field of tectonic evolution in Qaidam Basin, northern Tibet
- Sedimentary facies, stratigraphy, and depositional environments of the Ecca Group, Karoo Supergroup in the Eastern Cape Province of South Africa
- Water deep mapping from HJ-1B satellite data by a deep network model in the sea area of Pearl River Estuary, China
- Identifying the density of grassland fire points with kernel density estimation based on spatial distribution characteristics
- A machine learning-driven stochastic simulation of underground sulfide distribution with multiple constraints
- Origin of the low-medium temperature hot springs around Nanjing, China
- LCBRG: A lane-level road cluster mining algorithm with bidirectional region growing
- Constructing 3D geological models based on large-scale geological maps
- Crops planting structure and karst rocky desertification analysis by Sentinel-1 data
- Physical, geochemical, and clay mineralogical properties of unstable soil slopes in the Cameron Highlands
- Estimation of total groundwater reserves and delineation of weathered/fault zones for aquifer potential: A case study from the Federal District of Brazil
- Characteristic and paleoenvironment significance of microbially induced sedimentary structures (MISS) in terrestrial facies across P-T boundary in Western Henan Province, North China
- Experimental study on the behavior of MSE wall having full-height rigid facing and segmental panel-type wall facing
- Prediction of total landslide volume in watershed scale under rainfall events using a probability model
- Toward rainfall prediction by machine learning in Perfume River Basin, Thua Thien Hue Province, Vietnam
- A PLSR model to predict soil salinity using Sentinel-2 MSI data
- Compressive strength and thermal properties of sand–bentonite mixture
- Age of the lower Cambrian Vanadium deposit, East Guizhou, South China: Evidences from age of tuff and carbon isotope analysis along the Bagong section
- Identification and logging evaluation of poor reservoirs in X Oilfield
- Geothermal resource potential assessment of Erdaobaihe, Changbaishan volcanic field: Constraints from geophysics
- Geochemical and petrographic characteristics of sediments along the transboundary (Kenya–Tanzania) Umba River as indicators of provenance and weathering
- Production of a homogeneous seismic catalog based on machine learning for northeast Egypt
- Analysis of transport path and source distribution of winter air pollution in Shenyang
- Triaxial creep tests of glacitectonically disturbed stiff clay – structural, strength, and slope stability aspects
- Effect of groundwater fluctuation, construction, and retaining system on slope stability of Avas Hill in Hungary
- Spatial modeling of ground subsidence susceptibility along Al-Shamal train pathway in Saudi Arabia
- Pore throat characteristics of tight reservoirs by a combined mercury method: A case study of the member 2 of Xujiahe Formation in Yingshan gasfield, North Sichuan Basin
- Geochemistry of the mudrocks and sandstones from the Bredasdorp Basin, offshore South Africa: Implications for tectonic provenance and paleoweathering
- Apriori association rule and K-means clustering algorithms for interpretation of pre-event landslide areas and landslide inventory mapping
- Lithology classification of volcanic rocks based on conventional logging data of machine learning: A case study of the eastern depression of Liaohe oil field
- Sequence stratigraphy and coal accumulation model of the Taiyuan Formation in the Tashan Mine, Datong Basin, China
- Influence of thick soft superficial layers of seabed on ground motion and its treatment suggestions for site response analysis
- Monitoring the spatiotemporal dynamics of surface water body of the Xiaolangdi Reservoir using Landsat-5/7/8 imagery and Google Earth Engine
- Research on the traditional zoning, evolution, and integrated conservation of village cultural landscapes based on “production-living-ecology spaces” – A case study of villages in Meicheng, Guangdong, China
- A prediction method for water enrichment in aquifer based on GIS and coupled AHP–entropy model
- Earthflow reactivation assessment by multichannel analysis of surface waves and electrical resistivity tomography: A case study
- Geologic structures associated with gold mineralization in the Kirk Range area in Southern Malawi
- Research on the impact of expressway on its peripheral land use in Hunan Province, China
- Concentrations of heavy metals in PM2.5 and health risk assessment around Chinese New Year in Dalian, China
- Origin of carbonate cements in deep sandstone reservoirs and its significance for hydrocarbon indication: A case of Shahejie Formation in Dongying Sag
- Coupling the K-nearest neighbors and locally weighted linear regression with ensemble Kalman filter for data-driven data assimilation
- Multihazard susceptibility assessment: A case study – Municipality of Štrpce (Southern Serbia)
- A full-view scenario model for urban waterlogging response in a big data environment
- Elemental geochemistry of the Middle Jurassic shales in the northern Qaidam Basin, northwestern China: Constraints for tectonics and paleoclimate
- Geometric similarity of the twin collapsed glaciers in the west Tibet
- Improved gas sand facies classification and enhanced reservoir description based on calibrated rock physics modelling: A case study
- Utilization of dolerite waste powder for improving geotechnical parameters of compacted clay soil
- Geochemical characterization of the source rock intervals, Beni-Suef Basin, West Nile Valley, Egypt
- Satellite-based evaluation of temporal change in cultivated land in Southern Punjab (Multan region) through dynamics of vegetation and land surface temperature
- Ground motion of the Ms7.0 Jiuzhaigou earthquake
- Shale types and sedimentary environments of the Upper Ordovician Wufeng Formation-Member 1 of the Lower Silurian Longmaxi Formation in western Hubei Province, China
- An era of Sentinels in flood management: Potential of Sentinel-1, -2, and -3 satellites for effective flood management
- Water quality assessment and spatial–temporal variation analysis in Erhai lake, southwest China
- Dynamic analysis of particulate pollution in haze in Harbin city, Northeast China
- Comparison of statistical and analytical hierarchy process methods on flood susceptibility mapping: In a case study of the Lake Tana sub-basin in northwestern Ethiopia
- Performance comparison of the wavenumber and spatial domain techniques for mapping basement reliefs from gravity data
- Spatiotemporal evolution of ecological environment quality in arid areas based on the remote sensing ecological distance index: A case study of Yuyang district in Yulin city, China
- Petrogenesis and tectonic significance of the Mengjiaping beschtauite in the southern Taihang mountains
- Review Articles
- The significance of scanning electron microscopy (SEM) analysis on the microstructure of improved clay: An overview
- A review of some nonexplosive alternative methods to conventional rock blasting
- Retrieval of digital elevation models from Sentinel-1 radar data – open applications, techniques, and limitations
- A review of genetic classification and characteristics of soil cracks
- Potential CO2 forcing and Asian summer monsoon precipitation trends during the last 2,000 years
- Erratum
- Erratum to “Calibration of the depth invariant algorithm to monitor the tidal action of Rabigh City at the Red Sea Coast, Saudi Arabia”
- Rapid Communication
- Individual tree detection using UAV-lidar and UAV-SfM data: A tutorial for beginners
- Technical Note
- Construction and application of the 3D geo-hazard monitoring and early warning platform
- Enhancing the success of new dams implantation under semi-arid climate, based on a multicriteria analysis approach: Case of Marrakech region (Central Morocco)
- TRANSFORMATION OF TRADITIONAL CULTURAL LANDSCAPES - Koper 2019
- The “changing actor” and the transformation of landscapes