Investigations on the performance of bottle blade overshot water wheel in very low head resources for pico hydropower
-
Mohd Farriz Basar
 ,
Izzatie Akmal Zulkarnain
,
Izzatie Akmal Zulkarnain

Abstract
An overshot water wheel is considered as a low-cost and simple alternative for rural electrification. Hence, the aim of this study is to develop a noncomplex geometrical design of an overshot water wheel, namely, bottle blade overshot water wheel (BOWW), yet effectively operated for pico hydropower generation. The BOWW and hydro system were assessed at very low water head conditions, namely, 0.3, 0.4, and 0.5 m water head using a water test rig. According to the experimental results, the BOWW equipped with eight blades when operated at 0.5 m head produced significant mechanical power and electrical power up to 48.58 and 15.55 W. Analytically, the turbine with eight blades has 26.8–49.1% efficiency. Meanwhile, the effectiveness of four blades is between 5.66 and 28.96%. The results showed that eight blades performed well. Finally, it proves that, with a very low water head and low flow rate, the proposed system can perform and produce a significant power output for power generation.
1 Introduction
Nowadays, the expansion of hydropower can be seen all over the world. The International Renewable Energy Agency estimates the worldwide potential for hydropower to be approximately 15,000 GW. However, the necessity for constructing large dams has led to environmental consequences, causing hydroelectricity to be overlooked as a renewable energy source. Besides, hydropower generation is gaining increased public recognition and attention due to awareness of environmental concerns such as climate change.
In the most severe cases, the construction of a large hydropower plant with a substantial dam may lead to flooding, posing a threat to agricultural, tourism operations, and ecological protection zones (Yaakub et al. 2018). Consequently, the pico hydro generation system has been recognized as a promising renewable energy source with great potential for future power generation applications (Basar et al. 2021). Generally, when the height of large dams exceeds 15 m, there are direct impacts on the biological, chemical, and physical properties of rivers (Farriz et al. 2015). Following this matter, the inclusion of large hydropower in the category of renewable energy is being debated. As a result, it is believed that large hydropower plants with capacities exceeding 10 MW are considered as non-hydropower renewable energy sources (Shadrina 2020).
Hydropower converts the potential energy and kinetic energy of water into electrical energy or mechanical energy (Basar et al. 2022). Several factors can be considered when categorizing hydropower such as power output, operating head, water flow rate, and operating system (Kadier et al. 2018). These classifications of hydropower help in determining the ideal system to be installed at specific hydro sites (Basar 2021). Table 1 shows the classifications of hydropower that are being divided according to their respective characteristics.
Classifications of hydropower
| Type of classifications | Descriptions |
|---|---|
| a. Power output | |
| Large | Above 100 MW |
| Medium | 10–100 MW |
| Small | 1–10 MW |
| Mini | 100 kW to 1 MW |
| Micro | 5–100 kW |
| Pico | Less than 5 kW |
| b. Water head range | |
| High | 100 m |
| Medium | 30–100 m |
| Low | 10–30 m |
| Ultra Low | Less than 10 m |
| c. Water flow rate | |
| High | Above 0.03 m3/s (above 30 L/s) |
| Medium | 0.01–0.03 m3/s (10–30 L/s) |
| Low | Less than 0.01 m3/s (less than 10 L/s) |
Pico hydro is known as a green energy that utilizes small streams to generate electricity less than 5 kW at very low water head ranging from 3 m and below as seen in Table 1. It is primarily a hydroelectricity system that depends on the natural flow to generate electricity whereby only a little, or zero water storage is required hence minimizing the environmental impact (Nabil and Mansour 2022). It offers a cheap, reliable, efficient, and cost-effective alternative energy source among the other off-grid energy solutions (Khomsah and Laksono 2019, Basar et al. 2014).
2 Overshot water wheel
Over the years, there have been many types of pico hydro turbine systems that have been developed with different operating principles. Generally, these turbines are classified into three types which are impulse, reaction, and gravity (Zainuddin et al. 2009). Among three types, the gravity turbine is known as the slow-running machine that operates at a low water head that is less than 10 m and a low water flow rate. Turbines such as Archimedes Screw, breastshot water wheel, pitchback water wheel, and overshot water wheel are the products of gravity turbines that operate effectively in low water head conditions (Quaranta and Revelli 2018).
In general, there are three classifications of water wheels based on how water approaches the water wheel. The classifications are as follows: (i) solely depends on the gravity of the water, (ii) partially depends on the gravity of the water and partially depends on the water flow rate, and (iii) solely depends on the water flow rate.
Practically, water wheels are known as slow-running machine types, yet they are the most suitable hydropower machines to be used in low-head areas. Interestingly, the water wheel also does not require support from the technical irrigation system. Since the historical era, there have been four types of water wheels according to their water flow system: (a) Undershot, (b) breastshot, (c) overshot, and (d) pitchback/backshot as shown in Figure 1.

Types of water wheels.
Water wheels such as breastshot, pitchback, and overshot are among the gravitational turbine types that apply the concept of perpetual motion energy, which converts the kinetic energy derived from the earth’s gravity into electrical power. Simply put, the gravity turbine rotates as soon as the weight of water strikes the top of the turbine and flows through the bottom, where it is discharged (Quaranta and Revelli 2018).
The pitchback or backshot water wheel is a form of overshot water wheel in which water is delivered behind the top of the wheel, resulting in a backward rotational movement. It involves the integration of undershot and breastshot with the overshot system, which fully harnesses the amount of potential energy generated by falling water as it falls on the back side of the wheel (Othman et al. 2015).
A well-designed overshot water wheel turbine can generate electricity with 85% efficiency under a flow rate from less than 0.01–0.1 m3/s and water head from a few meters to 10 m of water resources (Bachan et al. 2019). The overshot water wheel is known as the most popular type of gravity turbine and has been commonly used in low-head and low-flow conditions (YoosefDoost and Lubitz 2020). This is because it is known for its high efficiency even in low head and low flow conditions. The design of the structure allows it to operate effectively at low head heights. Moreover, it has a noncomplex design compared to the other types of turbines, hence it is easier to construct and maintain the operation, especially in off-grid locations.
3 Development of bottle blade overshot water wheel (BOWW) and water test rig
3.1 Development of BOWW
In this project, an overshot water wheel, namely, a bottle blade overshot water wheel known as BOWW, is presented. Basically, the geometrical design for BOWW is similar to the other overshot water wheel, yet the blade parts have been thoroughly modified. The typical overshot water wheel utilized materials such as steel and wood to develop the blade parts. In contrast, the BOWW turbine employed plastic soda bottles with capacities of 1.5 L as an alternative to build the blades turbine as shown in Figure 2. The plastic soda bottle is not only inexpensive, but it is also lightweight and durable, which makes it a good choice for the blade’s turbine. Most importantly, this project promotes the importance of recycling practices.

BOWW uses plastic bottles as blades.
The plastic soda bottles are used as blades, and they remain in their original shape without cutting any part of the bottle. The combinations of three bottles increase the surface area of each blade. As shown in Figure 3, three bottles are attached using 12 in (4.8 mm × 300 mm) nylon cable ties before being connected to the 0.5 m length of 1.5 in PVC pipe. Then, the PVC solvent cement is used to attach the pipe with the PVC male connector fittings that act as the blade holder. This process is repeated until eight blades are produced from 24 soda bottles.

Blade parts of the BOWW.
In the meantime, the blade holder and the jointer combine all the blades to form a rim shape. Furthermore, the coupling that holds the blade holder is welded onto a steel surface before being connected to the electrical generator. Then, the generator converts the mechanical energy gained from the rotational blade into electrical energy.
This project replaced the typical design of the overshot water wheel blades with the plastic soda bottle. In addition, this unique blade makes use of standard PVC pipe connections that are conveniently accessible and adjustable. Simply put, anyone with a rudimentary understanding of pipes can operate this turbine. Figure 4 presents the components used and the final development of the BOWW turbine.

The final development of BOWW turbine.
The blades of BOWW utilize a plastic soda bottle as a blade to replace common materials such as wood or metal. To add, a plastic bottle is not only very cheap but also resistant to corrosion and is lightweight. Additionally, utilizing plastic soda bottles contributes to lessening environmental pollution. Besides that, the assembling process of this turbine is simple and does not require significant technical knowledge or high-tech manufacturing equipment.
3.2 Water test rig
This research has made a substantial contribution by developing a better and more efficient experimental setup that is easy to build and closely matches the near-real situation of hydroelectric power plants. Furthermore, the test rig makes use of the gravitational potential energy of the water tank. It can produce a very low water head from 0.3 m up to 0.5 m and flow rates of 0.012 m3/s until 0.021 m3/s, allowing the experimental setup to be applicable for both run-off-river and run-on-river techniques.
As shown in Figure 5, the water test rig consists of the BOWW turbine, Prony brake system, water tank, and water pump. The water pump is used to raise the water from water tank 2 to water tank 1 through the water inlet and outlet. Then, the water flows from water tank 1 to the open downstream channel, and simultaneously falls to the water wheel blades. Once the water strikes the turbine’s blades, the turbine starts to rotate at certain speeds depending on the velocity of the water. The rotation of the water wheel creates both mechanical and electrical power at the same time.
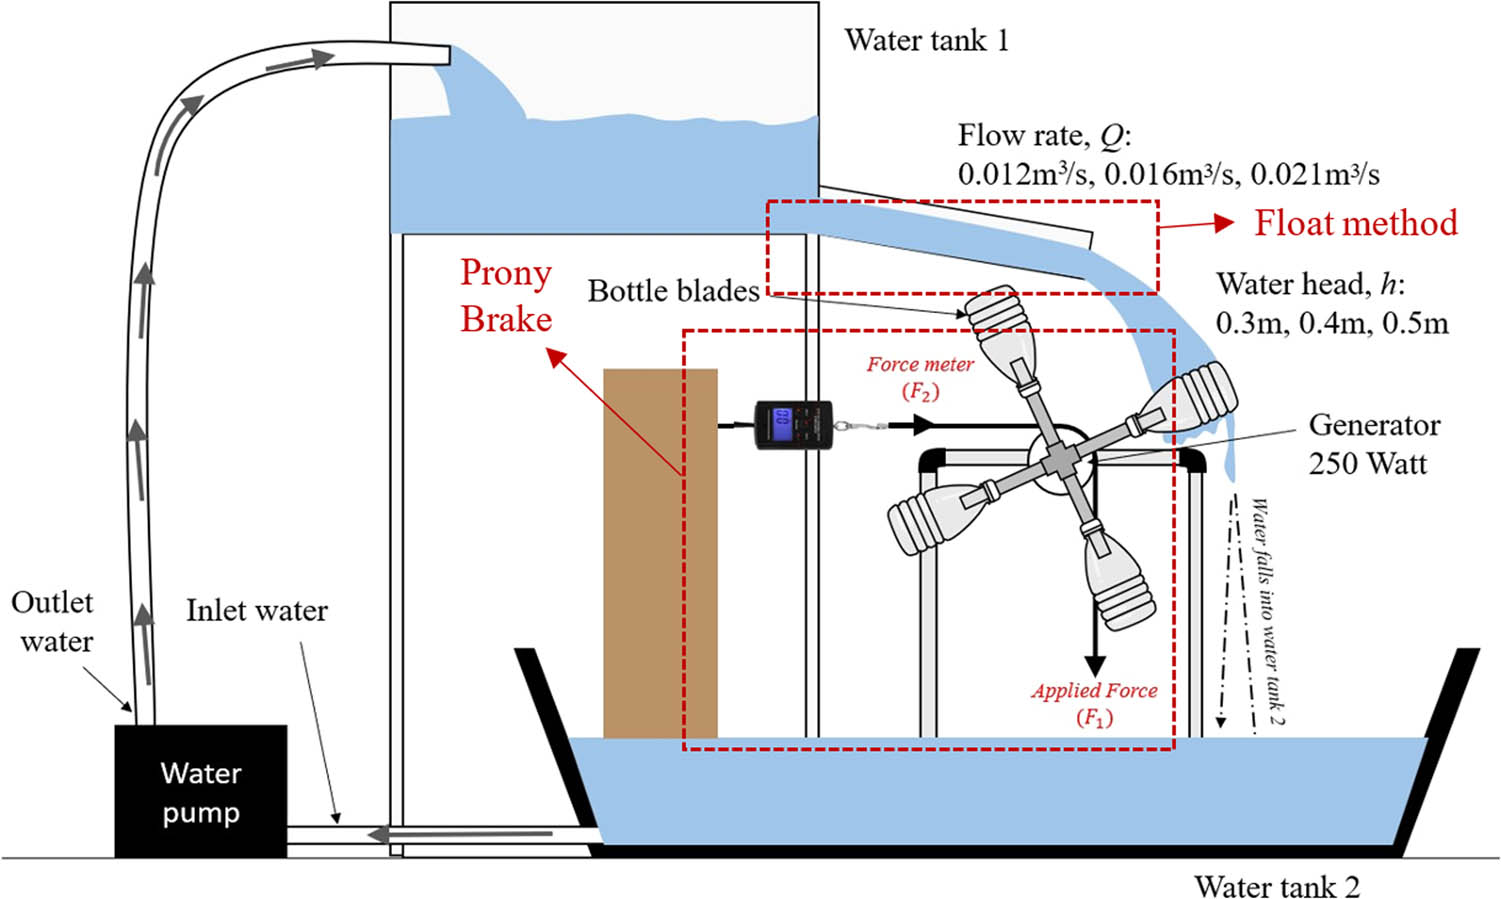
Schematic of water test rig.
Water tank 1 is used to store water up to 700 L. The water flows through the open downstream channel and immediately hits the water blades, resulting in the rotational movement. Meanwhile, water tank 2 collects the falling water, which will be returned to water tank 1 via a water pump and water inlet. When employed in a real-world scenario, water tank 1 is expected to be filled with river water. The water will subsequently be directed back into rivers after flowing to the water wheel turbine.
4 Governing equation
The force, F, on the water wheel must be known before mechanical power can be measured. Therefore, a system known as the Prony break scheme is crucial to measure the force, F, on a wheel (Shi 2019). Figure 6 shows the schematic Prony brake to measure force.

Prony brake scheme.
The force, F (N), generated by the wheel is determined using equation (1).
where F 1 indicates the applied weight (N) given to the device until the wheel stop rotates, while F 2 is the result of the force meter (N). Next the torque, τ (Nm), is calculated once the force, F, is obtained using equation (2).
where r is the radius of the pulley (m).
Hence, the mechanical power, P mech (W), of the wheel can be calculated using equation (3).
Meanwhile, the angular velocity,
where n refers to the rotational speed (rpm) of the wheel turbine that is measured using a tachometer. Furthermore, the potential power, P potential (W), that is contained in the water resources can be calculated using equation (5).
where water flow rates, Q (m3/s), are measured based on the volume of water passing through an area during a period of time and water head, H (m), is determined using the Bernoulli equation.
Meanwhile, both water density,
where v is the water velocity and A (m2) is the surface area of water in the gutter. Hence, A can be calculated based on the parameters in Figure 7, as in equation (7).

Scheme of the parameters of the water in the gutter.
Referring to Figure 7, T (m) and L (m) are the height and width of water in the gutter, respectively. The gutter in this project acts as a penstock that carries the water from water tank to the turbines.
Meanwhile, H in the system is approximated using the Bernoulli equation as in equation (8), where water velocity, v, is measured using the float method.
The water velocity, v (m/s), is determined by using the float method (Ramdhani et al. 2020). In a float method, a float object is passed from the first measurement point until the second measurement point, which is denoted as
Then, the values of voltage, V (V), and current, I (A), are determined using the multimeter. Hence, equation (10) is used to calculate electrical power, P elec (W), generated by the system.
Finally, the mechanical and electrical efficiencies (%) were calculated using equations (11) and (12), respectively.
5 Results and discussion
5.1 Potential energy
The proposed overshot water turbine and pico-hydro system has been evaluated under conditions of extremely low head water which are 0.3, 0.4, and 0.5 m. The experiments were conducted to ascertain the proposed system’s performance. Additionally, the experimental results are critical in determining the critical parameters affecting the system’s performance.
Figure 8 shows the results of potential energy for different levels of water head. It can be concluded that the potential energy of the water wheel system is directly proportional to the level of the water head. This curve’s behavior is also equivalent to the governing equation of (5), where the water head significantly influences the amount of potential power available in the system. Thus, a higher level of water head results in a greater potential energy available in the system.

Potential energy for various water head.
The other significant parameter affecting the potential power is the water flow rate. The value of the water flow rate is different at certain water heads. This is because the water velocity becomes the most critical parameter which influences the value of both water head and water flow rate, as stated in equations (6) and (8). Meanwhile, the yellow region in Figure 8 indicates the research areas specifically at 0.3, 0.4, and 0.5 m of water head.
5.2 Mechanical power
The relationship between two parameters, mechanical power and angular velocity, is shown in Figures 9 and 10. The experiments are conducted under three different levels of water head, which are 0.3, 0.4, and 0.5 m. Both figures depict the experimental results for eight and four numbers of blades.

Experimental mechanical power for water heads of 0.3, 0.4, and 0.5 m using eight blades.

Experimental mechanical power for water heads of 0.3, 0.4, and 0.5 m using four blades.
Referring to Figures 9 and 10, it can be seen that the BOWW turbine successfully converted potential energy into higher power output, particularly when employing eight blades. This is attributed to the fact that a BOWW turbine with eight blades generated higher force and velocity. These two parameters, force and velocity, are crucial in determining the water head and flow rate, which then subsequently influence the potential power, as indicated in equation (5). Furthermore, mechanical power also increases toward the higher water head. Additionally, there was a huge difference depicted in the data for each water head, where the highest power generated by the BOWW turbine at 0.5 m head by using eight blades is 48.58 W while the turbine at 0.4 m head generated up to 22.46 W. This trend was followed by a power generation of only 9.64 W when operated at a 0.3 m water head.
Meanwhile, the BOWW turbine generates the highest power up to 25.33 W at 0.5 m head and 13.15 W at 0.4 m head when employing four blades. This is followed by the power generation at only 5.66 W when operated at 0.3 m water head, representing the lowest mechanical power generated by the BOWW turbine. On the other hand, the angular velocity of the turbine has greatly impacted mechanical power since it is the product of torque and speed of the turbine, (τ·
Therefore, it is obvious that the system performed the best at 0.5 m followed by 0.4 m and the worst at 0.3 m. Theoretically, the operating water head is highly influenced by the component of
5.3 Electrical power
Table 2 depicts the summary of the electrical power test for the BOWW turbine equipped with eight bottle blades at 0.5 m of water head. While conducting the experiment, load or force is applied gradually with a constant increment of 0.5 N to the Prony brake system. The electrical power generated for each load was measured to determine the performance of the system in terms of electricity. Similar experimental procedures were applied to the BOWW turbines for different water heads and number of blades to obtain accurate results. Note that the amount of electrical power is so much less than mechanical energy. This is due to the losses such as load and transmission losses that occur during the conversion process. However, these losses are ignored throughout the experiment.
Electrical power test summary of eight blades BOWW turbine at 0.5 m
| Load no. | Applied force, F 1 (N) | Voltage, V (V) | Current, I (A) | Rotational speed, n (rpm) | Electrical power, P elec (W) | Electrical efficiency, η elec (%) |
|---|---|---|---|---|---|---|
| 0 | 0 | 7.56 | 0.85 | 267 | 6.43 | 4.23 |
| 1 | 0.5 | 8.10 | 0.82 | 264 | 6.64 | 6.71 |
| 2 | 1 | 8.55 | 0.8 | 262 | 6.84 | 6.91 |
| 3 | 1.5 | 9.22 | 0.76 | 259 | 7.01 | 7.09 |
| 4 | 2 | 10.33 | 0.73 | 256 | 7.54 | 7.62 |
| 5 | 2.5 | 11.44 | 0.701 | 252 | 8.02 | 8.11 |
| 6 | 3 | 12.91 | 0.66 | 249 | 8.52 | 8.61 |
| 7 | 3.5 | 14.24 | 0.63 | 245 | 8.97 | 9.07 |
| 8 | 4 | 15.41 | 0.61 | 241 | 9.40 | 9.5 |
| 9 | 4.5 | 16.69 | 0.59 | 238 | 9.85 | 10 |
| 10 | 5 | 17.29 | 0.59 | 233 | 10.20 | 10.31 |
| 11 | 5.5 | 18.39 | 0.56 | 231 | 10.30 | 10.41 |
| 12 | 6 | 19.87 | 0.53 | 228 | 10.53 | 10.64 |
| 13 | 6.5 | 21.17 | 0.503 | 223 | 10.65 | 10.77 |
| 14 | 7 | 23.60 | 0.5 | 218 | 11.80 | 11.93 |
| 15 | 7.5 | 26.58 | 0.48 | 211 | 12.76 | 12.9 |
| 16 | 8 | 28.83 | 0.471 | 208 | 13.58 | 13.72 |
| 17 | 8.5 | 31.84 | 0.45 | 200 | 14.33 | 14.48 |
| 18 | 9 | 34.09 | 0.43 | 198 | 14.66 | 14.82 |
| 19 | 9.5 | 34.65 | 0.43 | 195 | 14.90 | 15.06 |
| 20 | 10 | 35.83 | 0.42 | 191 | 15.05 | 15.21 |
| 21 | 10.5 | 37.41 | 0.41 | 189 | 15.34 | 15.51 |
| 22 | 11 | 38.88 | 0.4 | 186 | 15.55 | 15.71 |
| 23 | 11.5 | 37.01 | 0.39 | 177 | 14.43 | 15.38 |
** The row in bold refers to the highest value of electrical power generated by the BOWW turbine with eight blades when operated at 0.5 m of water head.
Referring to Table 2, the electrical power increases from 6.43 W until it reaches maximum electrical power at 15.55 W (row in bold), accompanied by the highest electrical efficiency of 15.71% when the applied force ranges between 0 and 11 N. However, the electrical power starts to decrease to 15.21 W when applying 11.5 N on the applied force. As for current and voltage, the table shows that the voltage increases while the current decreases throughout the experiment in the BOWW system. It can be seen that the voltage increased to 39 V when adding force up to 11.5 N, but when the force increased more than 11.5 N the resulting current is slightly reduced from 4 to 0.39 A. Consequently, the reduced current caused the electrical power generated to decrease.
5.4 Optimum performance of BOWW
The turbine that operated in 0.5 m water head depicts the highest efficiency for both eight and four blades as listed in Table 3, which are 49% for eight blades and 29.27% for four blades. However, the turbine with eight blades performed the best at 0.5 m water head, with 49.1% efficiency among the other conditions. Apart from that, the BOWW turbine is also able to generate up to 48.58 W when the turbine exceeds 186 rpm of rotational speed. In contrast, the highest mechanical power that the turbine with four blades manages to generate is around 28.96 W with 165 rpm of rotational speed.
Optimum value recorded when equipped with different numbers of blades
| Blades | H (m) | Q (m3/s) | n (rpm) |
|
P mech (W) | η mech (%) | P elec (W) | η elec (%) |
|---|---|---|---|---|---|---|---|---|
| 8 | 0.5 | 0.021 | 186 | 19.48 | 48.58 | 49.1 | 15.55 | 15.71 |
| 0.4 | 0.016 | 101 | 10.58 | 22.46 | 37.44 | 7.18 | 11.98 | |
| 0.3 | 0.012 | 51 | 5.34 | 9.64 | 26.8 | 5.61 | 6.21 | |
| 4 | 0.5 | 0.021 | 165 | 17.28 | 28.96 | 29.27 | 9.26 | 9.4 |
| 0.4 | 0.016 | 97 | 10.21 | 13.15 | 21.91 | 4.2 | 7 | |
| 0.3 | 0.012 | 58 | 6.08 | 5.66 | 17.72 | 1.3 | 3.2 |
5.5 Comparison with previous studies
The parameter U/v in the x-axis is the ratio of the tangential velocity of the turbine and the velocity of the water. The tangential velocity of the turbine (U) refers to the linear speed of the turbine while moving in rotation. According to Ramdhani et al. 2020, U is among the crucial parameter that significantly affects the water wheel’s performance. However, U is highly dependent on the rotational speed (n) and the diameter of the turbine (D), as shown in equation (13):
In contrast, the overshot water wheel exceeded the BOWW by 59% in mechanical efficiency. Nevertheless, this BOWW turbine only required an extremely low water head at 0.5 m with a constant flow rate of 0.0201 m3/s, unlike the overshot water wheel which required 1 m of water head and varied flow rate between 0.005 m3/s and 0.013 m3/s.
All water wheels, including BOWW, generally depict a similar behavior curve pattern. Conversely, the experimental data of the overshot water wheel in Figure 11 stop at the highest point. This is because Štigler (2022) mentioned that the system failed to operate at rotational speeds below 15 rpm, which is equivalent to 0.225 U/v. Besides that, all water wheels are initially in a static state (at this point, no force acts against the wheel) until the flowing water strikes upon the blades and causes rotational movement. At the same time, the resulting force gradually increases. Then, the rotational speed of the water wheel slowly decreases until it stops rotating after reaching the maximum force where the force is referring to the Prony brake scheme.

Mechanical efficiency curves for BOWW four blades, BOWW eight blades, and overshot water wheel.
Theoretically, it can be concluded that parameters such as rotational speed (n) and force (F) significantly influence the mechanical efficiency as it relates to the parameter P mech. Meanwhile, parameters such as voltage (V) and current (I) determine the value of electrical efficiency since the P elec. Hence, the higher the values of P mech and P elec, the higher the value of η mech and η elec will be. In addition, it can be seen that most of the efficiency of these water wheels approach each other at low U/v until reaching zero point. However, the efficiency curves are further away at higher U/v. This is because each water wheel rotates at a different speed and eventually will stop when it is unable to accommodate the maximum force.
6 Conclusion
It is good to note that the BOWW turbine had demonstrated good performance throughout the experimental work, particularly at low water head and low flow rate operating conditions. This is shown in the experimental results that depict the capabilities of the BOWW turbine especially when equipped with eight blades and operates at 0.5 m water head. The BOWW with eight blades successfully achieved mechanical efficiency at up to 49% and electrical efficiency at 15.55%.
Acknowledgements
The authors would like to thank Universiti Teknikal Malaysia Melaka (UTeM) for all the supports.
-
Funding information: None declared.
-
Author contributions: Mohd Farriz Basar: I am responsible for all the content in this work and I verify that the information given by other authors is true and genuine. Izzatie Akmal Zulkarnain: She is responsible for managing all necessary information in the development of the bottle blade overshot water wheel (BOWW) and water test rig, as well as conducting laboratory tests. Nurul Ashikin Mohd Rais: She is responsible for managing data pertaining to test results as well as performing parametric analysis using governing equations. Kamaruzzaman Sopian: Responsible for information related to performance analysis of the proposed waterwheel.
-
Conflict of interest: The authors state no conflict of interest.
-
Research ethics: Not applicable.
-
Data availability statement: Not applicable.
References
Bachan A., Ghimire N., Eisner J., Chitrakar S., and Neopane H. P. (2019). “Numerical analysis of low-tech overshot water wheel for off grid purpose,” J. Phys.: Conf. Ser., vol. 1266, no. 1, p. 012001.10.1088/1742-6596/1266/1/012001Search in Google Scholar
Basar M. F. (2021). “Investigation on rotor jet interference in a hydraulic reaction turbine for low head low flow water conditions,” Energy Harvesting Syst, vol. 8, no. 1, pp. 29–35.10.1515/ehs-2021-0019Search in Google Scholar
Basar M. F., Rahman S. M. R. S., Hamdan Z., Borhan S., and Sopian K. (2014). “Cost analysis of pico hydro turbine for power production,” AENSI Adv. Environ. Biol., vol. 8, no. 14, pp. 147–151.Search in Google Scholar
Basar M. F., Rais N. A. M., Rahman A., Mustafa W. A., Sopian K., and Wong K. V. (2021). “Optimization of reaction typed water turbine in very low head water resources for Pico Hydro,” J. Adv. Res. Fluid Mech. Therm. Sci., vol. 90, no. 1, pp. 23–39.10.37934/arfmts.90.1.2339Search in Google Scholar
Basar M. F., Zulkarnain I. A., Rahman A. A. A., and Sopian K. (2022). “An experimental investigation of overshot waterwheel in very low head water resources for Pico Hydro,” Int. J. Eng. Appl., vol. 10, no. 3, p. 177.10.15866/irea.v10i3.21364Search in Google Scholar
Farriz M. B., Boejang H., Masjuri M., Aras M. S. M., Razik N. H. A., Mat S., et al. (2015). “Evolution of simple reaction type turbines for pico-hydro applications,” J. Teknologi, vol. 77, no. 32, pp. 1–910.11113/jt.v77.6980Search in Google Scholar
Kadier A., Kalil M. S., Pudukudy M., Hasan H. A., Mohamed A., and Hamid A. A. (2018). “Pico hydropower (PHP) development in Malaysia: Potential, present status, barriers and future perspectives,” Renew. Sustain. Energy Rev., vol. 81, pp. 2796–2805.10.1016/j.rser.2017.06.084Search in Google Scholar
Khomsah A. and Laksono A. S. (2019). “Pico-hydro as a renewable energy: local natural resources and equipment availability in efforts to generate electricity,” IOP Conf. Series: Mater. Sci. Eng., vol. 462, p. 012047.10.1088/1757-899X/462/1/012047Search in Google Scholar
Nabil T. and Mansour T. (2022). “Power extraction from pico hydro turbines installed in water pipelines,” J. Energy Eng.-ASCE, vol. 148, no. 2, p. 04022002.10.1061/(ASCE)EY.1943-7897.0000818Search in Google Scholar
Othman M. M., Razak J. A., Mohammad W. M. F. W., and Sopian K. (2015). “A review of the Pico-Hydro Turbine: Studies on the propeller hydro type,” Int. Rev. Mech. Eng.-IREME, vol. 9, no. 6, p. 527.10.15866/ireme.v9i6.5876Search in Google Scholar
Quaranta E. and Revelli R. (2018). “Gravity water wheels as a micro hydropower energy source: A review based on historic data, design methods, efficiencies and modern optimizations,” Renew. Sustain. Energy Rev., vol. 97, pp. 414–427.10.1016/j.rser.2018.08.033Search in Google Scholar
Ramdhani M. R., Irwansyah R., Budiarso B., Warjito W., and Adanta D. (2020). “Investigation of the 16 blades Pico Scale Breastshot Waterwheel performance in actual river condition,” J. Adv. Res. Fluid Mech. Therm. Sci., vol. 75, no. 1, pp. 38–47.10.37934/arfmts.75.1.3847Search in Google Scholar
Shadrina E. (2020). “Non-hydropower renewable energy in central Asia: Assessment of deployment status and analysis of underlying factors,” Energies, vol. 13, no. 11, pp. 2963–300210.3390/en13112963Search in Google Scholar
Štigler J. (2022). “Overshot water wheel efficiency measurements for low heads and low flowrates,” Epj Web Conf, vol. 269, p. 01058.10.1051/epjconf/202226901058Search in Google Scholar
Shi X. (2019). “Explorations in the History and Heritage of Machines and Mechanisms: The hydraulic tilt hammer in Ancient China,” Springer International Publishing, pp. 113–122.10.1007/978-3-030-03538-9_10Search in Google Scholar
Yoosef Doost A. and Lubitz W. D. (2020). “Archimedes screw turbines: A sustainable development solution for green and renewable energy generation – A review of potential and design procedures,” Sustainability, vol. 12, no. 18, p. 7352.10.3390/su12187352Search in Google Scholar
Yaakub M. F., Basar M. F., Noh F. H. M., and Boejang H. (2018). “Pico-hydro electrification from rainwater gravitational force for urban area,” TELKOMNIKA Telecommun. Comput. Electron. Control., vol. 16, no. 3, p. 997.10.12928/telkomnika.v16i3.8076Search in Google Scholar
Zainuddin H., Khamis A., Yahaya M. S., Basar M. F., Lazi J. B., and Ibrahim Z. (2009). “Investigation on the performance of pico-hydro generation system using consuming water distributed to houses,” 2009 1st International Conference on the Developments in Renewable Energy Technology (ICDRET), pp. 1–4.10.1109/ICDRET.2009.5454216Search in Google Scholar
© 2024 the author(s), published by De Gruyter
This work is licensed under the Creative Commons Attribution 4.0 International License.
Articles in the same Issue
- Solar photovoltaic-integrated energy storage system with a power electronic interface for operating a brushless DC drive-coupled agricultural load
- Analysis of 1-year energy data of a 5 kW and a 122 kW rooftop photovoltaic installation in Dhaka
- Reviews
- Real yields and PVSYST simulations: comparative analysis based on four photovoltaic installations at Ibn Tofail University
- A comprehensive approach of evolving electric vehicles (EVs) to attribute “green self-generation” – a review
- Exploring the piezoelectric porous polymers for energy harvesting: a review
- A strategic review: the role of commercially available tools for planning, modelling, optimization, and performance measurement of photovoltaic systems
- Comparative assessment of high gain boost converters for renewable energy sources and electrical vehicle applications
- A review of green hydrogen production based on solar energy; techniques and methods
- A review of green hydrogen production by renewable resources
- A review of hydrogen production from bio-energy, technologies and assessments
- A systematic review of recent developments in IoT-based demand side management for PV power generation
- Research Articles
- Hybrid optimization strategy for water cooling system: enhancement of photovoltaic panels performance
- Solar energy harvesting-based built-in backpack charger
- A power source for E-devices based on green energy
- Theoretical and experimental investigation of electricity generation through footstep tiles
- Experimental investigations on heat transfer enhancement in a double pipe heat exchanger using hybrid nanofluids
- Comparative energy and exergy analysis of a CPV/T system based on linear Fresnel reflectors
- Investigating the effect of green composite back sheet materials on solar panel output voltage harvesting for better sustainable energy performance
- Electrical and thermal modeling of battery cell grouping for analyzing battery pack efficiency and temperature
- Intelligent techno-economical optimization with demand side management in microgrid using improved sandpiper optimization algorithm
- Investigation of KAPTON–PDMS triboelectric nanogenerator considering the edge-effect capacitor
- Design of a novel hybrid soft computing model for passive components selection in multiple load Zeta converter topologies of solar PV energy system
- A novel mechatronic absorber of vibration energy in the chimney
- An IoT-based intelligent smart energy monitoring system for solar PV power generation
- Large-scale green hydrogen production using alkaline water electrolysis based on seasonal solar radiation
- Evaluation of performances in DI Diesel engine with different split injection timings
- Optimized power flow management based on Harris Hawks optimization for an islanded DC microgrid
- Experimental investigation of heat transfer characteristics for a shell and tube heat exchanger
- Fuzzy induced controller for optimal power quality improvement with PVA connected UPQC
- Impact of using a predictive neural network of multi-term zenith angle function on energy management of solar-harvesting sensor nodes
- An analytical study of wireless power transmission system with metamaterials
- Hydrogen energy horizon: balancing opportunities and challenges
- Development of renewable energy-based power system for the irrigation support: case studies
- Maximum power point tracking techniques using improved incremental conductance and particle swarm optimizer for solar power generation systems
- Experimental and numerical study on energy harvesting performance thermoelectric generator applied to a screw compressor
- Study on the effectiveness of a solar cell with a holographic concentrator
- Non-transient optimum design of nonlinear electromagnetic vibration-based energy harvester using homotopy perturbation method
- Industrial gas turbine performance prediction and improvement – a case study
- An electric-field high energy harvester from medium or high voltage power line with parallel line
- FPGA based telecommand system for balloon-borne scientific payloads
- Improved design of advanced controller for a step up converter used in photovoltaic system
- Techno-economic assessment of battery storage with photovoltaics for maximum self-consumption
- Analysis of 1-year energy data of a 5 kW and a 122 kW rooftop photovoltaic installation in Dhaka
- Shading impact on the electricity generated by a photovoltaic installation using “Solar Shadow-Mask”
- Investigations on the performance of bottle blade overshot water wheel in very low head resources for pico hydropower
- Solar photovoltaic-integrated energy storage system with a power electronic interface for operating a brushless DC drive-coupled agricultural load
- Numerical investigation of smart material-based structures for vibration energy-harvesting applications
- A system-level study of indoor light energy harvesting integrating commercially available power management circuitry
- Enhancing the wireless power transfer system performance and output voltage of electric scooters
- Harvesting energy from a soldier's gait using the piezoelectric effect
- Study of technical means for heat generation, its application, flow control, and conversion of other types of energy into thermal energy
- Theoretical analysis of piezoceramic ultrasonic energy harvester applicable in biomedical implanted devices
- Corrigendum
- Corrigendum to: A numerical investigation of optimum angles for solar energy receivers in the eastern part of Algeria
- Special Issue: Recent Trends in Renewable Energy Conversion and Storage Materials for Hybrid Transportation Systems
- Typical fault prediction method for wind turbines based on an improved stacked autoencoder network
- Power data integrity verification method based on chameleon authentication tree algorithm and missing tendency value
- Fault diagnosis of automobile drive based on a novel deep neural network
- Research on the development and intelligent application of power environmental protection platform based on big data
- Diffusion induced thermal effect and stress in layered Li(Ni0.6Mn0.2Co0.2)O2 cathode materials for button lithium-ion battery electrode plates
- Improving power plant technology to increase energy efficiency of autonomous consumers using geothermal sources
- Energy-saving analysis of desalination equipment based on a machine-learning sequence modeling