A comparative study on characterizations and synthesis of pure lead sulfide (PbS) and Ag-doped PbS for photovoltaic applications
-
Muhammad Hasnain Jameel


Abstract
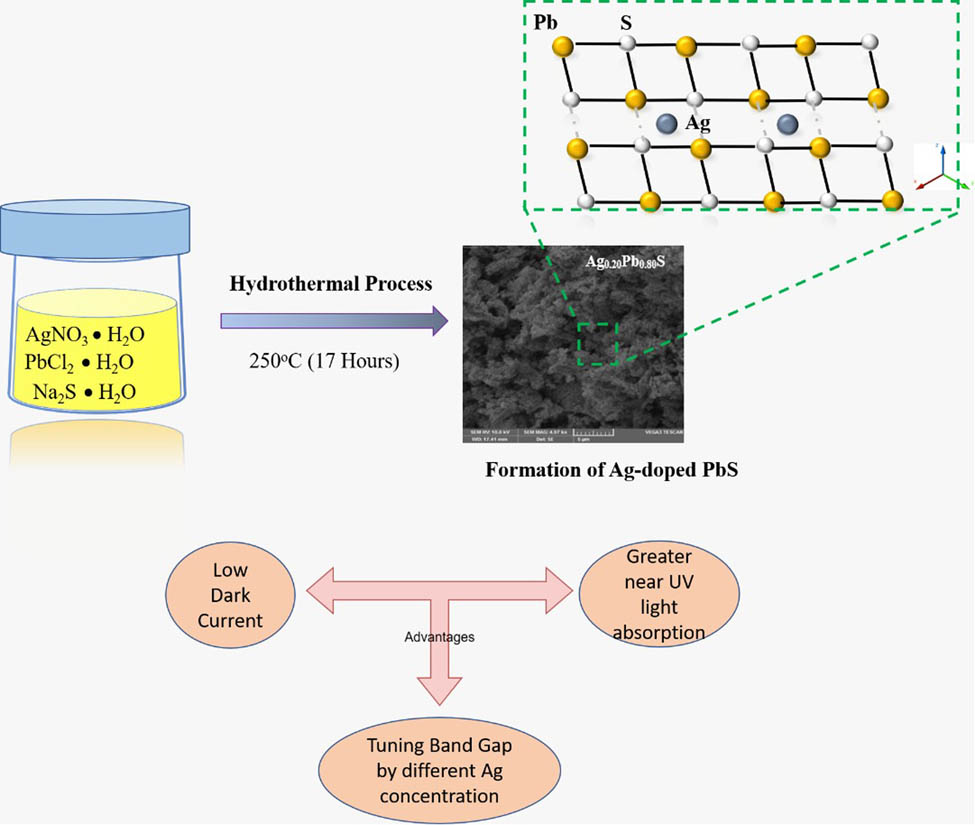
In this study, a hydrothermal technique was used to synthesize lead sulfide (PbS) and silver (Ag)-doped PbS nanoparticles (NPs) at different concentrations of 20, 40, and 60% of Ag. The small lattice phase changes appeared due to the shifting of diffraction angle peaks toward higher 2θ for samples doped with PbS with increasing Ag content. The analysis of average crystallite size, phase structure, and lattice constant was observed under X-ray diffraction. The value of crystallite size, volume of the unit cell, and porosity (%) were found to increase with the increasing concentration of Ag NPs in PbS. The pure PbS crystallite size is small compared to Ag-doped PbS. The optical characteristics including absorption spectra of the prepared samples were investigated and confirmed by using scanning electron microscope and UV-Vis spectroscopy. The observation of the composition showed that higher doping concentrations of Ag lead to an increase in particle size. Absorption peaks in the UV-Vis spectra corresponding to pure and 20, 40, and 60% of Ag/PbS were observed at different wavelengths of 368, 369, 371, and 372 nm, respectively. Fourier transformation infrared spectroscopy peaks were found in the vibration mode of the ions due to the increment in Ag doping concentrations. These results indicate the possibility of tuning the optical structural properties of Ag-doped PbS through doping various concentrations of Ag NPs. Ag-doped PbS is considered promising future semiconductor nanomaterial, which will enhance the efficiency of photovoltaic device applications.
Graphical abstract
1 Introduction
Due to its promising and remarkable optoelectronic properties, Ag-doped lead sulfide (PbS) has traditionally been regarded a potential photovoltaic material. Ag-doped PbS has recently received a lot of interest due to its numerous potential applications in modern communication technologies such as global positioning systems, software radio systems, and environmental monitoring satellites. Furthermore, Ag-doped PbS cubic crystalline is used for optical and photonic switching. It is one of the most attractive metal sulfides for a wide range of applications such as Pb2+ ion selector sensors and photovoltaic cells [1,2].
In addition, Ag-doped PbS is an important inorganic compound which has been studied for its numerous applications. Ag-doped PbS belongs to II–VI compound semiconductor nano-materials with a cubic crystal structure. The Ag-doped PbS belongs to the space group Fm3m and has the lattice constant a = 5.939 Å. The lead and sulfur ions occupy sites 4(a) with coordinates (0, 0, 0) and sites 4(b) with coordinates (1/2, 1/2, 1/2), respectively. Ag-doped lead sulfide (Ag:PbS) seems to be a promising semiconductor material due to its smallest band gap (0.41 eV at 300 K) and large excitation Bohr radius of 18 nm [3,4].
The semiconductor Ag:PbS has photovoltaic and thermoelectric properties [5]. Ag:PbS semiconductor materials have good potential not only due to their tunable optical and electrical characteristics but due to their potential for use in many technological innovations such as solar cells, IR detector, photoconductor photovoltaic cells, and electrochemical storage devices [6,7]. Their properties are dependent on the structure, shape, phase, chemical composition, size, size distribution, and synthesis method of nanoparticles (NPs) [8,9].
Ag:PbS is one of those nanomaterials used by industries for photo-detector and photovoltaic solar cells energy storage applications. The binary compound semiconductor of groups II and IV is prominent nanomaterial to produce photonic devices such as photoconductive cells, solar cells, photocatalytics, LEDs, and memory storage devices. Ag:PbS is a prominent narrow band gap nanomaterial. It is one of the fascinating metal sulfides for a wide range of photo-detector applications [10,11].
Recently Ag:PbS nanostructures have been extensively used for photovoltaic applications. Ag:PbS NP photo-detector shows excellent efficiency [12]. Normally, high dark current lead to high short noise, the noise that occurs due to the low presence of light in the photodetector. Studies show that black crystal of controlled layer phosphorus can be used for optimizing band gap of highly responsive photo-detector at specific wavelength where low dark current certainly achieved [13]. Blocking layers have also been reported to reduce the dark current in tin (II) phthalocyanine in photovoltaic cells [14]. Morphological and molecular structures are also a main factor influencing dark current density in organic photovoltaic devices based on interaction with molecular donor materials [15]. Meanwhile, minimizing dark current had shown a significant effect in speeding up the response of photovoltaic UV detectors [16]. For ensuring the excellent performance of photovoltaic devices dark currents should be less and the dissociation of light generated charge carriers must be enhanced [17]. Ag is a good metal element with unique characteristics. Furthermore, it behaves as an electron contributor when it is substituted into the PbS NPs as a result of decrement in the p-type character, and in turn, the dark currents decrease [18].
In this study, Ag:PbS nanomaterials were found to be convenient and efficient semiconductors for applications in electronic devices. Doping of Ag with any element may influence its structural, optoelectronic, and photonic properties. Ag nanomaterials have received considerable attention because of its extraordinary role in semiconductors for photovoltaic cells [19,20,21]. In this work, Ag:PbS NPs in the porous form have been prepared using the facile hydrothermal method for applications in electronic devices while using PbCl2 and AgNO3 as chemical reactants at 250°C.
2 Experimental details
Lead chloride (PbCl2) and Na2S used in this process as starting chemicals were of high purity grade, and silver nitrate (AgNO3) was applied as a dopant for all prepared samples except one. X-ray diffraction (XRD) results were obtained through an X-ray diffractometer using nickel-filtered Cu Kα radiation. Scanning electron microscopic (SEM) images were obtained on an LEO device model 1455VP. Absorption wavelength and band gap were observed using 5000 UV NIR spectrophotometer. The Fourier transformation infrared spectroscopy (FTIR) observed on a Perkin-Elmer GX FTIR was used to obtain 10 cm−1 resolution spectrum in the range of 500–4,000 cm−1.
2.1 Preparation of Ag:PbS NPs
Pure PbCl2 was taken 100% and dissolved in 50 mL distilled water and stirred for 1 h. This was called solution “A.” In another beaker with a volume of 250 mL sodium sulfide (Na2S) 1.95 g was dissolved in 50 mL distilled water and stirred for 1 h. This was called solution “B.” Cetyl trimethyl-ammonium bromide (CTAB) 0.1 g was also mixed in the solution of PbCl2. These solutions were mixed while being continuously stirred in a beaker for 1 h. The quantity of the material was 100 mL. Around 10 mL of ammonia (NH3) was added in the mixture of PbCl2 solution inside the flask. The addition of improper resolution (NH3) was continued till pH 7 was reached. After this step, the solution of mixture of “A” and “B” was about 150 mL.
A PbCl2 solution of milky color was obtained. Moreover, green color Na2S was mixed till its color changed to brown. After this, at room temperature, the prepared milky color solution was stirred for 1 h, so that the homogeneity of the prepared solution can be easily maintained. The same procedure was used in samples S2, S3, and S4 for 2 h, respectively. Later, AgNO3 was used as dopant for the other three samples. The concentrations were taken as 20% AgNO3 and 80% PbCl2 for sample S2, 40% AgNO3 and 60% PbCl2 for sample S3, and 20% AgNO3 and 80% PbCl2 for sample S4, while the concentration of Na2S was kept the same in all the four samples. At the bottom of the beaker grains of milky colors were established. Milky color synthesized NPs were cleaned through distilled water till it became neutral (pH = 7). After the cleaning and filtration process, the ending NPs were put into a china dish. The sample was dehydrated in an oven for 2 h at 60°C. This solution was kept in two different size autoclaves and kept in the oven for 17 h at the temperature of 250°C as shown in Figure 1. After the samples cooled down they were centrifuged for 5 min at 600 rev s−1. The water was discharged and the process was repeated. The obtained compound is passed through the sonication process. Furthermore, the paste was kept in the furnace for 17 h. Finally, when it dried, the sample was grinded with the help of mortar and pestle to turn it into powder form. PbS samples prepared in different concentration ratios are presented in Table 1.
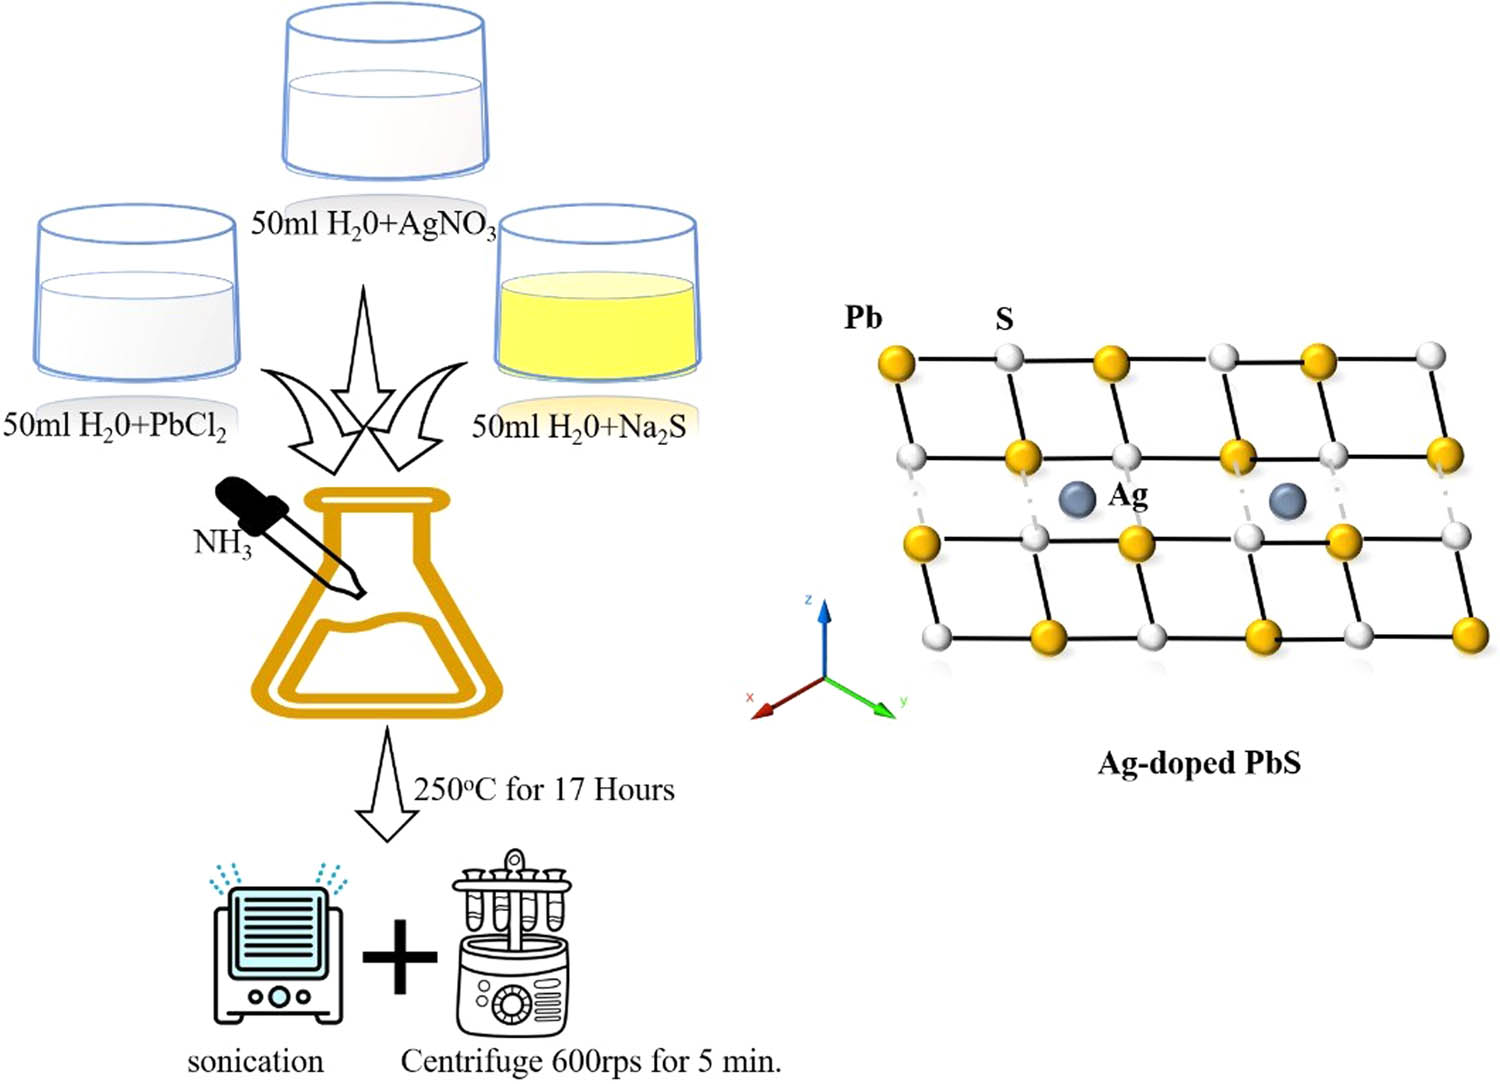
Experimental diagram of sample preparation of pure PbS and Ag:PbS at different concentrations.
Samples of PbS (in 50 mL), AgNO3 (in 50 mL), and Na2S (in 50 mL) prepared with different ratios
| Serial no. | PbCl2 (g) | AgNO3 (g) | Na2S (g) | CTAB (g) | NH3 (mL) |
|---|---|---|---|---|---|
| Sample S1 | 100% | 1.95 | 0.1 | 10 | |
| Sample S2 | 80% | 20% | 1.95 | 0.1 | 10 |
| Sample S3 | 60% | 40% | 1.95 | 0.1 | 10 |
| Sample S4 | 40% | 60% | 1.95 | 0.1 | 10 |
3 Results and discussion
3.1 Phase analysis by XRD
XRD was used to observe phase formation and the average crystallite size of pure PbS and Ag substituted PbS. Figure 2 shows the XRD results extracted of pure PbS and Ag:PbS NPs at different concentrations of Ag with 20, 40, and 60%. The results showed that the samples had cubic structure and no other impurity was present up to 20%. However, at 60% small impurities were present and at 2θ angle = (50–52.5°), (311) and (222) peaks were not clearly separated. XRD analysis of PbS NPs revealed the formation of cubic phase PbS NPs with the Fm3m space group. It is noted that some peaks were shifted toward higher 2θ while increasing the concentrations of Ag dopant in PbS NPs which may be due to micro strain in the product. As the dopant element Ag was increased from 20, 40, and 60%, the peak for plane (111) was shifted to larger angles, whereas the peak (422) was approximately unchanged. The peaks merged to a single (311) and (331) peak, at a point of 20, 40, and 60% Ag content. Sharp peaks in Figure 2 show that pure PbS NPs have the smallest crystallite size and lattice parameters, but on the other side, the crystalline behavior of Ag:PbS NPs increased with the increase in the concentrations of 20, 40, and 60% of Ag dopant. The findings showed that the cubic structure of Ag:PbS with increasing content of Ag has small distortions.
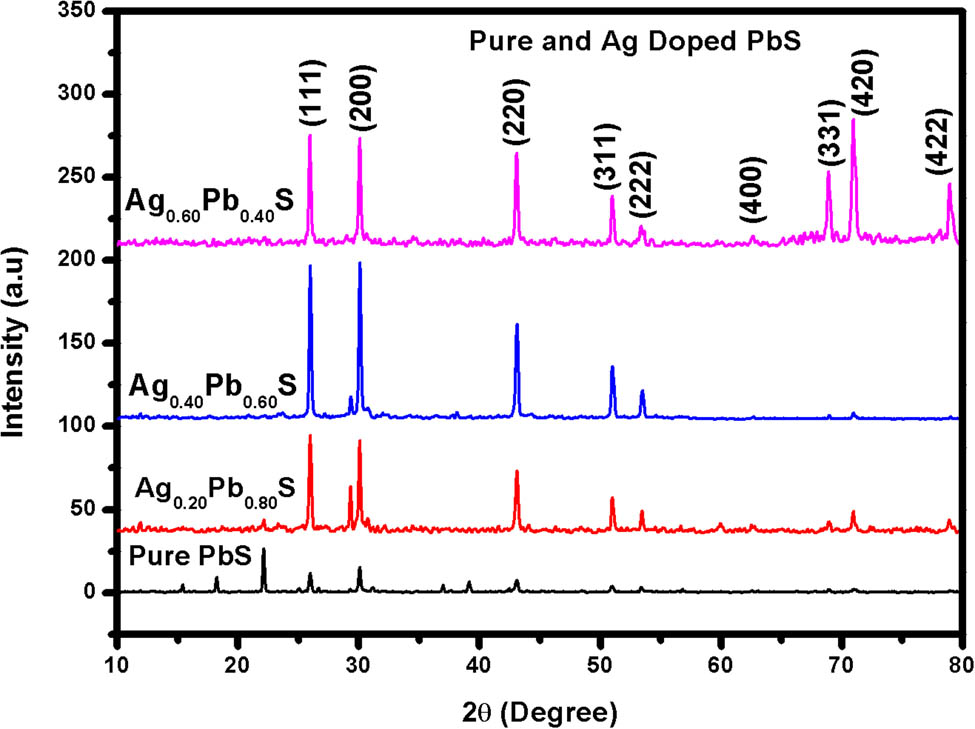
XRD pattern of pure PbS and Ag:PbS at different concentrations: (a) 20%, (b) 40%, and (c) 60%.
Lattice constant (a) states the physical quantity of unit cells. Lattice constants in three dimensions mostly have three constants, represented as a, b, and c. Interplanar spacing (h, k, l) are designated planes and prominent miller indices adjacent planes [22].
The crystallite size (D) is a calculation made from XRD investigation referring to certain angles using Scherrer’s formula. Crystallite size is calculated in nano-meter. The factor (K) in its shape range changes with the orignal shape of the crystal Θ is signify of Bragg’s angle. β is represents the line broadening (bisector) at half intensity of XRD peak, after removing the helpful line increase, in radians (r) [23].
Atomic packing factor of cubical architecture can be calculated through the following formula [24,25,26]:
Density (ρ x ) of X-ray can be observed by using the following formula:
where Z indicates the atomic number contained in a unit cell (Z = 8), M denotes the compound molecular weight of, and N A is the Avogadro number [27].
Strain of the unit cell of a crystal lattice can be calculated using the following equation [28]:
The crystallite size of the samples was found to be 6.49 nm for undoped PbS but 7.54, 8.43, and 9.55 nm for 20, 40, and 60% of Ag-doped NP respectively as shown in Table 2. The porosity significantly increases with the increase of Ag-doped NP in sintering temperature as shown in Figure 3 [29,30,31]. In equation (8) density (ρ
x
) of X-ray and (
Lattice parameters for pure PbS and Ag:PbS at (a) 20%, (b) 40%, and (c) 60%
| Calcination Ag content | Crystallite size (nm) | d-spacing | Lattice constant | X-ray density (g cm−3) | Porosity (%) |
|---|---|---|---|---|---|
| Pure | 6.49 | 2.8882 | 5.7764 | 1.6489 | 3.51 |
| 20% Ag | 7.54 | 2.9672 | 5.9344 | 1.5206 | 3.65 |
| 40% Ag | 8.43 | 2.9695 | 5.9390 | 1.5171 | 5.98 |
| 60% Ag | 9.55 | 2.9729 | 5.9458 | 1.5119 | 8.65 |
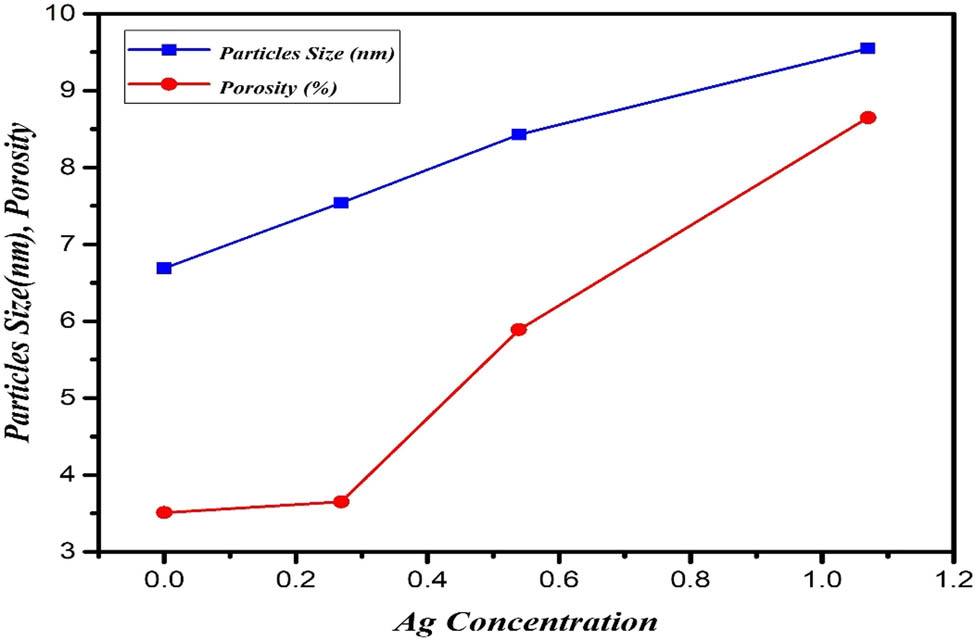
Ag concentration and particles size, porosity of undoped and doped PbS.
3.2 Morphology studied by SEM
SEM was used in the micro-structural analysis of the samples. The specimens were studied for grain size and morphology. The SEM micrograph of pure PbS and Ag:PbS clearly showed in Figure 4 that there was an inhomogeneous distribution of various sizes and morphology. The formation of nano-rods of pure PbS and an agglomeration of NPs of Ag:PbS of various sizes were seen. The formation of the agglomeration of NPs might enhance the usability of Ag:PbS samples. There was a significant change in pure PbS and morphology by the addition of Ag atoms into the PbS. The average grain size as measured from SEM images was 19.48, 21.50, and 27.50 nm for 20, 40, and 60% for Ag:PbS respectively. One concludes from the SEM images that the particle size increased with the increment of Ag concentration in PbS samples.
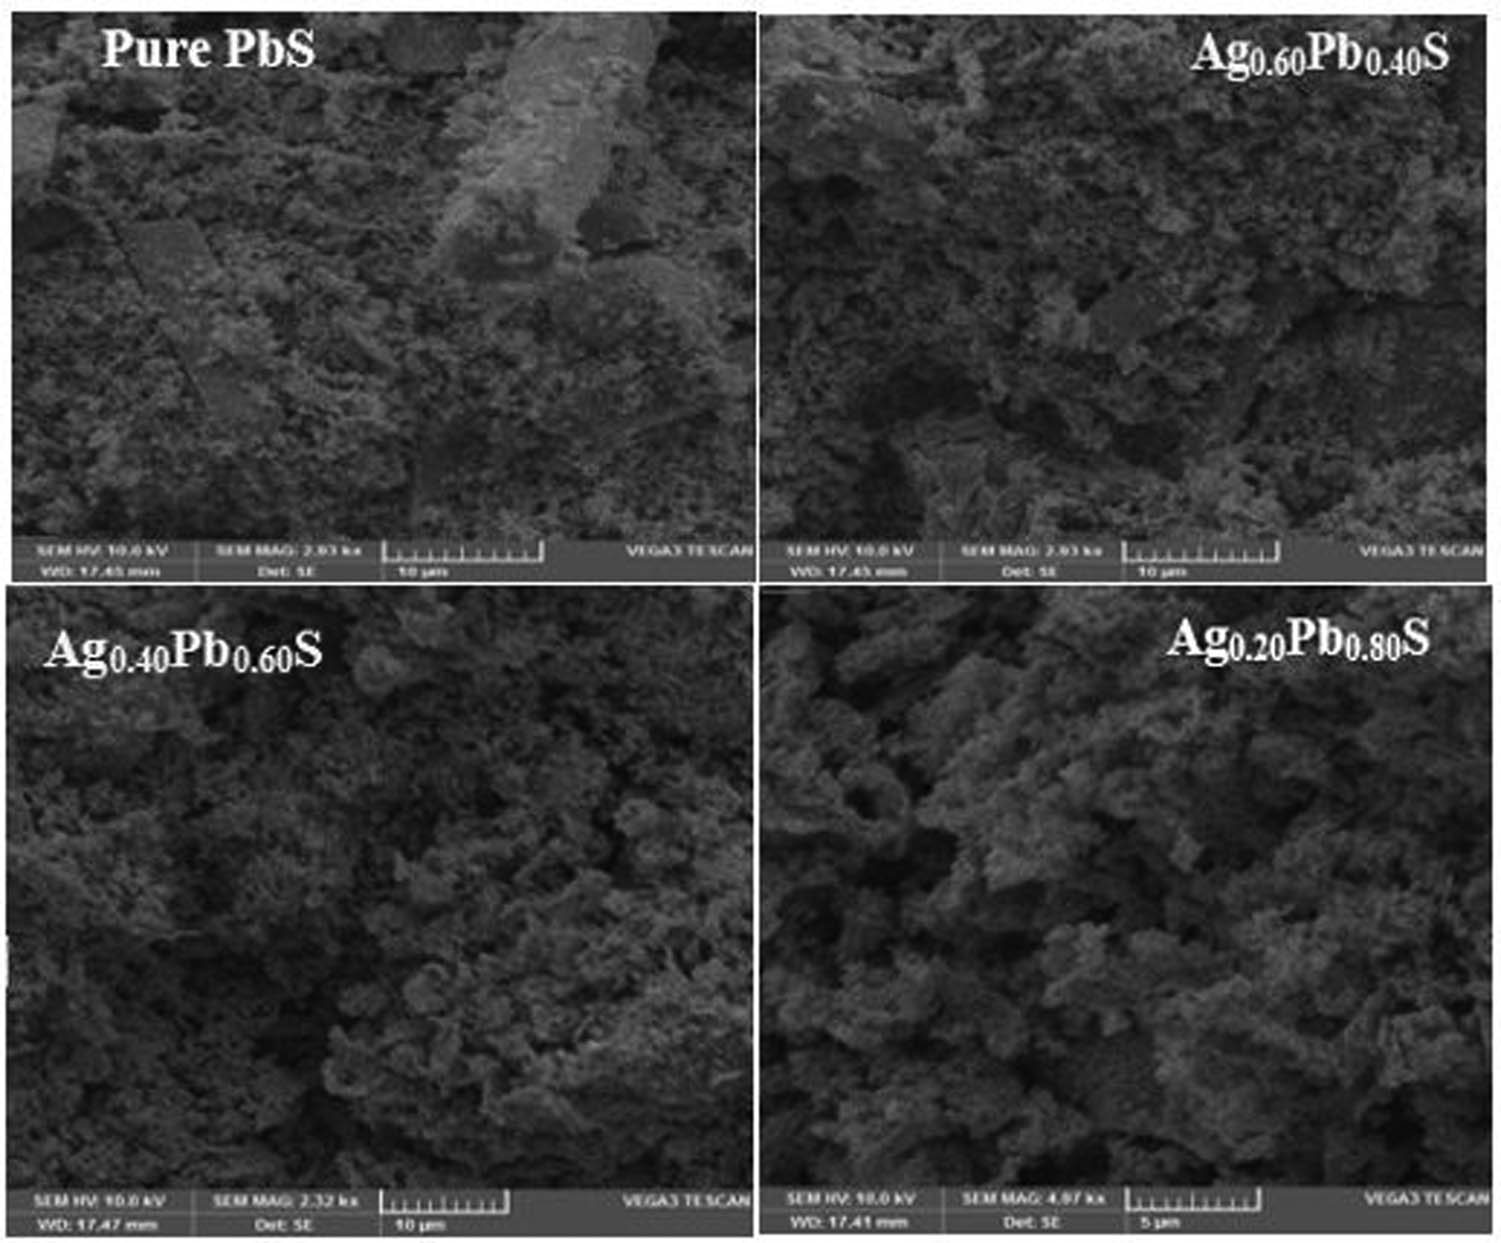
SEM micrographs of pure PbS and Ag:PbS at different concentrations: (a) 20%, (b) 40%, and (c) 60%.
3.3 Dark current measurement for pure and Ag:PbS
A dark current diode was used to conduct dark current suppression. Dark current is a small amount of current that flow through photovoltaic devices such as photodiode, solar cells, photoconductor, IR detector, charge-coupled devices, and photovoltaic cells. For the excellent performance of photovoltaic devices dark currents should be less and dissociation of light generated charge carriers must be enhanced. Ag is a good metal element with unique characteristics. Furthermore, it behaves as an electron contributor when it is substituted into the PbS NPs as a result of decrement in p-type character, and in turn, the dark currents decrease as shown in Figure 5.
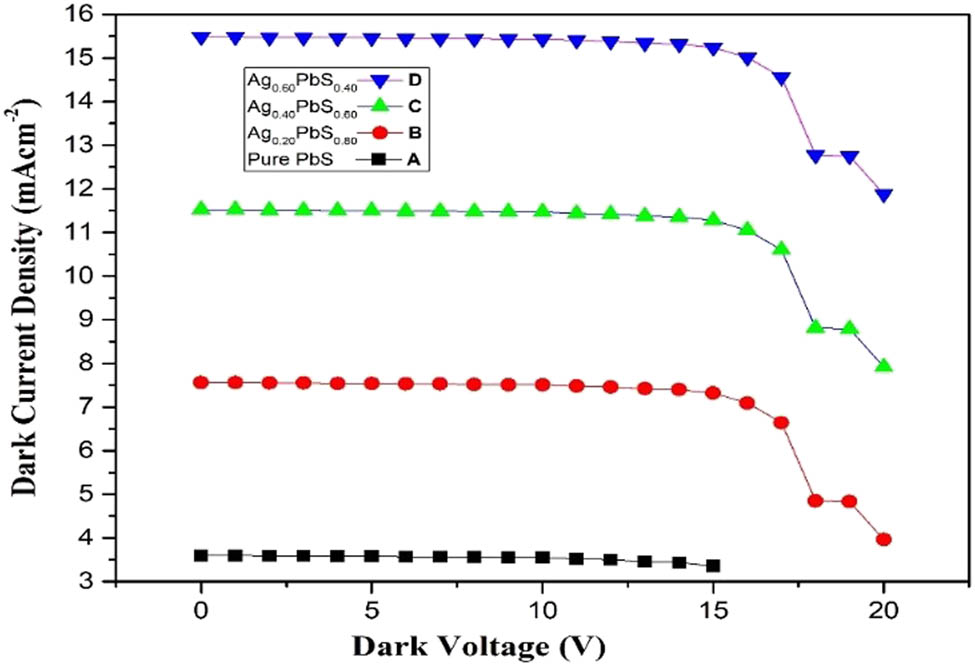
Dark current for pure PbS and Ag:PbS at different concentrations: (a) 20%, (b) 40%, and (c) 60%.
3.4 UV-Vis and band gap studies
UV-Vis absorption is studied along with the band gap measurements of pure PbS and with 20, 40, and 60% concentration of Ag:PbS as given in Figure 6. The absorption measurement has been carried out in a range of wavelengths between 200 and 900 nm. Absorption characteristic peak at wavelength 368 nm appeared for pure PbS sample. But absorption characteristics peak at wavelengths 369, 371, and 372 nm with 20, 40, and 60% concentration of Ag:PbS, respectively. According to the calculation made from the equation (9), the band gap value for (c) 60% of Ag:PbS was determined at 5.16 eV. A prominent red shift appeared for Ag–PbS in the absorption spectra compared to the pure PbS sample. UV-Vis absorption spectra measurements indicate that Ag–PbS samples can absorb more light than pure PbS samples.
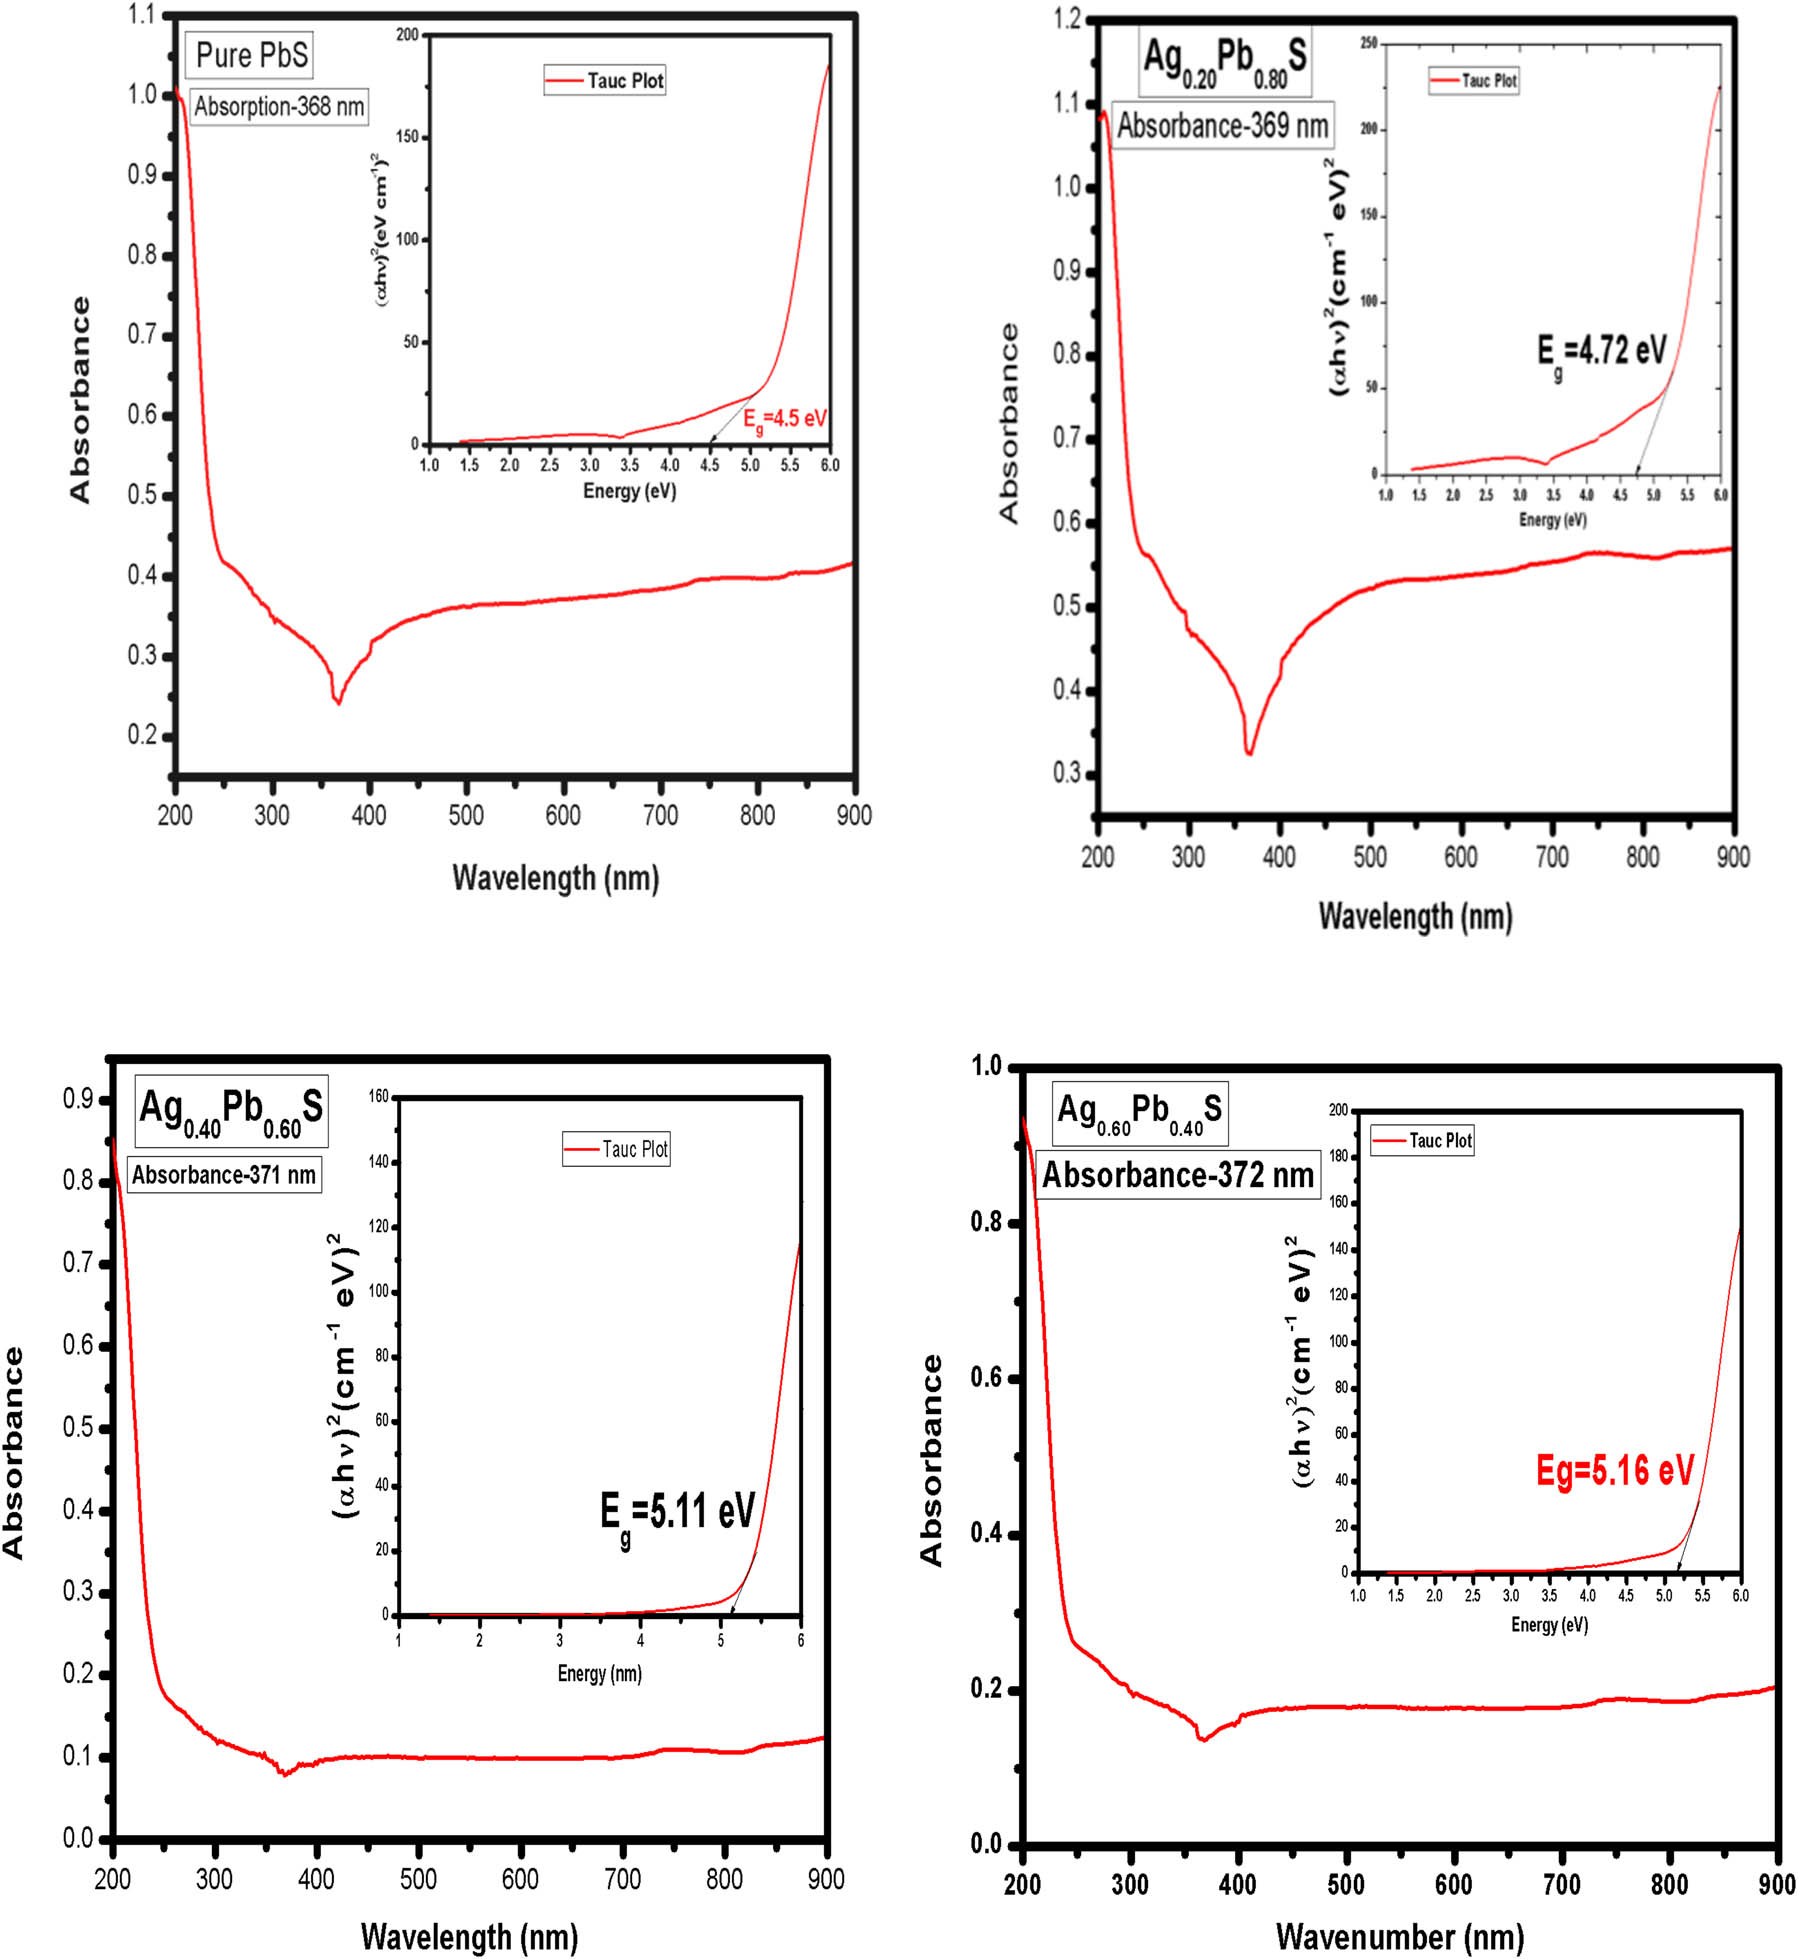
UV-Vis absorption spectra for pure PbS and Ag:PbS at different concentrations: (a) 20%, (b) 40%, and (c) 60%.
UV-Vis absorption spectra for (c) 60% g concentration of Ag:PbS is shown in Figure 6s. Using Tauc’s equation, the energy band gap of doped samples can be calculated through the tangent line in the plot of (αhν) n [32,33,34].
where “α” is absorbance coefficient, “hv” is the incident photon energy, “k” is energy independent constant, and “E g” is the energy gap of the optical band [34,35,36]. The band gap value was calculated at 5.16 eV by applying equation (9) for the absorption spectrum at wavelength 372 nm. The band gap measurements for pure PbS and 20, 40, and 60% concentration of Ag:PbS, respectively, is shown in Table 3. It has been clearly found that the Ag–PbS band gap increased as Ag concentration increased as shown in Figure 7. The data of the optical band gap for pure PbS and Ag:PbS are shown in Table 3, where the band gap value is in the range of 4.50–5.16 eV which has become ultra-wide band gap semiconductor material. Generally, wide band gap semiconductors have electronic properties which fall in between conventional semiconductor and insulators. The higher energy gap gives devices the ability to operate at higher temperature and power switching. Furthermore, the bandgap shrinks with increasing temperature. Wide band semiconductors are useful at shorter wavelengths than other semiconductor materials.
Band gap for pure PbS and Ag:PbS at (a) 20%, (b) 40%, and (c) 60%
| Ag content (g) | Absorption wavelength (nm) | Band gap (eV) |
|---|---|---|
| Pure PbS | 368 | 4.50 |
| 20% | 369 | 4.72 |
| 40% | 371 | 5.11 |
| 60% | 372 | 5.16 |
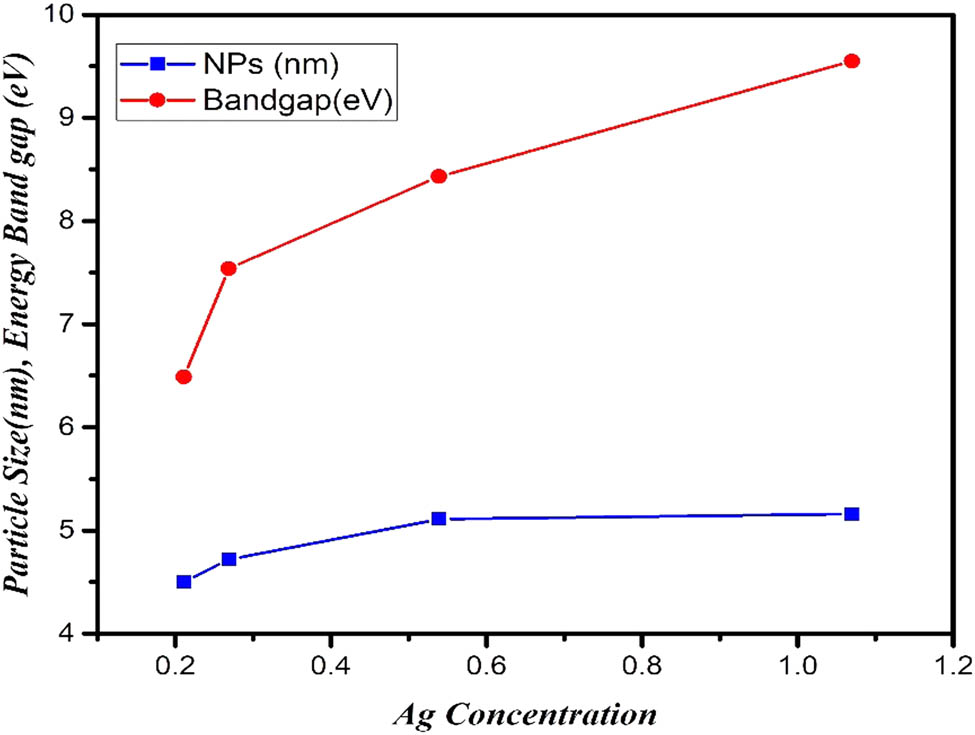
Ag concentration with particles size and band gap energy of pure PbS and Ag:PbS.
3.5 FTIR
The infrared spectrum is an important tool to probe different ordering phenomena. This technique provides information about the position of ions in the crystal, geometry, interaction of molecules, and the crystal vibration modes. The FTIR spectra of pure PbS and Ag:PbS were measured in the range of 500–4,000 cm−1 at different concentrations of 20, 40, and 60% of Ag:PbS, respectively. The FTIR spectra of pure and Ag:PbS possess four characteristic bands in the range of 500–3,000 cm−1. The values of bands according to the wave number of pure PbS are 1,036 and 3,006 cm−1, at 20%-Ag 685, 1,026, 1,382, 2,990 cm−1 and at 40%-Ag bands value are 659, 1,020, 1,372, and 2,990 cm−1. Similarly at 60%-Ag bands value are 649, 1,015, 1,351, and 2,943 cm−1.
This band pattern is assigned with the vibration mode of Ag and lead ions due to the increment of Ag concentration. This pattern indicates that band’s values are increased by increasing the Ag-doped concentration, which is shown in Figure 8. The value of transmittance is also decreased by Ag-doped concentration. However, the higher frequency band 685 cm−1 is shifted to the lower frequency band 649 cm−1 by increasing Ag doping concentration.
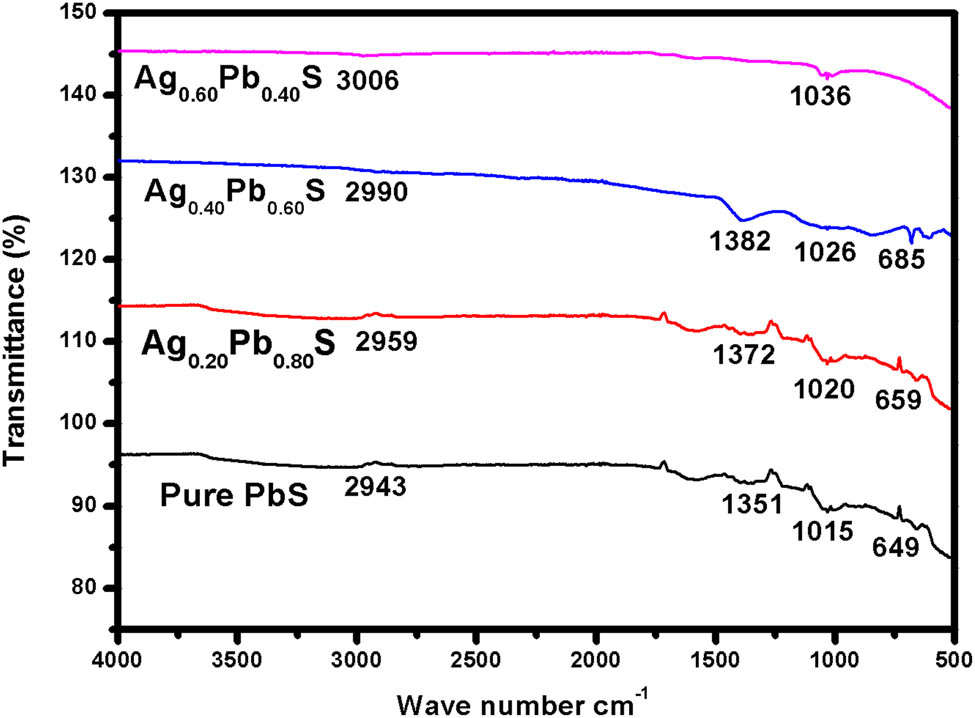
FTIR spectra for pure PbS and Ag:PbS at different concentrations: (a) 20%, (b) 40%, and (c) 60%.
4 Conclusion
In this study, a hydrothermal technique was used to synthesize PbS and Ag”PbS NPs at different concentrations of Ag for photovoltaic device application. The lattice distortion or phase changes appeared due to the shifting of diffraction angle peaks to higher 2θ in the samples of Ag:PbS with increasing Ag content. The values of the crystallite’s size, volume of the unit cell, and porosity (%) were found to increase with the increasing concentrations of Ag NPs in PbS. The pure PbS crystallite’s size is relatively small compared to Ag:PbS. The dark current decreased presumably because of the decrement in p-type character with the increment in Ag doping into PbS NPs. Absorption peaks in UV-Vis spectra corresponded to pure, 20, 40, and 60% of Ag:PbS, observed at different wavelengths of 368, 369, 371, and 372 nm, respectively. FTIR peaks found that vibration mode of ions due to increment Ag doping concentration. Experimental results indicate the possibility of tuning the optical structural properties of Ag:PbS through the doping of various concentrations of Ag NPs. Ag:PbS are promising semiconductor nanomaterials that can enhance the efficiency of photovoltaic device applications.
Acknowledgements
This work was funded by the Taif University Researchers supporting Project number (TURSP-2020/109), Taif University, Taif, Saudi Arabia. The authors also extend their appreciation to the Deanship of Scientific Research at the King Khalid University for financial support through the research groups program under grant number (R.G.P. 2/171/42).
-
Funding information: Taif University Researchers supporting Project number (TURSP-2020/109), Taif University, Taif, Saudi Arabia. The authors also extend their appreciation to the Deanship of Scientific Research at the King Khalid University for financial support through the research groups program under grant number (R.G.P. 2/171/42).
-
Author contributions: All authors have accepted responsibility for the entire content of this manuscript and approved its submission.
-
Conflict of interest: The authors state no conflict of interest.
References
[1] Lifshitz E, Sirota M, Porteanu H. Synthesis and characterization of nickel doped cadmium sulfide (CdS: Ni2+) nanoparticles. Mater Res Bull. 1999;196:126–34.10.1016/S0022-0248(98)00783-0Search in Google Scholar
[2] Zhao Y, Liao X, Hong J, Zhu J. Synthesis of lead sulfide nanocrystals via microwave and sonochemical methods. Mater Chem Phys. 2004;87:149–53.10.1016/j.matchemphys.2004.05.026Search in Google Scholar
[3] Giribabu K, Suresh R, Manigandan R, Vijayalakshmi L. Hydrothermal synthesis of lead sulphide nanoparticles and their electrochemical sensing property. Adv Mater Res. 2012;584:276–9.10.4028/www.scientific.net/AMR.584.276Search in Google Scholar
[4] Duan T, Lou W, Wang X, Xue Q. Size-controlled synthesis of orderly organized cube-shaped lead sulfide nanocrystals via a solvothermal single-source precursor method. Colloids Surf A Physicochem Eng Asp. 2007;310:86–93.10.1016/j.colsurfa.2007.06.006Search in Google Scholar
[5] Yang YJ. A novel electrochemical preparation of PbS nanoparticles. Mater Sci Eng B. 2006;131(1–3):200–2.10.1016/j.mseb.2006.04.014Search in Google Scholar
[6] Phuruangrat A, Thongtem S, Kuntalue B. Sonochemical synthesis and characterization of lead sulfide nanoparticles. Dig J Nanomat Biostruct. 2012;7(4):1413–7.Search in Google Scholar
[7] Chongad LS, Sharma A, Banerjee M, Jain A. Synthesis of lead sulfide nanoparticles by chemical precipitation method. J Physics Conf Ser. 2016;755:012032.10.1088/1742-6596/755/1/012032Search in Google Scholar
[8] Arif M, Jameel MH, Hamzah MQ, Ruslan MS, Rizvi SZH. Co-precipitation method in synthesis and characterization of BiFeO3 doped with various concentrations of Mn nanoparticles for electronic device applications. Test Eng Mannag. 2020;83:22302–9.Search in Google Scholar
[9] Ali A, Uddin S, Iqbal Z, Lal M, Jameel MH, Zaman A, et al. Synthesis and characterizations of (Ba1-xCax) Ti4O9, 0 ≤ x ≤ 0.9 ceramics. J Mater Res Technol. 2021;11:2–7.10.1016/j.jmrt.2021.01.126Search in Google Scholar
[10] Jameel MH, Hamzah MQ, Arif M, Agam B. Synthesis and characterizations of Co-doped TiO2 nanoparticles via co-precipitation method. Solid State Technol. September, 2020;63(1):267–77.Search in Google Scholar
[11] Kuljanin J, Comor MI, Djokovi V, Nedeljkovi JM. Synthesis and characterization of nanocomposite of polyvinyl alcohol and lead sulfide nanoparticles. Mater Chem Phys. 2006;95:67–71.10.1016/j.matchemphys.2005.05.050Search in Google Scholar
[12] Pourmortazavi SM, Hajimirsadeghi SS. Statistical optimization of condition for synthesis lead sulfide nanoparticles statistical optimization of condition for synthesis. Mater Manuf Process. 2009;6914:524–8.10.1080/10426910902740161Search in Google Scholar
[13] Youngblood N, Chen C, Koester SJ, Li M. Waveguide-integrated black phosphorus photodetector with high responsivity and low dark current. Nat Photonics. 2015;9(4):247–52.10.1038/nphoton.2015.23Search in Google Scholar
[14] Li N, Lassiter BE, Lunt RR, Wei G, Forrest SR. Open circuit voltage enhancement due to reduced dark current in small molecule photovoltaic cells. Appl Phys Lett. 2009;94(2):13.10.1063/1.3072807Search in Google Scholar
[15] Perez MD, Borek C, Forrest SR, Thompson ME. Molecular and morphological influences on the open circuit voltages of organic photovoltaic devices. J Am Chem Soc. 2009;131(26):9281–6.10.1021/ja9007722Search in Google Scholar
[16] Liu Z, Zhao D, Min T, Wang J, Chen G, Wang H-X. Photovoltaic three-dimensional diamond UV photodetector with low dark current and fast response speed fabricated by bottom-up method. IEEE Electron Device Lett. 2019;40(7):1186–9.10.1109/LED.2019.2919922Search in Google Scholar
[17] Ghanbari D, Salavati-niasari M, Davar F. Synthesis of different morphologies of PbS nanostructures via hydrothermal process. High Temp Mater Process. 2012;31(6):707–10.10.1515/htmp-2011-0152Search in Google Scholar
[18] Reisfeld R. Nanosized semiconductor particles in glasses prepared by the sol–gel method: their optical properties and potential uses. J Alloy Compd. 2002;341:56–61.10.1016/S0925-8388(02)00059-2Search in Google Scholar
[19] Scanning FE. The effect of capping agent on the structural, optical properties and photocatalytic activity of MgO nanostructures. Phys B: Phys Condens Matter. 2020;583:1–7.10.1016/j.physb.2020.412064Search in Google Scholar
[20] Karami H, Ghasemi M, Matini S. Synthesis, characterization and application of lead sulfide nanostructures as ammonia gas sensing agent. Int J Electrochem Sci. 2013;8:11661–79.10.1016/S1452-3981(23)13213-5Search in Google Scholar
[21] Manouchehri S, Zahmatkesh J, Yousefi MH. Substrate effects on the structural properties of thin films of lead sulfide. J Optoelectron Nanostruct. 2018;3(2):1–18.Search in Google Scholar
[22] Sadovnikov SI, Kozhevnikova NS, Rempel AA. The structure and optical properties of nanocrytalline lead sulfide films. Semiconductors. 2010;44(10):1349–56.10.1134/S1063782610100180Search in Google Scholar
[23] Sadovnikov SI, Ishchenko AV, Weinstein IA. Synthesis and optical properties of nanostructured ZnS and heteronanostructures based on zinc and silver sul fi des. J Alloy Compd. 2020;831:154846.10.1016/j.jallcom.2020.154846Search in Google Scholar
[24] Saraidarov T, Reisfeld R. Synthesis and characterization of lead sulfide nanoparticles in zirconia-silica-urethane thin films prepared by the Sol-Gel process. J Sol-gel Sci Technol. 2003;26:533–40.10.1023/A:1020707601424Search in Google Scholar
[25] Shkir M, Khan MT, Ashraf IM, AlFaify S, EL-Toni AM, Aldalbahi A, et al. Rapid microwave-assisted synthesis of Ag-doped PbS nanoparticles for optoelectronic applications. Ceram Int. 2019;45(17):21975–85.10.1016/j.ceramint.2019.07.212Search in Google Scholar
[26] Offor PO, Whyte GM, Ezekoye VA, Omah AD, Ode SN, Ocheri C, et al. Structural, morphological and opticalproperties of spray-formed silver-doped zinc sulphide thin films. Opt Int J Light Electron Opt. 2019;185:519–28.10.1016/j.ijleo.2019.03.063Search in Google Scholar
[27] Truong L, Moody IS, Stankus DP, Je V, Mark AN, Tanguay RL. Differential stability of lead sulfide nanoparticles in influences biological responses in embryonic zebrafish. Archive Taxicol. 2011;85(7):787–98.10.1007/s00204-010-0627-4Search in Google Scholar PubMed PubMed Central
[28] Nanoparticles S, Ali MM, Mahdi HS, Parveen A, Azam A. Microstructural and optical properties of silver doped cadmium sciencedirect microstructural and optical properties of silver doped cadmium sulphide nanoparticles. Mater Today Proc. 2019;18:717–22.10.1016/j.matpr.2019.06.476Search in Google Scholar
[29] Elango M, Nataraj D, Nazeer KP, Thamilselvan M. Synthesis and characterization of nickel doped cadmium sulfide ( CdS: Ni2 +) nanoparticles. Mater Res Bull. 2012;47(6):1533–8.10.1016/j.materresbull.2012.02.033Search in Google Scholar
[30] Durán-toro VM, Price RE, Maas M, Brombach CC, Pichler T, Rezwan K, et al. Amorphous arsenic sulfide nanoparticles in a shallow water hydrothermal system. Mar Chem. 2019;211:25–36.10.1016/j.marchem.2019.03.008Search in Google Scholar
[31] Emadi H, Salavati-niasari M. Superlattices and microstructures hydrothermal synthesis and characterization of lead sulfide nanocubes through simple hydrothermal method in the presence of [bis (salicylate) lead (II)] as a new precursor. Superlatt Microstruct. 2013;54:118–27.10.1016/j.spmi.2012.10.002Search in Google Scholar
[32] Jyothilakshmi VP, Bhabhina NM, Dharsana MV, Swaminathan S. Materials Today: Proceedings Wet chemical synthesis of lead sulfide nanoparticles and its application as light harvester in photovoltaic cell. Mater Today Proc. 2020;33(3):2125–9.10.1016/j.matpr.2020.02.928Search in Google Scholar
[33] Jadhav UM, Patel SN, Patil RS. Synthesis of silver sulphide nanoparticles by modified chemical route for solar cell applications. Res J Chem Sci. 2013;3(7):69–74.Search in Google Scholar
[34] Yanuar H, Iwantono B, Nabok AV. Short communication formation and UV-Vis studies of lead sulfide nanoparticles. J Nano Electron Phys. 2019;11(2):1–4.10.21272/jnep.11(2).02029Search in Google Scholar
[35] Pirgholi G, Farjami S, Kalandaragh YA. The influence of irradiation intensity and stirring rate on the photocatalytic activity of titanium dioxide nanostructures prepared by the microwave-assisted method for photodegradation of MB from water. Phys B Phys Condens Matter. January 2020;578:411886.10.1016/j.physb.2019.411886Search in Google Scholar
[36] Hosseini Z, Kalandaragh YA, Khudayari A, Shakarab BN. Sonochemically prepared PbS nanostructures and investigation of their optical and structural properties. Optoelectron Adv Mater Rapid Commun. 2014;8:201–3.Search in Google Scholar
© 2021 Muhammad Hasnain Jameel et al., published by De Gruyter
This work is licensed under the Creative Commons Attribution 4.0 International License.
Articles in the same Issue
- Research Articles
- Improved impedance matching by multi-componential metal-hybridized rGO toward high performance of microwave absorption
- Pure-silk fibroin hydrogel with stable aligned micropattern toward peripheral nerve regeneration
- Effective ion pathways and 3D conductive carbon networks in bentonite host enable stable and high-rate lithium–sulfur batteries
- Fabrication and characterization of 3D-printed gellan gum/starch composite scaffold for Schwann cells growth
- Synergistic strengthening mechanism of copper matrix composite reinforced with nano-Al2O3 particles and micro-SiC whiskers
- Deformation mechanisms and plasticity of ultrafine-grained Al under complex stress state revealed by digital image correlation technique
- On the deformation-induced grain rotations in gradient nano-grained copper based on molecular dynamics simulations
- Removal of sulfate from aqueous solution using Mg–Al nano-layered double hydroxides synthesized under different dual solvent systems
- Microwave-assisted sol–gel synthesis of TiO2-mixed metal oxide nanocatalyst for degradation of organic pollutant
- Electrophoretic deposition of graphene on basalt fiber for composite applications
- Polyphenylene sulfide-coated wrench composites by nanopinning effect
- Thermal conductivity and thermoelectric properties in 3D macroscopic pure carbon nanotube materials
- An effective thermal conductivity and thermomechanical homogenization scheme for a multiscale Nb3Sn filaments
- Friction stir spot welding of AA5052 with additional carbon fiber-reinforced polymer composite interlayer
- Improvement of long-term cycling performance of high-nickel cathode materials by ZnO coating
- Quantum effects of gas flow in nanochannels
- An approach to effectively improve the interfacial bonding of nano-perfused composites by in situ growth of CNTs
- Effects of nano-modified polymer cement-based materials on the bending behavior of repaired concrete beams
- Effects of the combined usage of nanomaterials and steel fibres on the workability, compressive strength, and microstructure of ultra-high performance concrete
- One-pot solvothermal synthesis and characterization of highly stable nickel nanoparticles
- Comparative study on mechanisms for improving mechanical properties and microstructure of cement paste modified by different types of nanomaterials
- Effect of in situ graphene-doped nano-CeO2 on microstructure and electrical contact properties of Cu30Cr10W contacts
- The experimental study of CFRP interlayer of dissimilar joint AA7075-T651/Ti-6Al-4V alloys by friction stir spot welding on mechanical and microstructural properties
- Vibration analysis of a sandwich cylindrical shell in hygrothermal environment
- Water barrier and mechanical properties of sugar palm crystalline nanocellulose reinforced thermoplastic sugar palm starch (TPS)/poly(lactic acid) (PLA) blend bionanocomposites
- Strong quadratic acousto-optic coupling in 1D multilayer phoxonic crystal cavity
- Three-dimensional shape analysis of peripapillary retinal pigment epithelium-basement membrane layer based on OCT radial images
- Solvent regulation synthesis of single-component white emission carbon quantum dots for white light-emitting diodes
- Xanthate-modified nanoTiO2 as a novel vulcanization accelerator enhancing mechanical and antibacterial properties of natural rubber
- Effect of steel fiber on impact resistance and durability of concrete containing nano-SiO2
- Ultrasound-enhanced biosynthesis of uniform ZnO nanorice using Swietenia macrophylla seed extract and its in vitro anticancer activity
- Temperature dependence of hardness prediction for high-temperature structural ceramics and their composites
- Study on the frequency of acoustic emission signal during crystal growth of salicylic acid
- Controllable modification of helical carbon nanotubes for high-performance microwave absorption
- Role of dry ozonization of basalt fibers on interfacial properties and fracture toughness of epoxy matrix composites
- Nanosystem’s density functional theory study of the chlorine adsorption on the Fe(100) surface
- A rapid nanobiosensing platform based on herceptin-conjugated graphene for ultrasensitive detection of circulating tumor cells in early breast cancer
- Improving flexural strength of UHPC with sustainably synthesized graphene oxide
- The role of graphene/graphene oxide in cement hydration
- Structural characterization of microcrystalline and nanocrystalline cellulose from Ananas comosus L. leaves: Cytocompatibility and molecular docking studies
- Evaluation of the nanostructure of calcium silicate hydrate based on atomic force microscopy-infrared spectroscopy experiments
- Combined effects of nano-silica and silica fume on the mechanical behavior of recycled aggregate concrete
- Safety study of malapposition of the bio-corrodible nitrided iron stent in vivo
- Triethanolamine interface modification of crystallized ZnO nanospheres enabling fast photocatalytic hazard-free treatment of Cr(vi) ions
- Novel electrodes for precise and accurate droplet dispensing and splitting in digital microfluidics
- Construction of Chi(Zn/BMP2)/HA composite coating on AZ31B magnesium alloy surface to improve the corrosion resistance and biocompatibility
- Experimental and multiscale numerical investigations on low-velocity impact responses of syntactic foam composites reinforced with modified MWCNTs
- Comprehensive performance analysis and optimal design of smart light pole for cooperative vehicle infrastructure system
- Room temperature growth of ZnO with highly active exposed facets for photocatalytic application
- Influences of poling temperature and elongation ratio on PVDF-HFP piezoelectric films
- Large strain hardening of magnesium containing in situ nanoparticles
- Super stable water-based magnetic fluid as a dual-mode contrast agent
- Photocatalytic activity of biogenic zinc oxide nanoparticles: In vitro antimicrobial, biocompatibility, and molecular docking studies
- Hygrothermal environment effect on the critical buckling load of FGP microbeams with initial curvature integrated by CNT-reinforced skins considering the influence of thickness stretching
- Thermal aging behavior characteristics of asphalt binder modified by nano-stabilizer based on DSR and AFM
- Building effective core/shell polymer nanoparticles for epoxy composite toughening based on Hansen solubility parameters
- Structural characterization and nanoscale strain field analysis of α/β interface layer of a near α titanium alloy
- Optimization of thermal and hydrophobic properties of GO-doped epoxy nanocomposite coatings
- The properties of nano-CaCO3/nano-ZnO/SBR composite-modified asphalt
- Three-dimensional metallic carbon allotropes with superhardness
- Physical stability and rheological behavior of Pickering emulsions stabilized by protein–polysaccharide hybrid nanoconjugates
- Optimization of volume fraction and microstructure evolution during thermal deformation of nano-SiCp/Al–7Si composites
- Phase analysis and corrosion behavior of brazing Cu/Al dissimilar metal joint with BAl88Si filler metal
- High-efficiency nano polishing of steel materials
- On the rheological properties of multi-walled carbon nano-polyvinylpyrrolidone/silicon-based shear thickening fluid
- Fabrication of Ag/ZnO hollow nanospheres and cubic TiO2/ZnO heterojunction photocatalysts for RhB degradation
- Fabrication and properties of PLA/nano-HA composite scaffolds with balanced mechanical properties and biological functions for bone tissue engineering application
- Investigation of the early-age performance and microstructure of nano-C–S–H blended cement-based materials
- Reduced graphene oxide coating on basalt fabric using electrophoretic deposition and its role in the mechanical and tribological performance of epoxy/basalt fiber composites
- Effect of nano-silica as cementitious materials-reducing admixtures on the workability, mechanical properties and durability of concrete
- Machine-learning-assisted microstructure–property linkages of carbon nanotube-reinforced aluminum matrix nanocomposites produced by laser powder bed fusion
- Physical, thermal, and mechanical properties of highly porous polylactic acid/cellulose nanofibre scaffolds prepared by salt leaching technique
- A comparative study on characterizations and synthesis of pure lead sulfide (PbS) and Ag-doped PbS for photovoltaic applications
- Clean preparation of washable antibacterial polyester fibers by high temperature and high pressure hydrothermal self-assembly
- Al 5251-based hybrid nanocomposite by FSP reinforced with graphene nanoplates and boron nitride nanoparticles: Microstructure, wear, and mechanical characterization
- Interlaminar fracture toughness properties of hybrid glass fiber-reinforced composite interlayered with carbon nanotube using electrospray deposition
- Microstructure and life prediction model of steel slag concrete under freezing-thawing environment
- Synthesis of biogenic silver nanoparticles from the seed coat waste of pistachio (Pistacia vera) and their effect on the growth of eggplant
- Study on adaptability of rheological index of nano-PUA-modified asphalt based on geometric parameters of parallel plate
- Preparation and adsorption properties of nano-graphene oxide/tourmaline composites
- A study on interfacial behaviors of epoxy/graphene oxide derived from pitch-based graphite fibers
- Multiresponsive carboxylated graphene oxide-grafted aptamer as a multifunctional nanocarrier for targeted delivery of chemotherapeutics and bioactive compounds in cancer therapy
- Piezoresistive/piezoelectric intrinsic sensing properties of carbon nanotube cement-based smart composite and its electromechanical sensing mechanisms: A review
- Smart stimuli-responsive biofunctionalized niosomal nanocarriers for programmed release of bioactive compounds into cancer cells in vitro and in vivo
- Photoremediation of methylene blue by biosynthesized ZnO/Fe3O4 nanocomposites using Callistemon viminalis leaves aqueous extract: A comparative study
- Study of gold nanoparticles’ preparation through ultrasonic spray pyrolysis and lyophilisation for possible use as markers in LFIA tests
- Review Articles
- Advance on the dispersion treatment of graphene oxide and the graphene oxide modified cement-based materials
- Development of ionic liquid-based electroactive polymer composites using nanotechnology
- Nanostructured multifunctional electrocatalysts for efficient energy conversion systems: Recent perspectives
- Recent advances on the fabrication methods of nanocomposite yarn-based strain sensor
- Review on nanocomposites based on aerospace applications
- Overview of nanocellulose as additives in paper processing and paper products
- The frontiers of functionalized graphene-based nanocomposites as chemical sensors
- Material advancement in tissue-engineered nerve conduit
- Carbon nanostructure-based superhydrophobic surfaces and coatings
- Functionalized graphene-based nanocomposites for smart optoelectronic applications
- Interfacial technology for enhancement in steel fiber reinforced cementitious composite from nano to macroscale
- Metal nanoparticles and biomaterials: The multipronged approach for potential diabetic wound therapy
- Review on resistive switching mechanisms of bio-organic thin film for non-volatile memory application
- Nanotechnology-enabled biomedical engineering: Current trends, future scopes, and perspectives
- Research progress on key problems of nanomaterials-modified geopolymer concrete
- Smart stimuli-responsive nanocarriers for the cancer therapy – nanomedicine
- An overview of methods for production and detection of silver nanoparticles, with emphasis on their fate and toxicological effects on human, soil, and aquatic environment
- Effects of chemical modification and nanotechnology on wood properties
- Mechanisms, influencing factors, and applications of electrohydrodynamic jet printing
- Application of antiviral materials in textiles: A review
- Phase transformation and strengthening mechanisms of nanostructured high-entropy alloys
- Research progress on individual effect of graphene oxide in cement-based materials and its synergistic effect with other nanomaterials
- Catalytic defense against fungal pathogens using nanozymes
- A mini-review of three-dimensional network topological structure nanocomposites: Preparation and mechanical properties
- Mechanical properties and structural health monitoring performance of carbon nanotube-modified FRP composites: A review
- Nano-scale delivery: A comprehensive review of nano-structured devices, preparative techniques, site-specificity designs, biomedical applications, commercial products, and references to safety, cellular uptake, and organ toxicity
- Effects of alloying, heat treatment and nanoreinforcement on mechanical properties and damping performances of Cu–Al-based alloys: A review
- Recent progress in the synthesis and applications of vertically aligned carbon nanotube materials
- Thermal conductivity and dynamic viscosity of mono and hybrid organic- and synthetic-based nanofluids: A critical review
- Recent advances in waste-recycled nanomaterials for biomedical applications: Waste-to-wealth
- Layup sequence and interfacial bonding of additively manufactured polymeric composite: A brief review
- Quantum dots synthetization and future prospect applications
- Approved and marketed nanoparticles for disease targeting and applications in COVID-19
- Strategies for improving rechargeable lithium-ion batteries: From active materials to CO2 emissions