Supply chain efficiency of red chilies in the production center of Sleman Indonesia based on performance measurement system
-
Susanawati Susanawati
 and
Nadia Noviyanti
and
Nadia Noviyanti

Abstract
This study aims to describe the red chili supply chain in the production center of Sleman Regency and examine its efficiency using the performance measurement system (PMS). The period of secondary data from 2016 to 2020 in this study was employed on the grounds of time before and during the COVID-19 pandemic. It was based on Presidential Decree No. 11 of 2020 concerning the determination of the Coronavirus Disease 2019 Public Health Emergency in Indonesia on March 31, 2020, designating COVID-19 as a pandemic. The sampling for this study began in Pakem District and proceeded in phases to Purwobinangun Village. Moreover, 61 respondents were determined through snowball sampling from farmers to consumers in Sleman Regency. The red chili supply chain was evaluated descriptively, and its efficiency was analyzed using the PMS indicators, encompassing production cost, profit, return on investment (ROI), and transaction cost. The findings unveiled that the red chili supply chain consisted of five chains with six actors: (1) Farmers – Auction Market – Collecting Traders – Retailers – Consumers; (2) Farmers – Auction Market – Intermediaries – Collecting Traders – Retailers – Consumers; (3) Farmers – Intermediaries – Collecting Traders – Retailers – Consumers; (4) Farmers – Intermediaries – Retailers – Consumers; and (5) Farmers – Retailers – Consumers. Regarding the efficiency of the five supply chains, Chain 2 obtained the highest profit and ROI, while Chain 5 possessed the lowest production and transaction cost, making them the most efficient ones.
1 Introduction
Indonesia is known not only as an essentially agrarian country but also as the largest archipelagic country in the world. The agricultural sector is prioritized for national economic development [1,2]. Various leading sectors in Indonesia contribute to the country’s rapid economic growth. Due to the enormous potential of natural resources, agriculture plays a pivotal role in the economy and provides stable employment for a sizable portion of the population. Facing great challenges during the COVID-19 pandemic, agriculture has become the second-largest support sector for the country’s economy [3]. In 2020, the agricultural sector absorbed 137.91 million of the labor force, with the largest percentage of 29.04% [4]. The COVID-19 pandemic has affected the balance of food supply and demand, distribution, international trade issues, and threats to food security [5].
Additionally, Indonesia has much untapped potential in the horticulture industry. Fruits, vegetables, biopharmaceutical plants, and ornamental plants all fall under the horticulture umbrella [6]. Compared to 2020, red chili consumption in 2021 rose by 7.71%, reaching 1.806 kg/capita/year. Accordingly, red chili consumption is predicted to rise further in 2023 and 2024 [7]. The rise in red chili demand by households generates an upward production trend, having implications for changes in the price of red chilies [8]. In general, chili peppers contain nutrients and vitamins, including calories, protein, fats, carbohydrates, calcium, vitamin A, vitamin B1, and vitamin C [9].
Moreover, Tsurayya and Kartika [10] noted that chilies (Capsicum annuum L.) could potentially be exploited as a vegetable product with significant economic value. Indonesian people enjoy chilies in either large or small quantities; therefore, their inclusion on menus is often well received. Since chilies have become a popular cooking spice, the production has a sizable proportion of the market and relies on several commodities whose prices are subject to significant swings; thus, chili production impacts inflation rates in Indonesia [11].
Table 1 displays the yield, harvested area, and productivity of red chilies from 2016 to 2022. These data depict an increasing trend in Indonesia’s annual red chili production. In 2020, during the COVID-19 pandemic, the red chili crop reached its peak productivity of 10.79 tonnes/hectare. The Special Region of Yogyakarta on the island of Java is one of the ten provinces of red chili production center in Indonesia, contributing 2.25% of the country’s total red chili production [7].
Production, harvested area, and productivity of red chilies in Indonesia (2016–2022)
| Year | Production (tonne) | Harvest area (hectare) | Productivity (tonne/hectare) |
|---|---|---|---|
| 2016 | 1,045,587 | 123,404 | 8.47 |
| 2017 | 1,206,266 | 142,547 | 8.46 |
| 2018 | 1,206,737 | 137,596 | 8.77 |
| 2019 | 1,214,419 | 133,436 | 9.10 |
| 2020 | 1,264,190 | 117,127 | 10.79 |
| 2021 | 860,185 | 82,804 | 10.39 |
| 2022 | 1,017,381 | 95,564 | 10.65 |
Source: ref. [12].
Table 2 illustrates a steady upward trend in the harvested area of chili plants in the Special Region of Yogyakarta over the past 8 years, with the curly red chilies benefiting from this trend. With an annual average harvest size of 3,484 hectares, the curly red chili harvested area accounted for 67.09%. Meanwhile, the average harvested bird’s eye chili area was 1,709 hectares yearly, contributing 32.91%.
Harvested area of chilies by plant type in the special region of Yogyakarta 2016–2023 (hectare)
| Plant type | Year | Average | Contribution (%) | |||||||
|---|---|---|---|---|---|---|---|---|---|---|
| 2016 | 2017 | 2018 | 2019 | 2020 | 2021 | 2022 | 2023 | |||
| Curly red chili | 3,376 | 3,581 | 3,777 | 3,918 | 4,583 | 4,345 | 3,869 | 419 | 3,484 | 67.09 |
| Bird’s eye chili | 1,072 | 1,353 | 1,375 | 1,540 | 2,007 | 1,991 | 2,086 | 2,244 | 1,709 | 32.91 |
| Total | 4,448 | 4,934 | 5,152 | 5,458 | 6,590 | 6,336 | 5,955 | 2,663 | 5,192 | 100 |
Source: ref. [13].
Table 3 displays the economic worth of red chili harvests in the Special Region of Yogyakarta during the past 8 years. Kulon Progo Regency’s 74,472-tonne average production of red chilies accounted for 73.82% of the total, making it the highest red chili producer. Subsequently, Sleman Regency, with an average of 20.578 tonnes and a contribution of 20.40%, had the second most incredible average of red chili production.
Annual Production of Red Chilies (tonne) in the Special Region of Yogyakarta (2016–2023)
| Year | Regency | Total | |||
|---|---|---|---|---|---|
| Kulon Progo | Bantul | Gunung Kidul | Sleman | ||
| 2016 | 215,995 | 7,973 | 4,273 | 55,549 | 283,790 |
| 2017 | 201,848 | 14,976 | 4,607 | 73,733 | 295,164 |
| 2018 | 25362.20 | 1595.70 | 314.8 | 7170.60 | 34,443 |
| 2019 | 24493.70 | 1,654 | 385.6 | 6399.30 | 32,933 |
| 2020 | 31525.60 | 6460.30 | 234.5 | 6314.20 | 44,535 |
| 2021 | 30847.60 | 2562.70 | 16.50 | 4718.40 | 38,145 |
| 2022 | 28289.90 | 214.10 | 263.40 | 4897.30 | 33,665 |
| 2023 | 37416.90 | 191.40 | 993.50 | 5841.60 | 44,443 |
| Average | 74,472 | 4,453 | 1,386 | 20,578 | 100,890 |
| Contribution (%) | 73.82 | 4.41 | 1.37 | 20.40 | 100.00 |
Source: ref. [13].
The demand for red chilies is not solely met within Sleman Regency, even though it has become the second-biggest red chili production center in the Special Region of Yogyakarta. Large restaurants in and around Yogyakarta and other major cities like Jakarta, Bogor, Batam, and places on Sumatra Island are all able to obtain the red chilies they need from this one source [14]. Due to seasonality, the availability of red chilies on the market fluctuates. Red chilies are in great demand, but the supply is spotty; therefore, the price tends to fluctuate due to this mismatch [15].
Red chili farmers sometimes sell their crops at low prices immediately after harvest to offset the high cost of preserving red chili, which is perishable if no special treatment is given. Three are types of flows in the supply chain of red chili distribution from farmers to consumers: (1) The flow of information travels in two ways (from farmers to consumers and vice versa); (2) The flow of goods occurs in one direction from farmers to consumers; and (3) One-way flow of money from consumers to farmers [16].
Several supply chain actors contribute to distributing red chilies from farmers to consumers. This interaction among stakeholders is managed to achieve a sustainable supply chain [17]. According to [18], every actor in the supply chain possesses objectives, key performance indicators, and optimization criteria. The divergent goals of the various actors influence price discrepancies across supply chain actors. These price differences require an efficiency analysis to measure the costs incurred and received by each supply chain actor. From the horizontal perspective, there are five main actors in the supply chain: supplier, manufacturer, wholesaler, retailer, and customer [19]. Conversely, the vertical perspective comprises five main supply chain actors: buyer, carrier, warehouse, customer, and seller [20].
A worldwide pandemic called COVID-19 has spread to every corner of the globe, escalating the trend of online food demand. This increase has led to several e-commerce services for food products growing rapidly. The demand for food products through e-commerce has positively affected farmers experiencing limited access due to the implementation of large-scale social restriction policies [21].
There are bottlenecks in food distribution, particularly red chilies, which leads to an overabundance of the spice in some regions and a scarcity in others [22]. To fulfill the demand for red chilies during the COVID-19 pandemic, the actions of every actor involved in the supply chain have shifted. Farmers have begun to utilize the Internet to market red chilies, and consumers are increasingly buying goods online [23]. Restricting community activities reduces demand for all actors in the supply chain, affecting the regional price dynamics [24]. It becomes a problem in the food supply chain for commodities such as red chili peppers [25].
Due to a different adaptation by each supply chain actor, the red chili supply chain and distribution patterns shifted throughout the COVID-19 pandemic. Distribution cost for each supply chain actor is affected by shifts in distribution patterns. Because of the limits placed on inter-regional movement, the availability of red chilies is also affected. To reduce the transaction cost, supply chain actors increasingly communicate with one another through digital channels [26]. The effectiveness of the red chili supply chain is measured by how well it gets transported from farmers to consumers. Each Red Chili supply chain actor must have his production cost, transaction cost, profit, return on investment (ROI), and inventory analyzed. During the COVID-19 pandemic, some supply chain actors preferred to move to digital channels to reduce distribution costs and quantities of red chili production, expecting that distribution between supply chain actors could run well.
2 Research method
As displayed in Table 3, Sleman Regency, the second-largest red chili production center, was selected as the study’s location. This region also possessed a distinct auction market from those in the Special Region of Yogyakarta. An application called dipanen.id was utilized within the red chili auction to limit the spread of COVID-19. The sampling of this study was carried out through the following stages:
Based on information from the [27], the first stage was conducted at the district level. The majority of red chili in Sleman Regency comes from the Pakem District. In 2016–2020, Pakem Sub-district produced the highest average red chili production compared to 16 other sub-districts in Sleman Regency, which was 1270.9 tons per year.
The second stage was conducted at the village level using information from the Regional Technical Implementation Unit, the Nature Conservation and Development Agency [28]. Pakem sub-district has five villages namely Purwobinangun, Candibinangun, Harjobinangun, Pakembinangun, and Hargobinangun. The village selection was taken based on 2019 statistics in the form of the largest amount of red chili production in the Pakem District. Purwobinangun Village was chosen because it has a total red chili production of 306 tons with a contribution value of 51.52% and is the closest village to the auction market.
The final stage in response selection uses the snowball sampling method to collect information from all supply chain actors. The snowball sampling method is the identification and selection of samples in forming a chain of interrelated relationships [46]. This method is used to limit the sale of fresh red chili to final consumers in Sleman Regency with the sample criteria of farmers who harvest red chili from June to October 2021 because farmers in Purwobinangun Village do not plant red chili with a simultaneous planting season system. The research sample includes 61 farmers who meet the criteria of 314 farmers as members of the Sleman auction market in Purwobinangun Village. Information that has been obtained from farmers is used in determining the next respondent. So that the respondents were obtained in addition to farmers such as the Chairman of the Sleman Chili Auction Market Management in Purwobinangun Village, district level Intermediaries of as many as 5 people, Collecting Traders in Sleman Regency as many as 4 people, Retailers located in Sleman market, Pakem market, Colombo market, Gentan market and Gamping market as many as 13 people and the final consumer of red chili as many as 60 people from the five markets.
This study utilized both primary and secondary data. Primary data were obtained through questionnaires encompassing supply chain actors, their roles, explicit costs, implicit costs, fixed costs, variable costs, transaction costs, pricing, and red chili production. Meanwhile, secondary data covered red chili production statistics and regional state data. Data were gathered from the Farmer Group Association in Purwobinangun Village, UPTD BP4 of Region V of Sleman Regency, and the Central Bureau of Statistics.
The Indonesian government imposed a policy of limiting community activities on January 11, 2021, precisely in seven provinces on the island of Java, one of which was the Special Region of Yogyakarta. The policy only applied until October 2021 due to a decline in COVID-19 cases [29]. The fresh red chilies destined for the final consumers in Sleman Regency were in Purwobinangun Village. Since all red chilies were sold immediately upon harvest, there was no need to track inventory levels to indicate performance. Farmers’ investment costs were generated from explicit costs.
This study employed a descriptive method. Descriptive research defines the object of study in detail, including its qualities and the frequency with which it occurs [30]. This supply chain analysis of red chilies aims to describe the actors and their roles within the chain. The illustration helped discuss the distribution of red chilies in Sleman Regency. Meanwhile, a tabular description of the roles played by actors in the red chili supply chain, from farmers to consumers, was provided.
Moreover, performance measurement system (PMS)-based performance metrics were deployed to evaluate the red chili supply chain’s effectiveness. The following are performance indicators for the red chili supply chain from farmers to retailers. Several sub-indicators measure supply chain efficiency, including production cost, transaction cost [31], profit, and ROI [32].
2.1 Production cost
This efficiency measurement distinguished farmers and other supply chain actors regarding production cost. The following is a production cost formula based on supply chain actors.
2.1.1 Farmers
Production costs incurred by red chili farmers consist of explicit and implicit costs. Explicit costs are costs incurred by red chili farmers in cultivating red chili. In contrast, implicit costs are the amount of calculated costs that red chili farmers do not incur. The production cost refers to all expenses spent for red chili farming, calculated using the following formula.
-
Informed consent: Informed consent was obtained from all respondents and informants included in this study.
-
Ethical statement: This study has complied with all ethical standards and guidelines of research conducted in a manner that ensures the integrity of the study and the protection of all respondents and informants.
2.1.2 Auction market, intermediaries, collecting traders, and retailers
Production costs at the auction market, intermediaries, collecting traders, and retailers at the Sleman Regency level were the total fixed and variable costs associated with purchasing and selling red chilies. The calculation for the total cost is as follows:
Description: TC = Total cost; FC = Fixed cost; VC = Variable cost.
2.2 Profit
The profit computation for this efficiency measurement was the same for farmers and other supply chain actors. Profit resulted from the difference between supply chain actors’ total revenue and the total cost incurred, measured in US dollars. The total production cost incurred by farmers included explicit and implicit costs. In contrast, the total cost for the supply chain actors other than farmers consisted of both fixed and variable costs. The formula for estimating profit for supply chain actors is as follows.
Description: I = Profit; TR = Total revenue; TC = Total cost.
2.3 ROI
ROI measured how efficiently each supply chain actor generated profit from investment cost. Profit divided by investment cost is the formula utilized to calculate the ROI.
2.4 Transaction cost
The transaction cost of selling red chilies encompassed contract implementation, search, and negotiating costs (Figure 1).
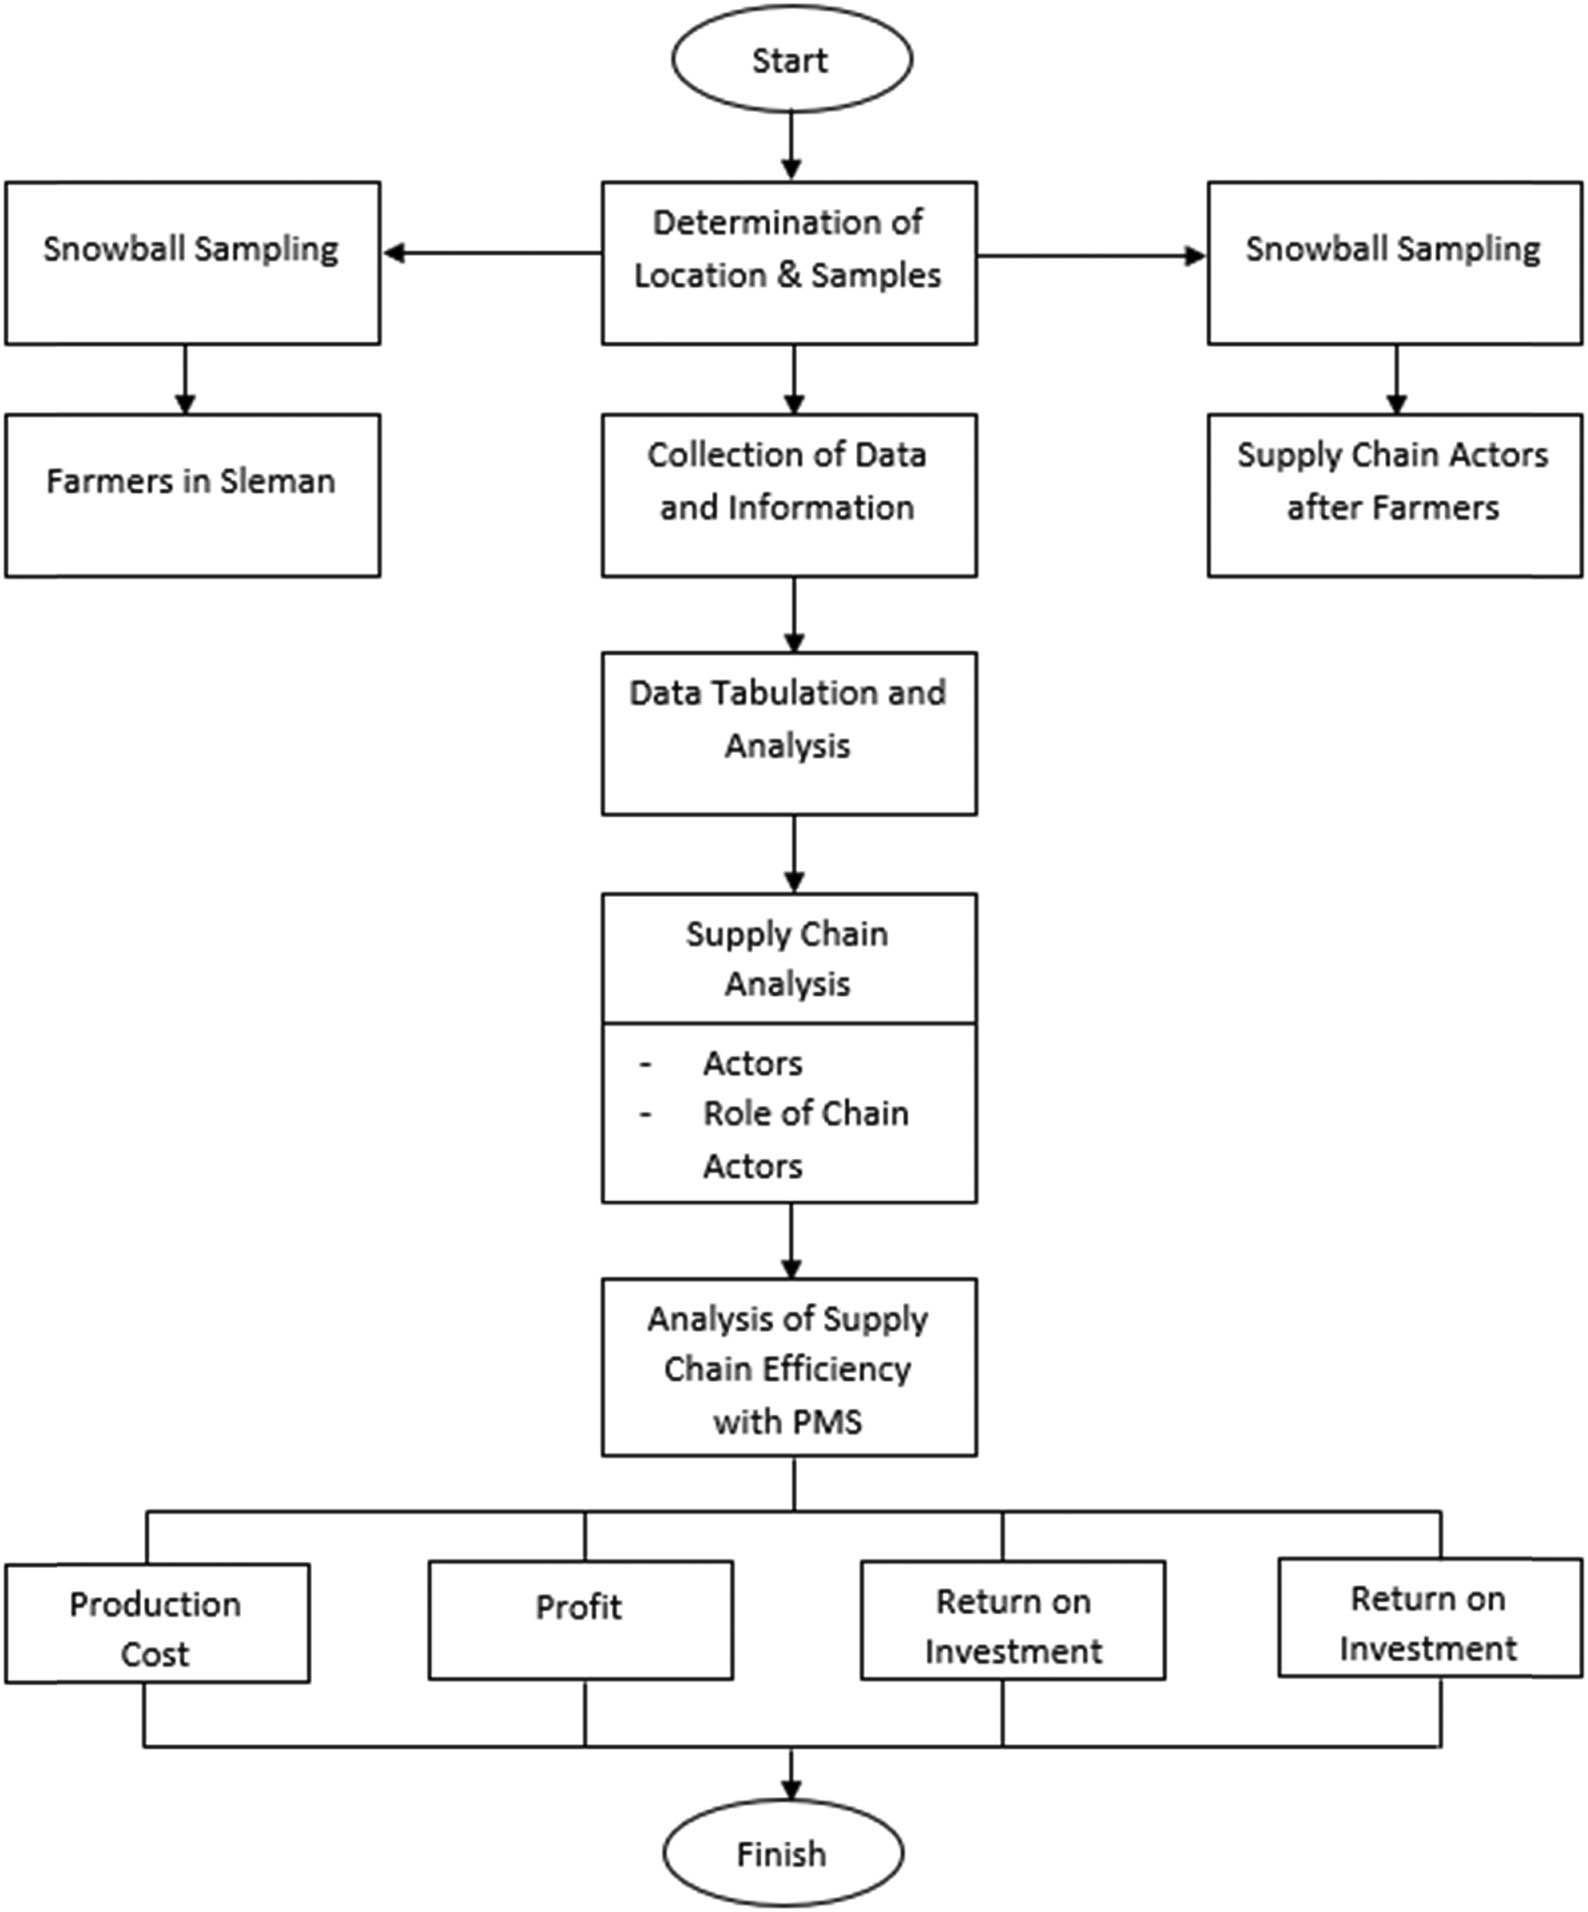
Conceptual framework of this research.
3 Results and discussion
3.1 Red chili supply chain during the COVID-19 pandemic in Sleman Regency
The red chili supply chain in Sleman Regency could be seen based on the actors and the roles of each involved actor.
3.1.1 Red chili supply chain actors in Sleman Regency
The red chili supply chain actors are individuals or institutions distributing red chilies from farmers to consumers. Figure 2 illustrates Sleman Regency’s red chili supply chain.

Red chili supply chain in Sleman Regency.
As Figure 2 exhibits, six actors in the red chili supply chain in Sleman Regency, covering farmers as red chili producers and the auction market, intermediaries, collecting traders, and retailers, are red chili providers to consumers. The supply chain actors of red chilies in Sleman Regency possessed product, money, and information flows. Red chili farmers in Purwobinangun Village were the originators of the product flow. It moved from red chili producers to supply chain operators, including the auction market, intermediaries, collecting traders, retailers, and end consumers. Money traveled from red chili consumers to actors in the supply chain, encompassing retailers, collecting traders, intermediaries, the auction market, and, eventually, red chili producers. The flows of products and money both moved in one direction: from farmers to consumers for the product flow and from consumers to farmers for the money flow. However, the flow of information went in two ways, meaning it might begin with farmers communicating with consumers or vice versa.
3.1.2 The roles of red chili supply chain actors in Sleman Regency
The red chili supply chain in Sleman Regency comprised actors who collaborated for profit. Each actor performed a specific function within the chain depending on their actions.
Table 4 describes ten roles of red chili supply chain actors in Sleman Regency. The supply chain actors responsible for sorting were farmers, the auction market, and intermediaries. Packaging and sales have become the responsibility of all supply chain parties besides consumers. The auction market, intermediaries, collecting traders, and retailers were responsible for pricing and updating price information. Price bidding was performed by intermediaries, collecting traders, and retailers. All supply chain actors, excluding farmers, were responsible for purchase and payment.
Roles of red chili supply chain actors
| No | Role | Supply chain actor | |||||
|---|---|---|---|---|---|---|---|
| Farmer | Auction market | Intermediary | Collecting trader | Retailer | Consumer | ||
| 1 | Farming | √ | — | — | — | — | — |
| 2 | Sorting | √ | √ | √ | — | — | — |
| 3 | Grading | — | √ | — | — | — | — |
| 4 | Packaging | √ | √ | √ | √ | √ | — |
| 5 | Pricing | — | √ | √ | √ | √ | — |
| 6 | Price quotation | — | — | √ | √ | √ | — |
| 7 | Updating price information | — | √ | √ | √ | √ | — |
| 8 | Purchase | — | √ | √ | √ | √ | √ |
| 9 | Sale | √ | √ | √ | √ | √ | — |
| 10 | Payment | — | √ | √ | √ | √ | √ |
3.2 Red chili supply chain efficiency during the COVID-19 pandemic in Sleman Regency
As [28] asserted, production cost, distribution cost, transaction cost, profit, ROI, and supply are indicators of efficiency performance measurement of the supply chain. Indicators investigated in this study covered production cost, profit, ROI, and transaction cost.
3.2.1 Production cost
Differences existed in cost measurement between farmers and other supply chain actors. Farmers’ production cost was obtained from the calculation of explicit, implicit, and other costs. Explicit cost components consisted of seeds, fertilizers, pesticides, outside family labor, mulch, and land rent. Implicit costs encompassed interest on own capital, family labor, and rent of own land. Other costs included fuel and farm equipment rental. In the auction market, supply chain actors, intermediaries, collecting traders, and retailers utilized total costs obtained from the calculation of fixed and variable costs. Fixed cost components included equipment depreciation, rental, and maintenance costs. Conversely, variable costs consisted of packaging, office stationery, internet data, electricity, and labor wages. The expenses of each supply chain actor varied. Rent, packaging, and labor made up the largest cost incurred in the auction market. It was caused by the large capacity of buying and selling red chilies by the auction market. Moreover, the distance of distribution required packaging that could maintain the quality of red chilies when received by buyers.
The cost differences of supply chain actors before and during the COVID-19 pandemic lay in packaging costs and labor wages due to the implementation of large-scale social restriction regulations affecting the length of time for the distribution of red chilies during the COVID-19 pandemic. To maintain the quality of red chilies, special packaging, and overtime labor were required due to frequent distribution delays.
Following Table 5, the production cost for all actors in the red chili supply chain during the harvest period from June to October 2021 was $2731.48. The auction market had the highest production cost of all actors in the red chili supply chain, at $1423.8. The auction market assessed this cost for acquiring red chilies from farmers and reselling them to collecting traders and intermediaries. In comparison, the lowest production cost appeared to be $120.11 at retailers because they did not sell red chilies in large quantities, resulting in low cost. The high production cost incurred could be due to the risks they bear in the supply chain, such as the risk of decreasing product.
Total production cost of red chili supply chain actors during the harvest period from June to October 2021
| Supply chain actor | Cost (USD) | Percentage |
|---|---|---|
| Farmers | 379.52 | 13.89 |
| Auction market | 1423.8 | 52.13 |
| Intermediaries | 500.77 | 18.33 |
| Collecting traders | 307.28 | 11.25 |
| Retailers | 120.11 | 4.40 |
| Total | 2731.48 | 100 |
3.2.2 Profit
Profit originated from the difference between supply chain actors’ total revenue and the total cost they incurred, measured in US dollars. Each supply chain actor’s revenue was calculated by multiplying the quantity of red chilies (in kilograms) by their selling price (USD). While the auction market’s income was derived by multiplying the number of red chilies sold by the charge established in the partnership agreement between the auction market and the retailers, the number of red chilies sold determined the auction market’s revenue.
The fee varied according to the normal limit for chili pricing. The agreement included a charge of $0.063 per kilogram when the price per kilogram of chilies was less than $1.26. A charge of $0.095 was applied when the prices per kilogram ranged from $1.26 to $2.46. Moreover, when the price per kilogram exceeded $2.46, the charge was $0.13. This charge was added to the chili auction price by retailers. Profit for all actors in the red chili supply chain varied depending on the quantity of red chili sales and the particular needs of each actor. All red chili supply chain actors’ earnings are displayed in the following table.
According to Table 6, the intermediaries were the most profitable actors in the red chili supply chain in Sleman Regency between June and October 2021. The profit earned by intermediaries was 57.92%, or $629.5. The intermediaries are those who buy red chili from farmers and sell the red chili to collecting traders. The intermediaries do not incur transportation costs because the buying and selling process is carried out at the location of the intermediaries. So that farmers and collecting traders bear the transportation costs. Meanwhile, farmers have the lowest profit, only $24.39. In the June–October 2021 harvest, there was a decline in prices, red chili plants were attacked by diseases such as stem rot and root rot so production was less than optimal.
Profit From the Red Chili Supply Chain Actors during the Harvest Period from June to October 2021
| Supply chain actors | Profit (USD) | Percentage |
|---|---|---|
| Farmers | 24.39 | 2.24 |
| Auction market | 208.49 | 19.18 |
| Intermediaries | 629.5 | 57.92 |
| Collecting traders | 170.68 | 15.70 |
| Retailers | 53.85 | 4.95 |
| Total | 1086.91 | 100 |
When farmers found that the red chili plants were contaminated with stem and root rot disease, they did not spray the plants for healing but immediately uprooted the plants to prevent the spread of the disease to healthy red chili plants. The removal of these plants also aims to minimize the decline in production due to crop failure and no production costs are incurred. It is corroborated by the study findings of [33], indicating that the production risk faced by farmers owing to weather fluctuations and insect and disease assaults on red chili plants exceeded 31%. Consequently, the higher the production cost, the lower the farmers’ revenue.
During the COVID-19 pandemic, due to the implementation of social restrictions and the closure of essential sectors such as restaurants, hotels, and stores, the demand for red chilies declined, causing a dramatic drop in the price of red chilies [34]. When there was an abundance of red chilies and a downturn in demand, farmers in Ternate City opted to sell them at an affordable price, resulting in a 36.7% price decrease at the farmer level [35].
The decreasing price of red chilies impacted the profit of red chili farmers in Purwobinangun Village, amounting to $24.39. Red chili farmers in Karangploso District, Malang Regency, likewise had poor profit during the COVID-19 pandemic, merely $82.42/month/hectare or $49.45 each red chili planting season with an area of 1,000 m2 [36]. The profit obtained by red chili farmers in Karangploso District, Malang Regency, was greater than that of red chili farmers in Purwobinangun Village since the red chili plants of farmers in Karangploso District were not afflicted by disease, allowing for maximum red chili production.
Farmers in Purwobinangun Village farmed red and bird’s eye chilies. Moreover, 27.87% of red chili farmers in this village moved to bird’s eye chilies when red chili plants were attacked by the stem and root rot disease, resulting in a dramatic decline in the price of red chilies. From June to October 2021, bird’s eye chilies were more expensive than red chilies. To meet the cost of red chili production, 27.87% of red chili farmers switched to bird’s eye chilies. Commodity turnover during the COVID-19 pandemic was one of the right management. It agrees with the research results of [37], stating that integrated supply chain management generated good product quality, faster product distribution, and higher profit.
3.2.3 ROI
ROI is one of the profitability ratios frequently employed to assess an organization’s financial performance based on financial reports and company profits [38]. ROI is the efficiency with which each supply chain actor converts investment cost into profit, represented as a percentage (%) [39]. According to [40], ROI provides substantial earnings exceeding the investment cost. Therefore, if the ROI is greater, the red chili business will be in better shape [41]. ROI was determined by comparing supply chain actors’ profit and investment costs throughout the red chili production from June to October 2021.
As Table 7 displays, the red chili supply chain actors with the highest ROI were retailers, with 1.8%. Therefore, if each retailer invests one US dollars, the return will be 1.8 times the amount of money deposited. This red chili business is beneficial to retailers.
ROI of all red chili supply chain actors during the harvest period from June to October 2021
| Supply chain actor | ROI (%) |
|---|---|
| Farmers | 0.1 |
| Auction market | 0.2 |
| Intermediaries | 1.1 |
| Collecting traders | 1.3 |
| Retailers | 1.8 |
| Total | 4.50 |
With a value of 0.1%, farmers obtained the lowest ROI. The lower ROI value for farmers was due to the red chili harvest from June to October 2021, when the price of red chilies was lower, and the plants were attacked by diseases such as stem and root rot, resulting in less optimal production of red chili plants. Furthermore, 27.87% of red chili farmers switched to bird’s eye chilies due to their higher prices.
3.2.4 Transaction cost
Transaction aspects are one of the most widely referenced organizational theories in operations and supply chain management research [42]. Supply chain actors pay a transaction cost when selling red chilies. As [43] stated, transaction costs include search, negotiating, and implementation costs. The costs associated with market research are those incurred in gathering information on the sale and purchase of red chilies. The exchange costs incurred during the negotiating process are referred to as negotiation costs. Meanwhile, implementation costs are spent during the contractual process.
Table 8 exhibits that only the auction market in the red chili supply chain incurred transaction costs of $29.24 used for the purchase of stationery, stamp ink, stamps, and maps. This is the cost incurred in negotiating with retailers. Collaboration agreements are negotiated between the auction market and retailers that contain a minimum of 60% of the weight of red chilies that must be purchased by the auction winner, payment is made a maximum of 2 h before the delivery of red chilies and there is a deposit rule for retailers to get access to the dipanen.id application. This agreement aims to protect the auction market from losses because the auction process until payment by retailers is done online. The decision of farmers to sell red chili in the auction market is that there is a distribution of the remaining proceeds, or the remaining profits received by the auction market for 1 year will be distributed to farmers who actively sell red chili in the auction market.
Transaction cost for red chili supply chain actors during the harvest period from June to October 2021
| Transaction cost (USD) | |||
|---|---|---|---|
| Supply chain actor | Negotiation costs | Implementation costs | Market search costs |
| Farmers | — | — | — |
| Auction market | 29.24 | — | — |
| Intermediaries | — | — | — |
| Collecting traders | — | — | — |
| Retailers | — | — | — |
| Consumers | — | — | — |
| Total | 29.24 | — | — |
3.2.5 Supply chain efficiency
The analysis of red chili supply chain efficiency employed supply chain performance indicators derived from the PMS, encompassing production cost, profit, ROI, and transaction cost for every supply chain actor. The production cost, profit, ROI, and transaction cost of the supply chain actors differed. Performance measures were tabulated according to the supply chain actors to assist in evaluating the effectiveness of the red chili supply chain. The most efficient supply chain was determined based on the overall value of each indicator inside each supply chain. A supply chain is more efficient if the overall profit and ROI value exceed the total production and transaction cost. The effectiveness of the red chili supply chain in Sleman Regency is outlined as follows.
Table 9 indicates that Chain 2 had the greatest production cost, profit, and ROI, while Chain 5 achieved the lowest results. Both Chains 1 and 2 possessed the greatest transaction cost of $29.24, while the other three had to spend $0. Four indicators were utilized to determine supply chain efficiency: production cost, profit, ROI, and transaction cost.
Red chili supply chain efficiency in Sleman Regency
| Indicator | Farmer | Auction market | Intermediary | Collecting trader | Retailer | Consumer | Total |
|---|---|---|---|---|---|---|---|
| Chain 1 | |||||||
| Production cost ($) | 379.52 | 1423.8 | — | 307.28 | 120.11 | — | 2235.02 |
| Profit ($) | 24.39 | 208.49 | — | 170.68 | 53.85 | — | 458.29 |
| ROI | 0.1 | 0.2 | — | 1.3 | 1.8 | — | 3.40 |
| Transaction cost ($) | 0 | 29.24 | — | 0 | 0 | — | 29.24 |
| Chain 2 | |||||||
| Production cost ($) | 379.52 | 1423.8 | 500.77 | 307.28 | 120.11 | — | 2731.48 |
| Profit ($) | 24.39 | 208.49 | 629.5 | 170.68 | 53.85 | — | 1086.91 |
| ROI | 0.1 | 0.2 | 1.1 | 1.3 | 1.8 | — | 4.50 |
| Transaction cost ($) | 0 | 29.24 | 0 | 0 | 0 | — | 29.24 |
| Chain 3 | |||||||
| Production cost ($) | 379.52 | — | 500.77 | 307.28 | 120.11 | — | 1310.21 |
| Profit ($) | 24.39 | — | 629.5 | 170.68 | 53.85 | — | 880.12 |
| ROI | 0.1 | — | 1.1 | 1.3 | 1.8 | — | 4.30 |
| Transaction cost ($) | 0 | — | 0 | 0 | 0 | — | 0 |
| Chain 4 | |||||||
| Production cost ($) | 379.52 | — | 500.77 | — | 120.11 | — | 1002.34 |
| Profit ($) | 24.39 | — | 629.5 | — | 53.85 | — | 709.11 |
| ROI | 0.1 | — | 1.1 | — | 1.8 | — | 3.00 |
| Transaction cost ($) | 0 | — | 0 | — | 0 | — | 0 |
| Chain 5 | |||||||
| Production cost ($) | 379.52 | — | — | — | 120.11 | — | 500.59 |
| Profit ($) | 24.39 | — | — | — | 53.85 | — | 78.38 |
| ROI | 0.1 | — | — | — | 1.8 | — | 1.90 |
| Transaction cost ($) | 0 | — | — | — | 0 | — | 0 |
The examination of the four indicators unveiled that Chain 2 was the most efficient one, with the highest profit and ROI. Moreover, Chain 5 was also considered Red Chilies’ most efficient supply chain, possessing the lowest production and transaction costs. The high-profit value in Chain 2 boosted the supply chain’s ROI. Indeed, the high ROI could be utilized to lower the supply chain investment cost [44]. In addition, effective supply chain management depends on the involvement of various stakeholders [45].
Farmers continue to sell their production other than through efficient channels because payment is given directly when farmers sell red chilies at a price determined by the intermediaries without waiting for the price of the auction results, fewer red chilies that do not pass sorting, and avoid the risk of fluctuating prices at auction by selling their products in several places. Red chili is one of the leading commodities in the horticulture sub-sector in Indonesia. Although Indonesia’s fresh red chili export potential is still low. In January–March 2021, the level of chili trade performance has decreased. However, farmers continue to plant red chilies because red chilies are seasonless, can be sold in fresh or processed form, and have high socio-economic value [7].
4 Conclusions
The results of the analysis led to the following conclusions.
During the COVID-19 pandemic in Sleman Regency, the red chili supply chain consisted of five chains of six actors: farmers, the auction market, intermediaries, collecting traders, retailers, and consumers. The red chili supply chain actors played distinct responsibilities, including red chili farming, sorting, grading, packing, pricing, price quoting, updating price information, purchasing, selling, and paying. The following are five supply chains for red chilies in Sleman Regency:
Farmers – Auction Market – Collecting Traders – Retailers – Consumers
Farmers – Auction Market – Intermediaries – Collecting Traders – Retailers – Consumers
Farmers – Intermediaries – Collecting Traders – Retailers – Consumers
Farmers – Intermediaries – Retailers – Consumers
Farmers – Retailers – Consumers
Of the five chains, 63.43% of red chili farmers sold at the auction market, 36.26% to intermediaries, and 0.31% to retailers directly.
Chain 2 was the most efficient supply chain of red chilies in Sleman Regency during the COVID-19 pandemic, with the highest profit and ROI. Meanwhile, Chain 5 was also the most efficient supply chain, with the lowest production and transaction costs.
5 Suggestions
The following suggestions could serve as a source of reference and consideration for the efficiency of the red chili supply chain in Sleman Regency:
When the price of red chilies in their fresh form is low, red chili farmers should transform fresh red chilies into processed ones, such as dry chili powder or chili sauce, to enhance profit.
For the auction market, it is planned that the harvest.id application would allow farmers to update the number of red chilies and the price information daily, in addition to being established monthly and annually concerning the data summary. Hence, it can be downloaded to ease the final auction market report creation.
Acknowledgements
We would like to thank the head of the farmers group in Sleman District, including farmers and traders, for their support and assistance in data collection of red chili supply chain network. Our sincere thanks also go to our colleagues from the Department of Agribusiness who provided expertise and support on data collection, although they may not agree with all of the interpretations provided in this paper
-
Funding information: Thank you to the Research and Innovation Center of Universitas Muhammadiyah Yogyakarta for providing financial support through applied research grants for 2021/2022 so that this research can be completed successfully.
-
Author contributions: All authors accepted the responsibility for the content of the manuscript and consented to its submission, reviewed all the results, and approved the final version of the manuscript. SS: conceptualization, methodology, and writing original draft; NN: Data collection, tabulation and editing.
-
Conflict of interest: Authors state no conflict of interest.
-
Informed consent: Informed consent was obtained from all respondents and informants included in this study.
-
Data availability statement: The datasets generated during and/or analyzed during the current study are available from the corresponding author on reasonable request.
References
[1] Hamilton HN. Indonesia’s quest for food self-sufficiency: a new agricultural political economy? J Contemp Asia. 2019;49(5):734–58. 10.1080/00472336.2019.1617890.Search in Google Scholar
[2] Morley S, Kennedy A, Pradesha A, Hadiwidjaja G. The role of agriculture in the structural transformation of Indonesia. Washington, DC, USA: International Food and Policy Research Institute; 2019.Search in Google Scholar
[3] OECD. COVID-19 and the food and agriculture sector: issues and policy responses. OECD; 2020. p. 1–12.Search in Google Scholar
[4] Abidin MZ. Pemulihan Ekonomi Nasional Pada Masa Pandemi Covid-19: Analisis Produktivitas Tenaga Kerja Sektor Pertanian. Indonesian Treas Review: J Perbendaharaan, Keuang Negara Dan Kebijak Publik. 2021;6(2):117–38. 10.33105/itrev.v6i2.292.Search in Google Scholar
[5] Lagiso D. Challenges and opportunities of Covid-19 in agricultural economy: the case of Ethiopia. Int J Afr Asian Stud. 2020;65:24–9. 10.7176/jaas/65-03.Search in Google Scholar
[6] Pitaloka D. Hortikultura: potensi, pengembangan dan tantangan. J Teknologi Terapan: G-Tech. 2017;1:1–4. 10.33379/gtech.v1i1.260.Search in Google Scholar
[7] Kementerian Pertanian. Analisis Kinerja Perdagangan Cabai Merah. Pusat Data Dan Sistem Informasi Pertanian; 2021. p. 1–23. https://satudata.pertanian.go.id/assets/docs/publikasi/Analisis_Kinerja_Perdagangan_Komoditas_Cabai_Merah_Semester_I_Tahun_2021.pdf.Search in Google Scholar
[8] Adana AH, Haryanto LI, Fitriah N, Soerinda IT. Analisis pengaruh barang substitusi dan komplementer terhadap fungsi permintaan cabai di indonesia. JIA. 2023;8(1):18–25. 10.37149/jia.v8i1.270.Search in Google Scholar
[9] Karyani T, Susanto A, Djuwendah E, Hapsari H. Red chili agri-business and the risks faced by the farmers. IOP Conf Ser Earth Env Sci. 2020;466(1):1–8.10.1088/1755-1315/466/1/012002Search in Google Scholar
[10] Tsurayya S, Kartika L. Kelembagaan dan Strategi Peningkatan Daya Saing Komoditas Cabai Kabupaten Garut. J Manaj dan Agribisnis. 2015;12(1):1–13. 10.17358/jma.12.1.1.Search in Google Scholar
[11] Nauly D. Fluktuasi dan Disparitas Harga Cabai Di Indonesia. J Agrosains Dan Teknologi. 2016;1:57–69.10.24853/jat.1.1.57-70Search in Google Scholar
[12] Badan Pusat Statistik dan Direktorat Jenderal Hortikultura. Produksi Cabai Besar Menurut Provinsi Tahun 2016-2022; 2023. https://www.bps.go.id/.Search in Google Scholar
[13] Badan Pusat Statistik DIY. Provinsi DIY Dalam Angka 2024. Badan Pusat Statistik Dan Direktorat Jenderal Hortikultura; 2024. https://www.bps.go.id/.Search in Google Scholar
[14] Mujiyono Y. Pasar lelang cabai dapat membantu petani. RRI Yogyakarta; 2020. https://rri.co.id/yogyakarta/bisnis/ekonomi/787463/pasar-lelang-cabai-dapat-membantu-petani.Search in Google Scholar
[15] Yildiz K, Ahi MT. Innovative decision support model for construction supply chain performance management. Prod Plann Control. 2022;33(9–10):894–906. 10.1080/09537287.2020.1837936.Search in Google Scholar
[16] Sunny J, Undralla N, Pillai VM. Supply chain transparency through blockchain-based traceability: an overview with demonstration. Comput Ind Eng. 2020;150:106895.10.1016/j.cie.2020.106895Search in Google Scholar
[17] Giacomarra M, Crescimanno M, Sakka G, Galati. A. Stakeholder engagement toward value co-creation in the F&B packaging industry. EuroMed J Bus. 2019;15(3):315–31.10.1108/EMJB-06-2019-0077Search in Google Scholar
[18] Van Hoek RI. Measuring the immeasurable – measuring and improving performance in the supply chain. Supply Chain Manag. 1998;3(4):187–92. 10.1108/13598549810244232.Search in Google Scholar
[19] Mensah AO, Peprah J, Nduro K. Significance of actors in the maize supply chain for senior high schools in Kumasi. Eur J Logist Purch Supply Chain Manag. 2015;3(5):1–17.Search in Google Scholar
[20] Anatan L. Pengaruh implementasi praktik-praktik manajemen rantai pasokan terhadap kinerja rantai pasok dan keunggulan kompetitif. J Karisma. 2010;4(2):106–17.Search in Google Scholar
[21] Ketahanan Nasional M, Gadjah Mada U. Jurnal Lembaga Ketahanan Nasional Republik Indonesia Peran E-commerce dalam Mendukung Ketahanan Pangan Wilayah Jakarta Saat Pandemi Covid-19 Laili Rahmawati. Jurnal Lembaga Ketahanan Nasional Republik Indonesia Peran; 2020.Search in Google Scholar
[22] Pohlmann CR, Scavarda AJ, Alves MB, Korzenowski AL. The role of the focal company in sustainable development goals: a Brazilian food poultry supply chain case study. J Clean Prod. 2020;245:118798.10.1016/j.jclepro.2019.118798Search in Google Scholar
[23] Soepatini N, Isa AP, Syamsudin M. Supply chain analysis and commodity marketing of chili in Subosukowonosraten. International Conference on Economics, Business and Eco-Economic Education 2018. KnE Social Sciences; 2018. p. 957–73.10.18502/kss.v3i10.3185Search in Google Scholar
[24] Anugrah IS, Saputra YH, Sayaka B. Dampak Pandemi Covid-19 Pada Dinamika Rantai Pasok Pangan Pokok. 2020;3:297–319. http://pse.litbang.pertanian.go.id/ind/pdffiles/15-BBRC-2020-III-2- 3-ISA.pdf.Search in Google Scholar
[25] Kamble SS, Gunasekaran A, Gawankar SA. Achieving sustainable performance in a data-driven agriculture supply chain: a review for research and applications. Int J Prod Econ. 2020;219:179–94. 10.1016/j.ijpe.2019.05.022.Search in Google Scholar
[26] Athaillah T, Hamid AH. Analisis Efisiensi Kinerja Rantai Pasok Ikan Tuna Di Bandar. Mar Fishieries. 2018;9(2):169–81.10.29244/jmf.9.2.169-181Search in Google Scholar
[27] Badan Pusat Statistik Kabupaten Sleman. Kabupaten Sleman Dalam Angka 2021; 2021. https://www.bps.go.id/.Search in Google Scholar
[28] UPTD Balai Penyuluhan Pertanian. Profil UPTD Balai Penyuluhan Pertanian, Pangan, dan Perikanan Wilayah V Tahun 2019. Dinas Pertanian, Pangan dan Perikanan UPTD Balai Penyuluhan Pertanian, Pangan dan Perikanan Wilayah V. 2020.Search in Google Scholar
[29] Kurniawan A, Nurul W Pelaksanaan PPKM dalam Penanganan Kasus COVID-19 dan Evaluasinya. 2021. https://www.djkn.kemenkeu.go.id/kpknl-semarang/baca-artikel/14314/Pelaksanaan-PPKM-dalam-Penanganan-Kasus-COVID-19-dan-Evaluasinya.html.Search in Google Scholar
[30] Hermawan I. Metodologi penelitian pendidikan (kualitatif, kuantitatif dan mixed method). Hidayatul Quran; 2019.Search in Google Scholar
[31] Aramyan LH. Measuring supply chain performance in the agri-food sector. Wageningen: Wageningen University; 2007.Search in Google Scholar
[32] Stranieri S, Miranda FR, Meuwissen PM, Soregaroli C. Exploring the impact of blockchain on the performance of agri-food supply chains. Food Control. 2021;119:107495. 10.1016/j.foodcont.2020.107495.Search in Google Scholar
[33] Mardliyah A, Priyadi P. Analisis risiko produksi cabai merah di desa margototo kecamatan metro kibang kabupaten lampung timur. J Food Syst Agribus. 2021;5(2):93–8. 10.25181/jofsa.v5i2.2156.Search in Google Scholar
[34] Nurhajijah N, Fitria F, Tanjung AF. Usahatani cabai merah dan cabai hijau saat wabah Covid – 19 (Studi kasus di desa sei mencirim kecamatan sunggal kabupaten deli serdang). Jurnal Ilmu Dan Teknologi Petanian (AGRITEPA). 2021;8(1):32–40.10.37676/agritepa.v8i1.1321Search in Google Scholar
[35] Sarni S, Sidayat M. Dampak pandemi COVID 19 terhadap pendapatan petani sayuran di kota ternate. Pros Semin Nas Agribisnis. 2020;21:144–8.Search in Google Scholar
[36] Julitasari EN, Suwarta S. Analisis nilai tambah produk cabe akibat over supply di masa pandemi Covid-19 (Studi di Kecamatan Karangploso Kabupaten Malang). Conference on Innovation and Application of Science and Technology (CIASTECH 2020); 2020. p. 285–92.Search in Google Scholar
[37] Dewi RK, Parining R, Harsojuwono BA. Mitigation of red chili supply chain risks in Bali. Indonesia Glob J Nutr Food Sci. 2023;4(4):103–12.10.33545/2664844X.2023.v5.i2b.152Search in Google Scholar
[38] Romadani A, Wi Endang MG, Sulasmiyati NP. Analisis return on investment (ROI) residual income (RI) (Studi Pada Perusahaan Makanan Dan Minuman Yang Terdaftar Di Bursa Efek Indonesia Tahun 2011–2014). J Administrasi Bisnis. 2016;3:1–8.Search in Google Scholar
[39] Hanafi, Mamduh M. Manajemen Keuangan. Yogyakarta: BPFE; 2010.Search in Google Scholar
[40] Was’an GH. Pengaruh profitabilitas terhadap tingkat pengembalian investasi. J Manaj Bisnis Dan Keuang. 2020;1(1):1–15.10.51805/jmbk.v1i1.26Search in Google Scholar
[41] Saifi M. Analisis Return On Investment (ROI) dan Residual Income (RI Guna Menilai Kinerja Keuangan Perusahaan. Studi Pada PT Nippon Indosari CoUSDindo, Tbk yang Terdaftar di Bursa Efek Indonesia Periode 2012. 2015;45(1):111–7.Search in Google Scholar
[42] Ketokivi M, Mahoney JT. Transaction cost economics as a theory of supply chain efficiency. Production and Operation Management. New Jersey, USA: Wiley; 2020.10.1111/poms.13148Search in Google Scholar
[43] Aramyan LH, Lansink AGJMO, Van Der Vorst JGAJ, Kooten O. Performance measurement in agri-food supply chains: A case study. Supply Chain Manag. 2007;12(4):304–15. 10.1108/13598540710759826.Search in Google Scholar
[44] Rahayu R, Priyo P, Ducol E, Using MA. The “Return on Investment” strategy to sustain logistic supply provider toward indonesia’s logistic policy. J Gov Civ Soc. 2020;4(2):201–18.10.31000/jgcs.v4i2.2613Search in Google Scholar
[45] Pathak S, Swatdikun T, Hao Y. Cost management and supply chain management: experiences of vulnerable SMEs during COVID-19. Emerg Sci J. 2023;7(6):2165–82.10.28991/ESJ-2023-07-06-018Search in Google Scholar
[46] N Nurdiani, ‘Teknik Sampling snowball dalam penelitian Lapangan, ComTech Comput Math Eng Appl. 2014;5(2):1110, 10.21512/comtech.v5i2.2427.Search in Google Scholar
© 2024 the author(s), published by De Gruyter
This work is licensed under the Creative Commons Attribution 4.0 International License.
Articles in the same Issue
- Regular Articles
- Supplementation of P-solubilizing purple nonsulfur bacteria, Rhodopseudomonas palustris improved soil fertility, P nutrient, growth, and yield of Cucumis melo L.
- Yield gap variation in rice cultivation in Indonesia
- Effects of co-inoculation of indole-3-acetic acid- and ammonia-producing bacteria on plant growth and nutrition, soil elements, and the relationships of soil microbiomes with soil physicochemical parameters
- Impact of mulching and planting time on spring-wheat (Triticum aestivum) growth: A combined field experiment and empirical modeling approach
- Morphological diversity, correlation studies, and multiple-traits selection for yield and yield components of local cowpea varieties
- Participatory on-farm evaluation of new orange-fleshed sweetpotato varieties in Southern Ethiopia
- Yield performance and stability analysis of three cultivars of Gayo Arabica coffee across six different environments
- Biology of Spodoptera frugiperda (Lepidoptera: Noctuidae) on different types of plants feeds: Potency as a pest on various agricultural plants
- Antidiabetic activity of methanolic extract of Hibiscus sabdariffa Linn. fruit in alloxan-induced Swiss albino diabetic mice
- Bioinformatics investigation of the effect of volatile and non-volatile compounds of rhizobacteria in inhibiting late embryogenesis abundant protein that induces drought tolerance
- Nicotinamide as a biostimulant improves soybean growth and yield
- Farmer’s willingness to accept the sustainable zoning-based organic farming development plan: A lesson from Sleman District, Indonesia
- Uncovering hidden determinants of millennial farmers’ intentions in running conservation agriculture: An application of the Norm Activation Model
- Mediating role of leadership and group capital between human capital component and sustainability of horticultural agribusiness institutions in Indonesia
- Biochar technology to increase cassava crop productivity: A study of sustainable agriculture on degraded land
- Effect of struvite on the growth of green beans on Mars and Moon regolith simulants
- UrbanAgriKG: A knowledge graph on urban agriculture and its embeddings
- Provision of loans and credit by cocoa buyers under non-price competition: Cocoa beans market in Ghana
- Effectiveness of micro-dosing of lime on selected chemical properties of soil in Banja District, North West, Ethiopia
- Effect of weather, nitrogen fertilizer, and biostimulators on the root size and yield components of Hordeum vulgare
- Effects of selected biostimulants on qualitative and quantitative parameters of nine cultivars of the genus Capsicum spp.
- Growth, yield, and secondary metabolite responses of three shallot cultivars at different watering intervals
- Design of drainage channel for effective use of land on fully mechanized sugarcane plantations: A case study at Bone Sugarcane Plantation
- Technical feasibility and economic benefit of combined shallot seedlings techniques in Indonesia
- Control of Meloidogyne javanica in banana by endophytic bacteria
- Comparison of important quality components of red-flesh kiwifruit (Actinidia chinensis) in different locations
- Efficiency of rice farming in flood-prone areas of East Java, Indonesia
- Comparative analysis of alpine agritourism in Trentino, Tyrol, and South Tyrol: Regional variations and prospects
- Detection of Fusarium spp. infection in potato (Solanum tuberosum L.) during postharvest storage through visible–near-infrared and shortwave–near-infrared reflectance spectroscopy
- Forage yield, seed, and forage qualitative traits evaluation by determining the optimal forage harvesting stage in dual-purpose cultivation in safflower varieties (Carthamus tinctorius L.)
- The influence of tourism on the development of urban space: Comparison in Hanoi, Danang, and Ho Chi Minh City
- Optimum intra-row spacing and clove size for the economical production of garlic (Allium sativum L.) in Northwestern Highlands of Ethiopia
- The role of organic rice farm income on farmer household welfare: Evidence from Yogyakarta, Indonesia
- Exploring innovative food in a developing country: Edible insects as a sustainable option
- Genotype by environment interaction and performance stability of common bean (Phaseolus vulgaris L.) cultivars grown in Dawuro zone, Southwestern Ethiopia
- Factors influencing green, environmentally-friendly consumer behaviour
- Factors affecting coffee farmers’ access to financial institutions: The case of Bandung Regency, Indonesia
- Morphological and yield trait-based evaluation and selection of chili (Capsicum annuum L.) genotypes suitable for both summer and winter seasons
- Sustainability analysis and decision-making strategy for swamp buffalo (Bubalus bubalis carabauesis) conservation in Jambi Province, Indonesia
- Understanding factors affecting rice purchasing decisions in Indonesia: Does rice brand matter?
- An implementation of an extended theory of planned behavior to investigate consumer behavior on hygiene sanitation-certified livestock food products
- Information technology adoption in Indonesia’s small-scale dairy farms
- Draft genome of a biological control agent against Bipolaris sorokiniana, the causal phytopathogen of spot blotch in wheat (Triticum turgidum L. subsp. durum): Bacillus inaquosorum TSO22
- Assessment of the recurrent mutagenesis efficacy of sesame crosses followed by isolation and evaluation of promising genetic resources for use in future breeding programs
- Fostering cocoa industry resilience: A collaborative approach to managing farm gate price fluctuations in West Sulawesi, Indonesia
- Field investigation of component failures for selected farm machinery used in small rice farming operations
- Near-infrared technology in agriculture: Rapid, simultaneous, and non-destructive determination of inner quality parameters on intact coffee beans
- The synergistic application of sucrose and various LED light exposures to enhance the in vitro growth of Stevia rebaudiana (Bertoni)
- Weather index-based agricultural insurance for flower farmers: Willingness to pay, sales, and profitability perspectives
- Meta-analysis of dietary Bacillus spp. on serum biochemical and antioxidant status and egg quality of laying hens
- Biochemical characterization of trypsin from Indonesian skipjack tuna (Katsuwonus pelamis) viscera
- Determination of C-factor for conventional cultivation and soil conservation technique used in hop gardens
- Empowering farmers: Unveiling the economic impacts of contract farming on red chilli farmers’ income in Magelang District, Indonesia
- Evaluating salt tolerance in fodder crops: A field experiment in the dry land
- Labor productivity of lowland rice (Oryza sativa L.) farmers in Central Java Province, Indonesia
- Cropping systems and production assessment in southern Myanmar: Informing strategic interventions
- The effect of biostimulants and red mud on the growth and yield of shallots in post-unlicensed gold mining soil
- Effects of dietary Adansonia digitata L. (baobab) seed meal on growth performance and carcass characteristics of broiler chickens: A systematic review and meta-analysis
- Analysis and structural characterization of the vid-pisco market
- Pseudomonas fluorescens SP007s enhances defense responses against the soybean bacterial pustule caused by Xanthomonas axonopodis pv. glycines
- A brief investigation on the prospective of co-composted biochar as a fertilizer for Zucchini plants cultivated in arid sandy soil
- Supply chain efficiency of red chilies in the production center of Sleman Indonesia based on performance measurement system
- Investment development path for developed economies: Is agriculture different?
- Power relations among actors in laying hen business in Indonesia: A MACTOR analysis
- High-throughput digital imaging and detection of morpho-physiological traits in tomato plants under drought
- Converting compression ignition engine to dual-fuel (diesel + CNG) engine and experimentally investigating its performance and emissions
- Structuration, risk management, and institutional dynamics in resolving palm oil conflicts
- Spacing strategies for enhancing drought resilience and yield in maize agriculture
- Composition and quality of winter annual agrestal and ruderal herbages of two different land-use types
- Investigating Spodoptera spp. diversity, percentage of attack, and control strategies in the West Java, Indonesia, corn cultivation
- Yield stability of biofertilizer treatments to soybean in the rainy season based on the GGE biplot
- Evaluating agricultural yield and economic implications of varied irrigation depths on maize yield in semi-arid environments, at Birfarm, Upper Blue Nile, Ethiopia
- Chemometrics for mapping the spatial nitrate distribution on the leaf lamina of fenugreek grown under varying nitrogenous fertilizer doses
- Pomegranate peel ethanolic extract: A promising natural antioxidant, antimicrobial agent, and novel approach to mitigate rancidity in used edible oils
- Transformative learning and engagement with organic farming: Lessons learned from Indonesia
- Tourism in rural areas as a broader concept: Some insights from the Portuguese reality
- Assessment enhancing drought tolerance in henna (Lawsonia inermis L.) ecotypes through sodium nitroprusside foliar application
- Edible insects: A survey about perceptions regarding possible beneficial health effects and safety concerns among adult citizens from Portugal and Romania
- Phenological stages analysis in peach trees using electronic nose
- Harvest date and salicylic acid impact on peanut (Arachis hypogaea L.) properties under different humidity conditions
- Hibiscus sabdariffa L. petal biomass: A green source of nanoparticles of multifarious potential
- Use of different vegetation indices for the evaluation of the kinetics of the cherry tomato (Solanum lycopersicum var. cerasiforme) growth based on multispectral images by UAV
- First evidence of microplastic pollution in mangrove sediments and its ingestion by coral reef fish: Case study in Biawak Island, Indonesia
- Physical and textural properties and sensory acceptability of wheat bread partially incorporated with unripe non-commercial banana cultivars
- Cereibacter sphaeroides ST16 and ST26 were used to solubilize insoluble P forms to improve P uptake, growth, and yield of rice in acidic and extreme saline soil
- Avocado peel by-product in cattle diets and supplementation with oregano oil and effects on production, carcass, and meat quality
- Optimizing inorganic blended fertilizer application for the maximum grain yield and profitability of bread wheat and food barley in Dawuro Zone, Southwest Ethiopia
- The acceptance of social media as a channel of communication and livestock information for sheep farmers
- Adaptation of rice farmers to aging in Thailand
- Combined use of improved maize hybrids and nitrogen application increases grain yield of maize, under natural Striga hermonthica infestation
- From aquatic to terrestrial: An examination of plant diversity and ecological shifts
- Statistical modelling of a tractor tractive performance during ploughing operation on a tropical Alfisol
- Participation in artisanal diamond mining and food security: A case study of Kasai Oriental in DR Congo
- Assessment and multi-scenario simulation of ecosystem service values in Southwest China’s mountainous and hilly region
- Analysis of agricultural emissions and economic growth in Europe in search of ecological balance
- Bacillus thuringiensis strains with high insecticidal activity against insect larvae of the orders Coleoptera and Lepidoptera
- Technical efficiency of sugarcane farming in East Java, Indonesia: A bootstrap data envelopment analysis
- Comparison between mycobiota diversity and fungi and mycotoxin contamination of maize and wheat
- Evaluation of cultivation technology package and corn variety based on agronomy characters and leaf green indices
- Exploring the association between the consumption of beverages, fast foods, sweets, fats, and oils and the risk of gastric and pancreatic cancers: Findings from case–control study
- Phytochemical composition and insecticidal activity of Acokanthera oblongifolia (Hochst.) Benth & Hook.f. ex B.D.Jacks. extract on life span and biological aspects of Spodoptera littoralis (Biosd.)
- Land use management solutions in response to climate change: Case study in the central coastal areas of Vietnam
- Evaluation of coffee pulp as a feed ingredient for ruminants: A meta-analysis
- Interannual variations of normalized difference vegetation index and potential evapotranspiration and their relationship in the Baghdad area
- Harnessing synthetic microbial communities with nitrogen-fixing activity to promote rice growth
- Agronomic and economic benefits of rice–sweetpotato rotation in lowland rice cropping systems in Uganda
- Response of potato tuber as an effect of the N-fertilizer and paclobutrazol application in medium altitude
- Bridging the gap: The role of geographic proximity in enhancing seed sustainability in Bandung District
- Evaluation of Abrams curve in agricultural sector using the NARDL approach
- Challenges and opportunities for young farmers in the implementation of the Rural Development Program 2014–2020 of the Republic of Croatia
- Yield stability of ten common bean (Phaseolus vulgaris L.) genotypes at different sowing dates in Lubumbashi, South-East of DR Congo
- Effects of encapsulation and combining probiotics with different nitrate forms on methane emission and in vitro rumen fermentation characteristics
- Phytochemical analysis of Bienertia sinuspersici extract and its antioxidant and antimicrobial activities
- Evaluation of relative drought tolerance of grapevines by leaf fluorescence parameters
- Yield assessment of new streak-resistant topcross maize hybrids in Benin
- Improvement of cocoa powder properties through ultrasonic- and microwave-assisted alkalization
- Potential of ecoenzymes made from nutmeg (Myristica fragrans) leaf and pulp waste as bioinsecticides for Periplaneta americana
- Analysis of farm performance to realize the sustainability of organic cabbage vegetable farming in Getasan Semarang, Indonesia
- Revealing the influences of organic amendment-derived dissolved organic matter on growth and nutrient accumulation in lettuce seedlings (Lactuca sativa L.)
- Identification of viruses infecting sweetpotato (Ipomoea batatas Lam.) in Benin
- Assessing the soil physical and chemical properties of long-term pomelo orchard based on tree growth
- Investigating access and use of digital tools for agriculture among rural farmers: A case study of Nkomazi Municipality, South Africa
- Does sex influence the impact of dietary vitD3 and UVB light on performance parameters and welfare indicators of broilers?
- Design of intelligent sprayer control for an autonomous farming drone using a multiclass support vector machine
- Deciphering salt-responsive NB-ARC genes in rice transcriptomic data: A bioinformatics approach with gene expression validation
- Review Articles
- Impact of nematode infestation in livestock production and the role of natural feed additives – A review
- Role of dietary fats in reproductive, health, and nutritional benefits in farm animals: A review
- Climate change and adaptive strategies on viticulture (Vitis spp.)
- The false tiger of almond, Monosteira unicostata (Hemiptera: Tingidae): Biology, ecology, and control methods
- A systematic review on potential analogy of phytobiomass and soil carbon evaluation methods: Ethiopia insights
- A review of storage temperature and relative humidity effects on shelf life and quality of mango (Mangifera indica L.) fruit and implications for nutrition insecurity in Ethiopia
- Green extraction of nutmeg (Myristica fragrans) phytochemicals: Prospective strategies and roadblocks
- Potential influence of nitrogen fertilizer rates on yield and yield components of carrot (Dacus carota L.) in Ethiopia: Systematic review
- Corn silk: A promising source of antimicrobial compounds for health and wellness
- State and contours of research on roselle (Hibiscus sabdariffa L.) in Africa
- The potential of phosphorus-solubilizing purple nonsulfur bacteria in agriculture: Present and future perspectives
- Minor millets: Processing techniques and their nutritional and health benefits
- Meta-analysis of reproductive performance of improved dairy cattle under Ethiopian environmental conditions
- Review on enhancing the efficiency of fertilizer utilization: Strategies for optimal nutrient management
- The nutritional, phytochemical composition, and utilisation of different parts of maize: A comparative analysis
- Motivations for farmers’ participation in agri-environmental scheme in the EU, literature review
- Evolution of climate-smart agriculture research: A science mapping exploration and network analysis
- Short Communications
- Music enrichment improves the behavior and leukocyte profile of dairy cattle
- Effect of pruning height and organic fertilization on the morphological and productive characteristics of Moringa oleifera Lam. in the Peruvian dry tropics
- Corrigendum
- Corrigendum to “Bioinformatics investigation of the effect of volatile and non-volatile compounds of rhizobacteria in inhibiting late embryogenesis abundant protein that induces drought tolerance”
- Corrigendum to “Composition and quality of winter annual agrestal and ruderal herbages of two different land-use types”
- Special issue: Smart Agriculture System for Sustainable Development: Methods and Practices
- Construction of a sustainable model to predict the moisture content of porang powder (Amorphophallus oncophyllus) based on pointed-scan visible near-infrared spectroscopy
- FruitVision: A deep learning based automatic fruit grading system
- Energy harvesting and ANFIS modeling of a PVDF/GO-ZNO piezoelectric nanogenerator on a UAV
- Effects of stress hormones on digestibility and performance in cattle: A review
- Special Issue of The 4th International Conference on Food Science and Engineering (ICFSE) 2022 - Part II
- Assessment of omega-3 and omega-6 fatty acid profiles and ratio of omega-6/omega-3 of white eggs produced by laying hens fed diets enriched with omega-3 rich vegetable oil
- Special Issue on FCEM - International Web Conference on Food Choice & Eating Motivation - Part II
- Special Issue on FCEM – International Web Conference on Food Choice & Eating Motivation: Message from the editor
- Fruit and vegetable consumption: Study involving Portuguese and French consumers
- Knowledge about consumption of milk: Study involving consumers from two European Countries – France and Portugal