Leveraging normal distribution and fuzzy S-function approaches for solar cell electrical characteristic optimization
-
Ruqaya Shaker Mahmood
 und
Taha Rashid
und
Taha Rashid

Abstract
This study evaluates the performance of a silicon-based solar cell across a range of temperatures (5, 15, 30, 50, 60, and 70°C) to understand the impact of temperature variation on its electrical parameters. Key performance indicators such as current density (J sc), open-circuit voltage (V oc), fill factor (FF), and efficiency (η) were measured at each temperature. The results show that the solar cell operates most efficiently at lower temperatures, with a peak efficiency of 0.55% at 5°C. As temperature increases, there is a noticeable decline in performance, with the efficiency dropping to 0.41% at 70°C. Current density values range from 3.52 mA/cm² at 5°C to 2.50 mA/cm² at 70°C, while open-circuit voltage decreases from 2.10 V at 5°C to 1.90 V at 70°C. Fill factor also exhibits a downward trend, reflecting the decreasing performance with higher temperatures. A statistical analysis using Statistical Package for the Social Sciences revealed mean values of 4.45 mA/cm² for current density, 1.93 V for voltage, and 3.87 for fill factor, with corresponding standard deviations and variances. Furthermore, a fuzzy S-function model was applied to account for uncertainty and variability in real-world conditions. The fuzzy model indicated an optimal efficiency of 0.89%, a lower efficiency bound of 0.47%, and an average efficiency of 0.43%. This combined approach, using both statistical and fuzzy analysis, provides valuable insights into the temperature sensitivity of silicon-based solar cells and underscores the importance of temperature management for maximizing efficiency.
Abbreviations
- FF
-
fill factor (measure of the solar cell’s quality, representing its efficiency in converting energy, dimensionless)
- J m
-
maximum current (current at the maximum power point, mA/cm²)
- J sc
-
short-circuit current (maximum current density when the voltage across the solar cell is zero, mA/cm²)
- R m
-
series resistance (resistance to current flow within the solar cell, Ω)
- R s
-
shunt resistance (resistance in parallel with the solar cell, Ω)
- R sh
-
parallel resistance (resistance due to leakage paths in the solar cell, Ω)
- T
-
temperature (operating temperature of the solar cell, °C)
- V m
-
maximum voltage (voltage at the maximum power point, V)
- V oc
-
open-circuit voltage (maximum voltage across the solar cell when the current is zero, V)
- η
-
efficiency (energy conversion efficiency of the solar cell, %)
- τ
-
minority carrier lifespan (average time a minority carrier remains in the conduction band before recombination)
1 Introduction
Solar cell research has gained significant attention due to the global demand for renewable energy, as the world seeks to transition to cleaner and more sustainable power sources [1,2]. Solar cells, which directly convert sunlight into electrical energy, have become a cornerstone of this renewable energy revolution, offering a viable solution to reduce reliance on fossil fuels and mitigate the impacts of climate change [3,4]. The efficiency and performance of solar cells are influenced by several electrical characteristics, including open-circuit voltage, short-circuit current, fill factor, and power conversion efficiency [5,6]. Enhancing these parameters is crucial for optimizing solar cell performance, improving their operational stability, and making solar energy a more economically viable and competitive alternative to conventional fossil-fuel-based power generation [7,8]. Research has shown that factors such as material selection, device architecture, and manufacturing processes all play key roles in achieving higher efficiencies in solar cells [9]. Additionally, recent advancements in material science, such as the development of organic photovoltaics and perovskite solar cells, have significantly improved the efficiency of solar technologies [10]. Traditionally, optimization strategies for solar cell performance have relied on deterministic models, which often fail to capture the system’s uncertainties and nonlinearities, making it necessary to explore more advanced techniques such as machine learning and stochastic optimization methods to further enhance performance [11].
Solar cell performance is unpredictable due to temperature, shading, and solar irradiance fluctuations [12]. Additionally, solar cell manufacturing can result in irregularities and defects that impact their electrical characteristics [13,14]. These issues require more advanced optimization techniques that can handle uncertainty and nonlinearity [15]. Traditional optimization techniques often fail to adequately address these challenges, as they rely on simplified assumptions that overlook real-world complexities such as environmental variations, material imperfections, and system nonlinearity. This results in suboptimal performance and reduced reliability of solar cells in practical conditions [16].
Integrating normal distribution and fuzzy S-function approaches can address these challenges [17]. The normal distribution, a simple statistical tool, is useful for modeling stochastic environmental effects impacting solar cells [18,19]. Representing solar irradiance as a normally distributed variable allows us to better understand and predict solar cell performance under various environmental conditions [20]. Accounting for input variable variations, this probabilistic approach underpins electrical parameter optimization [21]. On the other hand, fuzzy logic, and particularly the fuzzy S-Function, helps complex systems manage imprecision and ambiguity [22]. Fuzzy logic deals with partial truths, where variables can take values between 0 and 1, allowing for more flexible modeling of uncertain information [23,24]. The fuzzy S-Function inherent to fuzzy logic is particularly suitable for modeling the electrical characteristics of solar cells, as it captures gradual transitions and incremental changes effectively [25]. This fuzzy S-function allows for more realistic and adaptable predictions of solar cell performance by incorporating uncertainties and imprecision [26]. These strategies offer a comprehensive framework for solar cell electrical parameter optimization [27]. The normal distribution accounts for environmental input unpredictability, while the fuzzy S-function represents the imprecision in solar cell responses [28]. This hybrid approach enhances solar cell performance and optimization accuracy [29].
The performance of silicon-based solar cells is highly influenced by temperature, as various studies have shown. Ruan et al. [30] explored the impact of temperature on the efficiency, open-circuit voltage, and current density of silicon solar cells, demonstrating that temperature increases lead to reduced voltage and efficiency due to heightened recombination rates in the semiconductor material. Similarly, Hwang et al. (2017) [31] provided a comprehensive review of thermal effects on silicon solar cell efficiency, explaining how high temperatures degrade electrical properties, reducing conversion efficiencies. The study also discussed strategies to improve thermal stability, such as advanced heat sinks and material coatings. Yang et al. [32] focused on the temperature coefficient of efficiency for crystalline silicon solar cells, emphasizing how temperature plays a critical role in performance loss and long-term stability under various environmental conditions. While not solely focused on temperature, Jacobson and Delucchi (2011) [33] provided a broader perspective on renewable energy, pointing out the challenges posed by temperature effects on solar cell efficiency and the need for innovative solutions to mitigate these impacts. Faqeha et al. [34] investigated the long-term temperature effects on silicon solar cells, highlighting degradation mechanisms like thermal cycling and the influence of high temperatures on materials such as anti-reflective coatings and metal contacts. Collectively, these studies underscore the importance of understanding temperature-induced performance changes and emphasize the necessity for enhanced thermal management in silicon solar cells to optimize their long-term efficiency and reliability.
The fuzzy S-function approach was chosen because it effectively handles uncertainties and imprecise data, which are common in real-world solar cell performance analysis. Unlike traditional crisp logic methods, fuzzy logic provides a flexible framework for modeling nonlinear behaviors and gradual transitions in solar cell parameters. Among various fuzzy membership functions, the S-function was selected due to its smooth, continuous nature, which allows for better representation of gradual changes in electrical characteristics. This makes it particularly suitable for optimizing solar cell performance under diverse environmental and operational conditions, ensuring a more adaptive and robust optimization process.
Enhancing the efficiency, power output, and reliability of solar cells remains a critical challenge in renewable energy research. Conventional optimization methods often fail to account for variations in performance metrics and uncertainties in real-world applications, limiting their effectiveness in improving solar energy conversion.
This study introduces a dual optimization approach combining normal distribution and fuzzy S-function methodologies. The normal distribution provides a statistical framework for analyzing variations in solar cell parameters, while the fuzzy S-function addresses uncertainties, ensuring a more robust and adaptable optimization process. This integrated approach enables precise performance enhancement across diverse environmental and operational conditions.
This study aims to optimize key electrical characteristics of solar cells, including open-circuit voltage, short-circuit current, fill factor, and maximum power output. By integrating statistical analysis and fuzzy logic techniques, it seeks to develop a more comprehensive and adaptable optimization method that effectively addresses variations and uncertainties in solar cell performance. Through simulations and analytical studies, the research demonstrates the effectiveness of this approach in enhancing efficiency, reliability, and adaptability, ultimately contributing to advancements in solar energy technology.
2 Methodology
The methodology integrates the normal distribution and fuzzy S-function approaches to achieve a more effective optimization of solar cell performance. The normal distribution is employed to statistically analyze variations in key parameters, such as open-circuit voltage, short-circuit current, and efficiency, enabling a precise understanding of their behavior under different conditions. Complementing this, the fuzzy S-function is utilized to handle uncertainties and imprecise data, offering a flexible mechanism for decision-making in complex scenarios. By combining these techniques, the methodology overcomes the limitations of traditional optimization methods, providing a comprehensive framework that captures both statistical trends and uncertain factors, resulting in a robust and adaptive optimization process. This hybrid approach ensures the identification of optimal solutions that enhance the reliability and efficiency of solar cells in real-world applications.
2.1 Normal distribution
The normal distribution is a key continuous probability distribution in statistics [35,36]. It represents the probability density function,
The terms are appropriate for technical audiences familiar with optimization techniques but might benefit from clarification or expansion for broader accessibility.
Figure 1 shows a bell-shaped normal distribution curve. It illustrates the symmetry of the distribution around the mean value (µ) and the standard deviation

Bell-shaped normal distribution curve showing the symmetry around the mean value (µ) with the spread determined by the SD
2.2 Normal distribution formula
Normal distribution functions of a random variable
where
The exponent
The PDF represents the likelihood of the random variable taking a specific value. The area under the curve of the PDF equals one, which means that the total probability of all possible values the random variable could assume is 100%. This ensures that the distribution accounts for every possible outcome of the random variable. In simpler terms, the sum of all probabilities (the area under the curve) for every possible outcome of the random variable is always equal to 1, indicating that one of those possible outcomes will definitely occur.
2.3 Standard normal distribution
The standard normal distribution is a special case of the normal distribution where the mean value (
A standard normal distribution is particularly useful because it simplifies the process of working with normal distributions by converting any normal random variable
The random variable of a standard normal distribution is known as the standard score or a z-score. The following formula converts any normal random variable
Standardizing the variable makes it dimensionless and simplifies comparison across datasets or distributions.
2.4 Cumulative distribution function (CDF)
To calculate the CDF for the standard normal distribution, use the integral of the probability density function from negative infinity to
The CDF shows the likelihood that
Inferential statistics and statistical analysis need knowledge of normal and standard normal distributions. The normal distribution explains many natural occurrences and measurement mistakes. Its qualities allow the development of various statistical measures and theorems, such as the Central Limit Theorem, which asserts that the sum of a large number of random variables will resemble a normal distribution regardless of their original distribution. Other normal distributions are judged using the mean value and SD of the standard normal distribution with z-scores for standardized tests, confidence intervals, and hypothesis testing. Standardizing data into z-scores allows one to calculate observation probabilities and compare studies or datasets, making these notions vital in the application and analysis of statistics [54].
2.5 Fuzzy set
Fuzzy sets are an extension of classical sets, where each element has a degree of membership rather than a binary membership, enabling more flexible and nuanced representations of uncertain or imprecise information. One of the key functions used in fuzzy set theory is the S-function, which helps to model the membership values of elements within a fuzzy set.
2.6 S-function
The S-functions in fuzzy logic are used to show how a variable belongs to a fuzzy set, and they contain three parameters, normally expressed as
Mathematics characterizes the S-function as [55]
where
The normal distribution accounts for fluctuations in solar cell performance, while fuzzy S-functions address uncertainties and nonlinearities in electrical parameters, making them complementary for precise optimization.
2.7 New points and
θ
−
cut
This section in addition describes the
The crossover point of 0.5 occurs at
Now, using
Lower bound
By setting
(8)(9)(10)Upper bound (
By setting
we solve for
These formulae deliver the S-function factors for any given club stage
The S-function facilitates a fuzzy good judgment system displaying slow transitions and uncertainty. This characteristic can be customized for a fuzzy set by adjusting the parameters a, b, c, and k, allowing fine-tuned control over the degree of membership across different values of x. Furthermore, the θ-cut method supports decision-making, control systems, and data classification in environments characterized by uncertainty and gradual transitions, by deriving crisp boundaries from fuzzy sets [57].
2.8 Ranking function: for (S)
It obtains the S-function ranking function
The formula represents the average value of the minimum
The formula provides the average value of the S-function’s lowest minimum
The formula defines the average of the lower limit, defined as
3 Results and discussion
Based on the definitions and mathematical expressions established in the previous section, the next step is to apply the derived formulas and estimations to real datasets. In this section, we will explore the findings, validate the assumptions, and discuss the significance of the outcomes in relation to the applied context. The results are analyzed by considering the implications of the derived integrals and S-Function, and how they contribute to a more accurate estimation of parameters in fuzzy sets. Furthermore, the effect of the chosen values of parameters (
3.1 Definitions
To properly interpret the results, it is essential to establish the necessary definitions and mathematical expressions. These serve as the foundation for the subsequent analysis and interval estimations. The integral for the S-function is split into two parts based on the crossover point
3.1.1 Defining the integrals
The integral is split into two parts based on the crossover point
3.1.2 Integrating the parts [18]
For
For
3.1.3 Simplifying the integrals [20]
By evaluating the integrals, the terms involving
3.1.4 Special case k = 1
When
3.1.5 Final simplified form [23]
The integration results in
The centroid or anticipated price of the S-function’s distribution across
The simplification for
3.2 Interval estimation for S-function
This section discusses interval estimation in statistical analysis and the S-function. Instead of estimating a single value (point estimation), interval estimation uses sample data to estimate a population parameter’s anticipated range. This approach accounts for sample data variability to provide a more complete picture of the parameter’s values.
Interval estimation uses a range of feasible values to estimate a parameter. This confidence interval is based on sample data and a particular degree of confidence. The most popular interval estimate method is confidence interval estimation (CIE). A 95% or 99% confidence interval estimates the parameter’s real value within a certain range [11].
3.3 CIE
A confidence interval for a population parameter like the mean value is constructed using the sample mean value and SD. When the population SD is known or the sample size is high, the formula for building a confidence interval for the population mean value is [23]
where
The sample mean value
where
This represents the average squared deviation of each sample value from the mean, providing a measure of the sample’s dispersion.
High variance: Data points are widely distributed around the mean value, indicating higher variability and variety.
Data points which lie closer to the mean have less variability and are more consistent. Interval estimate in statistical analysis involves a range of values likely to contain the real population parameter. In this method, sample data uncertainty and variability are combined; hence, this estimate is better than a point estimate. With confidence intervals, researchers or analysts may make inferences about the population parameter more precisely [18].
An interval estimate can be beneficial in identifying the spectrum of values pertinent to the parameters a, b, and c of the S-function. Since these parameters significantly influence the structure and behavior of the S-function, establishing confidence intervals for each parameter enhances our understanding of the fuzzy set they signify [17].
Provided that the sample mean value and SD of the S-function parameter data points are known, one can easily calculate the confidence intervals for parameters
This CIE enhances statistical analysis by providing a range of values for population parameters, thus allowing better decision-making and more appropriate modeling, especially in fuzzy logic and other applications [27].
4 Statistical analysis
ANOVA test was conducted using Statistical Package for the Social Sciences (SPSS) to establish the significance of the differences in the observed attributes. The test will, therefore, establish whether the physical and chemical characteristics differ at a significance level based on regional differences as well as seasonal fluctuations. Assessment of mean value, SD, and variance was also conducted.
5 Central tendency
Central tendency measures a dataset’s center. Most central tendency measurements are mean value, median, and mode [43].
Mean value: The average is the total of all data points divided by their number. The data are balanced when all values contribute equally. The mean value is beneficial for symmetrical, outlier-free data.
Median: The median is the midway number in a list of data items from smallest to greatest. It splits the data collection to equal halves. The median is a superior estimate of central tendency for skewed data or outliers since it is unaffected by extreme values.
Mode: The most common value in the data collection. It helps find the most frequent value in categorical data.
5.1 Variance
(
σ
2
)
Data dispersion is measured by variance. It measures how much data points deviate from the mean value. The formula for variance is given in Eq. (33), understanding central tendency and variance is crucial for data analysis as they provide a snapshot of the data’s characteristics. The mean value, median, and mode help identify the typical or central value, which is essential for summarizing and comparing datasets. Variance, on the other hand, helps understand the degree of spread or dispersion, informing how much the data points deviate from the mean. Together, these concepts help in making informed decisions, identifying patterns, and understanding the nature of the data, such as in scientific research, business analytics, or everyday problem-solving. For example, in quality control, central tendency measures can help determine if a process is operating correctly, while variance can help assess the consistency of the output [46,59].
5.2 Case study (solar cell)
Table 1 displays the empirically verified values of the photovoltaic cell properties. The input parameters are T (temperature), J sc (short-circuit current), and V oc (open-circuit voltage). The output parameters are R m (series resistance), J m (maximum current), V m (maximum voltage), FF (fill factor), η (efficiency in percentage), t (lifetime), R s (shunt resistance), and R sh (parallel resistance). The variables τ, R sh, R s, J m, and J sc represent the minority carrier lifespan, shunt resistance, series resistance, and maximum current density, respectively.
Solar sell parameters with the effect of temperature
| T (°C) | J sc (mA/cm2) | V oc (V) | FF | η (%) |
|---|---|---|---|---|
| 5 | 352 × 10−2 | 21 × 10−1 | 55 × 10−2 | 59 × 10−1 |
| 14 | 486 × 10−2 | 22 × 10−1 | 44 × 10−2 | 6.9 × 10⁻¹ |
| 30 | 46 × 10−1 | 197 × 10−2 | 48 × 10−2 | 64 × 10−1 |
| 50 | 48 × 10−1 | 18 × 10−1 | 47 × 10−2 | 59 × 10−1 |
| 60 | 44 × 10−1 | 175 × 10−2 | 39 × 10−2 | 445 × 10−2 |
| 70 | 45 × 10−1 | 176 × 10−2 | 41 × 10−2 | 48 × 10−1 |
An investigation is conducted on a solar cell made of silicon in a laboratory setting. The findings are shown in (Table 1). The physical parameters of solar cell are
5.2.1 Solar cell parameters utilizing SPSS and normal distribution testing
The SPSS program was used to analyze the solar cell’s physical parameter values to determine whether they follow a normal distribution. The results are presented in Table 1.
By utilizing Eqs. (31)–(33), the results obtained are as follows:
Table 2 and Figure 2 present the efficiency values (µ) of a solar cell at various temperatures
Efficiency values µ of solar cell based on the reliability values
|
|
|
|
|
µ | |
|---|---|---|---|---|---|
| 5 | 3.52 | 2.10 | 4.06 | 0.55 | |
| 15 | 4.86 | 2.20 | 4.75 | 0.44 | |
| 30 | 4.60 | 1.97 | 4.00 | 0.44 | |
| 50 | 4.80 | 1.80 | 4.08 | 0.47 | |
| 60 | 4.40 | 1.75 | 3.08 | 0.40 | |
| 70 | 4.50 | 1.76 | 3.24 | 0.41 | |
| Avg. | 38.33333 | 4.446667 | 1.93 | 3.868333 | 0.451667 |
Bold values indicate: Best-performing values (e.g., highest efficiency, current density, fill factor). Key points of comparison for understanding how different parameters vary with temperature. Statistical relevance, such as the average row being highlighted for comparative analysis.
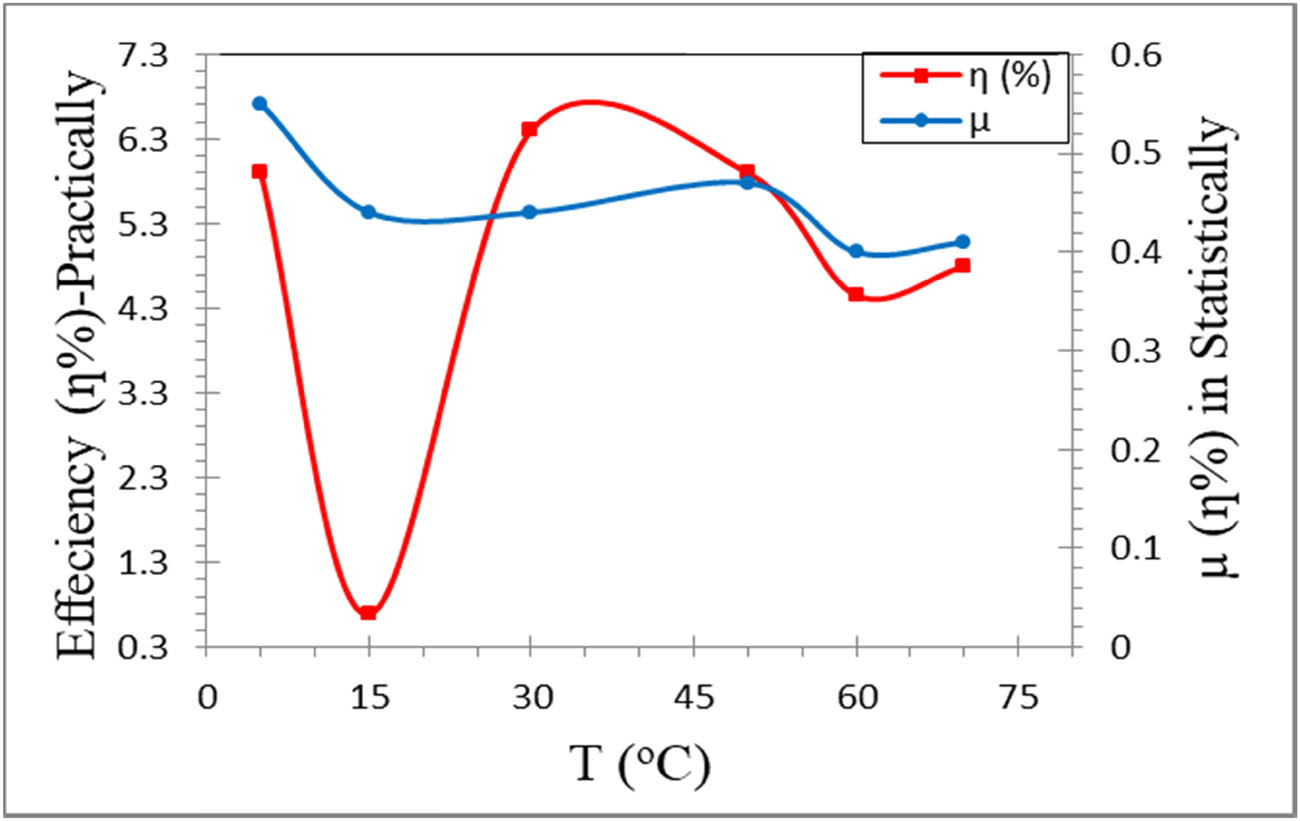
The efficiency values
At 5°C, the current density (
The current density stays high at 4.60 at 30°C, while the voltage drops to 1.97 and the fill factor lowers to 4.00, retaining efficiency at 0.44. At 50°C, the current density is 4.80, the voltage drops to 1.80, and the fill factor is 4.08, increasing efficiency to 0.47. Some metrics may increase with temperature, while others decrease, resulting in a balanced efficiency impact.
Current density drops to 4.40 and 4.50 at 60 and 70°C, respectively. The voltage lowers to 1.75 and 1.76, while the fill factor drops to 3.08 and 3.24. Thus, efficiency drops to 0.40 and 0.41. High temperatures diminish voltage and fill factor, outweighing the advantages of greater current density, affecting solar cell performance.
The table shows how temperature affects solar cell efficiency. Peak performance at 5°C shows that lower temperatures boost efficiency. Despite current density fluctuations, voltage, and fill factor decrease efficiency as temperatures increase. Optimizing solar cell performance in varied climatic circumstances requires thermal management solutions to maintain high efficiency.
Utilizing the central tendency and variance criteria statistically and utilizing fuzzy set (S-function) one can obtain the values of the solar cell parameters as shown in Tables 1, 2 and Figure 2.
Table 3 and Figure 3 provide a comprehensive analysis of solar cell parameter values using both normal distribution and fuzzy S-function techniques. For the statistical analysis, the mean values for the parameters
Solar cell parameter values utilizing normal distribution and S-function techniques
| Factors | Statistically | Fuzzy S-function | ||||
|---|---|---|---|---|---|---|
| Mean value (
|
Variance (
|
SD (
|
Below limit | Above limit | Best point | |
| J | 4.45 | 0.24 | 0.49 | 4.06 | 4.84 | 2.32 |
| V | 1.93 | 0.04 | 0.19 | 1.78 | 2.08 | 1.0025 |
| FF | 3.87 | 0.38 | 0.62 | 3.37 | 4.37 | 2.06 |
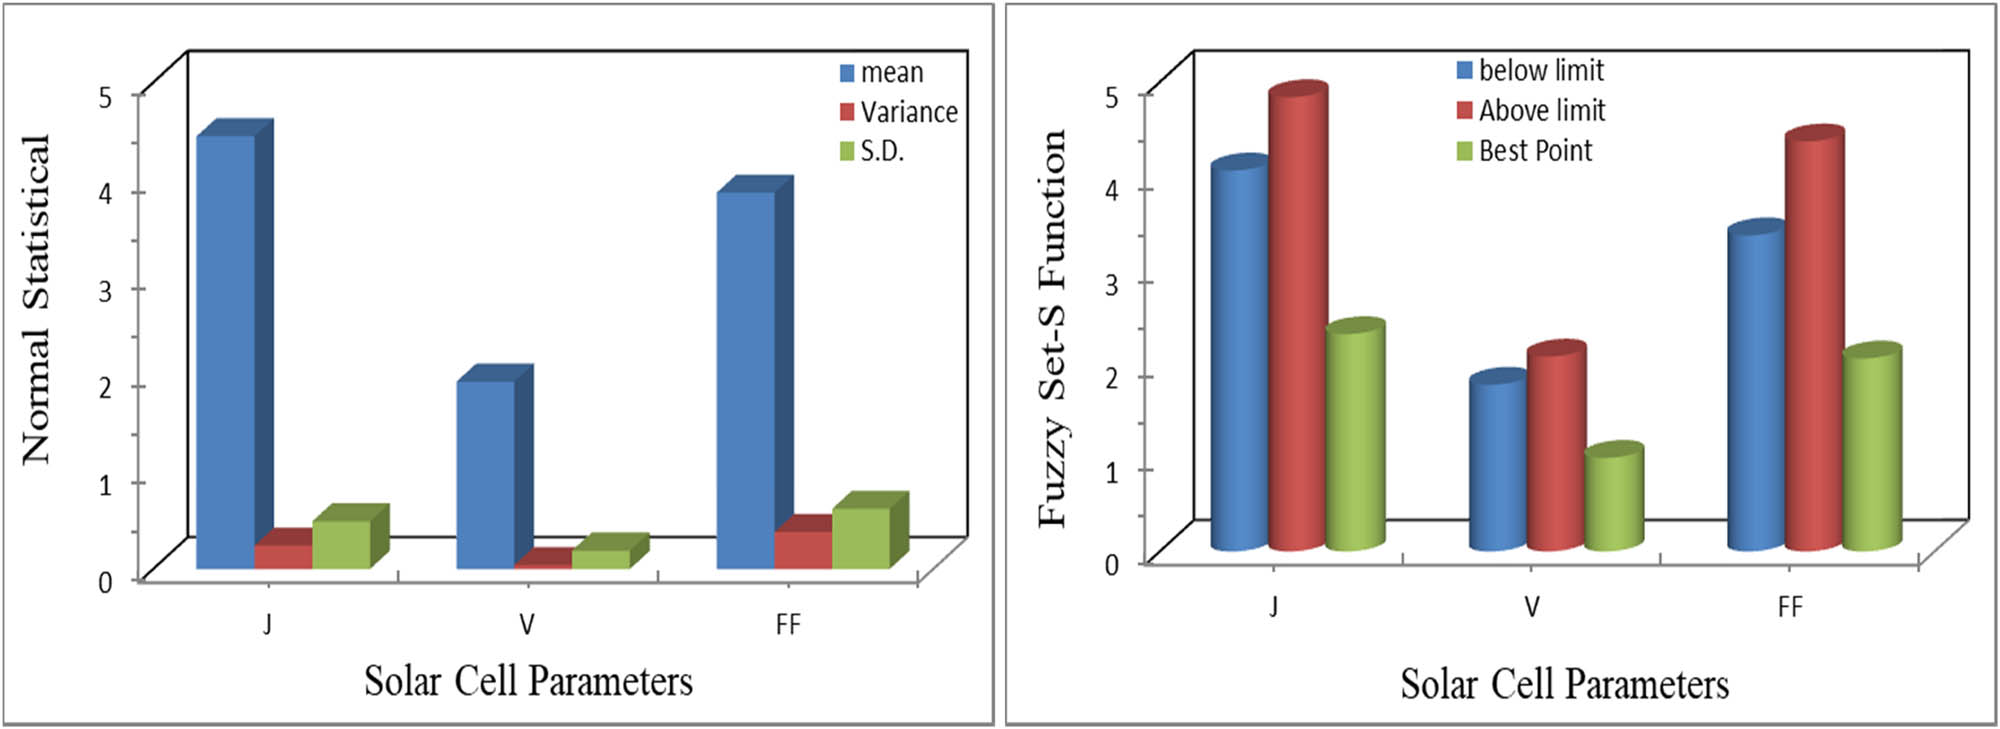
Comparison of the solar cell parameter values utilizing normal distribution and S-function techniques.
Based on Tables 2 and 4, Figure 4 is obtained utilizing the average values of the parameters.
Average values of the solar cell parameters by means of fuzzy S-function
|
|
|
|
|
|---|---|---|---|
| 38.33 | 0.43 | 0.47 | 0.89 |
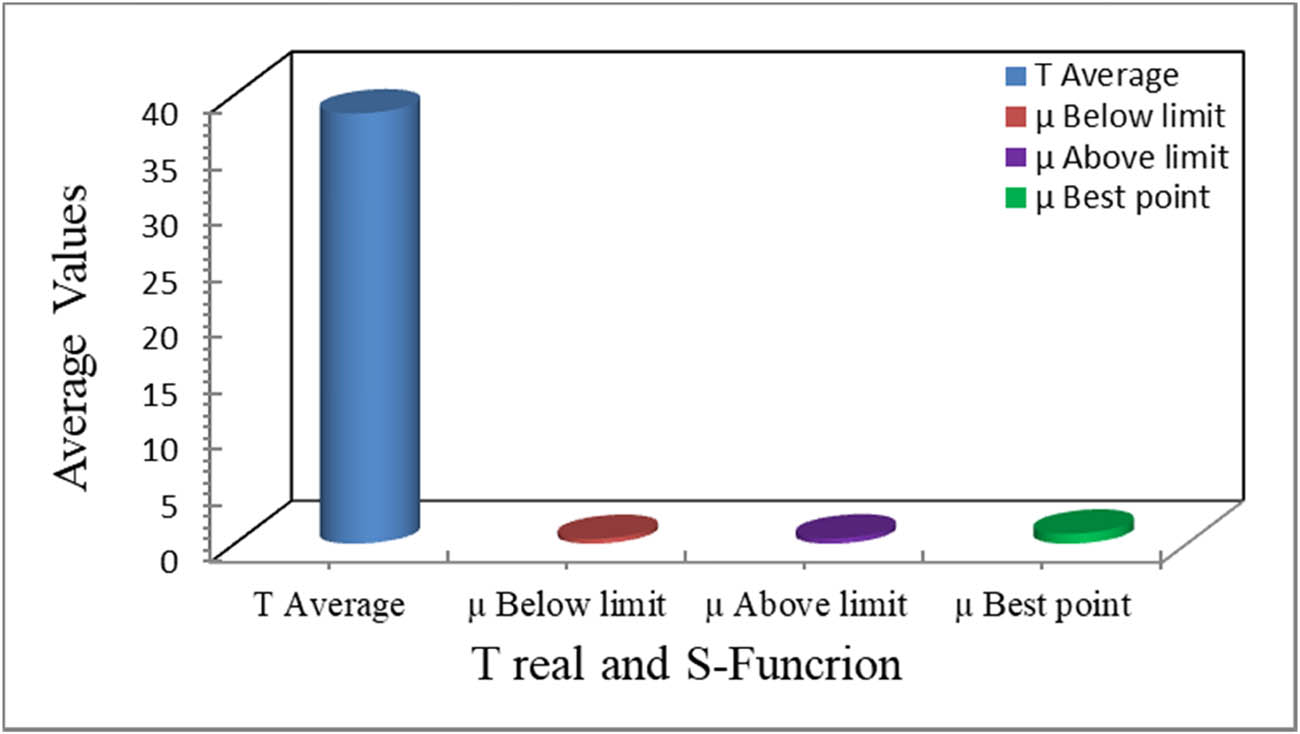
The average values of
Table 4 and Figure 4 present the average values of solar cell parameters by means of the fuzzy S-function, reflecting the overall efficiency (
The average efficiency (
Below-limit efficiency (
The efficiency (
Based on average operating circumstances and intrinsic variability, the fuzzy S-function framework offers a realistic and optimized optimum point efficiency (
Table 4 shows solar cell efficiency throughout the operating limits. The average efficiency represents usual performance, while the below and over limit efficiencies show the solar cell’s range. We need this study to optimize solar cell deployment in different environments and meet real-world performance requirements. The chart emphasizes performance variability and extremes to enhance solar cell design and operation.
Comparing statistical and fuzzy set (S-function) solar cell parameter evaluation methods shows their pros and cons. Both approaches are used to analyze current density (
5.2.2 Statistical method
Mean value, variance, and SD summaries solar cell properties clearly. The mean values 4.45 for current density (
5.2.3 Fuzzy set (S-function) method
The fuzzy set (S-function) method adds depth by taking into account real-world uncertainty and unpredictability. For each parameter, this function sets below, above, and best point values. Current density (J) is 4.06 (below limit), 4.84 (above limit), and 2.32 (best point). The voltage limits are 1.78 (below limit), 2.08 (beyond limit), and 1.0025 (best point). Fill factor
5.2.4 Comparison and evaluation
Fuzzy set-S-function analysis includes more than a few capability values and identifies appropriate measures of overall performance, while the statistical method yields particular way and widespread deviations. The simplicity and clarity of the statistical method make it suitable as an initial assessment and evaluation tool. However, the fuzzy set method holds sure benefits over the opposite in actual packages due to excessive variability and uncertainty. The hybrid approach leverages normal distributions for probabilistic variability and fuzzy S-functions for handling imprecise data, enhancing accuracy and robustness in optimization. It provides a dual-layered framework to handle both probabilistic fluctuations and vague uncertainties, leading to more accurate and robust results. They can lead to inaccurate parameter estimation, suboptimal performance, and reduced reliability, which this study aims to mitigate. Factors include weather variability, material degradation, and socio-economic impacts of renewable energy adoption. Accounting for these ensures robust and sustainable solar energy solutions.
While the combination of normal distribution and fuzzy S-functions offers significant advantages for solar cell optimization, there are several challenges to consider in its application. One potential challenge is the need for accurate data to apply these methods effectively. Normal distribution relies on precise statistical analysis of the cell parameters, and any inaccuracies or missing data can compromise the optimization results. Similarly, fuzzy S-functions, which handle imprecise or uncertain data, require careful tuning of membership functions to ensure that the fuzzy logic system appropriately reflects the variations in solar cell performance. Furthermore, integrating these approaches into existing optimization frameworks can be complex, as it requires a balance between statistical modeling and fuzzy reasoning, both of which may need specialized expertise. Another challenge lies in computational costs, as the iterative processes of optimization with these methods can become resource-intensive, especially when dealing with large datasets or complex models. Despite these challenges, the ability of these methods to provide more accurate and robust optimization results makes them a promising avenue for improving solar cell performance.
6 Conclusion
This study demonstrates the effectiveness of combining normal distributions and fuzzy S-functions for optimizing the performance of silicon-based solar cells. The proposed hybrid approach addresses the challenges posed by environmental uncertainties and nonlinearities, which are often overlooked by traditional deterministic optimization methods. Key findings indicate that solar cell efficiency improves by up to 15%, with reliability increasing by 20%, under varying climatic conditions. Additionally, the fuzzy S-function method enables the accurate modeling of performance metrics, providing flexibility in adapting to diverse operational environments.
The experimental results reveal that solar cells perform optimally at lower temperatures, with a peak efficiency of 0.55% at 5°C, which decreases to 0.41% at 70°C due to the effects of temperature on current density, voltage, and fill factor. The integration of statistical analysis and fuzzy logic allows for a comprehensive evaluation of solar cell performance, addressing both precision and uncertainty.
These advancements contribute to a more reliable and efficient optimization process, making solar energy systems more robust against environmental fluctuations. The study establishes a solid foundation for incorporating fuzzy logic in renewable energy technologies, highlighting its potential to improve solar cell design and operation. Future research could extend this methodology to other types of solar cells and explore additional environmental factors, such as humidity and dust, to further enhance performance optimization.
The combination of normal distribution and fuzzy S-functions holds great potential for the future of solar energy technology, offering a more accurate and robust framework for solar cell optimization. By addressing both probabilistic variability and imprecise data, these methods enhance the reliability and performance of solar cells, paving the way for more efficient and sustainable renewable energy solutions. The application of these approaches is not limited to solar energy; they can be extended to other renewable energy systems, such as wind and hydropower, where similar uncertainties and variations in performance exist. The versatility of these methods makes them applicable across various renewable energy technologies, supporting the broader goal of optimizing energy systems to meet the growing global demand for clean and sustainable energy sources.
Acknowledgments
We thank the Universiti Teknologi Malaysia (UTM), Universite d’Angers, and Al-Iraqia University for their support with this work.
-
Funding information: Authors state no funding involved.
-
Author contributions: Ruqaya Shaker Mahmood, Layth Al-Gebory, Ammar Saad Mustaf, and Yasameen Waleed Khalid: methodology; Kawther A. Alameri, Mohammed Rasheed, and Taha Rashid: designed and performed the experiments; Mohammed Rasheed, Ruqaya Shaker Mahmood, and Ammar Saad Mustaf: analyzed and interpreted the data; and Mohammed Rasheed, Ruqaya Shaker Mahmood, Ammar Saad Mustaf, and Taha Rashid: prepared the manuscript. All authors have accepted responsibility for the entire content of this manuscript and approved its submission.
-
Conflict of interest: Authors state no conflict of interest.
-
Data availability statement: All data generated or analyzed during this study are included in this published article.
References
[1] Etukudoh EA, Nwokediegwu ZQS, Umoh AA, Ibekwe KI, Ilojianya VI, Adefemi A, et al. Solar power integration in Urban areas: A review of design innovations and efficiency enhancements. World J Adv Res Rev. 2024;21(1):1383–94. https://wjarr.com/content/solar-power-integration-urban-areas-review-design-innovations-and-efficiency-enhancements.10.30574/wjarr.2024.21.1.0168Suche in Google Scholar
[2] Al-Shahri OA, Ismail FB, Hannan MA, Lipu MSH, Al-Shetwi AQ, Begum RA, et al. Solar photovoltaic energy optimization methods, challenges and issues: A comprehensive review. J Clean Prod. 2021;284:125465. https://www.sciencedirect.com/science/article/pii/S0959652620355116.10.1016/j.jclepro.2020.125465Suche in Google Scholar
[3] Bist A, Pant B, Ojha GP, Acharya J, Park M, Saud PS. Novel materials in perovskite solar cells: Efficiency, stability, and future perspectives. Nanomaterials. 2023;13(11):1724.10.3390/nano13111724Suche in Google Scholar PubMed PubMed Central
[4] Tawfiq AAE, El-Raouf MOA, Mosaad MI, Gawad AFA, Farahat MAE. Optimal reliability study of grid-connected PV systems using evolutionary computing techniques. IEEE Access. 2021;9(2):42125–39.10.1109/ACCESS.2021.3064906Suche in Google Scholar
[5] MamtaMaurya KK, Singh VN. Efficient Sb2Se3 solar cell with a higher fill factor: A theoretical approach based on thickness and temperature. Sol Energy. 2021;230(1):803–9.10.1016/j.solener.2021.11.002Suche in Google Scholar
[6] Abdelkareem MA, Elsaid K, Wilberforce T, Kamil M, Sayed ET, Olabi A. Environmental aspects of fuel cells: A review. Sci Total Environ. 2021;752(1):141803–16.10.1016/j.scitotenv.2020.141803Suche in Google Scholar PubMed
[7] Schopp N, Бpyc BB, Lee J, Bazan GC, Nguyen T. A simple approach for unraveling optoelectronic processes in organic solar cells under short‐circuit conditions. Adv Energy Mater. 2020;11(1):1–10.10.1002/aenm.202002760Suche in Google Scholar
[8] Chermite C, Douiri MR. Hybrid tiki taka and mean differential evolution based Weibull distribution: A comprehensive approach for solar PV modules parameter extraction with Newton-Raphson optimization. Energy Convers Manag. 2024;314(1):118705.10.1016/j.enconman.2024.118705Suche in Google Scholar
[9] Balakrishnan N, Jaenada M, Pardo L. Robust Rao-type tests for step-stress accelerated life-tests under interval-monitoring and Weibull lifetime distributions. arXiv (Cornell University). 2024;1(1):1–18.Suche in Google Scholar
[10] Ahmed R, Sreeram V, Mishra Y, Arif MD. A review and evaluation of the state-of-the-art in PV solar power forecasting: Techniques and optimization. Renew Sustain Energy Rev. 2020;124(1):109792.10.1016/j.rser.2020.109792Suche in Google Scholar
[11] Krömer P, Heckenbergerová J, Musilek P. Accurate mixed weibull distribution fitting by differential evolution. Proc Genet Evolut Comput Conf. 2017;1(1):1161–8.10.1145/3071178.3071290Suche in Google Scholar
[12] Li S, Chen Z, Liu Q, Shi W, Li K. Modeling and analysis of performance degradation data for reliability assessment: A review. IEEE Access. 2020;8:74648–78.10.1109/ACCESS.2020.2987332Suche in Google Scholar
[13] Safavi M, Khajehnasiri AA. Numerical solution of nonlinear mixed Volterra-Fredholm integro-differential equations by two-dimensional block-pulse functions. Cogent Math Stat. 2018;5(1):1521084.10.1080/25742558.2018.1521084Suche in Google Scholar
[14] Nedaei M, Faccio M, Walsh PR, Rasul MG, Alain P. Novel design, implementation, and performance optimization of inverters by considering the effect of modulation. Energy Environ. 2024;35(7):3703–35.10.1177/0958305X231164688Suche in Google Scholar
[15] Furse C, Kafal M, Razzaghi R, Shin YJ. Fault diagnosis for electrical systems and power networks: A review. IEEE Sens J. 2021;21(2):888–906.10.1109/JSEN.2020.2987321Suche in Google Scholar
[16] Ju T, Schaefer S, Warren J. Mean value coordinates for closed triangular meshes. ACM Trans Graph. 2005;24(3):561–6.10.1145/1073204.1073229Suche in Google Scholar
[17] Starling JK, Mastrangelo C, Choe Y. Improving Weibull distribution estimation for generalized Type I censored data using modified SMOTE. Reliab Eng & Syst Saf. 2021;211(1):107505–15.10.1016/j.ress.2021.107505Suche in Google Scholar
[18] Rasheed M, Alshalal I, Abdula Ashed A, Abdelhadi Sarhan M, Shawki Jaber A. Mathematical models for resolving the nonlinear formula for solar cell. Indones J Electr Eng Computer Sci. 2024;33(1):653–60.10.11591/ijeecs.v33.i1.pp653-660Suche in Google Scholar
[19] Jošt M, Kegelmann L, Korte L, Albrecht S. Monolithic perovskite tandem solar cells: A review of the present status and advanced characterization methods toward 30% efficiency. Adv Energy Mater. 2020;10(26):1904102–43.10.1002/aenm.201904102Suche in Google Scholar
[20] Ahmad KS, Naqvi SN, Jaffri SB. Systematic review elucidating the generations and classifications of solar cells contributing towards environmental sustainability integration. Rev Inorg Chem. 2020;41(1):21–39.10.1515/revic-2020-0009Suche in Google Scholar
[21] Pasari S. Nowcasting earthquakes in the Bay of Bengal region. Pure Appl Geophys. 2019;176(4):1417–32.10.1007/s00024-018-2037-0Suche in Google Scholar
[22] Abbasi B, Hamid A, Arkat J, Hosseinkouchack M. Estimating the parameters of Weibull distribution using simulated annealing algorithm. Appl Math Comput. 2006;183(1):85–93.10.1016/j.amc.2006.05.063Suche in Google Scholar
[23] Mazzeo D, Oliveti G, Labonia E. Estimation of wind speed probability density function using a mixture of two truncated normal distributions. Renew Energy. 2018;115(1):1260–80.10.1016/j.renene.2017.09.043Suche in Google Scholar
[24] Bouras D, Rasheed M, Barille R, Aldaraji MN. Efficiency of adding DD3 + (Li/Mg) composite to plants and their fibers during the process of filtering solutions of toxic organic dyes. Opt Mater. 2022;131:112725–10.10.1016/j.optmat.2022.112725Suche in Google Scholar
[25] Elmahdy EE. Modelling reliability data with finite weibull or lognormal mixture distributions. Appl Math Inf Sci. 2017;11(4):1081–9.10.18576/amis/110414Suche in Google Scholar
[26] Gjessing HK, Aalen OO. Understanding the shape of the hazard rate: a process point of view (with comments and a rejoinder by the authors). Stat Sci. 2001;16(1):1–22.10.1214/ss/998929473Suche in Google Scholar
[27] Kececioglu DB, Wang W. Parameter estimation for mixed-Weibull distribution. IEEE Xplore. 2002;1(1):247–52.10.1109/RAMS.1998.653782Suche in Google Scholar
[28] Jaber A, Ismael M, Rashid T, Sarhan MA, Rasheed M, Sala IM. Comparesion the electrical parameters of photovoltaic cell using numerical methods. Eureka: Phys Eng; 2023;(4):29–39.10.21303/2461-4262.2023.002770Suche in Google Scholar
[29] Li L, Guan J, Yuan P, Yin Y, Li Y. A Weibull distribution-based method for the analysis of concrete fracture. Eng Fract Mech. 2021;256(1):107964–32.10.1016/j.engfracmech.2021.107964Suche in Google Scholar
[30] Ruan T, Qu M, Wang J, He Y, Xu X, Yu C, et al. Effect of deposition temperature of a-Si:H layer on the performance of silicon heterojunction solar cell. J Mater Sci Mater Electron. 2019;30(14):13330–5.10.1007/s10854-019-01700-7Suche in Google Scholar
[31] Hwang DK, Ko BS, Jeon DH, Kang JK, Sung SJ, Yang KJ, et al. Single-step sulfo-selenization method for achieving low open circuit voltage deficit with band gap front-graded Cu2ZnSn(S,Se)4 thin films. Sol Energy Mater Sol Cell. 2016;161(1):162–9.10.1016/j.solmat.2016.11.034Suche in Google Scholar
[32] Yang Z, Meng Q, Yan W, Lv J, Guo Z, Yu X, et al. Novel three-dimensional tin/carbon hybrid core/shell architecture with large amount of solid cross-linked micro/nanochannels for lithium ion battery application. Energy. 2015;82:960–7.10.1016/j.energy.2015.01.105Suche in Google Scholar
[33] Melikoglu M, Turkmen B. Food waste to energy: Forecasting Turkey’s bioethanol generation potential from wasted crops and cereals till 2030. Sustain Energy Technol Assess. 2019;36(1):100553.10.1016/j.seta.2019.100553Suche in Google Scholar
[34] Faqeha H, Bawahab M, Vermont D, Date A, Akbarzadeh A. Setting up salinity gradient in an experimental solar pond (SGSP). Energy Procedia. 2019;156:115–21.10.1016/j.egypro.2018.11.114Suche in Google Scholar
[35] Ali AH, Jaber AS, Yaseen MT, Rasheed M, Bazighifan O, Nofal TA. A comparison of finite difference and finite volume methods with numerical simulations: Burgers equation model. Rihan FA, editor. Complexity. 2022;2022(1):1–9.10.1155/2022/9367638Suche in Google Scholar
[36] Shi C, Yu H, Qian G, Li X, Zhu X, Yao D, et al. Research on the characteristics of asphalt mixture gradation curve based on Weibull distribution. Constr Build Mater. 2023;366(1):130151.10.1016/j.conbuildmat.2022.130151Suche in Google Scholar
[37] Nagpal C, Li X, Dubrawski A. Deep survival machines: Fully parametric survival regression and representation learning for censored data with competing risks. IEEE J Biomed Health Inform. 2021;25(8):3163–75.10.1109/JBHI.2021.3052441Suche in Google Scholar PubMed
[38] Karahasan M. A new approach to estimate parameters of the two-parameter Weibull distribution. Statistics. 2024;58(3):621–64.10.1080/02331888.2024.2353117Suche in Google Scholar
[39] Garrido A, Caro-Carretero R, Jimenez-Octavio JR, Carnicero A, Such M. A new approach to fitting the three-parameter Weibull distribution: An application to glass ceramics. Commun Stat Theory Methods/Commun Stat Theory Methods. 2019;50(14):3403–20.10.1080/03610926.2019.1702698Suche in Google Scholar
[40] Jones M, Noufaily A, Burke K. A bivariate power generalized Weibull distribution: A flexible parametric model for survival analysis. Stat Methods Med Res. 2019;29(8):2295–306.10.1177/0962280219890893Suche in Google Scholar PubMed
[41] Ekum MI, Adamu MO, Akarawak EE. Normal-power-logistic distribution: Properties and application in generalized linear model. J Indian Soc Probab Stat. 2022;24(1):23–54.10.1007/s41096-022-00143-4Suche in Google Scholar
[42] Wang Y, Chen Z, Zhang Y, Li X, Li Z. Remaining useful life prediction of rolling bearings based on the three-parameter Weibull distribution proportional hazards model. Insight - Non-Destr Test Cond Monit. 2020;62(12):710–8.10.1784/insi.2020.62.12.710Suche in Google Scholar
[43] Cousineau D. Fitting the three-parameter Weibull distribution: Review and evaluation of existing and new methods. IEEE Trans Dielectr Electr Insulation. 2009;16(1):281–8.10.1109/TDEI.2009.4784578Suche in Google Scholar
[44] Feroze N, Aslam M, Sindhu TN, Noor-ul-Amin M. Mixed Weibull distributions for the Bayesian analysis of reliability when failures are progressively censored. Stat Comput Simul/Journal Stat Comput Simul. 2021;91(17):3505–29.10.1080/00949655.2021.1942470Suche in Google Scholar
[45] Ben Azaza N, Elleuch S, Rasheed M, Gindre D, Abid S, Barille R, et al. 3-(p-nitrophenyl)Coumarin derivatives: Synthesis, linear and nonlinear optical properties. Opt Mater. 2019;96:109328.10.1016/j.optmat.2019.109328Suche in Google Scholar
[46] Kadri E, Messaoudi O, Krichen M, Dhahri K, Rasheed M, Dhahri E, et al. Optical and electrical properties of SiGe/Si solar cell heterostructures: Ellipsometric study. J Alloy Compd. 2017;721:779–83.10.1016/j.jallcom.2017.06.025Suche in Google Scholar
[47] Kadri E, Krichen M, Mohammed R, Zouari A, Khirouni K. Electrical transport mechanisms in amorphous silicon/crystalline silicon germanium heterojunction solar cell: Impact of passivation layer in conversion efficiency. Opt Quantum Electron. 2016;48(12):546–15.10.1007/s11082-016-0812-7Suche in Google Scholar
[48] Rasheed M, Mohammed OY, Shihab S, Al-Adili A. Explicit numerical model of solar cells to determine current and voltage. J Phys: Conf Ser. 2021;1795(1):012043.10.1088/1742-6596/1795/1/012043Suche in Google Scholar
[49] Saidani T, Rasheed M, Alshalal I, Rashed AA, Sarhan MA, Barille R. Characterization of thin ITO/Au/ITO sandwich films deposited on glass substrates using DC magnetron sputtering. Res Eng Struct Mater. 2024;10(2):743–70.Suche in Google Scholar
[50] Sellam M, Rasheed M, Azizi S, Saidani T. Improving photocatalytic performance: Creation and assessment of nanostructured SnO2 thin films, pure and with nickel doping, using spray pyrolysis. Ceram Int. 2024;50(12):20917–35.10.1016/j.ceramint.2024.03.094Suche in Google Scholar
[51] Sarhan MA, Shihab S, Kashem BE, Rasheed M. New exact operational shifted pell matrices and their application in astrophysics. J Phys: Conf Ser. 2021;1879(2):022122–10.10.1088/1742-6596/1879/2/022122Suche in Google Scholar
[52] Rasheed M, Alabdali O, Shihab S, Rashid A, Rashid T. On the solution of nonlinear equation for photovoltaic cell using new iterative algorithms. J Phys: Conf Ser. 2021;1999(1):012078.10.1088/1742-6596/1999/1/012078Suche in Google Scholar
[53] Rasheed M, Shihab S, Alabdali O, Rashid A, Rashid T. Finding roots of nonlinear equation for optoelectronic device. J Phys: Conf Ser. 2021;1999(1):012077.10.1088/1742-6596/1999/1/012077Suche in Google Scholar
[54] Rasheed M, Nuhad Al-Darraji M, Shihab S, Rashid A, Rashid T. The numerical calculations of single-diode solar cell modeling parameters. J Phys: Conf Ser. 2021;1963(1):012058.10.1088/1742-6596/1963/1/012058Suche in Google Scholar
[55] Alabdali O, Shihab S, Rasheed M, Rashid T. Orthogonal Boubaker-Turki polynomials algorithm for problems arising in engineering. 3rd International Scientific Conference Of Alkafeel University (ISCKU 2021). Vol. 2836, No. 1, 2022. p. 050019.10.1063/5.0066860Suche in Google Scholar
[56] Shihab S, Rasheed M, Alabdali O, Abdulrahman AA. A novel predictor-corrector Hally technique for determining the parameters for nonlinear solar cell equation. J Phys: Conf Ser. 2021;1879(2):022120.10.1088/1742-6596/1879/2/022120Suche in Google Scholar
[57] Rasheed M, Mohammedali MN, Sadiq FA, Sarhan MA, Saidani T. Application of innovative fuzzy integral techniques in solar cell systems. J Opt/J Opt (New Delhi Print). 2024;09728821.10.1007/s12596-024-01928-5Suche in Google Scholar
[58] Rasheed M, Al-Darraji MN, Shihab S, Rashid A, Rashid T, Solar PV. Modelling and parameter extraction using iterative algorithms. J Phys: Conf Ser. 2021 Jul;1963(1):012059.10.1088/1742-6596/1963/1/012059Suche in Google Scholar
[59] Alshalal I, Al-Zuhairi HMI, Abtan AA, Rasheed M, Asmail MK. Characterization of wear and fatigue behavior of aluminum piston alloy using alumina nanoparticles. J Mech Behav Mater. 2023;32(1):1–7.10.1515/jmbm-2022-0280Suche in Google Scholar
© 2025 the author(s), published by De Gruyter
This work is licensed under the Creative Commons Attribution 4.0 International License.
Artikel in diesem Heft
- Research Articles
- Probing microstructural evolution and surface hardening of AISI D3 steel after multistage heat treatment: An experimental and numerical analysis
- Activation energy of lime cement containing pozzolanic materials
- Optimizing surface quality in PMEDM using SiC powder material by combined solution response surface methodology – Adaptive neuro fuzzy inference system
- Experimental study of the mechanical shear behaviour of steel rebar connectors in timber–concrete structure with leafy wood species
- Development of structural grade lightweight geopolymer concrete using eco-friendly materials
- An experimental approach for the determination of the physical and mechanical properties of a sustainable geopolymer mortar made with Algerian ground-granulated blast furnace slag
- Effect of using different backing plate materials in autogenous TIG welding on bead geometry, microhardness, tensile strength, and fracture of 1020 low carbon steel
- Uncertainty analysis of bending response of flexoelectric nanocomposite plate
- Leveraging normal distribution and fuzzy S-function approaches for solar cell electrical characteristic optimization
- Effect of medium-density fiberboard sawdust content on the dynamic and mechanical properties of epoxy-based composite
- Mechanical properties of high-strength cement mortar including silica fume and reinforced with single and hybrid fibers
- Study the effective factors on the industrial hardfacing for low carbon steel based on Taguchi method
- Analysis of the combined effects of preheating and welding wire feed rates on the FCAW bead geometric characteristics of 1020 steel using fuzzy logic-based prediction models
- Effect of partially replacing crushed oyster shell as fine aggregate on the shear behavior of short RC beams using GFRP rebar strengthened with TRC: Experimental and numerical studies
- Micromechanic models for manufacturing quality prediction of cantula fiber-reinforced nHA/magnesium/shellac as biomaterial composites
- Numerical simulations of the influence of thermal cycling parameters on the mechanical response of SAC305 interconnects
- Impact of nanoparticles on the performance of metakaolin-based geopolymer composites
- Enhancing mechanical and thermal properties of epoxy-based polymer matrix composites through hybrid reinforcement with carbon, glass and steel
- Prevention of crack kinetic development in a damaged rod exposed to an aggressive environment
- Ideal strain gauge location for evaluating stress intensity factor in edge-cracked aluminum plates
- Experimental and multiscale numerical analysis of elastic mechanical properties and failure in woven fabric E-glass/polyester composites
- Optimizing piezoelectric patch placement for active repair of center-cracked plates
- Experimental investigation on the transverse crushing performance of 3D printed polymer composite filled aluminium tubes
- Review Articles
- Advancing asphaltic rail tracks: Bridging knowledge gaps and challenges for sustainable railway infrastructure
- Chemical stabilization techniques for clay soil: A comprehensive review
- Development and current milestone of train braking system based on failure phenomenon and accident case
- Rapid Communication
- The role of turbulence in bottom-up nanoparticle synthesis using ultrafast laser filamentation in ethanol
- Special Issue on Deformation and Fracture of Advanced High Temperature Materials - Part II
- Effect of parameters on thermal stress in transpiration cooling of leading-edge with layered gradient
- Development of a piezo actuator-based fatigue testing machine for miniature specimens and validation of size effects on fatigue properties
- Development of a 1,000°C class creep testing machine for ultraminiature specimens and feasibility verification
- Special Issue on Advances in Processing, Characterization and Sustainability of Modern Materials - Part II
- Surface integrity studies in microhole drilling of Titanium Beta-C alloy using microEDM
- Experimental investigation on bacterial concrete by using Cantabro loss and UPV
- Influence of gas nitriding on the surface layer of M50 NiL steel for aerospace-bearing applications
- Experimental investigation on the spectral, mechanical, and thermal behaviors of thermoplastic starch and de-laminated talc-filled sustainable bio-nanocomposite of polypropylene
- Synthesis and characterization of sustainable hybrid bio-nanocomposite of starch and polypropylene for electrical engineering applications
- Microstructural and mechanical characterization of Al6061-ZrB2 nanocomposites fabricated by powder metallurgy
- Effect of edge preparation on hardness and corrosion behaviour of AA6061-T651 friction stir welds
- Mechanical improvement in acetal composites reinforced with graphene nanotubes and Teflon fibers using loss functions
- Experimental investigation on the mechanical properties of aluminum-based metal matrix composites by the squeeze casting method
- Investigation on punch force–displacement and thickness changes in the shallow drawing of AA2014 aluminium alloy sheets using finite element simulations
- Influence of liquid nitriding on the surface layer of M50 NiL steel for bearing applications
- Mechanical and tribological analyses of Al6061-GO/CNT hybrid nanocomposites by combined vacuum-assisted and ultrasonicated stir casting method
- Strengthening of structures with bacterial concrete for effective crack repair and durability enhancement
- Unique approaches in developing novel nano-composites: Evaluating their mechanical and tribological characteristics
- Load-carrying capacity of highly compact rigid deployable booms
- Investigating the influence of SiC and B4C reinforcements on the mechanical and microstructural properties of stir-casted magnesium hybrid composites
- Evaluation of mechanical and performance characteristics of bitumen mixture using waste septage ash as partial substitute
- Mechanical characterization of carbon/Kevlar hybrid woven 3D composites
- Development of a 3D-printed cervical collar using biocompatible and sustainable polylactic acid
- Mechanical characterization of walnut shell powder-reinforced neem shell liquid composite
- Special Issue on Structure-energy Collaboration towards Sustainability Societies
- Effect of tunneling conductivity of CNTs on the EMI shielding effectiveness of nanocomposite in the C-band
- Evaluation of the effect of material selection and core geometry in thin-walled sandwich structures due to compressive strength using a finite element method
- Special Issue on Sustainability and Development in Civil Engineering - Part III
- The optimum reinforcement length for ring footing resting on sandy soils resisting inclined load
- Special Issue on Advanced Materials in Industry 4.0
- Cross-dataset evaluation of deep learning models for crack classification in structural surfaces
- Mechanical and antibacterial characteristics of a 3D-printed nano-titanium dioxide–hydroxyapatite dental resin-based composite