Effect of tunneling conductivity of CNTs on the EMI shielding effectiveness of nanocomposite in the C-band
-
Rajnish P. Modanwal


Abstract
In the present work, the electromagnetic interference (EMI) shielding effectiveness (SE) of carbon nanotube-reinforced nanocomposite (CNRC) is investigated by using an analytical approach. CNRC is composed of a polypyrrole matrix and carbon nanotubes (CNTs). The effect of the tunneling conductivity of CNTs on the EMI SE is studied quantitively, at different weight percentages (wt%) of CNTs, by varying the aspect ratio of CNTs, CNT-matrix interphase thickness, and waviness of CNTs. We observed that the SE is significantly influenced by the wt% of CNTs and the thickness of CNRC in the frequency range of 4.2–8.2 GHz (C-band). To support the theoretical investigations and understand the shielding mechanism of CNRC, a finite-element model is derived using commercially available software Ansys HFSS. The outcomes of both models are in good agreement. In addition, our investigation reveals that the electrical conductivity of CNRC is significantly improved with the increased wt% and aspect ratio of CNTs, as well as with increased interphase thickness. However, it degrades as the waviness of CNT increases. Our results suggest that the raised tunneling conductivity of CNTs improves the EMI SE of CNRC significantly. For the sake of greater clarity, the quantitative relative performance of the CNRC is also presented. Our foundational study highlights an opportunity to develop effective and lightweight CNT-based nanocomposites, which can be used in EMI SE applications.
Nomenclature
-
-
Electrical conductivity of CNTs
-
-
Electrical conductivity of matrix
-
-
Electrical conductivity of tunneling distance of CNTs
-
-
Electrical conductivity of extended CNTs
-
-
Electrical conductivity of wavy CNTs
-
-
Electrical conductivity of CNRC
-
-
Electrical conductivity of copper
-
-
Relative conductivity of nanocomposite
-
-
Tunneling distance between nanoparticles
-
-
Contact area of CNTs
-
-
Resistance of tunneling distance between CNTs
-
-
Resistance of CNTs
-
-
Effective electrical resistance
-
-
Radius of CNTs
-
-
Length of CNTs
-
-
Equivalent length of wavy CNTs
-
-
Percentage of networked CNTs
-
-
Percolation threshold volume fraction
-
-
Effective volume fraction of effective CNTs
-
-
Excluded volume of CNTs
-
-
Volume of CNTs
-
-
Interphase thickness
-
-
Waviness factor
-
-
Thickness of shielding materials
-
-
Skin depth
-
-
Screen distance
-
-
Frequency of electromagnetic waves
-
-
Wave impedance
-
-
Conductor impedance
- μ
-
Magnetic permeability
-
-
-
-
Relative permeability of CNRC
-
-
Cut-off frequency
-
-
Width of waveguide
-
-
Thickness of waveguide
-
-
Speed of light
1 Introduction
During the past few decades, electromagnetic interference (EMI) has become a critical problem, which originates from the electromagnetic (EM) field created by electronic devices. The term EMI is defined as the emission of radiation from an electronic component, which affects the performance of its neighboring electronic components. Thus, the EMI is an offensive electronic wave, which disturbs the operation of other electronic devices and is detrimental to space applications. For example, in the aerospace industry, manufacturers explore all possible means to control the EMI during the design and development stages of payload components. A typical payload consists of numerous powerful components such as traveling-wave tube amplifiers, muxs, waveguide joints, isolators, antennas, and feeds. These powerful components emit large amounts of radiation when they are operational. Apart from these, numerous sensitive components such as receivers, pre-amplifiers, high-gain solid-state amplifiers, demuxs, and filters are also mounted on the payload. The radiation emitted from both powerful components and sensitive components results in their performance degradation [1,2]. A similar problem is also faced by electronic industries, especially in wireless and communication systems, such as the control panels of airplanes, mobile phones, and computer systems. In the case of these devices, EMI is the most dominant cause of malfunction [3,4]. Also, an excess of such radiation in the environment is hazardous to life [5,6,7,8]. Therefore, it is necessary to block EM emissions in order to increase the performance of electronic devices and eliminate their hazardous effects on living creatures. The EMI shielding effectiveness (SE) is one such powerful process that blocks EM emissions from electronic devices.
The major mechanisms for EMI attenuation include reflection, absorption, and multiple reflections. The primary mechanism of EMI SE is absorption, which requires the existence of electric or magnetic dipoles to interact with EM radiation. It changes according to the thickness of the materials. Materials with a high dielectric constant provide electric dipoles, while materials with high magnetic permeability provide magnetic dipoles for the EMI SE by absorption. Reflection is the secondary mechanism of EMI SE. For reflection, the material must possess mobile charge carriers such as electrons or holes interacting with EM radiation. However, it is found that multiple reflections may be neglected when the SE due to the absorption is ≥10 dB [9,10]. Over the past few decades, metallic materials such as metallic coating, metal oxides, metallic fibers, and metallic fillers have been widely used for EMI SE applications. Such metallic materials have inherent attributes such as conductivity, permeability, and permittivity [11,12,13,14,15]. However, metallic materials are quite heavy, require more servicing, and corrode easily. This limits their use in aerospace applications [16,17,18,19,20]. In order to overcome the drawbacks of conventional metallic shielding materials, numerous research studies are being conducted to obtain alternative lightweight shielding materials that can block EMI effectively.
Recently, polymer-based materials have attracted considerable attention from researchers due to their unique properties such as light weight, corrosion resistance, low cost, easy processability, thermomechanical, and other properties, and potential for easy synthesis using different techniques [21,22,23,24,25,26,27,28]. A large variety of conducting polymers such as polyaniline, polyphenylacetylene, polythiophene, and polypyrrole (PPy) are being used for the EMI shielding of devices [4,16,29]. Among them, PPy proves to be an attractive conducting polymer due to its good electrical conductivity (EC), simple processability, environmental stability, and incredible response in terms of EMI SE [30,31]. It is worth noting that PPy can also restrain EMI up to a lower frequency range, which is usually difficult in the case of conventional materials. However, PPy is not suitable for estimating EMI SE at a higher frequency range. Therefore, carbon nanotube (CNT)s are introduced within the PPy matrix in order to improve the conductivity of composite materials and make them suitable for use at a higher frequency range [32,33,34].
The introduction of CNTs, graphene, and boron nitride tubes has sparked a great deal of research about the prediction of their unique electrical, thermal, and mechanical properties [35,36,37,38]. Several research investigations have revealed that the incorporation of CNTs in the polymer matrix significantly improves the EC of the resulting nanocomposite. Furthermore, the alignment, dispersion, and concentration of CNTs in nanocomposites are critical factors that significantly influence the EMI SE of nanocomposites. These factors control the formation of conductive CNT networks within the matrix, which determine how effectively the composite can reflect, absorb, and dissipate EM waves. In contrast, CNTs alignment refers to how the nanotubes are oriented within the matrix, whether they are aligned in a specific direction or randomly dispersed. An aligned CNT enhances directional conductivity and can improve EMI SE in specific directions, favoring reflection at higher frequencies. However, dispersion of CNTs refers to how uniformly the CNTs are distributed within the matrix material. Poor dispersion leads to agglomeration of CNTs that decreases the properties of nanocomposites, while a good dispersion ensures uniform EMI SE by creating consistent conductive networks, enhancing both SE due to reflection and absorption. Furthermore, CNT concentration is defined as the amount of CNTs incorporated into the matrix material. CNT concentration must be optimized to reach the percolation threshold and beyond, so that the EC and EMI SE both improve significantly [39,40]. Also, it was observed that the mechanical properties of nanocomposite are enhanced by the incorporation of CNTs in the polymer matrix [41,42,43,44,45,46,47]. For instance, Gahlout and Choudhary [33] experimentally evaluated the EC and SE of multiwalled CNT/PPy nanocomposites through the doping of 5-sulfoisophtalic acid monolithium salt. They found that the EC and EMI SE of the nanocomposite were enhanced due to the incorporation of CNTs in the matrix material. Liu and Wan [48] determined the EC and ferromagnetic behavior of PPy composites using a synthesized chemical method in the presence of p-dodecylbenzene sulfonic acid sodium salt and hydrochloric as a dopant. They found that the magnetic properties of the PPy composite showed ferromagnetic behavior. Further, they reported that the EC of the PPy composite is about 10 S/cm. Kaur and Dhawan [16] synthesized PPy nanoparticles by using the surfactant-directed chemical oxidation method. They predicted that the EC and EMI SE of PPy nanoparticles increase, even as the particle size of a PPy decreases. Ebrahimi and Gashti [32] fabricated multiwalled CNTs/silver/PPy nanocomposites via chemical deposition and ultraviolet (UV) reduction methods. They examined the electrical and EMI SE properties of fabricated nanocomposites. They reported that the EC and SE of MWCNT/silver/PPy nanocomposites improve via the UV reduction method, as compared to the chemical deposition method. Mohameed and Sundararaj [10] investigated the EMI SE and electrical resistivity of MWCNT and polypropylene. They found that the electrical resistivity of developed nanocomposites decreases as the volume fraction of MWCNTs increases. They estimated the SE by fabricating composite samples with different thicknesses and concentrations of MWCNTs. It was reported that the SE of nanocomposites increases with an increase in the sample thickness and concentration of MWCNTs. Liu et al. [24] determined the SE and electrical resistivity of CNT-reinforced carbon fiber/pyrolytic carbon composites. They observed that the electrical resistivity of nanocomposites diminished with an increase in the weight fraction of CNTs. They also concluded that the SE of nanocomposite increases with an increase in the weight fraction of CNTs.
The reviewed literature indicates that the addition of CNTs into the polymer matrix results in an increase in the EC and EMI SE of nanocomposites. This is attributed to the fact that the dispersion of electrically conductive CNTs in a polymer matrix results in the percolated conductive network of CNTs, which makes nanocomposites electrically conductive. Existing studies have proved that the incorporation of CNTs above the percolation threshold increases their conductive network density in a polymer matrix. This consequently increases the electrical properties of nanocomposites such as tangent of dielectric loss angle, dielectric breakdown, dielectric constant, and EC [49]. Among these properties, EC is the most important property, as higher EC can provide better SE of materials, according to a previous study [33].
Existing studies showed that the EC of nanocomposites is the function of the following parameters: (i) filler content, waviness, aspect ratio, size, orientation, surface energy of fillers; (ii) filler/matrix contact resistance and associated interphases thickness; and (iii) matrix surface energy [50,51,52,53,54]. Among these, the waviness of fillers, aspect ratio of fillers, and interphase thickness influence the EC of nanocomposites via a tunneling effect. Traditional conductive mechanisms rely on continuous, physically connected pathways, while tunneling conductivity involves quantum mechanical phenomena [19,55,56,57,58]. In contrast, traditional conductivity in nanocomposites is primarily achieved through direct contact between conductive fillers, where electrons move freely along continuous conductive pathways formed by physical connections between fillers. However, tunneling conductivity is defined as a phenomenon where electrons tunnel between CNTs that are not physically in contact but are close enough for quantum tunneling to occur. In contrast, when CNTs are dispersed in the polymer matrix, they form a network. In such a network, some of the CNTs are not in direct contact with others since they are separated by a small distance (nanometre range). Hence, electrons can move through a polymer medium known as tunneling conductivity [59,60,61,62,63,64]. In order to increase the EMI SE, a highly conductive material is required to attenuate EM radiation by reflection and absorption [4,32]. Therefore, the tunneling effect is a crucial mechanism for determining the EC of CNT-based nanocomposites. The review of the above literature on the CNT-based nanocomposite indicates that CNT is one of the most fascinating nanofiller materials, which can be used to improve the EMI SE response of materials. The literature review indicates that several researchers have studied the SE of CNT-reinforced PPy nanocomposites [32,33,65,66,67]. However, to the best of current authors’ knowledge, no research study has investigated the tunneling effect of CNTs accounting (i) the aspect ratio of CNTs, (ii) waviness of CNTs, and (iii) CNT-matrix interphase thickness on the SE of CNRC. This is indeed the motivation behind the current study. In this study, an analytical model is derived to investigate the EC of CNRC, which takes into consideration such parameters. Further, the impact of aspect ratio and waviness of CNTs as well as of interphase thickness on the percolation threshold is also studied. Further, the EMI SE of CNRC is estimated analytically by considering the tunneling effect of CNT in the PPy matrix within the C-band (4.2–8.2 GHz) region. We considered the C-band in the present work since it has numerous real-world applications. At present, many satellite communications transmissions occur in the C-band frequency range. Additionally, several Wi-Fi devices, weather radar systems, surveillance, 5G networks, and cordless telephones operate in the C-band frequency range [68,69]. The SE is calculated by changing the wt% of CNT as well as the sample thickness of CNRC.
2 Analytical and finite-element (FE) modeling of CNRC
2.1 Analytical modeling
In this section, the EC and EMI SE of CNRC are examined by developing an analytical model. A CNRC is composed of CNTs and PPy matrix by considering the rectangular representative volume elements (RVEs). All the analytical modeling is performed with the help of the MATLAB program [70,71,72]. Figure 1(a) represents the schematic diagram of CNRC reinforced with CNTs in the PPy matrix. In this analysis, we have restricted ourselves to a single RVE. The axial and transverse cross-sections of CNRC RVE are illustrated in Figure 1(b). The following assumptions were adopted in the current study:
The cylindrical molecular structure of CNT may be treated as an equivalent solid cylinder fiber.
CNTs are randomly distributed throughout the PPy matrix in order to create a conductive network.
The composite is homogeneous throughout.
There is no slippage between the CNTs and the PPy matrix.

(a) Schematic representation of CNRC and (b) axial and transverse cross-sections of CNRC RVE.
2.1.1 Simulation of EC
A theoretical model is proposed for the CNT-based nanocomposite by considering the tunneling gaps between the CNTs [73]. It is observed that the tunneling distance between two CNTs depends on the distance between one CNT and its neighboring CNTs. This approach is applied to determining the conductivity of nanocomposites, wherein electron tunneling is the chief mechanism. In this model, it is assumed that the tunneling distances are oriented along the x, y, and z directions and can be expressed as
where
Also, the value of
Based on the percolation threshold, the curve of conductivity versus the volume fraction of nanocomposites can be divided into three parts, as shown in Figure 2. Part 1 represents the EC of the nanocomposites at a low volume fraction of CNTs, wherein conductive particles are not well connected to each other. Therefore, the electrical properties of composites are close to the EC of the matrix. Part 2 shows that the increased volume fraction of conductive particles generates a sudden increment in the EC of nanocomposites. This is due to the presence of sufficient fillers to form inter-particle connections between the conductive fillers. This critical volume fraction is called the percolation threshold. Beyond this percolation threshold, the further increment in the volume fraction of nanofillers leads to a dramatic increase in the EC. This is due to the dense network of nanofiller forms in the matrix, as shown in part 3 (Figure 2) [74,75].

Description of three parts of the curve of composite conductivity versus filler volume fraction.
Figure 3 demonstrates the in-plane contact between two adjacent CNTs. It is observed that as the wt% of CNT increases in the matrix, the separation distance between CNTs decreases. Subsequently, the formation of conductive networks begins. According to power law [60], tunneling distance can be expressed as
where

Contact configuration between two CNTs.
However, due to the presence of van der Waals force between CNTs, these percolated CNTs continue to be in electrical rather than physical contact. Therefore, the thickness of the interphase can be expressed as
Finally, combining Eqs. (4) and (5) into Eq. (6), the interphase thickness can be written as follows:
The tunneling-type contact resistance between two CNTs is proposed by Simmons’s derivation for electron tunneling. It can be expressed as
where λ is the potential barrier height (which is approximately 5.0 eV for CNTs dispersed in most polymers), m is the mass of an electron, e is the electric charge on the electron, a is the contact area of CNTs, and h is the plank constant. Therefore, the electrical resistance due to tunneling resistance can be written as
It is to be noted that there are two types of conductive contact configuration formed between two CNTs (Figure 4). One conductive configuration is formed due to the overlapping of CNTs, as shown in Figure 4(a). For this conductive configuration, the contact area at the overlapping position is

CNTs network dominated by (a) overlapping contact configuration and (b) in-plane contact configuration.
The effective electrical resistance can be defined as the sum of the resistance induced due to the CNTs and the tunneling distance between CNTs. Thus, effective electrical resistance can be expressed as
where
where
By changing Eq. (13) into Eq. (15), the EC of extended CNTs can be written as
The above expression represents the EC of CNTs by considering the tunneling distance of CNTs. Furthermore, this calculated EC of CNTs can be used to develop a model to evaluate the EC of CNRC by considering the tunneling mechanism. The EC of CNTs-based nanocomposite can be determined by using the model derived by Deng and Zheng [59]. This model is developed by low loading of randomly distributed CNTs and can be expressed as
where
It is to be noted that the ratio of
If the incorporation of CNTs within the nanocomposite increases, then it will lead to a situation wherein the percolation level of CNTs is exceeded. It is found that, after percolation, the CNTs would be electrically linked to form a conductive network, even though they would still not be physically connected to each other. At this stage, the above model should be modified and expressed as
where
The above model represents the EC of CNT/PPy-based nanocomposites as a function of CNTs network properties. However, this model does not regard the influence of interphase and CNTs curvature on the conductivity, though these terms significantly affect the percolation threshold and the percentage of networked fillers.
A soft-core Sphero cylinder model is devolved in order to estimate the percolation in 3D fiber systems with the help of Monte Carlo simulations [76]. In this model, it is assumed that the number of objects per unit volume at percolation
If
Since
where
where
where
![Figure 5
TEM image of CNTs [77]. Copyright: 5943171182537.](/document/doi/10.1515/jmbm-2024-0034/asset/graphic/j_jmbm-2024-0034_fig_005.jpg)
TEM image of CNTs [77]. Copyright: 5943171182537.
For mathematical modeling, we have considered both the straight and wavy CNT, as shown in Figure 6(a) and (b). Therefore, the waviness factor (u) can be defined as
where

(a) Straight CNT and (b) wavy CNT.
Figure 7 depicts the CNTs with interphase thickness. In this figure, CNTs and their surrounding interphase are included. The CNT-matrix interphase thickness refers to the region between the CNT and the surrounding polymer matrix in a nanocomposite material [60]. This region has unique properties due to the interaction between the CNTs and the matrix, often resulting in a transition zone where the mechanical, electrical, and thermal properties differ from both the CNTs and bulk matrix. The EC of nanocomposite shows a direct dependency on the interphase thickness, and EMI SE shows a direct dependency on the EC of nanocomposite [4,78]. In contrast, both parameters increase with increases in the thickness of the interphase. Hence, to estimate the effective volume fraction of CNT, we assume the role of interphase and curvature of CNTs [60]. This equation can be written as

Effective CNT with interphase.
However, it is found that several CNTs are employed within the continuous network after percolation, while others are dispersed in CNT-polymer nanocomposites. Then, the percentages of a network of percolated CNTs are expressed as
The proposed equation for
2.1.2 Simulation of EMI SE
In order to estimate the EMI SE, a theoretical model was derived by Sevgi [2]. In this model, a conductive shielding plate of infinite extent is inserted between the EM-rays emitted device and the EM-rays absorbed device. This configuration is made in order to estimate the SE. It is noted that the SE of a material is a cumulative effect of absorption, reflection, and multiple internal reflections. However, absorption is a major shielding mechanism, and reflection is a secondary shielding mechanism, as shown in Figure 8. Further, multiple internal reflections are neglected when the SE due to absorption is

EM shielding material with the demonstration of absorption, reflection, and multiple reflection losses.
SE due to absorption
where
where
Changing Eq. (35) into Eq. (33), the SE due to absorption can be obtained as
where
The SE due to reflection
where
Also, for the far field, the (plane) wave impedance in free space can be written as
By converting Eqs. (37) and (38) into Eq. (36), the SE due to reflection can be reduced as follows:
However, it is to be noted that, in the near field, the type of interfering source becomes one of the important factors. The wave impedance of electrical (i.e., dipole-like emitting) sources is
If
2.2 FE modeling
In this section, an FE model is developed using the commercially available software Ansys HFSS (high-frequency structure simulator). The EMI SE of CNRC in the C-band is estimated using this model. In this model, first, a rectangular waveguide (WR-137) with a standard dimension and cut-off frequency is designed in the C-band region, as shown in Figure 9(a). The cut-off frequency is the frequency at which no propagation of the signal takes place through the waveguide. The cut-off frequency is expressed as follows:
where

A rectangular waveguide with (a) loaded CNRC, (b) PEC boundary condition, and (c) two ports.
The dimension of a waveguide with the cut-off frequency in the C-band
| P (mm) | q (mm) | Thickness (mm) |
|
|---|---|---|---|
| 34.848 | 15.79 | 1.625 | 4.3 |
In order to simulate EMI SE in the Ansys HFSS, we put the CNRC in the middle of the waveguide, as shown in Figure 9(a). Next, we assign the perfect electric boundary condition (PEC) to the rectangular waveguide, as shown in Figure 9(c). In order to generate the EM radiation, two ports are created: one port is at the left side of the waveguide, while another port is set at the right side of the waveguide, as shown in Figure 9(c). Finally, the solution setup, frequency, and sweep setup are completed, and the simulation is run.
3 Results and discussion
This section presents the analytical outcomes for the tunneling conductivity of CNRC. For the recognition of the tunneling effect, we have considered the aspect ratio, waviness, and interphase thickness of CNTs. Subsequently, we have reported the analytical outcomes of the EMI SE of CNRC as a function of the concentration of CNTs and the thickness of CNRC in the C-band (4.2–8.2 GHz). An FE model is also developed in order to estimate the EMI SE in the C-band region. A comparative report of the analytical and the numerical results is presented herewith.
3.1 Effect of tunneling conductivity of CNTs on CNRC
In order to determine the effect of the aspect ratio of CNTs on the EC of CNRC, the PPy and the CNTs are used as the matrix and reinforcement material, respectively. We mixed the CNTs in a PPy at different wt%, in order to improve the EC of CNRC. The aspect ratio of CNT is defined as the length-to-diameter ratio of CNT. In the present investigation, we varied the length of CNT while keeping its diameter constant. The EC of CNT and PPy are taken as

The EC of CNRC at different wt% and aspect ratio of CNTs (
Figure 11 demonstrates the EC with respect to the wt% of CNTs at different interphase thicknesses. The interphase thickness is defined as the thickness of the interphase zone formed between the CNTs and PPy matrix. The figure depicts that the EC of the CNRC increases significantly, with an increase in the amount of CNTs within the PPy matrix. Also, it is notable that the EC of CNRC with a thick interphase is higher when compared to the EC of CNRC with a thin interphase. This reveals that a high tunneling conductivity is obtained by using a thick interphase and a high concentration of CNTs. The interphase thickness can be changed by altering the tunneling distance. A thick interphase thickness has been obtained at a low tunneling distance. The interphase creates a layer around nanotubes, which approaches the nanotubes and produces a conductive network. A thicker interphase region produces better interphase conductivity and a smaller interphase resistance in nanocomposites. Due to this, a dense conductive network is established in a CNRC. A dense conductive network allows the transmission of more electrons. Therefore, the EC of the nanocomposite shows a direct dependency on the interphase thickness. It can be concluded that interphase thickness also plays a positive role in percolation threshold, effective CNT, and the percentage of network CNT. The beneficial effect of interphase thickness on the EC of CNRC is reported in previous studies [60,78]. Therefore, it can be observed that increased interphase thickness reflects a positive change in the EC.
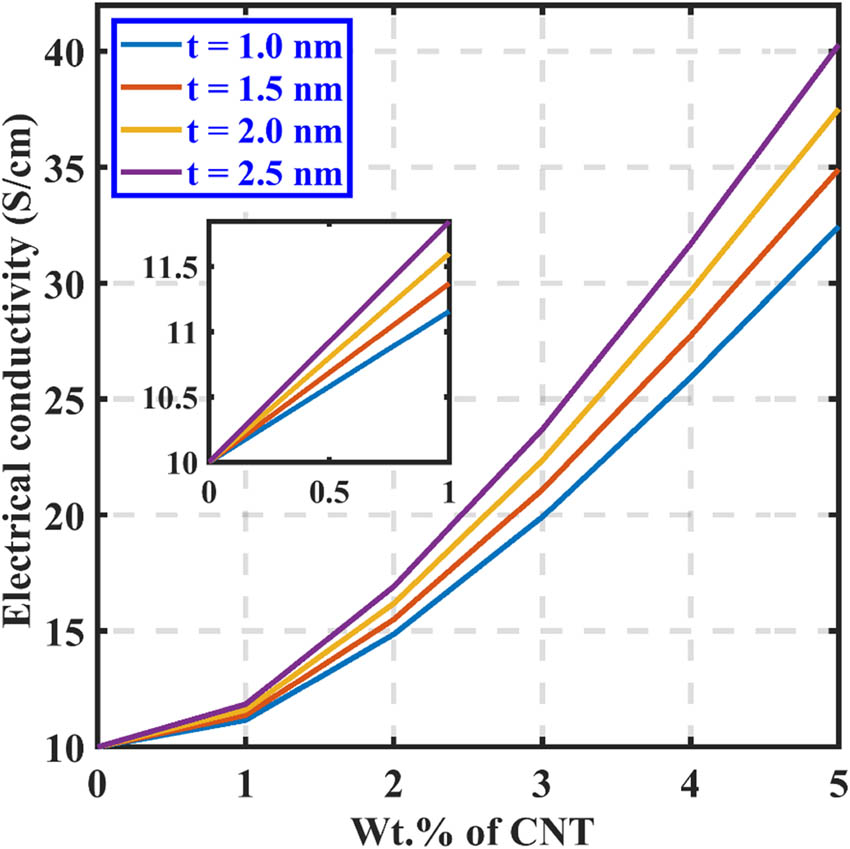
The EC of CNRC at different wt% of CNTs and interphase thickness (
In order to investigate the effect of the waviness of CNTs on the EC of CNRC, we vary the equivalent length of the CNTs. Figure 12 illustrates the EC of CNRC for wavy and straight CNTs at different wt% of CNTs. It is found that the EC of CNRC is enhanced due to the incorporation of CNTs in the PPy matrix. However, the EC of CNRC with straight CNTs is greater compared to the EC of CNRC with wavy CNTs for the same loading of CNTs. It can be noticed that a low waviness factor significantly improves the effectiveness of the EC of CNRC. Whereas the high waviness factor of CNTs depicts the higher curvature which degrades the effectiveness of the EC of CNRC. The increase in waviness of CNTs reduces the effective length of CNT. Subsequently, a weak conductive network is established between the CNTs in the PPy matrix. Thus, the electrons cannot be moved longer since the electrons are trapped in the PPy matrix. This provides a poor EC of CNRC containing wavy CNTs compared to straight CNTs. The detrimental effect of the curvature of CNTs on the EC of CNT-polymer nanocomposites is also reported in previous studies [81,82]. So, it can be concluded that the straight CNTs produce low percolation thresholds and high effective filler concentrations. As a result, straight CNTs produce larger networks in nanocomposites.

The EC of CNRC at different wt% of CNTs and different waviness factor (
3.2 EMI SE of CNRC
In order to study the performance of CNRC in EMI SE, analytical outcomes are estimated based on the model derived in the previous section. The total SE is defined as the ability of a material to attenuate the incident EM radiation. For this, Eq. (42) is formulated, and the tunneling conductivity of CNRC is estimated. In order to verify the validity of the analytical model derived in Section 2, we compare the total SE

Variations of the total EMI SE of CNRC at different wt% of the CNT and at a frequency of 8.2 GHz.
To further understand the shielding process of CNRC, we utilized HFSS simulation to analyze the magnetic field (MF) and EF distributions of CNRC while blocking EM waves, as shown in Figure 14(a)–(h). In order to make things easier, R1 and R2, which correspond to VNA ports 1 and 2, are configured to generate EF and MF excitation and receive EM signals, respectively. Figure 14(a) and (b) depict how the EF and MF are distributed in the unloaded waveguide. The generated EM waves from excitation source R1 are readily received by R2 due to the lack of a barrier and significant EF and MF distributions. However, when the conductive pallet at 1% loading of CNT is placed in the middle of the waveguide, the produced EM waves from the excitation source R1 may penetrate to this pallet and be received by R2, as seen in Figure 14(c) and (d). This low level of EM wave penetration implies that this pallet has high EM wave attenuation and shielding capacity (∼66 dB attenuation of EM waves, 99.99% attenuation of EM waves). Increasing the MWCNT loading to 3% results in a considerable reduction in the strength of EF and MF in R2, as seen in Figure 14(e) and (f).

Electric and MF intensity distribution in WR-137 waveguide at a frequency of 8.2 GHz: (a) and (b) no sample loading, (c) and (d) 1% loading of CNT, (e) and (f) 3% loading of CNT, and (g) and (h) 5% loading of CNT.
This illustrates outstanding shielding capabilities of the pallet at 3% loading of CNT. The EF and MF distributions in R2 disappear entirely when the MWCNT loading is increased to 5%, as illustrated in Figure 14(g) and (h). The MF component of the EM wave in a waveguide is very low, as illustrated in Figure 14(b), (d), (f), and (h), showing that there is very little magnetic loss in the interaction between the nanocomposites and the EM wave. As a result, conductive loss, which includes reflection and absorption, accounts for the bulk of EM wave attenuation, which agrees with experimental data.
Figure 15 illustrates the variations in SE due to absorption

EMI SE of CNRC at different wt% of CNT due to (a) absorption

Total EMI SE of CNRC at different wt% of CNT (
The SE of CNRC at different wt% and at a frequency of 8.2 GHz
| wt% of CNTs |
|
|
|
|---|---|---|---|
| 1 | 50.34 | 11.12 | 61.46 |
| 2 | 54.68 | 12.18 | 66.86 |
| 3 | 59.95 | 12.64 | 72.60 |
| 4 | 69.33 | 13.90 | 83.24 |
| 5 | 78.22 | 14.90 | 93.17 |
In order to estimate the effect of the thickness of CNRC on EMI SE, we modeled the CNRC at different levels of thickness and at a constant 3 wt% of CNTs. Figure 17 demonstrates the EMI SE properties at different thickness levels of CNRC in the C-band region. Figure 17(a) depicts that

EMI SE of CNRC at various thickness levels of nanocomposites due to (a) absorption

Mechanism of EMI absorption by different layers of CNRC.

Total EMI SE of CNRC at various thickness levels of nanocomposites (
The SE of CNRC, at various thickness levels of CNRC, and at a frequency of 8.2 GHz
| Thickness of CNRC (mm) |
|
|
|
|---|---|---|---|
| 1 | 19.98 | 12.64 | 32.63 |
| 2 | 39.96 | 12.64 | 52.61 |
| 3 | 59.95 | 12.64 | 72.60 |
| 4 | 79.93 | 12.64 | 92.58 |
| 5 | 99.92 | 12.64 | 112.57 |
In order to investigate the effect of tunneling conductivity of CNTs on the EMI SE of a CNRC, we vary the equivalent length, interphase thickness, and waviness of the CNTs. This analysis is carried out at a constant 3 wt% of CNTs in the PPy matrix. Figure 20 demonstrates

Total EMI SE of CNRC at various (a) length of CNTs, (b) interphase thickness, and (c) waviness of CNTs (
Table 4 shows the overviews of the EMI SE of different polymer nanocomposites reported by previous research and the current study. This table shows that the EMI SE of the newly developed nanocomposite is comparable to that of the
Overview of EMI SE of different polymer nanocomposites
| Nanocomposite | Thickness (mm) | Frequency (GHz) | Shielding performance (dB) | References |
|---|---|---|---|---|
| MWCNT/polyethylene | 1 | 8.2 | 50 | [87] |
| MWCNT/epoxy | 2 | 18 | 68 | [88] |
| MWCNT/PPy | 3 | 8.2 | 120.89 | [33] |
| MWCNT/polycaprolactone | 30 | 35 | 45 | [89] |
| MWCNT/polycaprolactone | 2 | 12 | 80 | [90] |
| MWCNT/polylactic acid | 0.4 | 12 | 55 | [91] |
| MWCNT/PPy | 3 | 8.2 | 93.17 | Present study |
3.3 Quantitative relative analysis of CNRC
In this section, we present the quantitative analysis of CNRC for the various wt% of CNTs at different aspect ratios, interphase thicknesses, and waviness levels. Quantitative analysis is important for selecting the optimum range of these parameters in order to achieve the maximum EC of pallets. Figure 21 demonstrates the EC enhancement factor (ECEF) with respect to wt% of CNTs. The ECEF shows the percentage enhancement of the EC of CNRC, as compared to the base nanocomposite and given by
where

Variation of ECEF with different amounts of CNTs at varying (a) length of CNTs, (b) interphase thickness, and (c) waviness of CNTs.
Figure 21(a) illustrates the variations in ECEF, with the wt% of CNT, at various aspect ratios, by varying the length and keeping the diameter of the CNTs constant. It can be observed that the value of ECEF increases as the wt% of CNT increases in the CNRC. Here, the maximum value of ECEF is observed at 3 wt%. We also observed that the value of ECEF increases as we increase the aspect ratio by varying the length of CNTs from 6 to 8
To demonstrate the enhancement in the EMI SE of the CNRC, an EMI shielding enhancement factor (ESEF) is defined. This ESEF shows the percentage improvement in EMI SE of CNRC. as compared to the base nanocomposite. Hence, ESEF can be given by:
where
Figure 22 depicts the ESEF of a CNRC in the C-band region at various concentrations of the CNTs and thickness levels of a CNRC. From Figure 22(a), it can be observed that the value of ESEF increases as the wt% of CNT increases in the CNRC. Here, the maximum value of ESEF is observed at 5 wt%. We also found that the value of ESEF increases as the frequency increases from 4.2 to 8.2 GHz. At 5 wt%, the maximum value of ESEF is 79.30%, corresponding to the frequency of 8.2 GHz. This is due to the direct dependency of EMI SE of CNRC on wt% of CNRC. The influence of CNRC thickness on ESEF is demonstrated in Figure 22(b). This figure depicts that the ESEF increases as the thickness of the CNRC and the frequency increase. The maximum value of ESEF is reported as 245%, corresponding to

Variation of ESEF in the C-band region at different (a) amounts of CNT and (b) thickness levels of CNRC.
Figure 23 illustrates the variations of ESEF of a CNRC in the C-band region at various lengths, interphase thickness levels, and waviness levels of CNTs. From Figure 23(a), it can be seen that the value of ESEF increases with an increase in the length of CNTs in the C-band. At a frequency of 8.2 GHz, the maximum values of ESEF are 1.7, 2.8, and 3.58% corresponding to the values of length 6, 7, and 8
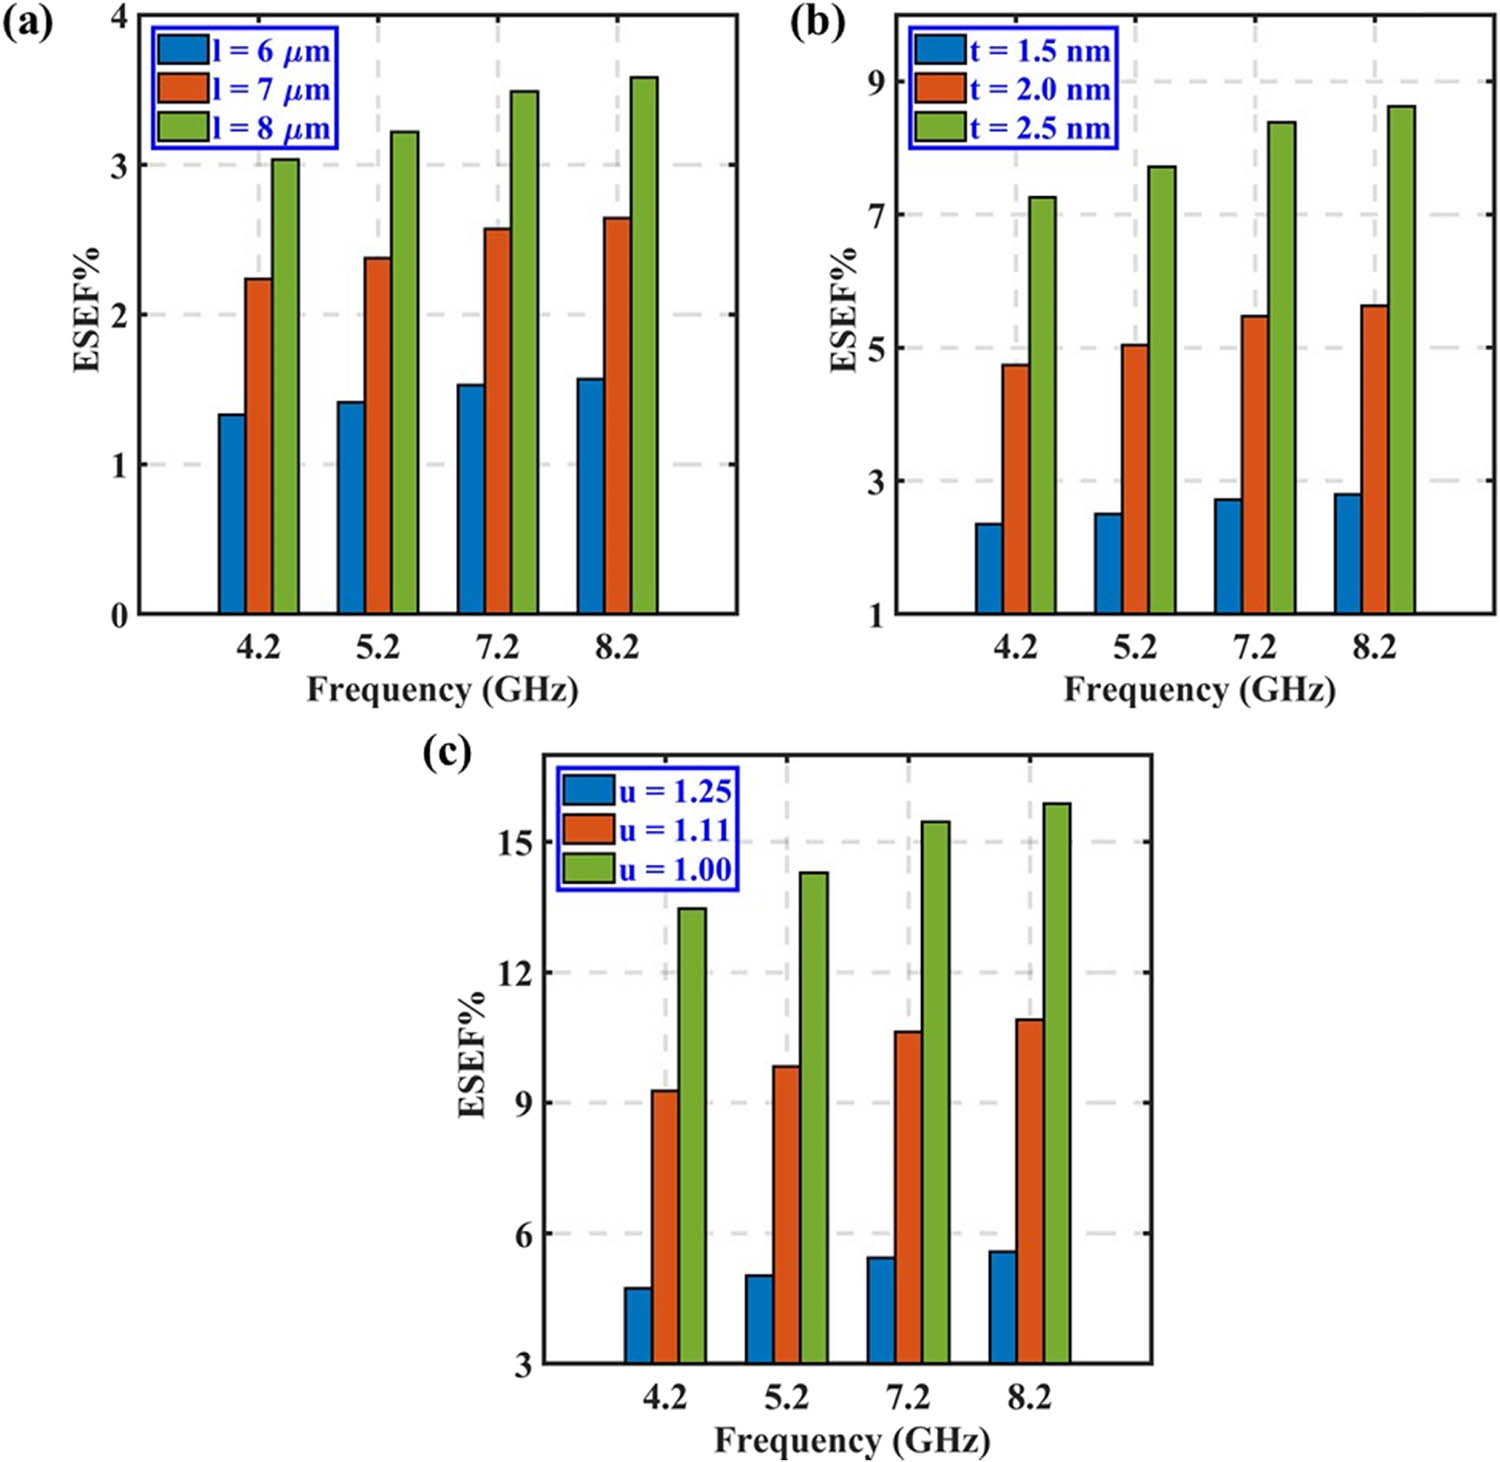
Variations of ESEF in the C-band region, at different (a) lengths of CNTs, (b) interphase thickness levels, and (c) waviness levels of CNTs.
Figures 10–23 clearly show a significant enhancement in the EMI SE of the CNRC due to the inclusion of the tunneling conductivity of CNTs. The quantitative relative performance of CNRC can be determined by two factors: (i) ECEF for the change in EC and (ii) ESEF for the change in EMI SE of CNRC. This quantitative relative performance of CNRC is shown as a bar chart in Figures 21–23. On the basis of these results, one can estimate the EMI SE by varying different parameters such as aspect ratio, interphase thickness, waviness of CNTs, thickness of nanocomposite, and the wt% of CNTs. In addition, tunneling conductivity (aspect ratio, interphase thickness, and waviness of CNT) and EMI SE significantly contribute to advancements in material design for EM shielding applications. Based on the quantitative relative analysis, the results suggest that the maximum EMI SE of a CNRC can be obtained using long and straight CNTs as well as thick interphase at a high concentration level of CNTs. This allows to develop lightweight shielding materials that can replace heavy metallic shielding materials in a specific frequency range, which depends on the required applications (e.g., satellite communications, radar, 5G networks).
4 Conclusions
In the current study, an analytical model has been proposed to evaluate the EMI SE of CNRCs in the C-band (4.2–8.2 GHz) region, accounting for the tunneling conductivity of CNTs. First, we evaluated the EC of the CNRC by incorporating the CNTs at different wt% in the PPy matrix. This EC is evaluated by considering the tunneling conductivity of the CNTs. The tunneling conductivity of CNTs is estimated by varying the aspect ratio, interphase thickness, and waviness of the CNTs in the PPy matrix. Second, the EMI SE of CNRCs is predicted for varying CNT weight percentages, tunneling conductivity of CNTs, and the thickness of the CNRC. Our outcomes indicate a significant enhancement in the EC of the CNRC, resulting from the incorporation of CNTs into the PPy matrix. Also, it is found that the EC of a CNRC increases with an increase in the aspect ratio and interphase thickness of the CNTs. However, the EC decreases with an increase in the aspect ratio of the CNTs. This indicates a clear relationship between the EC of the CNRC and the tunneling conductivity of the CNTs. It may also be concluded that the EMI SE of a CNRC is enhanced greatly with an increase in the aspect ratio, interphase thickness, and wt% of CNTs. Nevertheless, the EMI SE of the CNRC decreases with an increase in the waviness of the CNTs. It is also noted that the EMI SE of the CNRC increases with an increase in the thickness of the nanocomposite. An FE model is also being developed to confirm the analytical findings and further understand the CNRC shielding process. Our numerical findings are in good agreement with the analytic findings. Based on the quantitative analysis, it may be concluded that the optimum EC and EMI SE of a CNRC are obtained by using long, thick interphase and straight CNTs, at a high concentration level of CNTs.
Acknowledgments
The authors would like to thank the Indian Space Research Organization (ISRO), the Government of India, and the Higher Education Financing Agency (HEFA, a joint venture of MoE-GOI and Canara Bank) for providing financial support. The corresponding author acknowledges the generous support of the RESPOND Program Grant of ISRO (ISRO/RES/3/813/19-20) and the Corporate Social Responsibility Scheme of HEFA (HEFA/CSR/IITI/01/2024-25) awarded to him.
-
Funding information: The authors would like to thank the Indian Space Research Organization (ISRO), the Government of India, and the Higher Education Financing Agency (HEFA, a joint venture of MoE-GOI and Canara Bank) for providing financial support.
-
Author contributions: Rajnish P. Modanwal: data curation, formal analysis, investigation, methodology, software, validation, visualization, writing – original draft. M. Gupta: formal analysis, investigation, validation, visualization, writing – review and editing. Shailesh I. Kundalwal: conceptualization, funding acquisition, investigation, methodology, project administration, resources, supervision, writing – review and editing. All authors have accepted responsibility for the entire content of this manuscript and approved its submission.
-
Conflict of interest: Authors state no conflict of interest.
-
Data availability statement: All data generated or analyzed during this study are included in this published article.
References
[1] Raina HS. Electromagnetic compliance in high power communication satellite payloads. IETE Tech Rev. 2005;22(4):273–85.10.1080/02564602.2005.11657911Search in Google Scholar
[2] Sevgi L. Electromagnetic screening and shielding-effectiveness (SE) modeling. IEEE Antennas Propag Mag. 2009;51(1):211–6.10.1109/MAP.2009.4939074Search in Google Scholar
[3] Xiang C, Pan Y, Guo J. Electromagnetic interference shielding effectiveness of multiwalled carbon nanotube reinforced fused silica composites. Ceram Int. 2007;33(7):1293–7.10.1016/j.ceramint.2006.05.001Search in Google Scholar
[4] Saini P, Choudhary V, Singh BP, Mathur RB, Dhawan SK. Polyaniline–MWCNT nanocomposites for microwave absorption and EMI shielding. Mater Chem Phys. 2009;113(2–3):919–26.10.1016/j.matchemphys.2008.08.065Search in Google Scholar
[5] Beall C, Delzell E, Cole P, Brill I. Brain tumors among electronics industry workers. Epidemiology. 1996;7(2):125–30.10.1097/00001648-199603000-00004Search in Google Scholar PubMed
[6] Thomas TL, Stolley PD, Stemhagen A, Fontham ET, Bleecker ML, Stewart PA, et al. Brain tumor mortality risk among men with electrical and electronics jobs: a case-control study. J Natl Cancer Inst. 1987;79(2):233–8.Search in Google Scholar
[7] Darraji M, Saqban L, Mutar T, Rasheed M, Hussein A. Association of candidate genes polymorphisms in Iraqi patients with chronic kidney disease. J Adv Biotechnol Exp Ther. 2022;6(1):687.10.5455/jabet.2022.d147Search in Google Scholar
[8] Kherifi D, Keziz A, Rasheed M, Oueslati A. Thermal treatment effects on Algerian natural phosphate bioceramics: A comprehensive analysis. Ceram Int. 2024;50(17):30175–87.10.1016/j.ceramint.2024.05.317Search in Google Scholar
[9] Gupta A, Choudhary V. Electromagnetic interference shielding behavior of poly (trimethylene terephthalate)/multi-walled carbon nanotube composites. Compos Sci Technol. 2011;71(13):1563–8.10.1016/j.compscitech.2011.06.014Search in Google Scholar
[10] Al-Saleh MH, Sundararaj U. Electromagnetic interference shielding mechanisms of CNT/polymer composites. Carbon. 2009;47(7):1738–46.10.1016/j.carbon.2009.02.030Search in Google Scholar
[11] Chen YH, Huang ZH, Lu MM, Cao WQ, Yuan J, Zhang DQ, et al. 3D Fe3O4 nanocrystals decorating carbon nanotubes to tune electromagnetic properties and enhance microwave absorption capacity. J Mater Chem A. 2015;3(24):12621–5.10.1039/C5TA02782ASearch in Google Scholar
[12] Lee SH, Kang D, Oh IK. Multilayered graphene-carbon nanotube-iron oxide three-dimensional heterostructure for flexible electromagnetic interference shielding film. Carbon. 2017;111:248–57.10.1016/j.carbon.2016.10.003Search in Google Scholar
[13] Kadri E, Dhahri K, Barille R, Rasheed M. Novel method for the determination of the optical conductivity and dielectric constant of SiGe thin films using Kato-Adachi dispersion model. Phase Transit. 2021;94(2):65–76.10.1080/01411594.2020.1832224Search in Google Scholar
[14] Saidi W, Hfaidh N, Rasheed M, Girtan M, Megriche A, Maaoui ME. Effect of B2O3 addition on optical and structural properties of TiO 2 as a new blocking layer for multiple dye sensitive solar cell application (DSSC). RSC Adv. 2016;6(73):68819–26.10.1039/C6RA15060HSearch in Google Scholar
[15] Modanwal RP, Murugesan J, Sathiaraj D. Tribological and Corrosion Behaviour of Non-Equiatomic Magnetic FeCoNiMnAl High Entropy Alloy. Tribol Int. 2024;198:109903.10.1016/j.triboint.2024.109903Search in Google Scholar
[16] Kaur A, Dhawan SK. Tuning of EMI shielding properties of polypyrrole nanoparticles with surfactant concentration. Synth Met. 2012;162(15–16):1471–7.10.1016/j.synthmet.2012.05.012Search in Google Scholar
[17] Vulpe S, Nastase F, Nastase C, Stamatin I. PAN–PAni nanocomposites obtained in thermocentrifugal fields. Thin Solid Films. 2006;495(1–2):113–7.10.1016/j.tsf.2005.08.181Search in Google Scholar
[18] Alshalal I, Al-Zuhairi HM, Abtan AA, Rasheed M, Asmail MK. Characterization of wear and fatigue behavior of aluminum piston alloy using alumina nanoparticles. J Mech Behav Mater. 2023;32(1):20220280.10.1515/jmbm-2022-0280Search in Google Scholar
[19] Kadri E, Krichen M, Mohammed R, Zouari A, Khirouni K. Electrical transport mechanisms in amorphous silicon/crystalline silicon germanium heterojunction solar cell: impact of passivation layer in conversion efficiency. Opt Quantum Electron. 2016;48:1–5.10.1007/s11082-016-0812-7Search in Google Scholar
[20] Al Zubaidi FN, Asaad LM, Alshalal I, Rasheed M. The impact of zirconia nanoparticles on the mechanical characteristics of 7075 aluminum alloy. J Mech Behav Mater. 2023;32(1):20220302.10.1515/jmbm-2022-0302Search in Google Scholar
[21] Kothari R, Kundalwal SI, Sahu SK, Ray MC. Modeling of thermomechanical properties of polymeric hybrid nanocomposites. Polym Compos. 2018;39(11):4148–64.10.1002/pc.24483Search in Google Scholar
[22] Kundalwal SI. Review on micromechanics of nano‐and micro‐fiber reinforced composites. Polym Compos. 2018;39(12):4243–74.10.1002/pc.24569Search in Google Scholar
[23] Kundalwal SI, Suresh Kumar R, Ray MC. Effective thermal conductivities of a novel fuzzy fiber-reinforced composite containing wavy carbon nanotubes. J Heat Transf. 2015;137(1):012401.10.1115/1.4028762Search in Google Scholar
[24] Liu X, Yin X, Kong L, Li Q, Liu Y, Duan W, et al. Fabrication and electromagnetic interference shielding effectiveness of carbon nanotube reinforced carbon fiber/pyrolytic carbon composites. Carbon. 2014;68:501–10.10.1016/j.carbon.2013.11.027Search in Google Scholar
[25] Sellam M, Rasheed M, Azizii S, Saidani T. Improving photocatalytic performance: Creation and assessment of nanostructured SnO2 thin films, pure and with nickel doping, using spray pyrolysis. Ceram Int. 2024;50(12):20917–35.10.1016/j.ceramint.2024.03.094Search in Google Scholar
[26] Gupta M, Patil ND, Kundalwal SI. Active damping of multiscale composite shells using Sinus theory incorporated with Murakami’s zig-zag function. Thin-Walled Struct. 2023;191:111063.10.1016/j.tws.2023.111063Search in Google Scholar
[27] Gupta M, Ray MC, Patil ND, Kundalwal SI. Effect of orientation of CNTs and piezoelectric fibers on the damping performance of multiscale composite plate. J Intell Mater Syst Struct. 2023;34(2):194–216.10.1177/1045389X221099451Search in Google Scholar
[28] Modanwal RP, Sathiaraj D, Singh PK, Tyagi R, Pazhani A. Role of natural fiber-based composite on wear and friction resistance. In: Tribological aspects of additive manufacturing. United Kingdom: CRC Press; 2024. p. 76–96.10.1201/9781003400523-6Search in Google Scholar
[29] Xie A, Jiang W, Wu F, Dai X, Sun M, Wang Y, et al. Interfacial synthesis of polypyrrole microparticles for effective dissipation of electromagnetic waves. J Appl Phys. 2015;118(20):204105.10.1063/1.4936549Search in Google Scholar
[30] Pomposo JA, Rodrıguez J, Grande H. Polypyrrole-based conducting hot melt adhesives for EMI shielding applications. Synth Met. 1999;104(2):107–11.10.1016/S0379-6779(99)00061-2Search in Google Scholar
[31] Yang X, Lu Y. Preparation of polypyrrole-coated silver nanoparticles by one-step UV-induced polymerization. Mater Lett. 2005;59(19–20):2484–7.10.1016/j.matlet.2005.03.033Search in Google Scholar
[32] Ebrahimi I, Gashti MP. Polypyrrole-MWCNT-Ag composites for electromagnetic shielding: Comparison between chemical deposition and UV-reduction approaches. J Phys Chem Solids. 2018;118:80–7.10.1016/j.jpcs.2018.03.008Search in Google Scholar
[33] Gahlout P, Choudhary V. 5‐Sulfoisophthalic acid monolithium salt doped polypyrrole/multiwalled carbon nanotubes composites for EMI shielding application in X‐band (8.2–12.4 GHz). J Appl Polym Sci. 2017;134(40):45370.10.1002/app.45370Search in Google Scholar
[34] Cao MS, Song WL, Hou ZL, Wen B, Yuan J. The effects of temperature and frequency on the dielectric properties, electromagnetic interference shielding and microwave-absorption of short carbon fiber/silica composites. Carbon. 2010;48(3):788–96.10.1016/j.carbon.2009.10.028Search in Google Scholar
[35] Kundalwal SI, Rathi A. Improved mechanical and viscoelastic properties of CNT-composites fabricated using an innovative ultrasonic dual mixing technique. J Mech Behav Mater. 2020;29(1):77–85.10.1515/jmbm-2020-0008Search in Google Scholar
[36] Kundalwal SI, Ray MC. Improved thermoelastic coefficients of a novel short fuzzy fiber-reinforced composite with wavy carbon nanotubes. J Mech Mater Struct. 2014;9(1):1–25.10.2140/jomms.2014.9.1Search in Google Scholar
[37] Gupta M, Ray MC, Patil ND, Kundalwal SI. Dynamic modelling and analysis of smart carbon nanotube-based hybrid composite beams: Analytical and finite element study. Proc Inst Mech Eng Part L J Mater Des Appl. 2021;235(10):2185–206.10.1177/14644207211019773Search in Google Scholar
[38] Gupta M, Ray MC, Patil ND, Kundalwal SI. Smart damping of a simply supported laminated CNT-based hybrid composite plate using FE approach. Thin-Walled Struct. 2022;171:108782.10.1016/j.tws.2021.108782Search in Google Scholar
[39] Abbasi H, Antunes M, Velasco JI. Recent advances in carbon-based polymer nanocomposites for electromagnetic interference shielding. Prog Mater Sci. 2019;103:319–73.10.1016/j.pmatsci.2019.02.003Search in Google Scholar
[40] Dassan EG, Ab Rahman AA, Abidin MS, Akil HM. Carbon nanotube–reinforced polymer composite for electromagnetic interference application: A review. Nanotechnol Rev. 2020;9(1):768–88.10.1515/ntrev-2020-0064Search in Google Scholar
[41] Kundalwal SI, Ray MC. Micromechanical analysis of fuzzy fiber reinforced composites. Int J Mech Mater Des. 2011;7:149–66.10.1007/s10999-011-9156-4Search in Google Scholar
[42] Kundalwal SI, Ray MC, Meguid SA. Shear lag model for regularly staggered short fuzzy fiber reinforced composite. J Appl Mech Trans ASME. 2014;81(9):091001.10.1115/1.4027801Search in Google Scholar
[43] Kundalwal SI, Ray MC. Shear lag analysis of a novel short fuzzy fiber-reinforced composite. Acta Mech. 2014;225:2621–43.10.1007/s00707-014-1095-3Search in Google Scholar
[44] Rathi A, Kundalwal SI. Mechanical and fracture behavior of MWCNT/ZrO2/epoxy nanocomposite systems: Experimental and numerical study. Polym Compos. 2020;41(6):2491–507.10.1002/pc.25551Search in Google Scholar
[45] Singh PK, Modanwal RP, Kumar D. Fabrication and mechanical characterization of glass fiber/Al2O3 hybrid-epoxy composite. Sadhana. 2021;46(1):32.10.1007/s12046-020-01539-3Search in Google Scholar
[46] Keziz A, Heraiz M, Sahnoune F, Rasheed M. Characterization and mechanisms of the phase's formation evolution in sol-gel derived mullite/cordierite composite. Ceram Int. 2023;49(20):32989–3003.10.1016/j.ceramint.2023.07.275Search in Google Scholar
[47] Bouras D, Rasheed M. Comparison between CrZO and AlZO thin layers and the effect of doping on the lattice properties of zinc oxide. Opt Quantum Electron. 2022;54(12):824.10.1007/s11082-022-04161-1Search in Google Scholar
[48] Liu J, Wan M. Composites of polypyrrole with conducting and ferromagnetic behaviors. J Polym Sci A Polym Chem. 2000;38(15):2734–9.10.1002/1099-0518(20000801)38:15<2734::AID-POLA130>3.0.CO;2-RSearch in Google Scholar
[49] Grossiord N, Loos J, Van Laake L, Maugey M, Zakri C, Koning CE, et al. High‐conductivity polymer nanocomposites obtained by tailoring the characteristics of carbon nanotube fillers. Adv Funct Mater. 2008;18(20):3226–34.10.1002/adfm.200800528Search in Google Scholar
[50] Li C, Thostenson ET, Chou TW. Effect of nanotube waviness on the electrical conductivity of carbon nanotube-based composites. Compos Sci Technol. 2008;68(6):1445–52.10.1016/j.compscitech.2007.10.056Search in Google Scholar
[51] Simien D, Fagan JA, Luo W, Douglas JF, Migler K, Obrzut J. Influence of nanotube length on the optical and conductivity properties of thin single-wall carbon nanotube networks. ACS Nano. 2008;2(9):1879–84.10.1021/nn800376xSearch in Google Scholar
[52] Li C, Thostenson ET, Chou TW. Dominant role of tunneling resistance in the electrical conductivity of carbon nanotube–based composites. Appl Phys Lett. 2007;91(22):223114.10.1063/1.2819690Search in Google Scholar
[53] Keziz A, Rasheed M, Heraiz M, Sahnoune F, Latif A. Structural, morphological, dielectric properties, impedance spectroscopy and electrical modulus of sintered Al6Si2O13–Mg2Al4Si5O18 composite for electronic applications. Ceram Int. 2023;49(23):37423–34.10.1016/j.ceramint.2023.09.068Search in Google Scholar
[54] Jaber AS, Ismael M, Rashid T, Sarhan MA, Rasheed M, Sala IM. Comparesion the electrical parameters of photovoltaic cell using numerical methods. EUREKA: Phys Eng. 2023;27(4):29–39.10.21303/2461-4262.2023.002770Search in Google Scholar
[55] Bao WS, Meguid SA, Zhu ZH, Weng GJ. Tunneling resistance and its effect on the electrical conductivity of carbon nanotube nanocomposites. J Appl Phys. 2012;111(9):093726.10.1063/1.4716010Search in Google Scholar
[56] Yu Y, Song G, Sun L. Determinant role of tunneling resistance in electrical conductivity of polymer composites reinforced by well dispersed carbon nanotubes. J Appl Phys. 2010;108(8):084319.10.1063/1.3499628Search in Google Scholar
[57] Enneffatia M, Rasheed M, Louatia B, Guidaraa K, Shihab S, Barille R. Investigation of structural, morphology, optical properties and electrical transport conduction of Li0. 25Na0. 75CdVO4 compound. IOP Publishing J Phys:Conf Ser. 2021;1795:012050.10.1088/1742-6596/1795/1/012050Search in Google Scholar
[58] Assoudi N, Chaabani A, Rasheed M, Walha I, Dhahri E, Alawsi T, et al. Comparative examination of the physical parameters of the sol gel produced compounds La0. 5Ag0. 1Ca0. 4MnO3 and La0. 6Ca0. 3Ag0. 1MnO3. Opt Quantum Electron. 2022;54(9):556.10.1007/s11082-022-03927-xSearch in Google Scholar
[59] Deng F, Zheng QS. An analytical model of effective electrical conductivity of carbon nanotube composites. Appl Phys Lett. 2008;92(7):071902.10.1063/1.2857468Search in Google Scholar
[60] Feng C, Jiang L. Micromechanics modeling of the electrical conductivity of carbon nanotube (CNT)–polymer nanocomposites. Compos Part A Appl Sci Manuf. 2013;47:143–9.10.1016/j.compositesa.2012.12.008Search in Google Scholar
[61] Takeda T, Shindo Y, Kuronuma Y, Narita F. Modeling and characterization of the electrical conductivity of carbon nanotube-based polymer composites. Polymer. 2011;52(17):3852–6.10.1016/j.polymer.2011.06.046Search in Google Scholar
[62] Baxter SC, Robinson CT. Pseudo-percolation: Critical volume fractions and mechanical percolation in polymer nanocomposites. Compos Sci Technol. 2011;71(10):1273–9.10.1016/j.compscitech.2011.04.010Search in Google Scholar
[63] Rasheed M, Shihab S, Alabdali O, Rashid A, Rashid T. Finding roots of nonlinear equation for optoelectronic device. J Phys: Conf Ser. 2021;1999:012077.10.1088/1742-6596/1999/1/012077Search in Google Scholar
[64] Rasheed M, Mohammed OY, Shihab S, Al-Adili A. Explicit numerical model of solar cells to determine current and voltage. J Phys: Conf Ser. 2021;1795:012043.10.1088/1742-6596/1795/1/012043Search in Google Scholar
[65] Dubey P, Gupta M, Pritesh VB, Kundalwal S. Carbon nanotube–based nanocomposite for effective electromagnetic interference shielding in aerospace applications: A finite element study. Finite element analysis of polymers and composites. United States: Woodhead Publishing; 2024. p. 569–97.10.1016/B978-0-443-14087-7.00025-2Search in Google Scholar
[66] Dubey P, Gupta M, Kundalwal SI. Influence of thickness parameter on the EMI shielding effectiveness of CBNC in C-band: A numerical study. Mater Today Proc. 2024;114:7–11.10.1016/j.matpr.2024.05.103Search in Google Scholar
[67] Dubey P, Gupta M, Kundalwal SI. Conductive polymer nanocomposite incorporated with carbon nanotubes for effective electromagnetic interference shielding: A numerical study. Polym Compos. 2024;45(4):3576–90.10.1002/pc.28011Search in Google Scholar
[68] Rohini R, Bose S. Electromagnetic interference shielding materials derived from gelation of multiwall carbon nanotubes in polystyrene/poly (methyl methacrylate) blends. ACS Appl Mater Interfaces. 2014;6(14):11302–10.10.1021/am502641hSearch in Google Scholar PubMed
[69] Singh P, Kumari R. Monopole patch antenna for C band applications. In TEQIP III Sponsored International Conference on Microwave Integrated Circuits, Photonics and Wireless Networks (IMICPW). IEEE; 2019. p. 333–6.10.1109/IMICPW.2019.8933180Search in Google Scholar
[70] Rasheed M, Alabdali O, Shihab S, Rashid A, Rashid T. On the solution of nonlinear equation for photovoltaic cell using new iterative algorithms. J Phys: Conf Ser.2021:1999;012078.10.1088/1742-6596/1999/1/012078Search in Google Scholar
[71] Rasheed M, Al-Darraji MN, Shihab S, Rashid A, Rashid T. The numerical calculations of single-diode solar cell modeling parameters. J Phys: Conf Ser. 2021;1963:012058.10.1088/1742-6596/1963/1/012058Search in Google Scholar
[72] Alabdali O, Shihab S, Rasheed M, Rashid T. Orthogonal Boubaker-Turki polynomials algorithm for problems arising in engineering. In AIP Conference Proceedings. USA: AIP publishing; 2022. p. 050019.10.1063/5.0066860Search in Google Scholar
[73] Ryvkina N, Tchmutin I, Vilcakova J, Peliskova M, Saha P. The deformation behavior of conductivity in composites where charge carrier transport is by tunneling: theoretical modeling and experimental results. Synth Met. 2005;148(2):141–6.10.1016/j.synthmet.2004.09.028Search in Google Scholar
[74] Wernik JM, Meguid SA. Recent developments in multifunctional nanocomposites using carbon nanotubes. Appl Mech Rev. 2010;63(5):050801.10.1115/1.4003503Search in Google Scholar
[75] Taherian R. Experimental and analytical model for the electrical conductivity of polymer-based nanocomposites. Compos Sci Technol. 2016;123:17–31.10.1016/j.compscitech.2015.11.029Search in Google Scholar
[76] Berhan L, Sastry AM. Modeling percolation in high-aspect-ratio fiber systems. I. Soft-core versus hard-core models. Phys Rev E - Stat Nonlinear, Soft Matter Phys. 2007;75(4):041120.10.1103/PhysRevE.75.041120Search in Google Scholar PubMed
[77] Rathi A, Kundalwal SI. Synergistic effect of ultrasonically assisted exfoliated MWCNTs by ZrO2 nanoparticles on thermo-mechanical and anti-corrosive properties of epoxy nanocomposites. J Compos Mater. 2022;56(11):1633–49.10.1177/00219983221084770Search in Google Scholar
[78] Zare Y, Rhee KY. A simple methodology to predict the tunneling conductivity of polymer/CNT nanocomposites by the roles of tunneling distance, interphase and CNT waviness. RSC Adv. 2017;7(55):34912–21.10.1039/C7RA04034BSearch in Google Scholar
[79] Wang Y, Weng GJ. Electrical conductivity of carbon nanotube-and graphene-based nanocomposites. Micromech Nanomech Compos Solids. 2018;123–56.10.1007/978-3-319-52794-9_4Search in Google Scholar
[80] Tokito S, Tsutsui T, Saito S. Morphology and conductivity of polypyrrole containing halogen counter anions. Chem Lett. 1985;14(4):531–4.10.1246/cl.1985.531Search in Google Scholar
[81] Shi DL, Feng XQ, Huang YY, Hwang KC, Gao H. The effect of nanotube waviness and agglomeration on the elastic property of carbon nanotube-reinforced composites. J Eng Mater Technol. 2004;126(3):250–7.10.1115/1.1751182Search in Google Scholar
[82] Rafiee R. Influence of carbon nanotube waviness on the stiffness reduction of CNT/polymer composites. Compos Struct. 2013;97:304–9.10.1016/j.compstruct.2012.10.028Search in Google Scholar
[83] Lu X, Zhang W, Wang C, Wen TC, Wei Y. One-dimensional conducting polymer nanocomposites: Synthesis, properties and applications. Prog Polym Sci. 2011;36(5):671–712.10.1016/j.progpolymsci.2010.07.010Search in Google Scholar
[84] Lapinsky SE, Easty AC. Electromagnetic interference in critical care. J Crit Care. 2006;21(3):267–70.10.1016/j.jcrc.2006.03.010Search in Google Scholar PubMed
[85] Mirmohammadi SA, Sadjadi S, Bahri-Laleh N. Electrical and electromagnetic properties of CNT/polymer composites. In Carbon nanotube-reinforced polymers. Netherlands: Elsevier; 2018. p. 233–58.10.1016/B978-0-323-48221-9.00010-8Search in Google Scholar
[86] Jana PB, Mallick AK, De SK. Effects of sample thickness and fiber aspect ratio on EMI shielding effectiveness of carbon fiber filled polychloroprene composites in the X-band frequency range. IEEE Trans Electromagn Compat. 1992;34(4):478–81.10.1109/15.179281Search in Google Scholar
[87] Al-Saleh MH. Influence of conductive network structure on the EMI shielding and electrical percolation of carbon nanotube/polymer nanocomposites. Synth Met. 2015;205:78–84.10.1016/j.synthmet.2015.03.032Search in Google Scholar
[88] Xu Y, Li Y, Hua W, Zhang A, Bao J. Light-weight silver plating foam and carbon nanotube hybridized epoxy composite foams with exceptional conductivity and electromagnetic shielding property. ACS Appl Mater Interfaces. 2016;8(36):24131–42.10.1021/acsami.6b08325Search in Google Scholar PubMed
[89] Thomassin JM, Jerome R, Detrembleur C, Molenberg I, Huynen I. Polymer/carbon nanotube composites for electromagnetic interference reduction. In Physical properties and applications of polymer nanocomposites. Woodhead Publishing; 2010. p. 563–87.10.1533/9780857090249.3.563Search in Google Scholar
[90] Thomassin JM, Pagnoulle C, Bednarz L, Huynen I, Jerome R, Detrembleur C. Foams of polycaprolactone/MWNT nanocomposites for efficient EMI reduction. J Mater Chem. 2008;18(7):792–6.10.1039/b709864bSearch in Google Scholar
[91] Chizari K, Arjmand M, Liu Z, Sundararaj U, Therriault D. Three-dimensional printing of highly conductive polymer nanocomposites for EMI shielding applications. Mater Today Commun. 2017;11:112–8.10.1016/j.mtcomm.2017.02.006Search in Google Scholar
© 2025 the author(s), published by De Gruyter
This work is licensed under the Creative Commons Attribution 4.0 International License.
Articles in the same Issue
- Research Articles
- Probing microstructural evolution and surface hardening of AISI D3 steel after multistage heat treatment: An experimental and numerical analysis
- Activation energy of lime cement containing pozzolanic materials
- Optimizing surface quality in PMEDM using SiC powder material by combined solution response surface methodology – Adaptive neuro fuzzy inference system
- Experimental study of the mechanical shear behaviour of steel rebar connectors in timber–concrete structure with leafy wood species
- Development of structural grade lightweight geopolymer concrete using eco-friendly materials
- An experimental approach for the determination of the physical and mechanical properties of a sustainable geopolymer mortar made with Algerian ground-granulated blast furnace slag
- Effect of using different backing plate materials in autogenous TIG welding on bead geometry, microhardness, tensile strength, and fracture of 1020 low carbon steel
- Uncertainty analysis of bending response of flexoelectric nanocomposite plate
- Leveraging normal distribution and fuzzy S-function approaches for solar cell electrical characteristic optimization
- Effect of medium-density fiberboard sawdust content on the dynamic and mechanical properties of epoxy-based composite
- Mechanical properties of high-strength cement mortar including silica fume and reinforced with single and hybrid fibers
- Study the effective factors on the industrial hardfacing for low carbon steel based on Taguchi method
- Analysis of the combined effects of preheating and welding wire feed rates on the FCAW bead geometric characteristics of 1020 steel using fuzzy logic-based prediction models
- Effect of partially replacing crushed oyster shell as fine aggregate on the shear behavior of short RC beams using GFRP rebar strengthened with TRC: Experimental and numerical studies
- Micromechanic models for manufacturing quality prediction of cantula fiber-reinforced nHA/magnesium/shellac as biomaterial composites
- Numerical simulations of the influence of thermal cycling parameters on the mechanical response of SAC305 interconnects
- Impact of nanoparticles on the performance of metakaolin-based geopolymer composites
- Enhancing mechanical and thermal properties of epoxy-based polymer matrix composites through hybrid reinforcement with carbon, glass and steel
- Prevention of crack kinetic development in a damaged rod exposed to an aggressive environment
- Ideal strain gauge location for evaluating stress intensity factor in edge-cracked aluminum plates
- Experimental and multiscale numerical analysis of elastic mechanical properties and failure in woven fabric E-glass/polyester composites
- Optimizing piezoelectric patch placement for active repair of center-cracked plates
- Experimental investigation on the transverse crushing performance of 3D printed polymer composite filled aluminium tubes
- Review Articles
- Advancing asphaltic rail tracks: Bridging knowledge gaps and challenges for sustainable railway infrastructure
- Chemical stabilization techniques for clay soil: A comprehensive review
- Development and current milestone of train braking system based on failure phenomenon and accident case
- Rapid Communication
- The role of turbulence in bottom-up nanoparticle synthesis using ultrafast laser filamentation in ethanol
- Special Issue on Deformation and Fracture of Advanced High Temperature Materials - Part II
- Effect of parameters on thermal stress in transpiration cooling of leading-edge with layered gradient
- Development of a piezo actuator-based fatigue testing machine for miniature specimens and validation of size effects on fatigue properties
- Development of a 1,000°C class creep testing machine for ultraminiature specimens and feasibility verification
- Special Issue on Advances in Processing, Characterization and Sustainability of Modern Materials - Part II
- Surface integrity studies in microhole drilling of Titanium Beta-C alloy using microEDM
- Experimental investigation on bacterial concrete by using Cantabro loss and UPV
- Influence of gas nitriding on the surface layer of M50 NiL steel for aerospace-bearing applications
- Experimental investigation on the spectral, mechanical, and thermal behaviors of thermoplastic starch and de-laminated talc-filled sustainable bio-nanocomposite of polypropylene
- Synthesis and characterization of sustainable hybrid bio-nanocomposite of starch and polypropylene for electrical engineering applications
- Microstructural and mechanical characterization of Al6061-ZrB2 nanocomposites fabricated by powder metallurgy
- Effect of edge preparation on hardness and corrosion behaviour of AA6061-T651 friction stir welds
- Mechanical improvement in acetal composites reinforced with graphene nanotubes and Teflon fibers using loss functions
- Experimental investigation on the mechanical properties of aluminum-based metal matrix composites by the squeeze casting method
- Investigation on punch force–displacement and thickness changes in the shallow drawing of AA2014 aluminium alloy sheets using finite element simulations
- Influence of liquid nitriding on the surface layer of M50 NiL steel for bearing applications
- Mechanical and tribological analyses of Al6061-GO/CNT hybrid nanocomposites by combined vacuum-assisted and ultrasonicated stir casting method
- Strengthening of structures with bacterial concrete for effective crack repair and durability enhancement
- Unique approaches in developing novel nano-composites: Evaluating their mechanical and tribological characteristics
- Load-carrying capacity of highly compact rigid deployable booms
- Investigating the influence of SiC and B4C reinforcements on the mechanical and microstructural properties of stir-casted magnesium hybrid composites
- Evaluation of mechanical and performance characteristics of bitumen mixture using waste septage ash as partial substitute
- Mechanical characterization of carbon/Kevlar hybrid woven 3D composites
- Development of a 3D-printed cervical collar using biocompatible and sustainable polylactic acid
- Mechanical characterization of walnut shell powder-reinforced neem shell liquid composite
- Special Issue on Structure-energy Collaboration towards Sustainability Societies
- Effect of tunneling conductivity of CNTs on the EMI shielding effectiveness of nanocomposite in the C-band
- Evaluation of the effect of material selection and core geometry in thin-walled sandwich structures due to compressive strength using a finite element method
- Special Issue on Sustainability and Development in Civil Engineering - Part III
- The optimum reinforcement length for ring footing resting on sandy soils resisting inclined load
- Special Issue on Advanced Materials in Industry 4.0
- Cross-dataset evaluation of deep learning models for crack classification in structural surfaces
- Mechanical and antibacterial characteristics of a 3D-printed nano-titanium dioxide–hydroxyapatite dental resin-based composite