Effect of parameters on thermal stress in transpiration cooling of leading-edge with layered gradient
-
Weijie Chen


Abstract
Transpiration cooling is an efficient thermal protection technique for the leading-edge of hypersonic aircraft. However, the local overheating of the transpiration cooling structure is prone to the defect of heat transfer deterioration, which seriously affects the life of the aircraft. In this study, a transpiration cooling of leading-edge with layered gradient (TCS-LG3) is proposed to improve the uniform temperature distribution and high thermal stress. The thermal–structure coupling mechanism of TCS-LG3 is analyzed using the computational fluid dynamics and orthogonal experimental. The results show that, compared with traditional transpiration cooling structure of leading-edge, the cooling performance (ξ) of TCS-LG3 is increased by 34.59−40.55%. The degrees that influence the average cooling efficiency (η ave) and maximum principal stress (σ max, principal) of TCS-LG3 are identified as the top-layer diameter of porous medium and length of the porous medium, respectively. The optimal η ave increased to 0.9196%, while the σ max, principal decreased by 18.51%. The research results offer a reference for further analysis of the material selection and structure optimization in the transpiration cooling.
1 Introduction
With the continuous increase in the Mach number of hypersonic aircraft, the maximum heat flux at the leading-edge has exceeded 10 MW/m2. Consequently, traditional passive thermal protection technology has become insufficient to handle such a high thermal load, necessitating a shift toward active cooling technologies for hypersonic aircraft [1]. Among these, transpiration cooling has emerged as an efficient active thermal protection method. It works by transporting coolant to the hot surface of porous medium, forming a low-temperature gas film that shields the surface from the thermal impact of high-temperature fluid. This technology has been successfully applied in various critical components of aircraft, including leading-edge, engine combustor walls, and gas turbine blades, due to its high cooling efficiency (η), effective converging performance, and minimal coolant consumption [2,3]. Despite its advantages, transpiration cooling technology faces significant challenges, particularly concerning the non-uniform temperature distribution within the porous medium, caused by direct contact between the hot surface and the high-temperature fluid. This leads to heat transfer deterioration over time and creates substantial temperature gradients within the porous medium, resulting in thermal stress that can potentially cause structural failure [4,5]. The specific gap this research aims to address is the lack of a comprehensive understanding of how to improve the uniformity of temperature distribution and mitigate internal thermal stress within the transpiration cooling structure of leading-edge (TCS).
Previous studies have focused on enhancing the cooling performance (ξ) and optimizing the matrix structure of the porous medium [6]. Given the extreme conditions faced by hypersonic vehicles, characterized by prolonged flight durations and intense heat flux, the thermal protection technology of TCS encounters significant challenges. Consequently, most TCS rely on gas and liquid coolants, while the complex packaging techniques required for solid coolant restrict its effective application [7]. Langener et al. [8] investigated transpiration cooling η using various gaseous cooling media at blow ratios of 0−1% under hypersonic experimental conditions, and found that the η was mainly influenced by the specific heat capacity of coolant. Luo et al. [9] simulated different gaseous coolants on a double-layer transpiration cooling system, revealing that lower-density coolants showed superior cooling effect at identical mass flow rate, while higher-density ones demonstrated better performance at the same velocity. Yang et al. [10] researched the influence of varying mainstream pressure gradients on the uniformity of gas coolants through numerical simulation, and it is observed that increasing the gradients suppressed coolant non-uniformity, improving η from 0.74 to 0.84. Dong et al. [11] analyzed the heat transfer deterioration phenomena caused by steam blockage of transpiration cooling, and the porous medium structures with high porosity and low thermal conductivity were more susceptible to heat transfer deterioration. Qian et al. [12] conducted a transpiration cooling experiment utilizing hydrogel as a coolant; compared to liquid water, hydrogel extended the thermal protection duration by 30−35% and provided a more uniform cooling effect to the hot surface. He et al. [13] compared the effects of injection methods on the phase change transpiration cooling via numerical simulation, and the fixed-flow injection enhanced the stability of the phase change interface and cooling effect.
The focus on the matrix structures of porous medium within TCS primarily centers on two aspects. On the one hand, research focusing on heat transfer uniformity in relatively simple flat plate geometries. Liu et al. [14] experimentally studied the plates with different particles and discovered that smaller particles enhanced convective heat transfer and improved the uniformity of temperature distribution, increasing η to 0.85. Huang and He [15] explored the influence of non-uniform porosity distribution on temperature distribution uniformity, noting solid thermal conductivity effectively weakened non-uniform effects. Chen et al. [16] simulated plate transpiration cooling to analyze heat transfer deterioration, finding that porous medium thickness had the most significant impact, improving temperature uniformity by 52.33−66.14% through response surface optimization. Sun et al. [17] analyzed the effect of pore diameter on the uniformity of temperature distribution and cooling efficiency, observing increased pore diameter reduced uniformity, while non-uniform coolant distribution improved efficiency and uniformity. On the other hand, research targeting heat transfer uniformity in complex geometries, such as aircraft leading-edge structures, has also been explored. Wu et al. [18] devised uneven porous medium to regulate coolant distribution in the leading-edge, improving local permeability and temperature distribution uniformity. Under similar conditions, η increased from 0.16 to 0.26 compared to uniform porosity. He et al. [19] conducted numerical simulations on three-dimensional leading-edge structures; discovering gradient porosity arrangement and separated cooling cavities improved coolant distribution and formed a uniform protective gas film. Ding et al. [20] proposed a novel combined cooling technology for thermal protection of wedge-shaped leading-edges, reducing leading-edge stagnation point temperature by 66.9% and lowering structural thermal stress. Liu et al. [21] applied a leading-edge structure with gradient porosity to enhance temperature distribution uniformity; this structure improved stagnation point η by 8.77% and reduced injection pressure (P c) by 10.31%.
Due to the intense compression and friction of air around a hypersonic vehicle, particularly in the leading-edge stagnation region, aerodynamic heating caused by shock waves becomes more pronounced [22]. Under these harsh conditions, the non-uniform distribution of coolant exacerbates the temperature gradient in the porous medium, leading to increased thermal stress [23]. Additionally, the mismatch in mechanical properties between the solid phase of porous medium and solid materials makes the leading-edge highly susceptible to thermal stress. Therefore, while increasing ξ, it is crucial to further improve the thermal stress distribution in the TCS. Skamniotis and Cocks [24] investigated the impact of geometric features in double-wall TCS on thermal stress, finding that reducing the spacing of double walls and optimizing inner wall thickness could minimize critical thermal stress. Li et al. [25] simulated the effect of 30–90° film hole angles on the thermal stress distribution in an impinge-TCS and indicated that increasing the film hole angle could effectively decrease the temperature gradient, thereby reducing stress concentration in the structure. Liu et al. [26] discovered that the coolant cracking reactions improve the heat dispersion of the coolant in porous medium, reducing thermal stress in regions with uneven temperature distribution. Yang et al. [27] explored the relationship between the permeability and thermal stress in TCS, finding that both the maximum temperature and thermal stress are distributed along the direction of decreasing permeability, with variations in their distributions due to the effect of the temperature gradient.
Most studies had concentrated on enhancing the design of coolant and matrix structures in transpiration cooling to mitigate heat transfer deterioration and enhance cooling efficiency. However, alongside efficiency improvements, considerations for the structural strength of TCS are essential. There is a need to investigate the distribution law of thermal stress during the cooling process and enhance the stability of transpiration cooling thermal protection technology. Previous studies had demonstrated that gradient porosity structure design effectively enhances uniformity of temperature distribution at the hot surface [19,21,28]. Based upon this, this study proposes a novel transpiration cooling structure of leading-edge with layered gradient (TCS-LG). Qualitative and quantitative analyses of temperature and stress field distribution in the TCS are conducted using thermal–structure coupling, revealing the mechanisms of internal flow and heat transfer as well as the causes of thermal stress in various regions. Furthermore, the effects of different structural parameters on temperature and stress fields are investigated using orthogonal experiments, elucidating variations in the performance of TCS induced by different structural parameters. The conclusions drawn from this research offer theoretical and empirical support for the design of thermal protection and structural strength in TCS.
2 Numerical model and method
2.1 Numerical model
To address the uniformity of temperature and thermal stress distribution at the leading-edge of hypersonic vehicles, a transpiration cooling structure of leading-edge with layered gradient (TCS-LG3) is proposed, where 3 represents the three layers of porous medium. Considering symmetry of the numerical model, a quarter of the computing domain is selected for simplifying calculations, as depicted in Figure 1(a). The three-dimensional model is comprised of four main parts: the porous medium, mainstream high-temperature, solid, and cooling chamber regions. The radius of the TCS-LG3 is 6 mm, with an inner cone angle of 16° and a thickness of 4.5 mm, totaling 8 mm in the X-direction, as shown in Figure 1(b). To maintain shock wave formation and avoid cross-flow limitations, the length of the mainstream high-temperature region is extended to 120 mm in the Y-direction, 75 mm in the X-direction from the stagnation point, and 155 mm in the Z-direction. Porosity in the porous medium region increases successively toward the mainstream high-temperature region, ranging from 0.2 to 0.4, with traditional transpiration cooling structure of leading-edge (TCS-T) having a porosity size of 0.2 [16,19]. Ultra-high-temperature ceramic (ZrB2-SiC) is utilized for each solid-phase layer, enhancing the high-temperature resistance and load-bearing capacity of the TCS-LG3. Under the influence of P c in the cooling chamber, the coolant is sequentially passed through the bottom, middle, and top layers of the porous medium. The small porosity in the bottom and middle layers ensures a more uniform distribution of coolant at a fixed mass flow rate. The top layer, with the largest porosity, allows for full heat exchange with the top layer of porous medium, thereby forming a uniform cooling gas film. This reduces the heat flux from the mainstream high-temperature region and achieves effective thermal protection for the TCS.

Numerical model of TCS-LG3. (a) Three-dimensional computing domain. (b) Two-dimensional symmetry plane.
In this study, four different TCS models are employed for numerical simulation to analyze the cooling performance and their effects on the temperature and stress fields. These models are defined as follows:
Case 1: A traditional single-layer TCS (TCS-T), where the entire layer is composed of a porous medium with a porosity of 0.2 and an average particle diameter of 8 × 10⁻⁵ m.
Case 2: A double-layer TCS (TCS-LG2-case 2), where the bottom layer comprises a porous medium with a porosity of 0.2 and an average particle diameter of 8 × 10⁻⁵ m, while the top layer has a porosity of 0.3 and an average particle diameter of 10 × 10−5 m.
Case 3: A double-layer TCS (TCS-LG2-case 3), similar to Case 2, but with the top layer having a porosity of 0.4 and an average particle diameter of 12 × 10−5 m.
Case 4: A three-layer TCS (TCS-LG3), where the bottom, middle, and top layers have porosities of 0.2, 0.3, and 0.4, with corresponding average particle diameters of 8 × 10⁻⁵ m, 10 × 10−5 m, and 12 × 10−5 m, respectively.
2.2 Governing equation
The flow in the mainstream high-temperature region and the cooling chamber region is considered turbulent, described using the shear stress transport (SST) k-w turbulence model to ensure more accurate results for hypersonic boundary-layer turbulent flow [29,30]. In contrast, the flow within the porous medium is assumed to be laminar due to its complex porosity and relatively low permeability. This laminar flow assumption is essential for maintaining numerical stability and accurately modeling the heat transfer and flow characteristics. It is based on the fact that the porous medium significantly reduces the fluid velocity, resulting in a Reynolds number that falls below the critical value of 2,220, as indicated by Sarpkaya [31]. Additionally, the Forchheimer–Brinkman-modified equation, derived from Darcy’s law, is utilized to model flow in the porous medium [32]. This approach accounts for both inertial and viscous effects in low-permeability materials, suppressing velocity fluctuations within and ensuring a stable flow distribution. Furthermore, the relatively small porosity size, with a specific surface area of at least 3.5 × 10⁴ m−1, ensures adequate heat transfer between the fluid and solid phases, justifying the use of local thermal equilibrium to describe the heat transfer phenomenon within the porous medium [33]. Heat conduction in the solid region follows Fourier’s law. The thermal stress of the TCS is calculated using thermal–structure coupling equations, which incorporate both temperature and stress fields [34]. The governing equations for various calculation domains are presented in Eqs. (1)–(11).
2.2.1 Temperature field
2.2.1.1 Mainstream high-temperature region and the coolant chamber region
Continuity equation
Momentum equation
Energy equation
where ρ
f denotes the fluid density (kg/m3),
2.2.1.2 Porous medium region
Continuity equation
Momentum equation
Energy equation
where γ
d denotes the porosity of the porous medium, and
2.2.1.3 Species mixing
where Y i represents the component mass fraction, and ψ i refers to the mass diffusion flux of the fluid (kg/(m2 s)).
2.2.1.4 Solid region
Energy equation
where T s stands for the temperature of the solid phase (K).
2.2.2 Stress field
2.2.2.1 Stress and total strain
where {σ} represents stress (MPa); [D] denotes the elastic stiffness matrix; and {ε} and {ε}ΔT correspond to strain and thermal strain. The coefficients of thermal expansion in the X, Y, and Z directions are denoted by α x , α y , and α z (K−1), respectively.
2.2.2.2 Fluid–solid interface (conservation principle)
where n represents the normal vector, and the subscripts f and s denote the fluid and solid, respectively. According to the principle of conservation on the coupling surface between fluid and solid [36], the stress σ, displacement d (mm), heat flux q (W/m2), and temperature T (K) are consistent between the fluid and solid.
The solid phase of the porous medium comprises ZrB2-SiC, with a density of 5,330 kg/m3 and a thermal expansion coefficient of 7.16 × 10⁻⁶ K−1 [37]. The thermal expansion coefficient of the dense material is assumed to represent the entire porous medium [38]. The specific heat capacity and thermal conductivity are temperature dependent, as shown in Eqs. (12) and (13):
where c p,s represents the specific heat capacity of solid material (J/(kg K)).
Due to the varying porosity in the porous medium region of the TCS-LG3, the effective Young’s modulus (E eff) and Poisson’s ratio (ν eff) for each layer are determined using Eqs. (14) and (15) [39,40], as summarized in Table 1:
where E 0 stands for Young’s modulus of dense materials (GPa); ν 0 represents Poisson’s ratio of dense materials.
Physical property of material
| Name | E eff/(GPa) | ν eff | |
|---|---|---|---|
| 298 K | 2,273 K | ||
| Porous medium 1 (
|
217.395 | 0.8 | 0.186 |
| Porous medium 2 (
|
148.717 | 0.542 | 0.2 |
| Porous medium 3 (
|
98.745 | 0.36 | 0.211 |
2.3 Boundary conditions and meshing
During the temperature field analysis, a hypersonic vehicle with Mach number 7 was simulated flying in the mainstream high-temperature region at an altitude of 21 km in the atmosphere [41]. At the inlet, a pressure far-field boundary condition was applied, while a pressure outlet boundary condition was employed at the outlet. The fluid in the mainstream high-temperature region was treated as an ideal gas, exhibiting significant changes with temperature, and viscosity was determined using Sutherland’s law. Other physical property parameters were adjusted using temperature polynomial fitting, as shown in Eqs. (16) and (17), and the R-square of polynomial fitting was 0.99989 and 0.99994, respectively.
For the cooling chamber inlet, a mass flow inlet boundary condition (F = 1–4%) is used, with nitrogen as the coolant and an inlet temperature of 300 K, where F represents the coolant injection ratio, expressed as shown in Eq. (18) [42]:
where
Internal surface boundary conditions were applied at the interfaces between different fluid regions, while coupled surface boundary conditions were used at the interfaces between fluid and solid regions. Symmetric boundary conditions were assigned to the walls of the symmetric region, while adiabatic no-slip boundary conditions were set for the remaining walls. A coupled algorithm was employed for the pressure–velocity coupling scheme, with the spatial discretization of pressure utilizing a second-order upwind format. The momentum, energy, and species mixing equations were discretized using the QUICK upwind scheme to ensure both stability and accuracy in the numerical calculations. The convergence residual for the continuity, momentum, and species mixing equations was set to 10−4, while the convergence residual for the energy equation was set to 10−6.
In the stress field analysis, the temperature and heat flux distributions obtained from ANSYS FLUENT were transferred as input loads to the solid structure region via the coupling surface to calculate the stress field. To investigate the impact of non-uniform temperature distribution on thermal stress, rigid body motion suppression boundary conditions are employed to restrict the displacements of both the internal and external surfaces of the aircraft within the numerical model. This implies that the numerical model assumes the aircraft cannot freely move or rotate.
Due to the complexity of the TCS-LG3, FLUENT MESHING was utilized in this study to partition the grid, ensuring the quality and orthogonality of the generated grid. To accurately capture the shape of shock waves in the temperature field, boundary-layer refinement was applied to the grid near the wall, satisfying the dimensionless distance (y+) less than 1 near the wall. This refinement not only enhances the resolution of the shock wave, but also ensures a smooth transition of the fluid from laminar to turbulent flow. The local schematic diagram of boundary-layer refinement is illustrated in Figure 2(a). To assess the grid division accuracy, this study conducted an independence verification of the computational fluid dynamics analysis grids with grid numbers ranging from 0.98 million to 3 million, as depicted in Figure 2(b). Considering computational efficiency, time consumption, and the results of grid independence verification, a mesh number of 1.99 million (with a grid size of 1.7 mm) was determined for subsequent numerical calculations. Compared to the 1.51 million grids, the deviation of the average temperature at the hot surface and the coolant injection pressure was less than 1%.

Schematic diagram of boundary conditions and local grid: (a) boundary conditions for temperature field and (b) grid independence verification.
2.4 Numerical calculation verification
As the numerical simulation result of the temperature field serves as the input load for stress field analysis, it is crucial to verify the accuracy of the numerical simulation method for the temperature field. Shen et al. [43] conducted a heating experiment on the leading-edge, which was made of high-temperature nickel-based alloy (Ma = 4.2, T 0 = 1,385 K), to measure the temperature distribution. In this study, a numerical model with identical dimensions was established (leading-edge radius of 3 mm, leading-edge angle of 14°, and total length of 114 mm). Three turbulence models, SST k-w, Realizable k-ε, and S-A, were employed to validate the accuracy of the numerical simulation results for the external thermal environment of the leading-edge. As depicted in Figure 3(a), except for the temperature at the stagnation point, the numerical results obtained using the SST k-w turbulence model are in excellent agreement with the experimental findings, with a maximum error of less than 1%. The notable deviation between the simulated and experimental values at the stagnation point can be attributed to the boundary layer’s frictional deceleration under hypersonic condition. This phenomenon results in the conversion of kinetic energy into internal energy, generating a temperature gradient and facilitating heat transfer. Consequently, the adiabatic wall recovery temperature (T aw) at the stagnation point does not reach the total temperature (T 0).
![Figure 3
Numerical simulation method verification: (a) comparison between simulated values and Shen’s et al.’s experimental results [43] and (b) comparison of simulated values and Wu’s et al.’s experimental results [18].](/document/doi/10.1515/jmbm-2024-0027/asset/graphic/j_jmbm-2024-0027_fig_003.jpg)
In addition to verifying the accuracy of the leading-edge thermal environment simulation method, it is crucial to consider the impact of the flow field on the temperature distribution during the transpiration cooling process. Wu et al. [18] conducted an experimental study on the transpiration cooling using a discontinuous porous material made from 316 L stainless steel, with a mainstream Reynolds number of 16160 and an injection ratio of F = 0.67%. The numerical simulation method applied in this study was compared with Wu et al.’s [18] experimental results to validate the temperature distribution caused by fluid flow through the porous discontinuity layer, as shown in Figure 3(b). The numerical results, obtained using the SST k-ω turbulence model, closely matched the experimental data, with a maximum deviation of less than ±2.5%. This indicates that the SST k-ω model can effectively capture the variations in temperature distribution caused by fluid passing through the discontinuous porous medium region. Therefore, the accuracy of the numerical simulation method for both flow and temperature fields is validated to some extent.
3 Results and analysis
3.1 Qualitative analysis of temperature field and stress field
To evaluate the effects of the TCS-LG on temperature and stress fields, a qualitative analysis is carried out using the four numerical models described in Section 2.1 (Table 2). These models, ranging from single-layer to multi-layer configurations, are assessed in terms of their influence on temperature distribution and stress field variations.
Model definition
| Model number | Description | Porosity distribution |
|---|---|---|
| Case 1 | TCS-T: 1 layer | γ d,1 = 0.2, a d,1 = 8 × 10⁻⁵ m |
| Case 2 | TCS-LG2: 2 layers | γ d,1 = 0.2, a d,1 = 8 × 10⁻⁵ m, γ d,2 = 0.3, a d,2 = 10 × 10−5 m |
| Case 3 | TCS-LG2: 2 layers | γ d,1 = 0.2, a d,1 = 8 × 10⁻⁵ m, γ d,3 = 0.4, a d,3 = 12 × 10−5 m |
| Case 4 | TCS-LG3: 3 layers | γ d,1 = 0.2, a d,1 = 8 × 10⁻⁵ m, γ d,2 = 0.3, a d,2 = 10 × 10−5 m, γ d,3 = 0.4, a d,3 = 12 × 10−5 m |
The temperature field distribution of various TCS configurations under F = 3% is illustrated in Figure 4. Compared to Case 1(TCS-T), the maximum temperature of TCS-LG decreased by 17.75–33.03%. This reduction is primarily attributed to the single-layer porous medium in TCS-T, which features a uniform porosity distribution. A significant portion of the coolant encounters resistance within the porous medium, causing flow diversion behind this region. Consequently, the leading-edge of the T-TCS does not receive adequately initial cooling, resulting in a localized high-temperature region at the foremost side, as depicted in Figure 4(a). In contrast, as evident from Figure 4(b)–(d), the gradient porosity of the TCS-LG allows the coolant to flow more effectively through the foremost layer of the porous medium, ensuring a uniform distribution along the hot surface. This distribution effectively shields the TCS from the thermal impact of mainstream high-temperature region. As a result, the TCS-T has only a small portion of the coolant passing through the front side of the porous medium compared to the multi-layer structures, leading to a maximum reduction in the average coolant mass fraction of up to 34.05%, as shown in Figure 4(e). Moreover, in the case of the TCS-LG2, the maximum temperature of the top layer of porous medium in Case 2 is lower than that in Case 3. According to Cheng et al. [44], smaller variations in porosity enhance cooling performance on the hot surface. Therefore, this discrepancy arises from the significant disparity in gradient porosity values between the two layers in Case 3, leading to non-uniform temperature distribution and localized temperature increases. By comparing Cases 1, 2, and 4, it is apparent that when the gradient porosity difference between two adjacent layers of porous medium remains constant, the maximum temperature in the porous medium region gradually decreases with an increase in layers. This phenomenon occurs because the temperature distribution within the porous medium region gradually becomes uniform, significantly mitigating the adverse effects of heat transfer deterioration resulting from temperature non-uniform.

Temperature field distribution of different TCS (F = 3%): (a) Case 1, (b) Case 2, (c) Case 3, (d) Case 4, and (e) distribution trend of coolant in porous medium foremost side.
The temperature distribution in the porous medium region directly influences the effectiveness of the TCS. In this study, the local temperature variations in the porous medium region are analyzed under the conditions of F = 1, 2, and 4%. As shown in Figure 5, increasing F leads to a reduction in maximum temperatures of both TCS-T and TCS-LG, while the temperature difference (T
difference) between the highest and lowest temperatures gradually narrows. This trend indicates that an increase in the

Temperature field distribution in porous medium region. (a) Case 1, (b) Case 2, (c) Case 3, (d) Case 4.
The temperature standard deviation index, denoted as
where n denotes the number of grid cells, T i refers to the temperature associated with each grid cell (K), and T ave represents the average temperature of the cell region (K).
From a mathematical statistics standpoint, a smaller
Temperature uniformity at hot surface of porous medium
| F | 1% | 2% | 3% | 4% |
|---|---|---|---|---|
| θ T, Case 1/(K) | 393.91 | 330.17 | 270.39 | 217.15 |
| θ T, Case 2/(K) | 464.07 | 365.84 | 261.51 | 165.61 |
| θ T, Case 3/(K) | 485.39 | 387.97 | 281.32 | 183.91 |
| θ T, Case 4/(K) | 450.33 | 353.45 | 247.23 | 150.76 |
TCS employs porous medium as the cooling matrix, with variations in the porous structure parameters significantly influencing its thermal protection performance. As indicated in the analysis of Figures 4 and 5, the temperature field distribution in the TCS-LG is affected by the porosity differences between adjacent layers, the number of porous medium layers, and the porosity of the top layer exposed to the high-temperature mainstream. The following discussion delves into the effects of these three factors on the temperature field and their impact on θ T . As shown in Figure 6(a), smaller porosity differences between adjacent layers result in a more uniform coolant film formation on the hot surface of the porous medium, effectively shielding the structure from the heat load imposed by the high-temperature mainstream. With an increasing number of porous medium layers, a greater volume of coolant permeates through the hot surface, reducing the maximum temperature of the leading-edge structure and enhancing the uniformity of the temperature distribution, as illustrated in Figure 6(b). Conversely, as seen in Figure 6(c), a larger porosity in the porous layer adjacent to the high-temperature mainstream allows more external high-temperature airflow to flow into the porous medium, diminishing the effectiveness of the coolant film coverage. While a lower porosity distribution improves both the cooling effect and temperature uniformity, it also raises the demand for injection pressure (P c) in the cooling chamber. Comparing the influences of different porous medium configurations in Figure 6(a)–(c), it is evident that increasing the number of porous layers has a more pronounced effect on reducing the maximum temperature and enhancing the uniformity of the temperature field.

Effect of different combinations of porous medium on temperature field: (a) porosity difference between adjacent layers, (b) number of porous medium layers, and (c) porosity size of porous medium top layer.
Due to the utilization of ceramic material in the porous medium, the thermal stress distribution is typically assessed using the maximum principal stress (σ max, principal) [37]. The distribution of σ max, principal among various TCS is illustrated in Figure 7. Through numerical simulation, Yang et al. [46] found that a substantial temperature difference at the material interface generates significant thermal stress in the TCS, potentially leading to material damage and failure. Notably, stress concentration is observed at the interface between the top and left surfaces of the inner layer within the porous medium. This phenomenon arises from the considerable temperature gradient between the inner and outer layers of the solid region, which is consistent with results reported by Yang et al. [46]. A comparison between Case 2 and Case 3 reveals that the σ max, principal of TCS-LG2 rises from 442.2 to 445.2 MPa as the upper porosity of the porous medium increases. As can be seen from Case 1, Case 2, and Case 4, there is a progressive increase in the σ max, principal of TCS with the addition of layers in the porous medium. The stress concentration phenomenon in Case 4 intensifies notably. The increase in thermal stress in TCS-LG3 is primarily attributed to two factors. On the one hand, TCS-LG3 exhibits a more pronounced material property discontinuity between porous layers compared to TCS-T and TCS-LG2, resulting in greater differences in properties between the layered gradient materials and the solid region. The thin thickness of the porous medium layer further amplifies the deformation resulting from temperature differences, leading to significant thermal stress accumulation. On the other hand, the thermal protection effect of the cooled gas film on the solid wall diminishes under the influence of the high-temperature mainstream, creating a substantial temperature gradient between the upper and the side surfaces of the solid region. Additionally, external mechanical forces constrain the structural side, exacerbating stress accumulation and contributing to an increase in thermal stress within the structure.

Stress field distribution of TCS (F = 3%): (a) Case 1, (b) Case 2, (c) Case 3, and (d) Case 4.
3.2 Quantitative analysis of temperature field and stress field
To further analyze the heat transfer and thermal stress distribution of various TCS, a detailed examination of the temperature and stress fields is conducted, as depicted in Figures 7 and 8. The flow and heat transfer efficiency of TCS are evaluated using the average efficiency of the hot surface within the porous medium (η ave) and the P c, with the relevant formulas provided in Eq. (20) [47]:
where A i denotes the area of distinct grids (m²); A signifies the size of the selected area (m²).

Comparison of flow and heat transfer in TCS at different F: (a) effects of different F on flow and heat transfer and (b) comparison of cooling performance.
The cooling performance (ξ) is utilized to compare the cooling performance of TCS-LG and TCS-T under identical pressure drop, as shown in Eq. (21):
where η ave, TCS-LG denotes the cooling efficiency of the hot surface within the TCS-LG; η ave, TCS-T refers to the cooling efficiency of the hot surface within the TCS-T. P c, TCS-LG represents the injection pressure of the cooling chamber for TCS-LG (Pa); P c, TCS-T represents the injection pressure of the cooling chamber for TCS-T (Pa).
As shown in Figure 8(a), both η ave and P c of TCS increase with the increase of F, with P c of TCS-LG being lower than that of TCS-T, demonstrating a maximum value of 22.93−30.34%. The η ave of TCS-T is the maximum under the condition of lower F (1−2%), but this also consumes a large amount of P c. With increasing F, the coolant distribution in the porous medium region of TCS-T becomes more uniform, resulting in non-uniform temperature distribution on the hot surface. As observed in Case 2, Case 3 and Case 4, because the P c is small, the TCS-LG can show better ξ under higher F (3–4%). As illustrated in Figure 8(b), under the F = 1–4%, TCS-LG consistently show superior ξ compared to TCS-T, with TCS-LG3 exhibiting the best ξ, which increases by 34.59–40.55%. With the increase of F, the ξ of each TCS-LG decreases first and then increases. Although TCS-LG consumes lower P c at F = 1% to achieve the η ave close to TCS-T, demonstrating better ξ, it is evident from Figure 5 and Table 3 that under this condition, the cooling effect of the gas film on certain regions of the hot surface is suboptimal, leading to poor θ T in the porous medium region. At higher flow rates of F = 3–4%, TCS-LG continues to exhibit superior cooling performance and structural reliability, benefiting from more uniform coolant distribution. This is particularly effective in reducing local temperature differences, resulting in a more uniform temperature field and consequently reducing thermal stress within the structure. Therefore, while F = 1% yields the highest ξ, the overall performance of TCS-LG is more advantageous at higher F, making it suitable for conditions requiring improved temperature distribution uniformity and enhanced structural reliability.
The comparison of σ max, principal among different TCS under varying F is presented in Figure 9. Allali et al. [48] demonstrated that the introduction of cooling systems mitigates changes in material properties due to temperature fluctuations, thereby reducing the risk of damage in high thermal stress regions. It can also be seen from Figure 9(a) and (b), the σ max, principal of the TCS exhibits a consistent decreasing trend with increasing F. This trend occurs because higher F allows for a wider range of cooling gas film thickness, which reduces the temperature gradient on the hot surface and improves thermal stress distribution. However, the reduction trend in σ max, principal is observed to gradually decelerate for TCS-T, whereas it gradually increases for TCS-LG2-case 2, TCS-LG2-case 3, and TCS-LG3. Notably, TCS-LG3 demonstrates the most substantial reduction in σ max, principal across different working conditions, reaching up to 20.67%. This is attributed to the superior cooling effect in the porous media region of TCS-LG3 and enhanced uniformity in temperature distribution, particularly at higher F, as illustrated in Figure 5 and Table 3. Furthermore, the σ max, principal of the TCS-LG gradually converges toward that of the TCS-T, indicating that the thermal stress distribution within the TCS-LG significantly improves under higher working conditions, consequently enhancing the thermal–mechanical compatibility in the contact region of the TCS.

Comparison of maximum principal stress in TCS at different F: (a) effects of different F on maximum principal stress and (b) comparison of maximum principal stress in different F intervals.
3.3 Orthogonal experimental
Although the TCS-LG exhibits better ξ at higher F, the varied porosity arrangement across layers of porous medium introduces inconsistencies in the mechanical properties, causing significant thermal stress distribution throughout the structure under similar temperature gradients. Hence, an orthogonal experimental method is employed to comprehensively investigate the effects of bottom-layer diameter (D m, Bottom), top-layer diameter (D m, Top), and the length of the porous medium (L p) on both temperature and stress fields at F = 3%. It optimizes structural parameters with notable influence and subsequently identifies the optimal combination [49]. The simulated factors include D m, Bottom, D m, Top, and L p, with the objective functions comprising η ave and σ max, principal. During parameter selection, the overall shape of the leading-edge remains fixed, with an outer diameter of 12 mm and a thickness of 4.5 mm, as illustrated in Figure 1. Previous work by Chen et al. [16] identified the thickness and length of the porous medium as key factors affecting η ave in TCS. Additionally, the number of porous layers plays a critical role in both the cooling effect and the temperature distribution uniformity, which is directly related to the thickness of each porous medium layer. After fixing the inner and outer diameters of the porous medium, the D m, bottom and D m, top of the intermediate layer is varied within the ranges of 3 mm < D m, bottom < 8 mm and 8 mm ≤ D m, top ≤ 12 mm, respectively. For L p, based on Chen et al. [16], which showed a negative correlation between L p and η ave, the range for L p is set between 7 mm and 10 mm. The factors and the design of the orthogonal experimental table are detailed in Table 4. The analysis employs the range analysis method to assess results. First, the average values for different levels of the same experimental factors are calculated. Then, the data dispersion is measured by determining the difference between the maximum and minimum values within the obtained mean dataset [50]. Comparison of different groups elucidates which factors exert a more substantial influence on the objective function.
Factor and level design of orthogonal experiments
| Level | Factor | |||
|---|---|---|---|---|
| D m, Bottom/(mm) | D m, Top/(mm) | L p/(mm) | Model annotation | |
| 1 | 4 | 8 | 7 |
 |
| 2 | 5 | 9 | 8 | |
| 3 | 6 | 10 | 9 | |
| 4 | 7 | 11 | 10 | |
As indicated in Table 5, the factors impacting the η ave follow the order of D m, Top > L p > D m, Bottom, with L p and D m, Top demonstrating comparable effects on η ave. Analysis of Figure 10 reveals that as D m, Top and L p increase, η ave at the hot surface of the TCS-LG3 gradually diminishes. The influence of D m, Bottom on η ave is subject to multifactor coupling, and its trend does not exhibit a monotonic increase or decrease with changing levels. Focusing solely on η ave as the index, the optimal combination is determined as 6-8-7 (D m, Bottom-D m, Top-L p). The η ave under this combination is validated at 0.9196, surpassing the highest η ave within the other groups of orthogonal experiments.
Numerical simulation results of η ave
| Level | η ave | ||
|---|---|---|---|
| D m, Bottom/(mm) | D m, Top/(mm) | L p/(mm) | |
| Mean value 1 | 0.8532 | 0.8865 | 0.9001 |
| Mean value 2 | 0.8623 | 0.8861 | 0.8741 |
| Mean value 3 | 0.8666 | 0.8693 | 0.8493 |
| Mean value 4 | 0.8651 | 0.8053 | 0.8238 |
| Range/(× 10−2) | 1.34 | 8.12 | 7.63 |

Diagram of η ave variation with factors and levels: (a) effects of D m, Bottom, (b) effects of D m, Top, and (c) effects of L p.
As illustrated in Table 6, the primary factors influencing σ max, principal follow the sequence of L p > D m, Bottom > D m, Top. Among these, L p has the most significant effect, while D m, Bottom and D m, Top have similar influences on σ max, principal. The effects of these parameters involve multi-factor coupling interaction, where increases in D m, Bottom, D m, Top, and L p initially lead to a decrease in σ max, principal, followed by an increasing trend, as illustrated in Figure 11. When considering solely the minimization of σ max, principal, the structure size according to the minimum average value of the levels taken by different factors is selected, with optimal combination identified as 5-9-8 (D m, Bottom-D m, Top-L p). Subsequent modeling and numerical simulation of this configuration reveal a minimum σ max, principal value of 371.84 MPa, representing an 18.51% reduction compared to the values in Case 4.
Numerical simulation results of σ max, principal
| Level | σ max, principal | ||
|---|---|---|---|
| D m, Bottom/(mm) | D m, Top/(mm) | L p/(mm) | |
| Mean value 1/(MPa) | 451.47 | 477.59 | 477.88 |
| Mean value 2/(MPa) | 428.99 | 428.29 | 410.69 |
| Mean value 3/(MPa) | 465.36 | 450.53 | 465.75 |
| Mean value 4/(MPa) | 479.33 | 468.75 | 470.84 |
| Range/(MPa) | 50.34 | 49.3 | 60.15 |
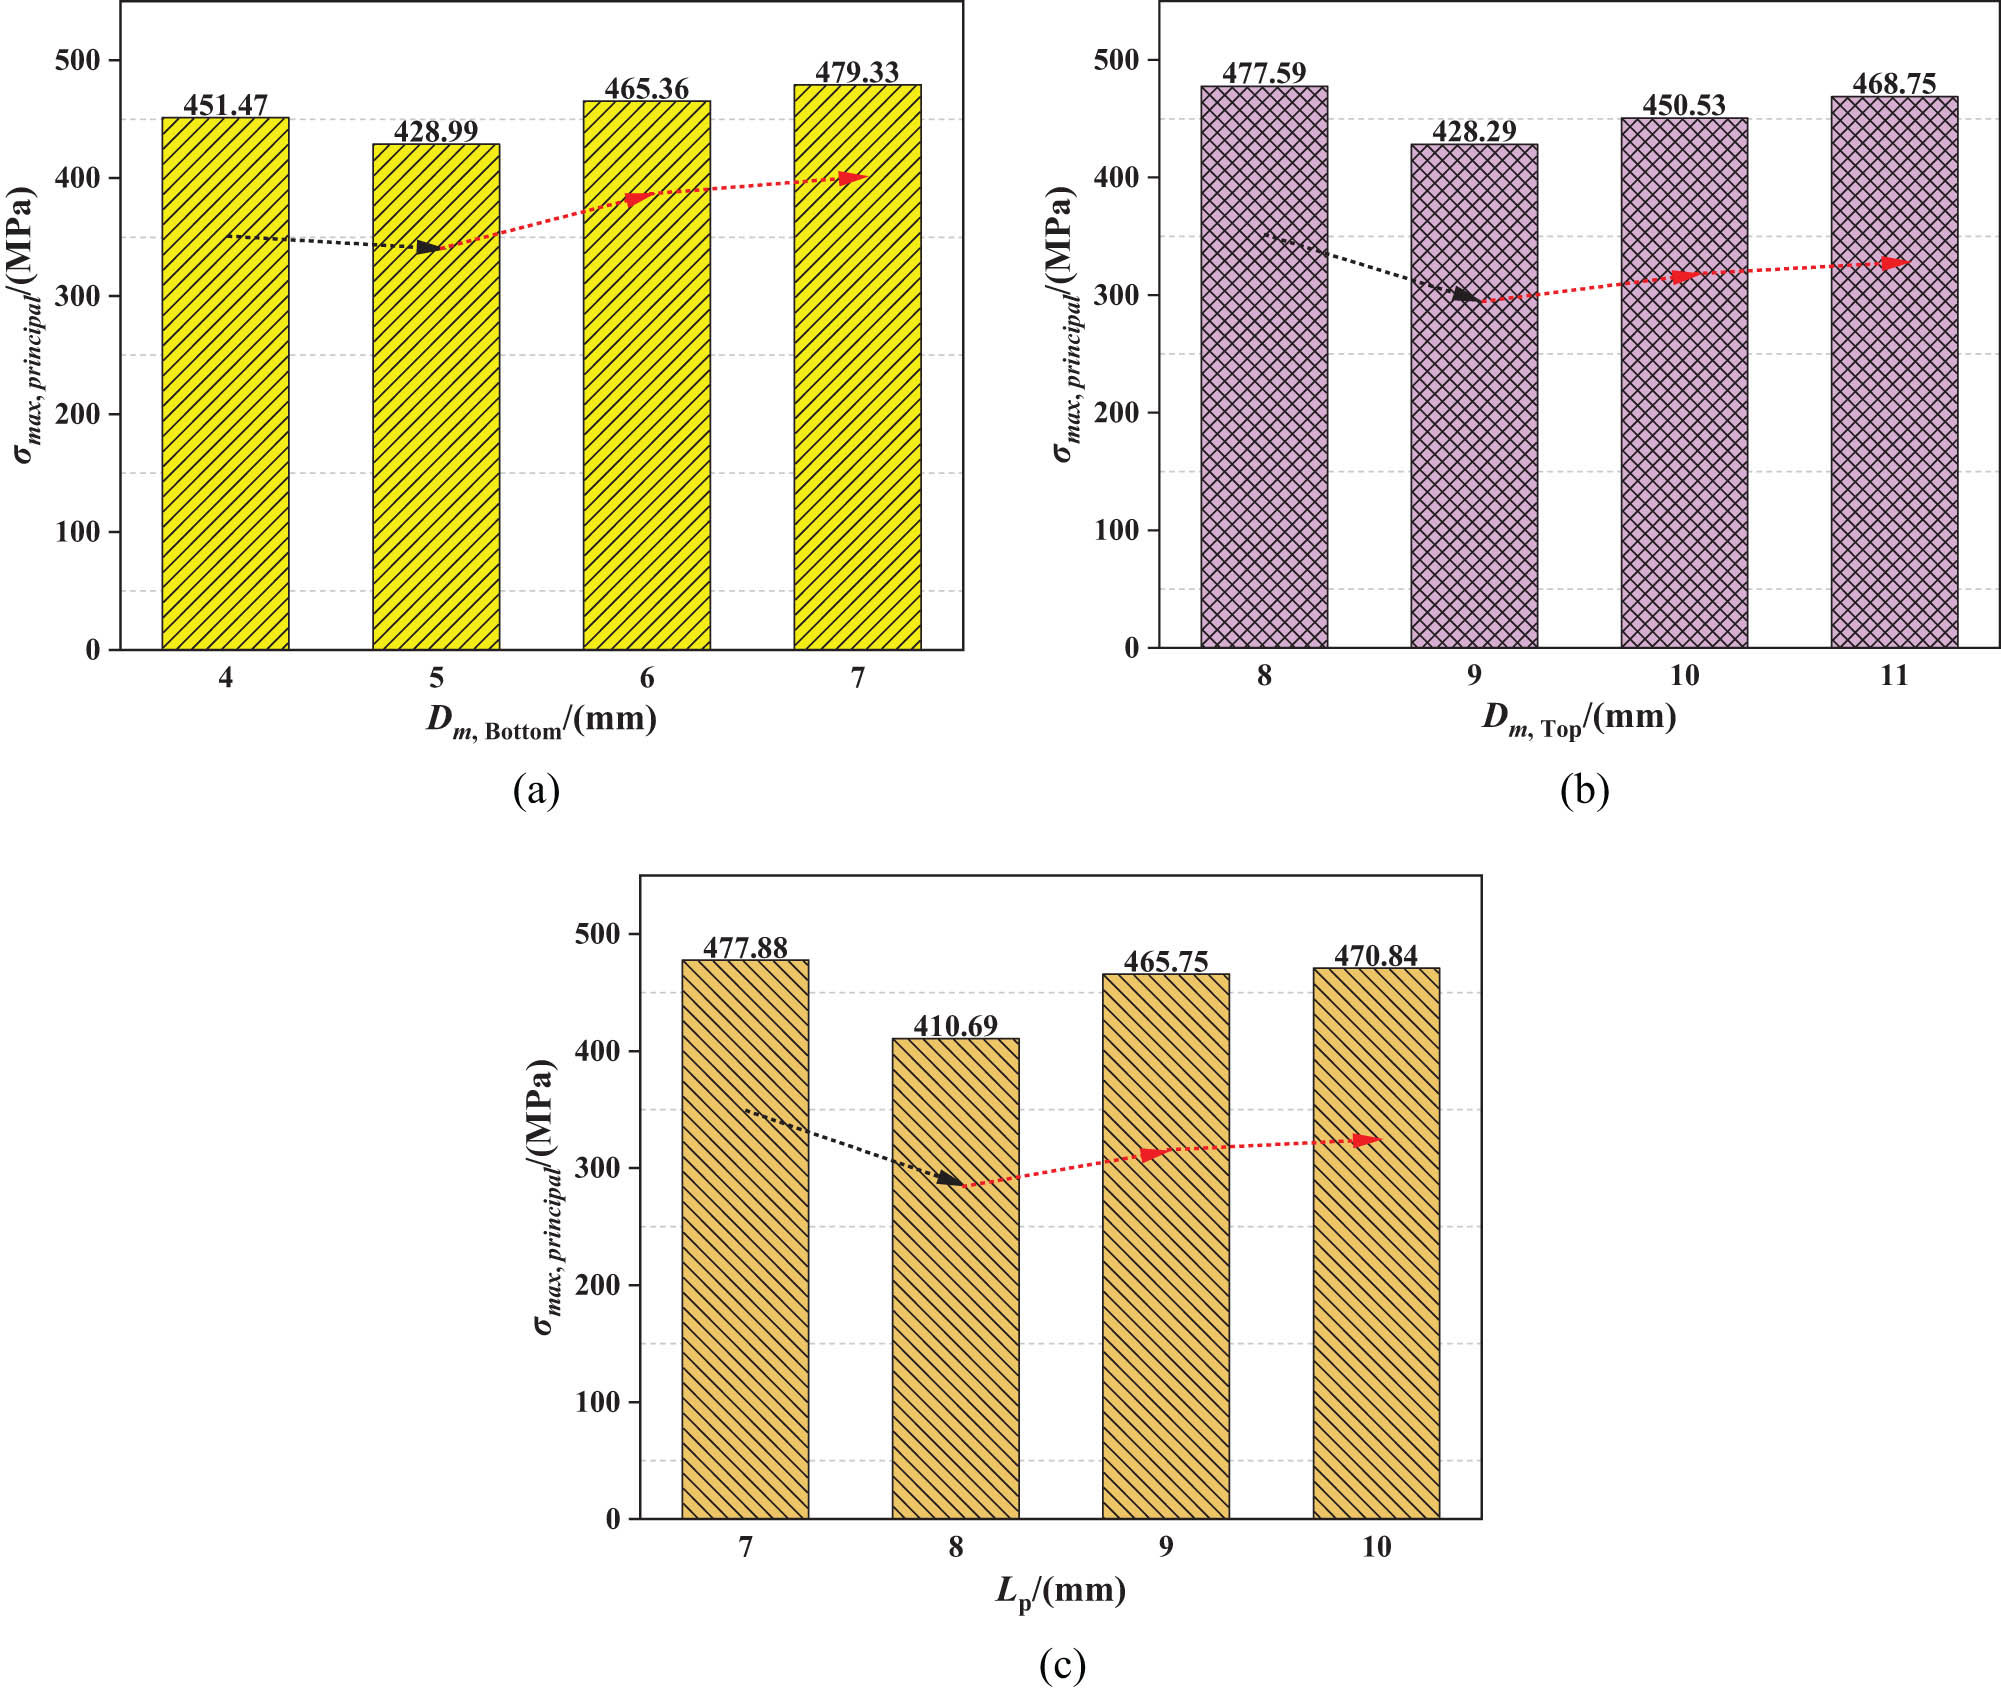
Diagram of σ max, principal variation with factors and levels: (a) effects of D m, Bottom, (b) effects of D m, Top, and (c) effects of L p.
4 Conclusion
In this study, a novel TCS-LG was introduced to improve heat transfer deterioration arising from non-uniform temperature distribution and stress concentration due to significant temperature gradients in transpiration cooling thermal protection technology. The temperature and stress fields of both TCS-T and TCS-LG were comprehensively analyzed qualitatively and quantitatively through numerical simulation and orthogonal experimental. Structural parameters significantly impacting η ave and σ max, principal were systematically investigated via orthogonal experimental, leading to the determination of optimal design parameters. The primary findings are summarized as follows:
Under identical F, the maximum temperature of the TCS-LG decreases by 17.75−33.03% compared to that of the TCS-T. As the number of layers increases, the uniformity of temperature distribution within the TCS-LG improves by 8.5–30.57% compared to that of the TCS-T.
In comparison with the TCS-T, the TCS-LG demonstrates superior ξ at higher F, with a reduction in P c of 22.93–30.34%. Moreover, the ξ increases by 34.59–40.55% at equivalent pressure drop in the layered gradient configuration.
Due to temperature gradient, significant stress concentrates at TCS interfaces. With increasing F, σ max, principal decreases, notably by 20.67% in TCS-LG. At higher F, the thermal stress distribution in TCS-LG can be notably enhanced.
The parameters exerting the greatest influence on η ave and σ max, principal are the D m, Top and L p, respectively. The optimal TCS-LG3 achieves a maximum increase in η ave to 0.9196 and a maximum decrease in σ max, principal of 18.51%.
Acknowledgments
The author would like to express sincere gratitude to Prof. Ke Wang for his invaluable assistance throughout this research, which was supported by the Key Laboratory of Process Heat Transfer and Energy Saving of Henan Province, Zhengzhou University. We also extend our thanks to the reviewers for their insightful comments and constructive feedback, which have significantly contributed to improving the quality of the manuscript.
-
Funding information: This study is financially supported by the National Natural Science Foundation of China (No: 51776190), the Key Science and Technology Research Projects of Henan Province (No. 222102320020).
-
Author contributions: Weijie Chen contributed to the acquisition and interpretation of data and drafted the manuscript. Yongqing Wang designed the study and critically revised the manuscript. Bo An and Qin Zhang contributed to the study design and data analysis. Huijuan Su assisted in the data interpretation and provided critical feedback on the manuscript. Ke Wang facilitated the funding acquisition and supervised the manuscript. All authors have accepted responsibility for the entire content of this manuscript and approved its submission.
-
Conflict of interest: The authors state no conflict of interest.
-
Data availability statement: The datasets generated during and/or analyzed during the current study are available from the corresponding author on reasonable request.
References
[1] Zhang SL, Li X, Zuo JY, Qin J, Cheng KL, Feng Y, et al. Research progress on active thermal protection for hypersonic vehicles. Prog Aeronaut Sci. 2020;119:100646.10.1016/j.paerosci.2020.100646Search in Google Scholar
[2] Zhu YH, Peng W, Xu RN, Jiang PX. Review on active thermal protection and its heat transfer for airbreathing hypersonic vehicles. Chin J Aeronaut. 2018;31(10):1929–53.10.1016/j.cja.2018.06.011Search in Google Scholar
[3] Wang W, Yan Y, Zhou YQ, Cui JH. Review of advanced effusive cooling for gas turbine blade. Energies. 2022;15(22):8568.10.3390/en15228568Search in Google Scholar
[4] Dong WJ, Deng PG, Lin SY, Chen T. Numerical study of a new scheme of self-adaptive transpiration cooling. Appl Therm Eng. 2023;230:120779.10.1016/j.applthermaleng.2023.120779Search in Google Scholar
[5] Li HW, Zhang DW, You RQ. Sensitivity analysis and optimal design of impingement/effusion cooling structural parameters considering thermal stress. J Aerosp Power. 2021;37(11):2455–64.Search in Google Scholar
[6] Mi Q, Yi SH, Gang DD, Lu XG, Liu XL. Research progress of transpiration cooling for aircraft thermal protection. Appl Therm Eng. 2024;236:121360.10.1016/j.applthermaleng.2023.121360Search in Google Scholar
[7] Luan Y, He F, Wang JH. Review on transpiration cooling for near-space aircraft. J Propul Technol. 2023;44(1):6–20.Search in Google Scholar
[8] Langener T, von Wolfersdorf J, Steelant J. Experimental investigations on transpiration cooling for scramjet applications using different coolants. AIAA J. 2011;49(7):1409–19.10.2514/1.J050698Search in Google Scholar
[9] Luo SB, Miao ZC, Liu J, Song JW, Xi WX, Liu CY. Effects of coolants of double layer transpiration cooling system in the leading-edge of a hypersonic vehicle. Front Energy Res. 2021;9:756820.10.3389/fenrg.2021.756820Search in Google Scholar
[10] Yang Y, Mao JK, Chen PT, Zhang H, Tang HW. Numerical investigation on transpiration cooling performance with different porosities and mainstream pressure gradients. Int J Therm Sci. 2023;184:107991.10.1016/j.ijthermalsci.2022.107991Search in Google Scholar
[11] Dong WJ, Wang JH, Chen SY, Ai BC, Luo XG. Modelling and investigation on heat transfer deterioration during transpiration cooling with liquid coolant phase change. Appl Therm Eng. 2018;128:381–92.10.1016/j.applthermaleng.2017.08.155Search in Google Scholar
[12] Qian K, Wang JH, He F, Wu YD, Zhou ZH. An experimental investigation on transpiration cooling performances using solid hydrogel as coolant. Appl Therm Eng. 2019;158:113753.10.1016/j.applthermaleng.2019.113753Search in Google Scholar
[13] He F, Dong WJ, Wang JH, Zhou JX, Tang LS. Transient model and its application to investigate the injection mode and periodical operation of transpiration cooling with liquid coolant phase change. Appl Therm Eng. 2020;181:115956.10.1016/j.applthermaleng.2020.115956Search in Google Scholar
[14] Liu YQ, Jiang PX, Xiong YB, Wang YP. Experimental and numerical investigation of transpiration cooling for sintered porous flat plates. Appl Therm Eng. 2013;50(1):997–1007.10.1016/j.applthermaleng.2012.08.028Search in Google Scholar
[15] Huang G, He L. Influence of inhomogeneous porosity on effusion cooling. Int J Heat Mass Transf. 2019;144:118675.10.1016/j.ijheatmasstransfer.2019.118675Search in Google Scholar
[16] Chen WJ, Wang K, Wang YQ, Tu ST, Liu ZC, Su HJ. Numerical investigation and optimal design of transpiration cooling plate structure for gradient porosity. Int J Therm Sci. 2024;197:108755.10.1016/j.ijthermalsci.2023.108755Search in Google Scholar
[17] Sun HO, Ma HF, Yan LY, Fu H, Luan YG, Zunino P. Numerical simulations on the performance of transpiration cooling implemented with perforated flat plates. Appl Therm Eng. 2024;238:121943.10.1016/j.applthermaleng.2023.121943Search in Google Scholar
[18] Wu N, Wang JH, He F, Chen L, Ai BC. Optimization transpiration cooling of nose cone with non-uniform permeability. Int J Heat Mass Transf. 2018;127:882–91.10.1016/j.ijheatmasstransfer.2018.07.134Search in Google Scholar
[19] He F, Wu N, Ran FY, Wang JH. Numerical investigation on the transpiration cooling of three-dimensional hypersonic inlet. Aerosp Sci Technol. 2020;106:106152.10.1016/j.ast.2020.106152Search in Google Scholar
[20] Ding R, Wang JH, He F, Wang M, Luan Y, Dong GQ, et al. Numerical investigation on a double layer combined cooling structure for aerodynamic heat control of hypersonic vehicle leading-edge. Appl Therm Eng. 2020;169:114949.10.1016/j.applthermaleng.2020.114949Search in Google Scholar
[21] Liu TL, Liu YF, Ding R, Zhu JQ, He F, Wang JH. Numerical simulation and structural optimization of transpiration cooling with gradient porous matrix in hypersonic condition. Int J Therm Sci. 2024;198:108871.10.1016/j.ijthermalsci.2023.108871Search in Google Scholar
[22] Lozano F, Paniagua G. Airfoil leading edge blowing to control bow shock waves. Sci Rep. 2020;10(1):21922.10.1038/s41598-020-79048-wSearch in Google Scholar PubMed PubMed Central
[23] He LW, Jin ZH, Zhang Y. Convective cooling/heating induced thermal stresses in a fluid saturated porous medium undergoing local thermal non-equilibrium. Int J Solids Struct. 2012;49(5):748–58.10.1016/j.ijsolstr.2011.11.014Search in Google Scholar
[24] Skamniotis C, Cocks ACF. Minimising stresses in double wall transpiration cooled components for high temperature applications. Int J Mech Sci. 2021;189:105983.10.1016/j.ijmecsci.2020.105983Search in Google Scholar
[25] Li HW, Zhang DW, You RQ, Zou YF, Liu S. Numerical investigation of the effects of the hole inclination angle and blowing ratio on the characteristics of cooling and stress in an impingement/effusion cooling system. Energies. 2023;16(2):937.10.3390/en16020937Search in Google Scholar
[26] Liu X, Bian YY, Zhou WX, Wu CW, Jia ZJ. Investigation on heat transfer during transpiration cooling with hydrocarbon fuel coolant. Int J Heat Mass Transf. 2023;200:123507.10.1016/j.ijheatmasstransfer.2022.123507Search in Google Scholar
[27] Yang Y, Zhang B, Fan XL, Zhao R. Transpiration cooling performances of oriented porous structures with lateral permeability under local block conditions. Appl Therm Eng. 2024;243:122633.10.1016/j.applthermaleng.2024.122633Search in Google Scholar
[28] Ma HF, Sun HO, Fu H, Luan YG, Sun T, Zunino P. Numerical investigation on transpiration cooling performance of turbine blades with non-uniform porosity. Appl Therm Eng. 2023;235:121394.10.1016/j.applthermaleng.2023.121394Search in Google Scholar
[29] Shen L, Wang JH. Numerical investigation on the optimization of local transpiration cooling effectiveness. Appl Therm Eng. 2017;127:58–69.10.1016/j.applthermaleng.2017.08.017Search in Google Scholar
[30] Xiao XF, Zhao GB, Zhou WX. Numerical investigation of transpiration cooling for porous nose cone with liquid coolant. Int J Heat Mass Transf. 2018;121:1297–306.10.1016/j.ijheatmasstransfer.2018.01.029Search in Google Scholar
[31] Sarpkaya T. Experimental determination of the critical Reynolds number for pulsating Poiseuille flow. J Basic Eng. 1996;88(3):589–98.10.1115/1.3645920Search in Google Scholar
[32] Vafai K, Kim SJ. On the limitations of the Brinkman-Forchheimer extended Darcy equation. Int J Heat Fluid Flow. 1995;16(1):11–5.10.1016/0142-727X(94)00002-TSearch in Google Scholar
[33] Ding R, Wang JH, He F, Dong GQ, Tang LS. Numerical investigation on the performances of porous matrix with transpiration and film cooling. Appl Therm Eng. 2019;146:422–31.10.1016/j.applthermaleng.2018.09.134Search in Google Scholar
[34] Gu X, Wang G, Zhang QX, Chen C, Li N, Chen WJ. Fluid-structure interaction analysis of heat exchanger with torsional flow in the shell side. J Mech Sci Technol. 2022;36(1):479–89.10.1007/s12206-021-1245-1Search in Google Scholar
[35] ANSYS Inc. Ansys fluent user’s guide. ANSYS Inc. Canonsburg, PA; 2021.Search in Google Scholar
[36] Gu X, Wang G, Li N, Chen C, Zhang QX. Application of response surface optimization technology and fluid-structure interaction in the engineering design of torsional flow heat exchangers. P I Mech Eng C-J Mec. 2022;236(12):6607–20.10.1177/09544062211072389Search in Google Scholar
[37] Purwar A, Basu B. Thermo-structural design of ZrB2-SiC-based thermal protection system for hypersonic space vehicles. J Am Ceram Soc. 2017;100(4):1618–33.10.1111/jace.14750Search in Google Scholar
[38] Khalili N, Uchaipichat A, Javadi AA. Skeletal thermal expansion coefficient and thermo-hydro-mechanical constitutive relations for saturated homogeneous porous medium. Mech Mater. 2010;42(6):593–8.10.1016/j.mechmat.2010.04.001Search in Google Scholar
[39] Ramakrishnan N, Arunachalam VS. Effective elastic-moduli of porous solids. J Mater Sci. 1990;25(9):3930–7.10.1007/BF00582462Search in Google Scholar
[40] Han Y, Guo MT, Sun AW, Liu HW, Xiao G, Sun Y, et al. Towards feasible temperature management and thermo-mechanical stability of carbon-assisted solid oxide electrolysis cell. Energy Convers Manage. 2023;276:116483.10.1016/j.enconman.2022.116483Search in Google Scholar
[41] Lin J, Zhao LJ, Wang JH. Numerical investigation on aero-thermodynamic characteristics of wedge shaped nose cone of near space hypersonic flight. Appl Mech Mater. 2014;541–542(10):608–12.10.4028/www.scientific.net/AMM.541-542.608Search in Google Scholar
[42] Wu N, Wang JH, He F, Dong GQ, Tang LS. An experimental investigation on transpiration cooling of a nose cone model with a gradient porosity layout. Exp Therm Fluid Sci. 2019;106:194–201.10.1016/j.expthermflusci.2019.05.002Search in Google Scholar
[43] Shen L, Wang JH, Dong WJ, Pu J, Peng JL, Qu DJ, et al. An experimental investigation on transpiration cooling with phase change under hypersonic condition. Appl Therm Eng. 2016;105:549–6.10.1016/j.applthermaleng.2016.03.039Search in Google Scholar
[44] Cheng ZL, Xu RN, Jiang PX. Transpiration cooling with phase change by functionally graded porous media. Int J Heat Mass Transf. 2023;205:123862.10.1016/j.ijheatmasstransfer.2023.123862Search in Google Scholar
[45] Quan GZ, Zhang ZH, Wang X, Li YL, Mao A, Xia YF. Parameter optimization of cooling system in U-shape hot stamping mold for high strength steel sheet based on MOPSO. Int J Adv Manuf Technol. 2017;90(1–4):887–906.10.1007/s00170-016-9446-ySearch in Google Scholar
[46] Yang Y, Zhang B, Fan XL, Zhao R. Numerical investigation on transpiration cooling performance of oriented porous structure under local block conditions. J Thermophys Heat Transf. 2024;38(3):311–20.10.2514/1.T6889Search in Google Scholar
[47] Jiang PX, Huang G, Zhu YH, Liao ZY, Huang Z. Experimental investigation of combined transpiration and film cooling for sintered metal porous struts. Int J Heat Mass Transf. 2017;108:232–43.10.1016/j.ijheatmasstransfer.2016.12.014Search in Google Scholar
[48] Allali A, Belbachir S, Alami A, Boucham B, Lousdad A. The effect of the outlet angle β2 on the thermomechanical behavior of a centrifugal compressor blade. J Mech Behav Mater. 2020;29(1):1–8.10.1515/jmbm-2020-0001Search in Google Scholar
[49] Gu X, Gao W, Li MH, Shi QM, Cao K. Shell-side flow study and structural optimization of a double helical-like flow heat exchanger. Therm Sci. 2023;27(2B):1517–28.10.2298/TSCI220521133GSearch in Google Scholar
[50] Gu X, Zheng ZY, Luo YK, Xiong XC, Zhang DB. Optimization on shell side structure of twisty flow heat exchanger based on orthogonal experiment. Chem Ind Eng Prog. 2019;38(4):1688–95.Search in Google Scholar
© 2025 the author(s), published by De Gruyter
This work is licensed under the Creative Commons Attribution 4.0 International License.
Articles in the same Issue
- Research Articles
- Probing microstructural evolution and surface hardening of AISI D3 steel after multistage heat treatment: An experimental and numerical analysis
- Activation energy of lime cement containing pozzolanic materials
- Optimizing surface quality in PMEDM using SiC powder material by combined solution response surface methodology – Adaptive neuro fuzzy inference system
- Experimental study of the mechanical shear behaviour of steel rebar connectors in timber–concrete structure with leafy wood species
- Development of structural grade lightweight geopolymer concrete using eco-friendly materials
- An experimental approach for the determination of the physical and mechanical properties of a sustainable geopolymer mortar made with Algerian ground-granulated blast furnace slag
- Effect of using different backing plate materials in autogenous TIG welding on bead geometry, microhardness, tensile strength, and fracture of 1020 low carbon steel
- Uncertainty analysis of bending response of flexoelectric nanocomposite plate
- Leveraging normal distribution and fuzzy S-function approaches for solar cell electrical characteristic optimization
- Effect of medium-density fiberboard sawdust content on the dynamic and mechanical properties of epoxy-based composite
- Mechanical properties of high-strength cement mortar including silica fume and reinforced with single and hybrid fibers
- Study the effective factors on the industrial hardfacing for low carbon steel based on Taguchi method
- Analysis of the combined effects of preheating and welding wire feed rates on the FCAW bead geometric characteristics of 1020 steel using fuzzy logic-based prediction models
- Effect of partially replacing crushed oyster shell as fine aggregate on the shear behavior of short RC beams using GFRP rebar strengthened with TRC: Experimental and numerical studies
- Micromechanic models for manufacturing quality prediction of cantula fiber-reinforced nHA/magnesium/shellac as biomaterial composites
- Numerical simulations of the influence of thermal cycling parameters on the mechanical response of SAC305 interconnects
- Impact of nanoparticles on the performance of metakaolin-based geopolymer composites
- Enhancing mechanical and thermal properties of epoxy-based polymer matrix composites through hybrid reinforcement with carbon, glass and steel
- Prevention of crack kinetic development in a damaged rod exposed to an aggressive environment
- Ideal strain gauge location for evaluating stress intensity factor in edge-cracked aluminum plates
- Experimental and multiscale numerical analysis of elastic mechanical properties and failure in woven fabric E-glass/polyester composites
- Optimizing piezoelectric patch placement for active repair of center-cracked plates
- Experimental investigation on the transverse crushing performance of 3D printed polymer composite filled aluminium tubes
- Review Articles
- Advancing asphaltic rail tracks: Bridging knowledge gaps and challenges for sustainable railway infrastructure
- Chemical stabilization techniques for clay soil: A comprehensive review
- Development and current milestone of train braking system based on failure phenomenon and accident case
- Rapid Communication
- The role of turbulence in bottom-up nanoparticle synthesis using ultrafast laser filamentation in ethanol
- Special Issue on Deformation and Fracture of Advanced High Temperature Materials - Part II
- Effect of parameters on thermal stress in transpiration cooling of leading-edge with layered gradient
- Development of a piezo actuator-based fatigue testing machine for miniature specimens and validation of size effects on fatigue properties
- Development of a 1,000°C class creep testing machine for ultraminiature specimens and feasibility verification
- Special Issue on Advances in Processing, Characterization and Sustainability of Modern Materials - Part II
- Surface integrity studies in microhole drilling of Titanium Beta-C alloy using microEDM
- Experimental investigation on bacterial concrete by using Cantabro loss and UPV
- Influence of gas nitriding on the surface layer of M50 NiL steel for aerospace-bearing applications
- Experimental investigation on the spectral, mechanical, and thermal behaviors of thermoplastic starch and de-laminated talc-filled sustainable bio-nanocomposite of polypropylene
- Synthesis and characterization of sustainable hybrid bio-nanocomposite of starch and polypropylene for electrical engineering applications
- Microstructural and mechanical characterization of Al6061-ZrB2 nanocomposites fabricated by powder metallurgy
- Effect of edge preparation on hardness and corrosion behaviour of AA6061-T651 friction stir welds
- Mechanical improvement in acetal composites reinforced with graphene nanotubes and Teflon fibers using loss functions
- Experimental investigation on the mechanical properties of aluminum-based metal matrix composites by the squeeze casting method
- Investigation on punch force–displacement and thickness changes in the shallow drawing of AA2014 aluminium alloy sheets using finite element simulations
- Influence of liquid nitriding on the surface layer of M50 NiL steel for bearing applications
- Mechanical and tribological analyses of Al6061-GO/CNT hybrid nanocomposites by combined vacuum-assisted and ultrasonicated stir casting method
- Strengthening of structures with bacterial concrete for effective crack repair and durability enhancement
- Unique approaches in developing novel nano-composites: Evaluating their mechanical and tribological characteristics
- Load-carrying capacity of highly compact rigid deployable booms
- Investigating the influence of SiC and B4C reinforcements on the mechanical and microstructural properties of stir-casted magnesium hybrid composites
- Evaluation of mechanical and performance characteristics of bitumen mixture using waste septage ash as partial substitute
- Mechanical characterization of carbon/Kevlar hybrid woven 3D composites
- Development of a 3D-printed cervical collar using biocompatible and sustainable polylactic acid
- Mechanical characterization of walnut shell powder-reinforced neem shell liquid composite
- Special Issue on Structure-energy Collaboration towards Sustainability Societies
- Effect of tunneling conductivity of CNTs on the EMI shielding effectiveness of nanocomposite in the C-band
- Evaluation of the effect of material selection and core geometry in thin-walled sandwich structures due to compressive strength using a finite element method
- Special Issue on Sustainability and Development in Civil Engineering - Part III
- The optimum reinforcement length for ring footing resting on sandy soils resisting inclined load
- Special Issue on Advanced Materials in Industry 4.0
- Cross-dataset evaluation of deep learning models for crack classification in structural surfaces
- Mechanical and antibacterial characteristics of a 3D-printed nano-titanium dioxide–hydroxyapatite dental resin-based composite