Development of a 1,000°C class creep testing machine for ultraminiature specimens and feasibility verification
-
Lei He
 ,
Takamoto Itoh
,
Takamoto Itoh

Abstract
The current study focused on developing a 1,000°C creep testing machine for ultraminiature specimens. The developed creep testing machine has a maximum test temperature of 1,200°C, a maximum applied loading of 200 N, and a creep strain measuring system that uses two linear variable differential transformers. Moreover, because of the difficulty in conducting ultraminiature creep testing, special structures of initial loading reduction and alignment were designed. Two types of ultraminiature specimens were designed in the current study. The creep simulation results using the finite element method indicated that the deformation of the specimen with a vertical shoulder (specimen A) was larger than that of the specimen with a sloped shoulder (specimen B). Thus, specimen B was selected for validation tests in order to investigate the effect of size on creep fracture time. The creep test outcomes demonstrated that the creep fracture times of the ultraminiature specimens were consistent with those of bulk specimens for AISI 304 stainless steel. Moreover, oxidation layer observations were conducted to investigate the influence of oxidation on the effective loading-bearing area. The results underline that the oxidation layer rarely affected the creep fracture time of the ultraminiature specimen for the used material.
1 Introduction
The components of high-temperature machines are frequently subjected to cyclic or constant loading, which exhibits fatigue, creep, and creep–fatigue fracture phenomena [1,2,3,4,5]. Among them, creep fracture is one of the failure modes in power generation systems and reflects the time-dependent failure of metallic materials under constant loading at elevated temperatures [6,7]. Owing to the fact that fossil/nuclear power generation systems, such as boiler pipes and gas turbine rotors, undergo creep damage [8,9,10,11,12,13,14,15], the safety and quality assurance of structures and components in service is essential.
The remaining creep life evaluation approaches are classified into two categories. The first one involves a nondestructive method in which replication [16], ultrasonics [6], and magnetic methods [17,18] are typical and representative methods. However, these methods may result in significant measuring errors, or they are simply difficult to employ in engineering applications. A comprehensive review of various nondestructive approaches can be found in the study of Sposito et al. [6]. The second approach involves a destructive method in which a sufficient amount of material is taken from a damaged component exposed in service to provide a conventional creep specimen. Consequently, the remaining life can be accurately predicted by means of creep testing of the conventional specimen. However, components cannot be reused because the damage caused by providing the standard specimen is too fatal [8]. Therefore, a new technology for accurately predicting the remaining creep lifetime while causing less damage to the target component during creep damage evaluation is needed.
Recently, a semidestructive method for evaluating the remaining creep lifetime has attracted significant attention. This method combines the advantages of the destructive method, i.e., high accuracy, but causes little damage to the component, which is repairable by welding [8,19] using a small sample specimen. The small sample testing approach is also called the miniature specimen creep testing approach. Numerous studies have investigated the creep features of materials using miniature samples with various approaches, such as uniaxial tensile testing, small punch testing, and small ring testing [20]. Among these approaches, the miniature uniaxial tensile testing method is the most advantageous because the data obtained by the miniature specimen method can be directly compared with the creep data obtained by the creep test using a standard-sized specimen [20]. On the contrary, small punch testing data cannot be compared with bulk creep test data because the applied stress changes with time during the testing process [20]. Several articles have focused on miniature tensile creep technology for heat-resistant steels, Mg alloys, and Ni-based superalloys [8,19,21,22]. For instance, Kadoya’s report [19] showed that miniature data were consistent with bulk test outcomes. On the contrary, the miniature results obtained in the study of Kanaya et al. [23] did not agree with the results of conventional tests. Thus, it is indispensable to develop a creep testing machine for using miniature specimens and systematically survey the reliability of miniature tensile creep tests through a direct comparison with bulk test data for various materials.
In addition, to further reduce the damage induced by sampling from objective high-temperature components and structures, ultraminiature creep specimen testing technology has been proposed [24]. Moreover, superalloys and ultrahigh-temperature ceramics synthesized using spark plasma sintering have attracted attention. Notwithstanding, specimen sizes manufactured using the abovementioned approach are limited by cost and technological issues. For instance, the length of the specimens does not exceed 15 mm, and a creep testing temperature of approximately 1,000°C is required. However, the topic has rarely been reported.
In the current study, a 1,000°C class creep testing machine for using ultraminiature specimens was developed. Moreover, two types of ultraminiature specimens were designed via the finite element method (FEM), and their viability was confirmed. Finally, to investigate the effect of size on creep fracture time, validation tests were conducted using AISI 304 stainless steel.
2 Developed creep testing machine for ultraminiature specimens
2.1 Overview of the testing machine
Figure 1(a)–(c) shows an overview schematic illustration of the front and side views of the developed creep testing machine for using ultraminiature specimens, respectively. The full size of the creep testing machine is 1,200 mm in height, 600 mm in width, and 600 mm in length. The developed machine is an electric furnace heating creep testing machine. During the creep test, creep strain was recorded via two linear variable differential transformer (LVDT) set at the lower middle portion of the machine. To avoid overheating of other components during the test, a heat shield plate made of Al alloy was mounted on the machine, as shown in Figure 1(b). The stress can be loaded using weight, and the lab jack is set beneath the weight cushion shock to prevent the weight from breaking the testing machine when the tested specimen fractures. The material used for the components inside the electric furnace was AISI 310S stainless steel due to its excellent high-temperature resistance. The other components were made of AISI 304 stainless steel. To avoid overheating of the shaft during the creep test, a water cooling system was introduced. Data can be collected using a data logger.
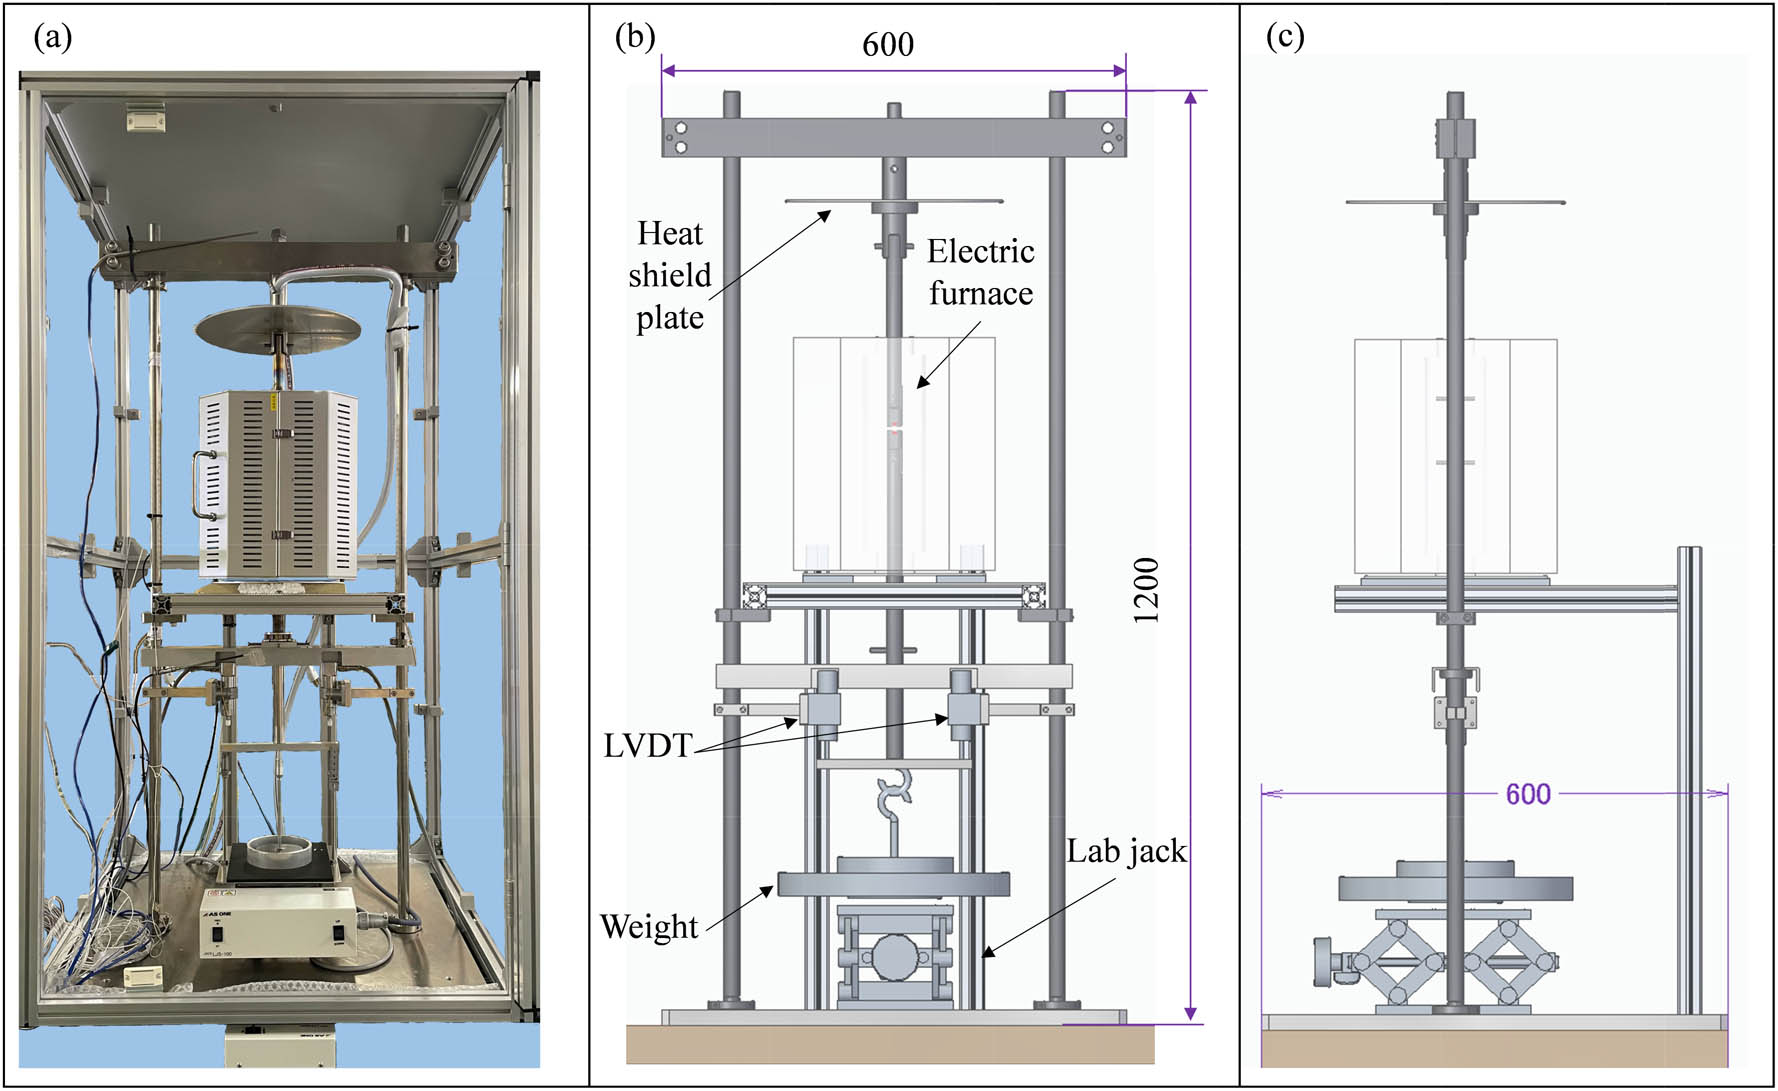
(a) Overview of the developed creep testing machine for ultraminiature specimens. (b) Schematic illustration of the front view and (c) Side view.
The specifications of the developed creep testing machine for using ultraminiature specimens are listed in Table 1. The maximum testing temperature and applied loading are 1,200°C and 200 N, respectively. The loading mode and displacement measuring approach are described in the previous section. The testing environment is air.
Specifications of the developed creep testing machine
| Max. temperature | 1,200°C |
| Max. power | 1,200 W |
| Max. applied loading | 200 N |
| Loading mode | Direct type |
| Displacement measure | LVDT |
| Testing environment | Air |
2.2 Initial loading reduction structure
Based on the JIS creep testing standard, the initial loading that can be applied to a specimen during a temperature increase is less than 10% of the objective loading. Since this testing machine is a direct loading type, the specimen is loaded by the deadweight of the shaft, and the weight holder increases the initial load during temperature increasing, which leads to increased initial loading. As a result, the lower limit of the test loading that satisfies the JIS standard increased, making it impossible to perform tests at low loading. Therefore, as shown in Figure 2(a), a structure to reduce the initial loading during temperature increasing using an auto-lab jack and a compression coil spring was developed. For the structure, a compression coil spring contacts with a displacement measurement bar that connects the shaft by compressing the spring, and the reduction of the initial loading by the generated elastic force can be achieved (Figure 2(b)). The amount of spring compression can be maintained at a constant elastic force by adjusting the height of the auto-lab jack, and the initial loading is kept constant during temperature-increasing period (Figure 2(b)). After completing temperature increasing and holding period, the compressed spring will be released, and the set specimen will be loaded (Figure 2(c)).

Schematic illustration of the initial loading reduction structure for the specimen using the auto-lab jack and the springs. (a) Pre-heating stage; (b) Temperature increasing stage; and (c) Loading stage.
2.3 Alignment structure
Because the testing machine is of a uniaxial tensile loading type, the loading and longitudinal directions of the specimen must coincide; otherwise, a large error will be caused in the fracture time. Therefore, alignment of the axes of the test piece, shaft, chuck, weight receiver, etc., is essential. To achieve the above goal, the rod, shaft, chuck, etc., were connected with pins, and the shaft and weight holder were connected using wire, lead balls, etc.
The pin connection and its function are shown in Figure 3(a) and (b). The pin acts as a free joint, and the angle of the connected shaft and chuck can be changed freely. As shown in Figure 3(b), if the rod, shaft, and chuck are integrated rather than pin-connected, the rod axis is not in the vertical direction. This, in turn, suggests that loadings will be applied vertically while the shear force will be applied to the cross section of the gauge portion of the specimen. In contrast, in the case of a pin connection, each axis coincides when loadings are applied identically, and alignment is achieved, clearly confirming that shear stresses cannot be generated on the cross-section of the gauge portion of the specimen, as only the tensile force is applied along the vertical direction.

Schematic illustration of a pin connection: (a) Side and front view, and (b) Function for avoiding shear loading.
The conventional connection between the shaft and the weight holder was to hang the weight holder by fastening wires on both sides of the shaft, as shown on the left side of Figure 4. However, with the same structure, the weight holder tends to shift with respect to the axis of the shaft, indicating that alignment is difficult to achieve. Therefore, connecting the shaft and weight holder via lead balls and oval sleeves using wire was proposed, as shown on the right side of Figure 4, by which alignment is easy to achieve. When loading is applied, the lead ball slides into the tapered shape, automatically aligning the axes. Furthermore, the used wires were stainless steel with a diameter of Φ0.72 mm. The used wires need to be flexible so that axes alignment can be achieved when loading is applied. Previously, the use of stranded wires was considered because it has both flexibility and strength; however, stranded wires would unravel and cause the weight to rotate. Therefore, as shown in Figure A1, weights were sandwiched between the strings, and when the weights rotated, the tensile loading along the string prevented further rotation, but twisting deformation occurred in the specimen. Therefore, to prevent weight rotation, a single stainless steel wire with a diameter of Φ0.72 mm was used.

The connection of the shaft and weight plate with alignment.

Shape and dimensions of (a) Specimen A and (b) Specimen B. Illustration of alignment for (c) Specimen A and (d) Specimen B.
2.4 Specimen design
Two types of specimens were designed in the present study, and their shapes and dimensions are displayed in Figure 5(a) and (b). For specimen A, the total length, gauge length, and thickness are 14, 7, and 2 mm, respectively. In contrast, the total length, gauge length, and thickness of specimen B, which was first proposed in the study of Takahashi et al. [24], are 10, 5, and 0.5 mm, respectively. Moreover, the widths of the gauge sections for the two specimens are 1 and 2 mm, and the shoulder portions of specimens A and B were designed to be T- and tapered-shaped, respectively. It should be noted that one of the potential disadvantages of specimen A is that it is difficult to align the axis of the specimen with the axis of the jigs during the setting process. In contrast, this issue can be avoided in specimen B. Nonetheless, it cannot be concluded which type is better prior to conducting FEM analysis.

Established FEM analysis models for specimens (a) A and (b) B.
For the ultraminiature creep test, it is impossible to mount an extensometer or a similar device directly to the gauge portion of the specimen due to size limitations. Therefore, as described in Section 2.1, the creep strain until fracture of an ultraminiature creep specimen can be obtained by measuring the displacement of the shaft connected to the lower side of the specimen using LVDT. However, if the shoulder of the specimen undergoes creep deformation, the obtained creep strain is bound to include both shoulder and gauge deformations, thereby resulting in incorrect creep strain measurements. Therefore, as a test to verify the designed specimens, FEM analysis for creep was conducted by Marc Mentat (2023) to determine which specimen has an effective shape with less deformation in the shoulder portion.
Figure 6 shows the analytical model and boundary conditions for the two designed specimens. The employed material properties are listed in Table 2. The employed material properties were obtained from Norton’s law of another material. By fitting the graph, where abscissa and ordinate indicate applied stress and the minimum creep strain rate, respectively, the used Norton’s law can be acquired. The model of the plane stress element (4 nodes) for specimen A has 1,713 nodes and 1,600 elements, while 4,046 nodes and 3,860 elements are included for specimen B. To load a 180 MPa tensile stress to the gauge sections of the two specimens, edge loadings were used with directions set perpendicular to the shoulder portions.

Mapping of FEM creep analysis for specimens (a) A and (b) B.
FEM creep analysis parameters used
| Young’s modulus | 118 GPa |
| Poisson’s ratio | 0.262 |
| Norton’s law |
|
Figure 7 shows the deformation mapping along the X direction of the gauge and shoulder portions of the two specimens after 300 h of FEM creep analysis. On the basis of Figure 7, it can be observed that the deformation of the gauge portion close to the R portion for specimen A is almost twice that of specimen B at the identical location. It demonstrates that the risk of fracture at the R portion for the former is higher than that for the latter. On the other hand, the deformations of the shoulder portion are extremely different between the two specimens. Deformations along the Y direction (arrows in Figure 7) from the central axis (red dash-dotted line in Figure 7) of specimens are displayed in Figure 8. For specimen A, the deformation of the shoulder portion was approximately 17 times higher than that of the gauge portion. At a location along the Y coordinate of approximately 2 mm, the deformation of the shoulder portion increased drastically, indicating that a large error will be induced when measuring creep strain using LVDT. In contrast, the deformations of both shoulder and gauge portions for specimen B were almost identical, and their values were also significantly low. Thus, on the basis of the above analysis, specimen B was considered to be a more effective specimen. In summary, considering the measurement of creep strain, including large deformation (displacement) for specimen A that leads to large data error, specimen B has been selected for the developed creep testing machine.

Deformations of the gauge and shoulder portions for specimens A and B.

Image of the thermocouple setting location for temperature measurement.
3 Verification of testing results
3.1 Temperature validation
The temperature distribution in the electric furnace is uneven during creep tests. Therefore, to investigate the temperature distribution behaviors at the objective gauge portion, and jig values, temperature-increasing testing was carried out. Figure 9 shows the mounting location of the two thermocouples, where one is mounted at the center of the specimen, and the other is mounted slightly below the lower pin. The objective temperature was set to 700°C and 1000°C, which is identical to that used for conducting the size effect testing.

Temperature validation results at (a) 700°C and (c) 1,000°C. (b) and (d) Enlarged graph of the area enclosed by a rectangle in (a) and (c).
The temperature validation results of the objective temperature of 700°C are shown in Figure 10(a) and (b), where the black, red, and blue symbols indicate the temperature of the gauge portion of the specimen, jig, and set values, respectively. After approximately 1 h, the temperature reached the set value. It can be observed that the temperature-increasing ratios of the gauge and jig portions were identical to those of the set values. Moreover, the magnified graph of the area marked with a green rectangle in Figure 10(a) is shown in Figure 10(b). When the gauge central portion of the specimen reached 700°C, the set temperature was approximately 690°C. In contrast, the temperature of the jig portion was close to 693°C. Using the temperature-increasing test, the difference between the set and gauge temperatures was confirmed. Therefore, for the following tests, the objective temperature was set at 690°C, and the temperature of the gauge portion was also measured for each test. Moreover, temperature validation results at 1,000°C are displayed in Figure 10(c) and (d), in which black and blue plots indicate the temperature of the gauge portion of the specimen and objective values. Similarly, after approximately 1.5 h, the objective setting temperature of 996°C was reached. Meanwhile, the gauge portion of the specimen was heated to 1001.9°C. Although at holding time close to 2.5 h, the temperature of the gauge portion of the specimen was slightly decreased to 999.6°C for a short time and increased again (Figure 10(d)), and taking into account there is a gap between the set and measured temperatures of the gauge portion, it could be considered that carrying out creep tests at 1,000°C is applicable for the developed machine.

Comparison of the results obtained via bulk and ultraminiature specimens: (a) Creep curves and (b) Creep strain rate.
3.2 Size effect test
A size effect exists in the mechanical testing field, which may lead to significant differences in the results obtained by bulk and miniature specimens or specimens of different sizes [25,26]. Thus, to investigate whether there is a size effect between the designed and bulk specimens, validation tests were performed with applied stresses of 150 and 120 MPa at 700°C in air. A bulk specimen with a gauge length of 30 mm and a diameter of 6 mm was used. The material used in this process was AISI 304 austenitic stainless steel, which has excellent mechanical properties and high-temperature resistance [27,28]. In the current study, to avoid the influence of different material batches on test results, both bulk and ultraminiature specimens were manufactured from identical batches.
A comparison of the results is shown in Figure 11. In Figure 11(a), the solid and hollow symbols denote the data tested using ultraminiature and bulk specimens, respectively. For tests with applied stress of 150 MPa, the creep fracture time of the ultraminiature specimen was slightly longer than that of the bulk specimen.

Comparison of results obtained via bulk and ultraminiature specimen: (a) Creep fracture curve, (b) Norton law, and (c) Monkman–Grant law.
Similarly, at an applied stress of 120 MPa, the fracture time obtained from the ultraminiature specimen was slightly shorter than that of the bulk specimen. Moreover, there was no significant difference in the creep fracture strain between the two types of specimens. Thus, it can be confirmed that creep strain measurements using LVDT are applicable to the designed creep testing machine. The variation of creep strain rate, which can be obtained by differentiating creep strain with loading time, is depicted in Figure 11(b). Similarly, only a slight difference was observed between the two specimens. Considering the nature of the scattered data in the creep test, it could be reputed that the creep curves and creep strain rate for the two specimens tested under identical stress levels agree with each other.
To further analyze whether the data obtained were influenced by the size effect, a comparison of the results obtained via bulk and ultraminiature specimens for creep fracture curve, their Norton relationship, and Monkman–Grant relationship is displayed in Figure 12(a)–(c), respectively. In Figure 12(a), as previously described, the creep fracture time for the two specimens tested under the same applied stress can be considered identical. The Norton relationship [29], which can be used to determine the creep deformation mechanism, is shown in Figure 12(b), where the abscissa and the ordinate denote the applied stress and minimum creep strain rate, which can be obtained from Figure 11(b), respectively. The dashed line is the fitting curve of the results tested with a bulk specimen. It can be observed that the ultraminiature tested results fall into the fitting curve, i.e., the Norton relationship for the two specimens matches with each other. In other words, the creep deformation mechanism is identical. Similarly, in the Monkman–Grant relationship [30] (Figure 12(c)), the abscissa and ordinate indicate the minimum creep strain rate and creep fracture time, respectively. The function of the Monkman–Grant relationship is to deduce the creep fracture time when gaining a minimum creep strain rate at a given applied stress level. Similar to Figure 12(b), the dashed line in Figure 12(c) is also the fitting curve of the results acquired via bulk specimens. Data plots of ultraminiature specimens agree with those obtained via bulk specimens. Fracture surface observations were performed after creep tests. Figure 13(a)–(d) represents typical fracture surfaces tested under 150 and 120 MPa. A reduction in the areas for the two fracture surfaces can be observed (Figure 13(a) and (c)). These high magnification images (Figure 13(b) and (d)) demonstrate the formation of dimples, i.e., fracture surfaces behaving with ductile fracture characteristics, which is consistent with the reported results of identical materials tested using bulk specimens. From the above discussion, it could be considered that the size effect on the creep fracture time for the investigated AISI 304 stainless steel has not been observed.

Fracture surface observation under 150 MPa: (a) Overview, (b) High magnification, and 120 MPa; (c) Overview and (d) High magnification.

EDS analysis results of a specimen tested under 120 MPa: (a) Overview of the profile, and (b) and (c) Magnified images marked in (a).
It is also well known that for small-sized specimens, the effective loading-bearing area reduction resulting from oxidation layer growth during creep testing is frequently observed for various materials. This may lead to the development of a gap in the fracture time between small-sized and bulk specimens [31,32]. To survey the oxidation behaviors of the ultraminiature specimen, the oxidation layer of the fractured specimen was observed. Because the oxidation layer grows with increasing heating time, the specimen tested under an applied stress of 120 MPa was selected due to its longer fracture time. Figure 14 shows the results of the energy-dispersive X-ray spectroscopy (EDS) analysis. In Figure 14(a), area 1 is far away from the fracture surface, and the corresponding EDS maps are shown on the right side of Figure 14(b). It can be observed that the thickness of the Cr-rich oxidation layer was approximately 1 μm after exposure for 288 h at 700°C in air. In contrast, a long crack was formed in area 2 because this is a closed fracture surface, and the corresponding EDS map is also shown on the right side of Figure 14(c). The thickness of the Cr-rich oxidation layer in the area was approximately 30 μm, which is induced by oxidation layer cracks during creep deformation. Subsequently, oxygen is allowed to contact the metal surface through these cracks to accelerate the formation of the oxidation layer. This phenomenon was also reported in creep tests using bulk specimens [33]. However, by the above-mentioned analysis, such as creep fracture time, it can be concluded that the oxidation layer rarely affects the creep fracture time of the ultraminiature specimen with AISI 304.
Due to its excellent high-temperature performance, AISI 304 has good oxidation resistance, and size effects are not observed in the material. Notwithstanding, a size effect or oxidation-induced reduction of the loading-bearing area in miniature creep tests has been reported. Thus, investigating the size effect using various materials, such as Ni-based superalloys and ferritic or martensitic heat-resistant steels, is the future goal of the research. Moreover, the improvement of the creep testing machine by adding an Ar gas chamber to prevent a potential decrease in the creep fracture time caused by oxidation is also a future objective.
4 Conclusions
In the current study, a creep testing machine for using ultraminiature specimens was developed. On the basis of the obtained results, the following conclusions can be summarized.
A creep testing machine for ultraminiature specimens was developed. The machine has specifications of a maximum test temperature of 1,200°C, a maximum applied loading of 200 N, and a creep strain measuring system that uses two LVDTs. In addition, the special structures of initial loading reduction and alignment were designed.
Based on the FEM analysis results, specimen B (sloped shoulders) was superior to specimen A because its deformation during the creep test was less than that of specimen A.
Validation test outcomes indicated that the creep fracture times of ultraminiature specimens were consistent with those obtained via bulk specimens. Through further analysis, data plots obtained from both specimens enabled us to evaluate the Norton and Monkman–Grant relationships using identical fitting curves. Our findings revealed that the creep fracture time of the ultraminiature specimen manufactured from AISI 304 was rarely affected by the dimensions of the specimen.
Considering the creep test and oxidation layer observation results, it can be concluded that the reduction of the oxidation layer growth-induced loading bearing area hardly affected the creep fracture time for AISI 304. However, the investigation of the precise size effect using various materials and the addition of an Ar gas chamber to the creep testing machine are key future works.
-
Funding information: Authors state no funding involved.
-
Author contributions: L. He: writing – editing draft, investigation, and methodology. T. Itoh: conceptualization, supervision, and writing – review and editing. K. Yoshimura: data curation and investigation. H. Fujiwara: investigation and writing – review and editing. M. K. Ota: methodology and writing – review and editing. All authors have accepted responsibility for the entire content of this manuscript and approved its submission.
-
Conflict of interest: Authors state no conflict of interest.
-
Data availability statement: All data generated or analyzed during this study are included in this published article.
Appendix

The torsional deformation for specimen by string tension.
References
[1] He L, Yong W, Fu H, Itoh T. Fatigue life evaluation model for various austenitic stainless steels at elevated temperatures via alloy features-based machine learning approach. Fatigue Fract Eng Mater Struct. 2023;46:699–714. 10.1111/ffe.13895.Search in Google Scholar
[2] Xu L, Wang R, He L, Zhang X, Tu S, Miura H, et al. Establishment of unified creep–fatigue life prediction under various temperatures and investigation of failure physical mechanism for Type 304 stainless steel. Fatigue Fract Eng Mater Struct. 2022;45:3086–101. 10.1111/ffe.13794.Search in Google Scholar
[3] Gu H, Wang R, Tang M, Zhang X, Tu S. Data-physics-model based fatigue reliability assessment methodology for high-temperature components and its application in steam turbine rotor. Reliab Eng Syst Saf. 2024;241:109633. 10.1016/j.ress.2023.109633.Search in Google Scholar
[4] Wen J, Tu S. A multiaxial creep-damage model for creep crack growth considering cavity growth and microcrack interaction. Eng Fract Mech. 2014;123:197–210. 10.1016/j.engfracmech.2014.03.001.Search in Google Scholar
[5] Wen J, Tu S, Xuan F, Zhang X, Gao X. Effects of stress level and stress state on creep ductility: Evaluation of different models. J Mater Sci Technol. 2016;32:695–704. 10.1016/j.jmst.2016.02.014.Search in Google Scholar
[6] Sposito G, Ward C, Cawley P, Nagy PB, Scruby C. A review of non-destructive techniques for the detection of creep damage in power plant steels. NDT&E Int. 2010;43:555–67. 10.1016/j.ndteint.2010.05.012.Search in Google Scholar
[7] Jalali SIA, Jayaram V, Kumar P. Creep micromechanics in meso-length scale samples. Acta Mater. 2021;205:116535. 10.1016/j.actamat.2020.116535.Search in Google Scholar
[8] Matsubara N, Sakane M, Itoh T, Kosaka R. Creep damage evaluation via uniaxial miniature testing for multiaxially stressed Mod.9Cr–1Mo steel components. Int J Press Vessel Pip. 2021;194:104518. 10.1016/j.ijpvp.2021.104518.Search in Google Scholar
[9] Zhang W, Wang X, Chen H, Zhang T, Gong J. Microstructural damage mechanics-based model for creep fracture of 9%Cr steel under prior fatigue loading. Theor Appl Fract Mech. 2019;103:102269. 10.1016/j.tafmec.2019.102269.Search in Google Scholar
[10] Xiao B, Xu L, Zhao L, Jing H, Han Y, Zhang Y. Creep properties, creep deformation behavior, and microstructural evolution of 9Cr-3W-3Co-1CuVNbB martensite ferritic steel. Mater Sci Eng A. 2018;711:434–47. 10.1016/j.msea.2017.11.061.Search in Google Scholar
[11] Wu X, Wollgramm P, Somsen C, Dlouhy A, Kostka A, Eggeler G. Double minimum creep of single crystal Ni-base superalloys. Acta Mater. 2016;112:242–60. 10.1016/j.actamat.2016.04.012.Search in Google Scholar
[12] Ravia S, Vanaja J, Vijayanand D, Rajasundaram P, Vijayaraghavan S, Shanmugavel M, et al. Creep deformation and fracture behaviour of modified 9Cr-1Mo steel in flowing liquid sodium environment. Mater Sci Eng A. 2017;702:232–40. 10.1016/j.msea.2017.07.004.Search in Google Scholar
[13] Sahoo KC, Goyal S, Parameswaran P, Ravi S, Laha K. Assessment of creep deformation, damage, and rupture life of 304HCu austenitic stainless steel under multiaxial state of stress. Metall Mater Trans A. 2018;49A:881–98. 10.1007/s11661-017-4459-1.Search in Google Scholar
[14] Ni T, Dong J. Creep behaviors and mechanisms of Inconel718 and Allvac718plus. Mater Sci Eng A. 2017;700:406–15. 10.1016/j.msea.2017.06.032.Search in Google Scholar
[15] Meng Q, Wang Z. Creep damage models and their applications for crack growth analysis in pipes: A review. Eng Fract Mech. 2019;205:547–76. 10.1016/j.engfracmech.2015.09.055.Search in Google Scholar
[16] Non-destructive evaluation of creep and creep-fatigue damage/lives of heat-resisted steels by replication method. Report of committee on reliability evaluation of structural materials, iron and steel institute of Japan. Vols. 3–13. The Iron and Steel Institute in Jpn; 1991.Search in Google Scholar
[17] Raj B, Moorthy V, Jayakumar T, Rao KBS. Assessment of microstructures and mechanical behaviour of metallic materials through nondestructive characterization. Int Mater Rev. 2003;48:273–325. 10.1179/095066003225010254.Search in Google Scholar
[18] Dobmann G, Meyendorf N, Schneider E. Nondestructive characterization of materials A growing demand for describing damage and service-life-relevant aging processes in plant components. Nucl Eng Des. 1997;171:95–112. 10.1016/S0029-5493(96)01319-2.Search in Google Scholar
[19] Kadoya Y, Goto T, Date S, Yamauchi T, Saida T, Sada T. Assessment of remaining life of fossil power plant parts by means of a miniature creep rupture test. ISIJ Int. 1990;30(10):854–61. 10.2355/isijinternational.30.854.Search in Google Scholar
[20] Hyde TH, Sun W, Williams JA. Requirements for and use of miniature test specimens to provide mechanical and creep properties of materials: A review. Int Mater Rev. 2007;52(4):213–55. 10.1179/174328007X160317.Search in Google Scholar
[21] Camin B, Gille M. The effect of specimen size and test procedure on the creep behavior of ME21 magnesium alloy. Crystals. 2021;11(8):918. 10.3390/cryst11080918.Search in Google Scholar
[22] Steve N, Evy DB, Fabien T. Evaluation of miniature creep testing technique for remaining life assessment of power generation components. Conference: 3rd International ECCC Creep & Fracture Conference. 2014.Search in Google Scholar
[23] Kanaya A, Tsurui T, Kusumoto J, Watanabe H, Murata K. Creep characterization of 12Cr steel and 2.25Cr steel by using miniature specimen. Jpn Soc Mech Eng (JSME). 2013;79(799):253–7. 10.1299/jsmepes.2012.17.133. In Japanese.Search in Google Scholar
[24] Takahashi K, Hisaka C, Kosuge K, Nitta A, Yaguchi M. Development of ultra-miniature creep testing method. J Soc Mater Sci, Jpn (JSMS). 2022;71(4):381–7. 10.2472/jsms.71.381. In Japanese.Search in Google Scholar
[25] He L, Wang Z, Akebono H, Sugeta A. Machine learning-based predictions of fatigue life and fatigue limit for steels. J Mater Sci Technol. 2021;90:9–19. 10.1016/j.jmst.2021.02.021.Search in Google Scholar
[26] Nonaka I. Activities to advanced residual life evaluation techniques for highly aged power boiler materials. J Soc Mater Sci, Jpn (JSMS). 2023;72(6):406–12. 10.2472/jsms.72.406. In Japanese.Search in Google Scholar
[27] Xu L, Wang J, Wang R, He L, Itoh T, Miura H, et al. On multiaxial creep–fatigue considering the non-proportional loading effect: Constitutive modeling, deformation mechanism, and life prediction. Int J Plast. 2022;155:103337. 10.1016/j.ijplas.2022.103337.Search in Google Scholar
[28] Xu L, Wang R, Wang Y, He L, Itoh T, Suzuki K, et al. Microstructural evolutions and life evaluation of non-proportional creep-fatigue considering loading path and holding position effects. Mater Charact. 2023;204:113209. 10.1016/j.matchar.2023.113209.Search in Google Scholar
[29] Norton FH. The creep of steel at high temperatures. London: McGrawHill; 1929.Search in Google Scholar
[30] Monkman FC, Grant NJ. An empirical relationship between rupture life and minimum creep rate. Proceedings of the ASTM3. Vol. 56. 1956. p. 593–605.Search in Google Scholar
[31] Mazrouee A, Singh RK. High temperature oxidation of Cr-Mo steels in the context of accelerated rupture testing for creep life prediction. J Press Vessel Technol. 2007;129(3):454–9. 10.1115/1.2748826.Search in Google Scholar
[32] Bueno LO, Marino L. High-temperature oxidation behavior of 2 1/4Cr-1Mo steel in air–part 2: Scale growth, metal loss kinetics, and stress enhancement factors during creep testing. J Press Vessel Technol. 2001;123(1):88–96. 10.1115/1.1335499.Search in Google Scholar
[33] Pei H, Li M, Wang P, Yao X, Wen Z, Yue Z. The effect of tensile stress on oxidation behavior of nickel-base single crystal superalloy. Corros Sci. 2021;191:109737. 10.1016/j.corsci.2021.109737.Search in Google Scholar
© 2025 the author(s), published by De Gruyter
This work is licensed under the Creative Commons Attribution 4.0 International License.
Articles in the same Issue
- Research Articles
- Probing microstructural evolution and surface hardening of AISI D3 steel after multistage heat treatment: An experimental and numerical analysis
- Activation energy of lime cement containing pozzolanic materials
- Optimizing surface quality in PMEDM using SiC powder material by combined solution response surface methodology – Adaptive neuro fuzzy inference system
- Experimental study of the mechanical shear behaviour of steel rebar connectors in timber–concrete structure with leafy wood species
- Development of structural grade lightweight geopolymer concrete using eco-friendly materials
- An experimental approach for the determination of the physical and mechanical properties of a sustainable geopolymer mortar made with Algerian ground-granulated blast furnace slag
- Effect of using different backing plate materials in autogenous TIG welding on bead geometry, microhardness, tensile strength, and fracture of 1020 low carbon steel
- Uncertainty analysis of bending response of flexoelectric nanocomposite plate
- Leveraging normal distribution and fuzzy S-function approaches for solar cell electrical characteristic optimization
- Effect of medium-density fiberboard sawdust content on the dynamic and mechanical properties of epoxy-based composite
- Mechanical properties of high-strength cement mortar including silica fume and reinforced with single and hybrid fibers
- Study the effective factors on the industrial hardfacing for low carbon steel based on Taguchi method
- Analysis of the combined effects of preheating and welding wire feed rates on the FCAW bead geometric characteristics of 1020 steel using fuzzy logic-based prediction models
- Effect of partially replacing crushed oyster shell as fine aggregate on the shear behavior of short RC beams using GFRP rebar strengthened with TRC: Experimental and numerical studies
- Micromechanic models for manufacturing quality prediction of cantula fiber-reinforced nHA/magnesium/shellac as biomaterial composites
- Numerical simulations of the influence of thermal cycling parameters on the mechanical response of SAC305 interconnects
- Impact of nanoparticles on the performance of metakaolin-based geopolymer composites
- Enhancing mechanical and thermal properties of epoxy-based polymer matrix composites through hybrid reinforcement with carbon, glass and steel
- Prevention of crack kinetic development in a damaged rod exposed to an aggressive environment
- Ideal strain gauge location for evaluating stress intensity factor in edge-cracked aluminum plates
- Experimental and multiscale numerical analysis of elastic mechanical properties and failure in woven fabric E-glass/polyester composites
- Optimizing piezoelectric patch placement for active repair of center-cracked plates
- Experimental investigation on the transverse crushing performance of 3D printed polymer composite filled aluminium tubes
- Review Articles
- Advancing asphaltic rail tracks: Bridging knowledge gaps and challenges for sustainable railway infrastructure
- Chemical stabilization techniques for clay soil: A comprehensive review
- Development and current milestone of train braking system based on failure phenomenon and accident case
- Rapid Communication
- The role of turbulence in bottom-up nanoparticle synthesis using ultrafast laser filamentation in ethanol
- Special Issue on Deformation and Fracture of Advanced High Temperature Materials - Part II
- Effect of parameters on thermal stress in transpiration cooling of leading-edge with layered gradient
- Development of a piezo actuator-based fatigue testing machine for miniature specimens and validation of size effects on fatigue properties
- Development of a 1,000°C class creep testing machine for ultraminiature specimens and feasibility verification
- Special Issue on Advances in Processing, Characterization and Sustainability of Modern Materials - Part II
- Surface integrity studies in microhole drilling of Titanium Beta-C alloy using microEDM
- Experimental investigation on bacterial concrete by using Cantabro loss and UPV
- Influence of gas nitriding on the surface layer of M50 NiL steel for aerospace-bearing applications
- Experimental investigation on the spectral, mechanical, and thermal behaviors of thermoplastic starch and de-laminated talc-filled sustainable bio-nanocomposite of polypropylene
- Synthesis and characterization of sustainable hybrid bio-nanocomposite of starch and polypropylene for electrical engineering applications
- Microstructural and mechanical characterization of Al6061-ZrB2 nanocomposites fabricated by powder metallurgy
- Effect of edge preparation on hardness and corrosion behaviour of AA6061-T651 friction stir welds
- Mechanical improvement in acetal composites reinforced with graphene nanotubes and Teflon fibers using loss functions
- Experimental investigation on the mechanical properties of aluminum-based metal matrix composites by the squeeze casting method
- Investigation on punch force–displacement and thickness changes in the shallow drawing of AA2014 aluminium alloy sheets using finite element simulations
- Influence of liquid nitriding on the surface layer of M50 NiL steel for bearing applications
- Mechanical and tribological analyses of Al6061-GO/CNT hybrid nanocomposites by combined vacuum-assisted and ultrasonicated stir casting method
- Strengthening of structures with bacterial concrete for effective crack repair and durability enhancement
- Unique approaches in developing novel nano-composites: Evaluating their mechanical and tribological characteristics
- Load-carrying capacity of highly compact rigid deployable booms
- Investigating the influence of SiC and B4C reinforcements on the mechanical and microstructural properties of stir-casted magnesium hybrid composites
- Evaluation of mechanical and performance characteristics of bitumen mixture using waste septage ash as partial substitute
- Mechanical characterization of carbon/Kevlar hybrid woven 3D composites
- Development of a 3D-printed cervical collar using biocompatible and sustainable polylactic acid
- Mechanical characterization of walnut shell powder-reinforced neem shell liquid composite
- Special Issue on Structure-energy Collaboration towards Sustainability Societies
- Effect of tunneling conductivity of CNTs on the EMI shielding effectiveness of nanocomposite in the C-band
- Evaluation of the effect of material selection and core geometry in thin-walled sandwich structures due to compressive strength using a finite element method
- Special Issue on Sustainability and Development in Civil Engineering - Part III
- The optimum reinforcement length for ring footing resting on sandy soils resisting inclined load
- Special Issue on Advanced Materials in Industry 4.0
- Cross-dataset evaluation of deep learning models for crack classification in structural surfaces
- Mechanical and antibacterial characteristics of a 3D-printed nano-titanium dioxide–hydroxyapatite dental resin-based composite