Development of structural grade lightweight geopolymer concrete using eco-friendly materials
-
Nithya Swaminathan
 ,
Veerabadrasamy Arularasi
,
Veerabadrasamy Arularasi

Abstract
Geopolymer lightweight concrete has been produced using environmentally sustainable materials by completely replacing conventional concrete with ground granulated blast furnace slag (GGBFS) as the binder, manufactured sand as the fine aggregate, and CS as coarse aggregate. The CS are used as a full replacement for natural coarse aggregate in geopolymer concrete (GPCSC) and are compared with the geopolymer concrete containing 100% crushed granite (natural coarse aggregate) used in a control mix (GPCC). The GGBFS binder was activated with sodium silicate (Na2SiO2) and sodium hydroxide (NaOH) as alkaline activator solutions (Na2SiO2/NaOH) with the ratio of 2.5 was taken, and the concentration of NaOH was maintained at 10M for all mixes. The mechanical and microstructural properties of CS concrete were compared with the control mix. Flexural strength, split tensile strength (STS), ultrasonic pulse velocity, bond strength, impact resistance, and elastic modulus of the geopolymer concrete were measured at 28 days, while the compressive strength of the geopolymer concrete was measured at 3, 7, and 28 days under concealed curing at an ambient temperature. Relevant Indian and ASTM standards were used to measure all the above properties. The microstructure analysis shows that the presence of CS weakens the strength of the mix and the structure of the interfacial transition zone. On the contrary, due to the alkali-activated GGBFS binder in geopolymer concrete, the matrix homogeneity improved due to the formation of a three-dimensional aluminosilicate network. Test results show that the compressive strength, STS, flexural strength, bond strength, impact resistance, ultrasonic pulse velocity, and elastic modulus of geopolymer coconut shell concrete (GPCSC) satisfy the structural criteria and can be used as structural-grade lightweight concrete. A comparison was made between conventional geopolymer concrete (GPCC) and lightweight GPCSC in terms of their behaviour with previous literature studies. The findings indicate that GPCSC can be utilized as a structural-grade geopolymer lightweight concrete, offering promising mechanical properties and reduced density.
Graphical abstract

1 Introduction
Concrete is a combination of aggregates bound together with a cementitious paste, making it a popular choice in construction due to its versatility, ease of moulding, strength, durability, and the ready availability of its components. With an estimated global consumption of 25 billion tonnes per year [1], concrete is the second most used material in the world, following water. However, this widespread use results in substantial greenhouse gas emissions [2,3,4], primarily due to the production of cement, which releases about one tonne of CO2 per tonne of cement produced.
To mitigate this environmental impact, researchers are focusing on developing and implementing more sustainable materials. This involves using more waste materials, conserving resources, and reducing energy consumption. A significant strategy for achieving sustainable construction is to eliminate the use of virgin materials, especially cement, in concrete production.
One promising solution is geopolymer concrete, which completely removes the need for traditional cement with by-products such as fly ash (FA), palm oil fuel ash (POFA), ground granulated blast furnace slag (GGBS), coconut shell powder, metakaolin and water with alkaline activator [5,6,7,8,9,10,11]. Geopolymer concrete produced using alternative binding agents significantly reduces CO2 emissions, offering a more environmentally friendly option for construction [12,13]. To produce geopolymer concrete fine and coarse aggregate can be used as the same as conventional concrete.
Also, light-weight geopolymer concrete can be developed by modifying the characteristics of concretes using alternative materials and replacing or adding materials in concrete. Lightweight concrete (LWC) is a special concrete with lower density than ordinary concrete. Among LWC’s many benefits are their low dead weights, strong insulation, and fire resistance [14]. LWC has a weight density of 300–1,850 kg/m3 [15] or no more than 2,200 kg/m3 as specified by BS EN 1992-1-1 [16].
Geopolymer production process can be divided into two major steps. The first step is mixing the components in proper proportion depending on the strength needed, which includes mixing of binder, fine aggregate, coarse aggregate, and alkaline activators. The second step is heat curing. The heat-curing process generally changes the environmental profile of the geopolymer significantly. A mix containing binder such as fly ash or other slowly reacting raw material binder requires heat treatment mainly to enhance the maturity of the geo polymers [17,18,19,20,21,22]. However, heat curing is not necessary for all binders. Specifically for slag-rich geopolymer, composites achieve their desired technical properties within a few hours or days at room temperature without any heat curing. The overall mechanism of geopolymerisation is established by three major phases: (a) dissolution of silica and alumina in a highly alkaline environment, (b) coagulation and gelation of dissolved oxide minerals, (c) formation of the 3D network (silico-aluminates structures). The resulting chemical bond facilitates the three predominant structures found in the 3D aluminosilicate network. The predominant structures are characterised to be poly (sialate), poly(sialate-siloxo), and poly(sialate- disiloxo) [7,8].
There is a large depletion of river sand due to the extensive use of conventional concrete. Extraction of river sand from river beds causes a lot of environmental impact, which includes loosing water retaining sand strata, deepening of the river courses and causing bank slides, loss of vegetation on the bank of rivers, exposing the intake well of water supply schemes, disturbs the aquatic life as well as affecting agriculture due to lowering the underground water table, etc. [23]. Many research studies have been done in the past two decades for the partial and full replacement of natural river sand, e.g. sugarcane bagasse ash, slag lime stone, quarry dust, siliceous stone powder, etc. However, quality is the major concern in using these materials. Manufactured sand is considered to be one of the best alternatives for replacing river sand since it is manufactured in a controlled environment [23,24].
A lot of agro-waste materials like date seed, oil palm shell, rubber seed, corn cub, coconut shells (CS) and periwinkle seed were used as alternatives for conventional aggregate based on the availability in the country. “Indonesia, Philippines and India are the main three producers of coconut and they account for 75% of total world production” [2]. Among which, India is the third largest country in the production of coconut in the total world’s coconut production. Disposal of this abundant available CS generated from the local coconut industries creates an undesirable effect on the land, causing a huge environmental impact [25]. Utilization of these CS in the construction industry will solve the environmental problem thereby reducing solid waste. Also, in developing countries like India, a lot of research is going on by using these CS as partial or full replacement of coarse aggregate since unit-weight of concrete is less because of the unit mass of CS used in the mixture [23].
The mechanical properties, bond between concrete and reinforcement, shrinkage and deflection of floor slabs, properties of coir concrete (CSC) beams under flexure, shear, torsion, absorption of water, sorptivity, pore voids quantity, chloride penetration, salt-ponding test, elevated temperature resistance, modulus of elasticity [24,25,26,27], stress block, modulus of rupture, and modulus of elasticity [29,30,31,32,33] of CSC are all almost within the range in comparison to conventional concrete produced with similar strength. Also, it is possible to produce some other elements like pipes, flooring tiles, hollow blocks, paver blocks, and manhole cover slabs [34,35,36]. Physical, chemical, mechanical, bond, stress–strain behaviour, and durability properties were detailed already in the past publication to produce structural grade concrete of M20 – M25.
From these, it is very clear that the CS is one of the sustainable alternatives for conventional stone aggregate in the production of concrete. Not only that, it also renders the advantage that the weight of the concrete is lesser, which leads to the production of LWC and reduces the cost of production since CS is considered as landfill waste. CS end up green building materials instead of filling landfills.
The use of CS in structural grade concrete will have the benefits of reduction in the cost of construction material, as an alternative for conventional coarse aggregate, and also as a means of disposal of wastes. Since geopolymer can be produced with different raw materials at variable process conditions to achieve different properties, which make them suitable for various applications. Careful raw material selection should focus both on solid and liquid components to improve the profile of the geopolymer. Since CS is readily and abundantly available, cheap as well as possesses less density, it can be used as an aggregate in the production of geopolymer concrete by increasing the percentage of CS coarse aggregate to arrive at M20 grade concrete [37]. So, there is a great need to study and understand the performance of the geopolymer systems with the traditional system.
The aim of this investigation is to compare the mechanical and microstructural properties of geopolymer lightweight CS concrete with the control mix using gravel or crushed granite as coarse aggregate. Flexural strength, split tensile strength (STS), ultrasonic pulse velocity, bond strength, impact resistance, and elastic modulus of the geopolymer concrete are measured at 28 days, while compressive strength of above geopolymer concrete is measured at 3, 7, and 28 days and the same were compared with the previous study with oil palm shell which possesses the similar property of CS geopolymer concrete [38,39,40]. This knowledge would be beneficial for the future application of geopolymer lightweight CS concrete in the construction industry.
2 Materials and methods
Materials used and methodologies followed in this study are described and discussed in this section.
2.1 Ingredients
Lightweight geopolymer concrete was produced in this investigation using geopolymer concrete derived from ground granulated blast furnace slag (GGBFS), manufactured sand (M-sand), and crushed CS. Conventional geopolymer concrete used with crushed stone aggregate (CSA) was also produced for comparative study. The chemical composition of GGBFS, M-sand, CS, and CSA was determined using X-ray photoelectron spectroscopy, and the corresponding results are provided in Table 1. The sum of the chemical composition CaO, SiO2, and MgO present in GGBFS was found to be around 81%, which is responsible for strength development. The remaining percentage contained Al2O3, MgO, and minimal amounts that included extra oxides. Active constituents, including CaO, SiO2, and Al2O3, are discernible in GGBFS, M-sand, CSA, and CGA. The characteristics of the materials utilised are outlined in Table 2. GGBFS has a specific gravity of 2.65, a specific surface area of 4,280 cm2/g, and a maximum particle size of 12.3 µm (Table 2). The SiO2 and Al2O3 content in the binder (Table 1) is the main factor that contributes to the properties and strength development pattern of geopolymers. Using this binder with high levels of reactive oxides helps to produce high-strength geopolymer concrete.
Chemical composition of GGBFS, M-sand (fine aggregate), CS, and crushed granite (coarse aggregate) [37]
| Chemical Composition | Al2O3 | CaO | SiO2 | Na2O | MgO | SO3 | P2O5 | K2O |
|---|---|---|---|---|---|---|---|---|
| GGBFS | 13.70 | 45.83 | 32.52 | 00.25 | 03.27 | 01.80 | 00.04 | 00.48 |
| M-sand | 15.11 | 44.71 | 33.77 | – | 00.21 | – | – | – |
| CS | 05.75 | 63.11 | 20.70 | 00.60 | 01.89 | 02.75 | 00.05 | 00.15 |
| Crushed granite | 16.38 | 35.47 | 30.48 | – | 05.06 | 01.43 | 00.09 | 01.73 |
| Chemical composition | TiO 2 | MnO | Fe 2 O 3 | SrO | Cl | Cr 2 O 3 | NiO | LOI |
|---|---|---|---|---|---|---|---|---|
| GGBFS | 00.73 | 00.35 | 00.76 | 00.08 | 00.02 | — | — | 00.60 |
| M-sand | — | — | 00.36 | — | — | — | 05.84 | |
| CS | — | 00.20 | 02.50 | — | — | — | 02.30 | |
| Crushed granite | 00.26 | 00.06 | 02.05 | — | — | 0.008 | 0.004 | 6.978 |
Properties of materials used
| Properties | Compacted bulk density (kg/m3) | Maximum size | Specific gravity | Fineness modulus (%) | Specific surface area (cm2/g) | Water adsorption (%) | Aggregate impact value (%) |
|---|---|---|---|---|---|---|---|
| GGBFS | — | 12.3 µm | 2.65 | — | 4,280 | — | — |
| M-sand | 1,520 | 4.75 mm | 2.60 | 2.70 | — | 2.25 | — |
| CS | 650 | 12.5 mm | 1.15 | 6.11 | — | 22.00 | 8.15 |
| Crushed granite | 1,670 | 12.5 mm | 2.82 | 6.93 | — | 0.50 | 6.23 |
M-sand is extracted from local quarries near Chennai, Tamil Nadu, India. India. Sieve analysis was performed in accordance with IS 383:2016 [41] and ASTM C136 standards [42]. M-sand exhibits a dimensional variation with the following percentage passing through various sieves: 99% for the 4.75 mm sieve, 87% for the 2.36 mm sieve, 58% for the 1.18 mm sieve, 38% for the 0.6 mm sieve, 21% for the 0.30 mm sieve, and 6% for the 0.15 mm sieve. Based on these measurements, M-sand is classified as Zone II, indicating a medium grading that is suitable for various concrete applications.
Coconut husks are collected in the coconut industry in Erode district, Tamil Nadu, India. Scrap the raw CS using a shredder designed for shredding CS equipment (Figure 1). After CS is crushed, pass through a 12.5 mm sieve and be used as coarse aggregate. For coarse aggregate, CS and crushed granite with dimensions smaller than 12.5 mm and shell thickness of 8–10 mm have been used. The particle size distribution of CS and crushed granite is illustrated in Figure 1. Shredded CS has higher impact strength values (8.15%) and lower bulk density (650 kg/m3).

(a) Coconut shell aggregate preparation process. (b) Particle size distribution of CS and crushed granite stone aggregate (b to be drawn and added).
2.2 Alkaline activators
By combining sodium hydroxide (NaOH) solution with 10M and sodium silicate (Na2O, 13%; SiO2, 30%; and water, 57% by mass: Na2SiO3), an alkaline activator was produced for use in geopolymer conventional concrete (GPCC) and geopolymer coconut shell concrete (GPCSC). The NaOH and Na2SiO2 have been employed at a weight ratio of 1:2.5. Figure 2 presents a flow chart of the components needed to create GPCC and GPCSC.

Methodology of – GPCC and GPCSC concrete.
2.3 Mix proportion
The design of geopolymer concretes is subject to limited code regulations. When novel ingredients are introduced, there are no precise methodologies available for the design of concrete mixes; instead, trial mixes are typically used to establish the design [36]. Due to their disparate qualities, the ACI and IS techniques could not be used to develop a concrete mix that included agro-waste components [36,38]. All mixtures were initially formulated with volume proportions and then converted to weight quantities due to the fact that the performance of the mixtures can differ based on factors such as particle size, density, specific gravity, and percentage of void content of the components. The CS-to-CGA ratio was maintained throughout the creation of the control mixture. For this inquiry, more than 50 trial mixes were made with the goal of improving the use of CS as coarse aggregate and achieving the strength of concrete grade M20–M25. Table 3 lists a few trial mixes along with the mix proportions and other information. It was discovered that using CS% above the ratio of 1:2.97:1.50 caused increased segregation and incorrect bonding and was therefore not taken into consideration. From the other mixes provided in Table 3, Mix M5 for GPCC and M11 for GPCSC mix were selected for further studies since these mixes were seems to be homogeneous and no segregations were found.
Mix proportion samples for optimization
| Sample mixes | Mix | Binder ratio | compressive strength (MPa) (28 days) |
|---|---|---|---|
| GPCC | |||
| M1 | 1:2.97:4.33 | (10M/0.65) | 42 |
| M2 | 1:3.63:4.33 | (10M/0.65) | 40 |
| M3 | 1:4.40:4.33 | (8M/0.65) | 28 |
| M4 | 1:4.15:3.56 | (12M/0.65) | 43 |
| M5 | 1:4.15:3.56 | (10M/0.65) | 33 |
| GPCSC | |||
| M6 | 1:2.97:1.50 | (10M/0.35) | 12 |
| M7 | 1:2.97:1.50 | (10M/0.45) | 18 |
| M8 | 1:2.97:1.20 | (10M/0.45) | 23 |
| M9 | 1:2.53:1.07 | (10M/0.55) | 28 |
| M10 | 1:2.53:1.07 | (10M/0.65) | 29 |
| M11 | 1:2.53:1.05 | (10M/0.65) | 32 |
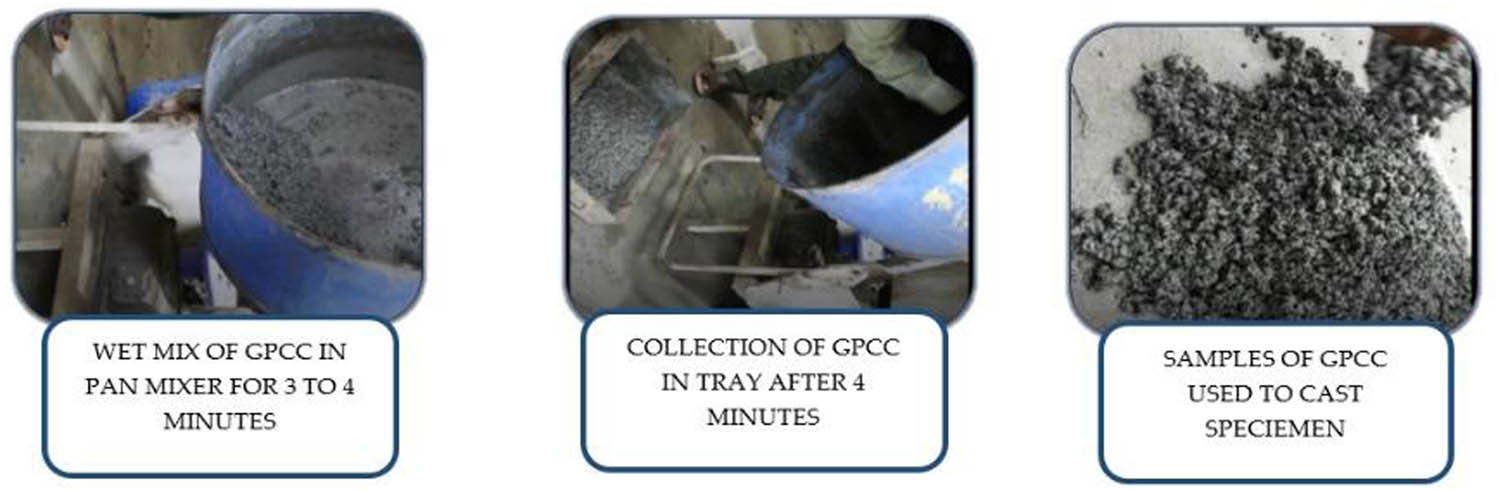
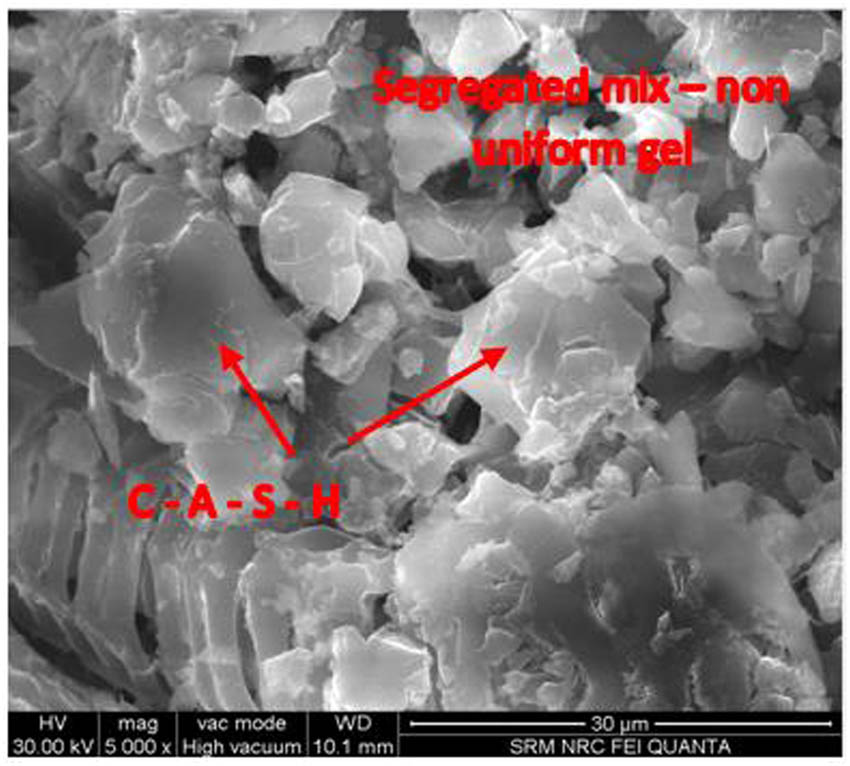
Figure 3 shows the mixing of GPCC in a pan mixer, transfer of mix on a tray, and final prepared GPCC mix (M5), which was ready for cast. Similarly, Figure 4 shows the mixing of GPCSC in a pan mixer, transfer of mix on a tray, and final prepared GPCSC mix (M11), which was ready for cast. Scanning electron microscopy (SEM) images of mixes M7 and M11 of GPCSC were acquired to examine the segregation and production of C–A–S–H gel as a result of the generation of a pozzolanic/alkali-activated reaction [37,38,39]. These images are shown in Figures 5 and 6, respectively. Figure 6 depicts the homogeneous and dense packing of mix M11, while Figure 5 clearly depicts the segregated and inappropriate bonding with air gaps present in mix M7. It is obvious that the compatibility of the mixes created for GPCSC is mainly due to CS and binder ratio impact. Figure 7 gives the proportion of ingredients used in GPCC and GPCSC.
Mix 5 –Mix with crushed granite as coarse aggregate.

Mix 11 – Mix with CS as coarse aggregate.
Mix 7 – SEM.

Mix 11 – SEM.

(a) Ingredients used for GPCC mix M5. (b) Ingredients used for GPCSC mix M11.
2.4 Mixing, casting, and curing
The GGBS binder was added after aggregates had been thoroughly mixed in the machine, which took around 5 min. Alkaline activators were then added, and mixing lasted for an additional 4 min after that. For the GPCC and GPCSC mixes, the alkaline solution/binder ratio of 0.65 was maintained. The freshly mixed concrete was transferred into the respective moulds and kept on a table vibrator to remove air voids and to achieve a dense pack. Following the guidelines of ASTM C171-16 [43], the specimens were protected with plastic sheets immediately after being formed. After a period of 24 h, the specimens were removed from the moulds and subsequently covered with polythene until the testing date.
2.5 Microscopic analysis
For microscopic investigation, all samples were collected at 28 days of age to assess and forecast the weight variation, chemical composition, phase compositions, and morphology of both GPCC and GPCSC concretes. The GPCC and GPCSC samples were subjected to X-ray diffraction (XRD), Fourier-transform infrared spectroscopy (FTIR), SEM, and thermogravimetry in conjunction with energy-dispersive spectroscopy.
2.6 Slump test
In this study, the slump test was conducted following ASTM C143 [44] and IS1199:1959 standards [45]. Figure 8 demonstrates the procedure for measuring slump value, which serves as an indicator of the workability of fresh concrete. It is important to note that the slump test was carried out on two types of concrete: one containing crushed granite as aggregate and another using CS as coarse aggregate.

Slump test.
2.7 Experimental programme
In this study, several concrete properties were tested: workability, compressive strength, splitting tensile strength, flexural strength, impact resistance, elastic modulus, stress–strain behaviour, bond strength, and ultrasonic pulse velocity. The standards followed, and the respective calculations for each test are discussed in this section.
The workability of the concrete was measured using a conventional empirical slump test as per IS 1199:1959 and ASTM C14. For compressive strength of concrete, cube specimens 100 × 100 × 100 mm in size were used and tested as per IS 516:1959 [46]. As per ASTM C496-90 [47], 100 mm diameter by 200 mm long cylindrical specimens were used for the splitting tensile strength test. The splitting tensile strength fst of specimens was calculated as follows:
where P is the maximum applied load in Newtons, D is the diameter of the cylinder in mm, and L is the length of the cylinder in mm.
The two-point load method was adopted to measure the flexural strength of the specimen as per ASTM C78-84 [48]. Prisms 100 × 100 × 500 mm in size were used to find the flexural strength and tested as per IS 516:1959 [46]. The modulus of rupture ft of concrete specimens was calculated using the following equation:
where P is the maximum applied load in Newton, L is the supported length of the prism in mm, B is the breadth of the prism in mm, and D is the depth of the prism in mm.
As per ACI 544.1R-96 [49], specimens 152.40 mm thick and 63.5 mm in diameter were used for impact resistance tests. During the test, the number of blows until the first crack appeared on each specimen was counted, and the counting continued until the specimen was completely broken into pieces.
As per ASTM C469-02 [50], cylindrical specimens 100 mm in diameter and 200 mm in height were used for the determination of elastic modulus. This method involves applying compressive load longitudinally to the specimen to calculate the elastic modulus.
Bond strength was determined using the pull-out test, and the specimens were prepared as per ASTM C 234-91 [51]. Cylindrical specimens 100 mm in diameter and 200 mm in length embedded with deformed bars 10, 12, and 16 mm in diameter were used to determine the bond strength. To prepare the specimens for the bond test, each reinforcing bar was embedded in the center of the specimen. The pull-out test was carried out using the universal testing machine with 4,000 kN capacity. One end of the rod was fitted with grips provided in the machine that are vertically movable, and the load was applied by pulling the rod upward from the specimen until the specimen failed. The experimental bond strength fb of the concrete specimens was calculated using the following equation:
where P is the maximum applied load in Newton, D is the diameter of the reinforced bar in mm, and L is the embedded length of the reinforced bar in mm.
Ultrasonic pulse velocity test was used to predict the quality of concrete specimens for density, homogeneity, cracks, and voids. The quality of concrete was analysed as recommended by IS 13311-Part I:1992 [52].
3 Results and discussion
Results obtained on the parameters, formation of hydration products, XRD, FTIR, SEM with EDX, thermogravimetric analysis (TGA), workability, compressive strength, STS, flexural strength, stress–strain behaviour, ultrasonic pulse velocity, bond strength, impact resistance, and modulus of elasticity are discussed in this section.
3.1 Hydrated products
The chemical makeup of the precursor in the mixes determines how hydrated products are formed. Calcium-silicate-hydrate (C–S–H) and calcium-aluminium-silicate-hydrate (C–A–S–H) form as a result of the hydration of a precursor such as GGBFS [40], and these forms are aided by the use of an alkaline activator in the mixes, leading to excellent polymerization (Figure 6) [38].
3.2 XRD analysis
The change in crystallinity of the geopolymer samples at 28 days was examined using XRD. The major components of the initial raw material, XRD patterns, reveal the presence of minerals including calcite, quartz, and mullite, along with the products of hydration. Figure 9 displays the XRD pattern of the GGBS utilised in this study, which reveals an amorphous phase characterised by a broad and diffuse reflection spanning from 25 to 35°. A number of secondary crystalline phases, including Ca2Al2SiO7 (JCPDS 00-034-1236), were also present in the GGBS spectra [38].

XRD – GGBFS.
Figures 10 and 11 show, correspondingly, the XRD patterns of GPCC and GPCSC mixes. In the GPCC and GPCSC, mixtures of alkaline activated elements exhibit the creation of products of reaction. Figures 10 and 11 provide patterns of XRD that illustrate the presence of various reaction products like aluminosilicate and C–S–H gel. It was observed that these products were identical for both GPCC and GPCSC. However, no fresh stages were found. The formation of C–S–H was plainly seen in both mixtures [38].

XRD – GPCC.

XRD – GPCSC.
3.3 FTIR spectra analysis
Both mixtures clearly contained C–S–H [28]. The FTIR spectra of GGBS are shown in Figure 12 with two distinct, highly strong bands of internal vibrations in TO4 tetrahedra (T = Al, Si). Water deformation waves were thought to be the cause of the intensity at 1,635 cm−1 (peak 1) (H–O–H). Peak 2 was located at 966 cm−1, and it was connected to waves of the T–O bond bending and the glass structures of the base material (Si–O). The low wave number indicates that the high calcium concentration in the structure of the binding materials caused less cross-linking to occur in the amorphous phase of those materials. Bending waves were created by the Al–O bonds in the AlO4 groups, resulting in the third peak of the anhydrous GGBS, which was visible as a band at 688 cm−1 (peak 3). The internal deformation vibrations of the T–O bond (O–Si–O) caused the fourth one, which corresponded to peak 4 at 488 cm−1 for the slag [38].

FTIR GGBFS – Binder.
The FTIR spectra of the GPCC and GPCSC mixtures are shown in Figures 13 and 14, respectively. The primary absorption lines in the alkali-activated slag’s FTIR spectrum were 1,600, 1,413, 897, and 460 cm−1. At 1,600 cm−1, distinct water molecule O–H group modes were found in (peak 1) of both mixtures. The development at (peaks 2 and 4) bands is 1,413 and 460 cm−1, which shows the presence of calcium carbonate. In the activated slag (897 cm−1), the initial base materials’ T–O band at 966 cm−1 sharpened and descended to lower frequencies (peak 3). These peaks show how the GGBS glassy component and the activator of alkali interacted to form a range of new products, principally C–S–H gel and C–A–S–H gel [38].

GPCC – FTIR.

GPCSC – FTIR.
3.4 SEM analysis
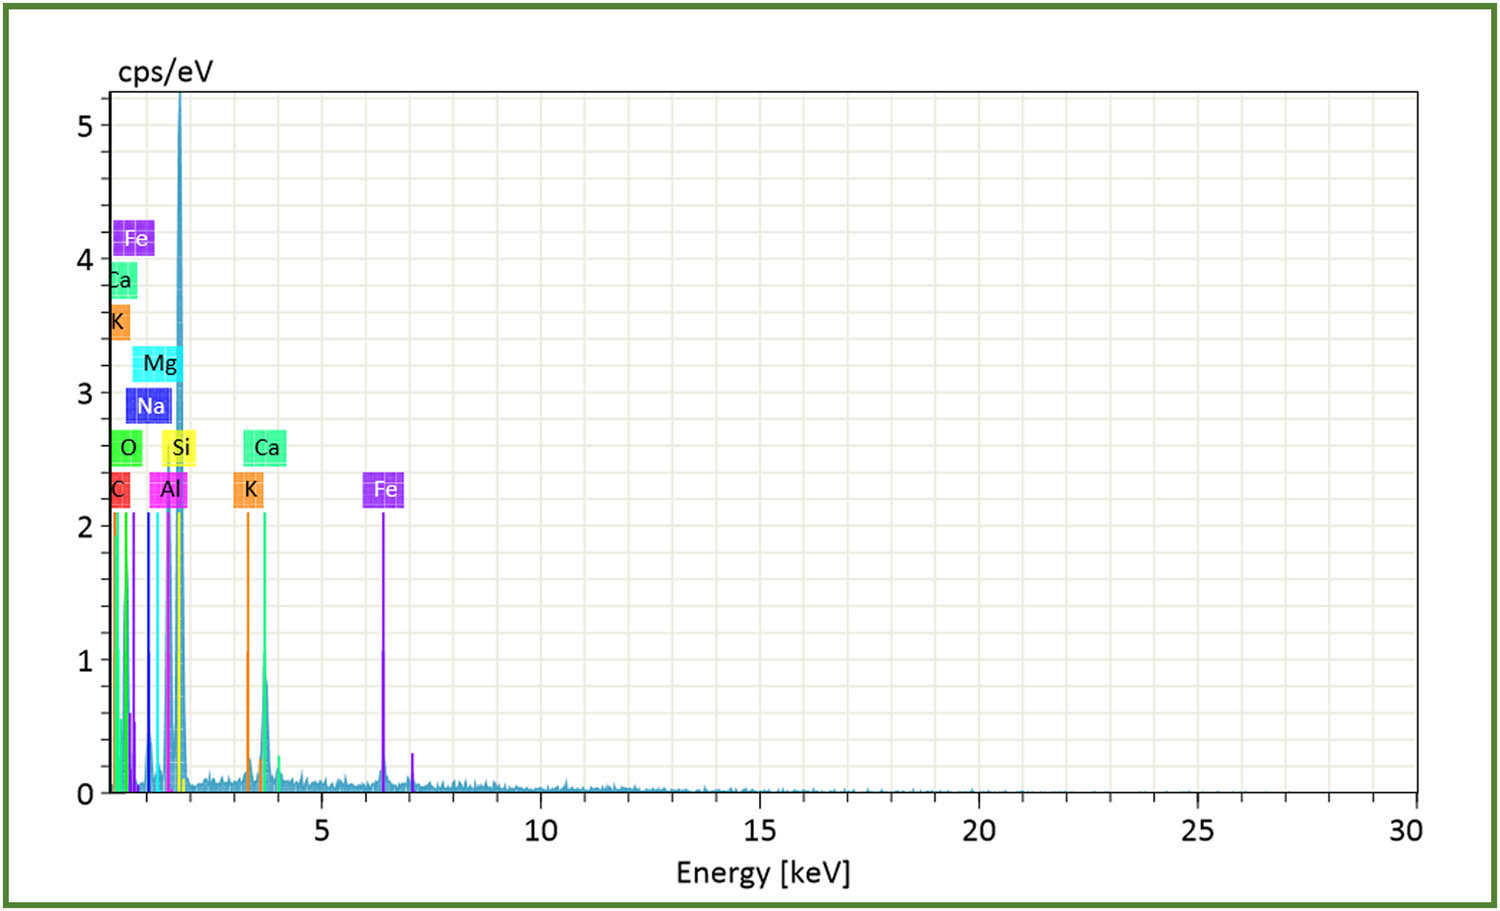
The GGBFS, M-sand, CS, and CSA SEM with EDX analysis are displayed in Figures 15–18. The microstructure of GGBFS, M-sand, CS, and CSA is shown in Figures 15–18 and demonstrates the content of silicate and aluminate. These sources of aluminosilicate are activated by silicate solution and NaOH; the quantities of alumina and silica are essential elements of the process of polymerization that results in the formation of strength.

GGBFS – SEM with EDX.
M.Sand – SEM with EDX.

CS – SEM with EDX.

CSA – SEM with EDX.
Figures 19 and 20 illustrate, respectively, the SEM images of the GPCC and GPCSC that incorporate EDX data. They unequivocally show the content of aluminate and silicate, that is desired for the geopolymerization-induced synthesis of C–S–H and C–A–S–H gel [38].

SEM with EDX (GPCC).

SEM with EDX (GPCSC).
The reactivity of GGBS in alkali-activated solution resulted in the formation of amorphous aluminosilicate gels. The GPCC mix has a more uniform and homogeneous matrix as a consequence of these gels, as can be seen in the SEM image of GPCC in Figure 21.
GPCC – SEM.
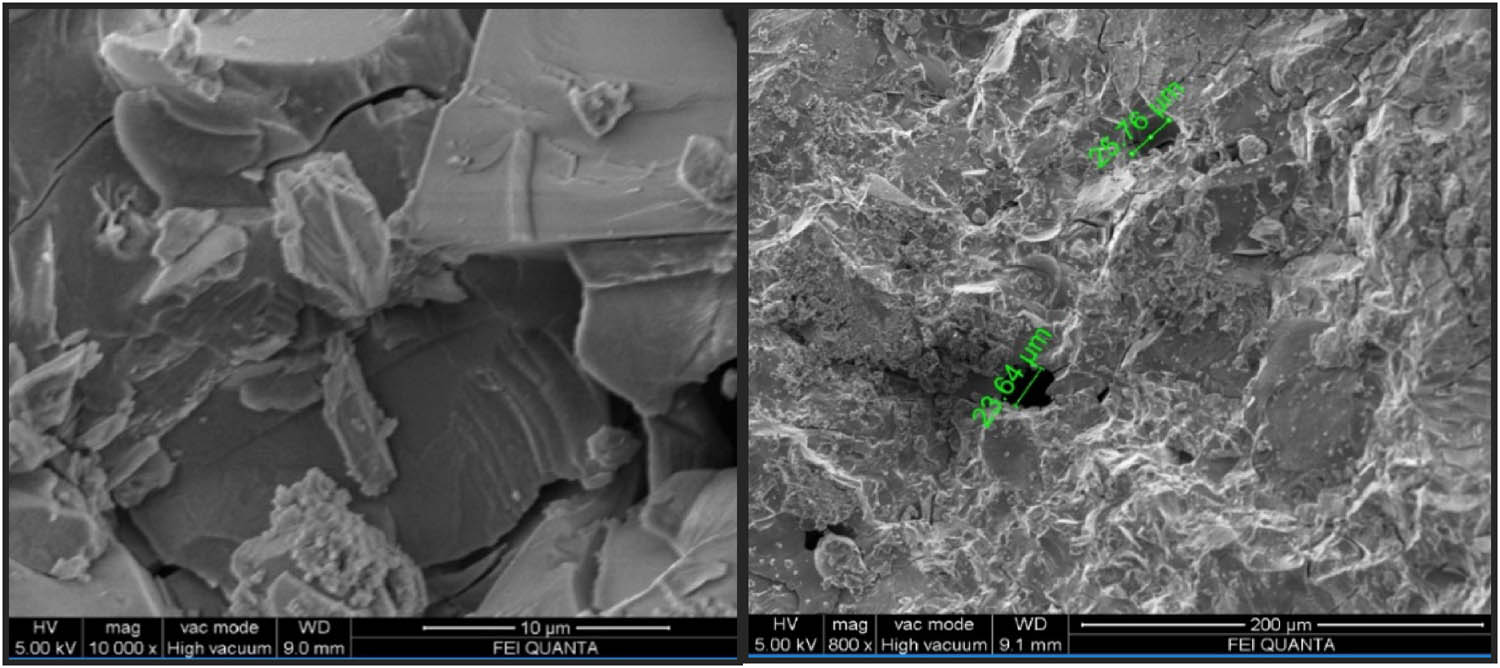
More pores and reaction gels in the form of whitish granules can be found in the interfacial transmission zone (Figure 22). This is implied by the fact that a large proportion of CS aggregate might cause more water and alkali solution to collect around the aggregate. GPCC has considerably higher strength than equivalent GPCSC because it contains less porosity with more gel content than GPCSC. GPCC has a dense matrix with a remarkably consistent structure and almost no pores. This uniformity might lead to mechanical reliability. However, owing to the texture of the CS, results in a porous structure with void in matrix’s continuity, as shown in Figure 22.

GPCSC – SEM.
Overall, GGBFS as a binder with alkaline activator significantly changes the total properties of concrete in both GPCC and GPCSC. The density and homogeneity of the microstructure have typically improved while the void volume has decreased.
3.5 TGA of GPCC and GPCSC
Figure 23 displays TGA of the GPCC and GPCSC mixes for the materials collected after cornuate 550°C; only 2% of weight loss was seen, according to the GPCC thermogram. In contrast, more weight loss was seen with the GPCSC blend than with the mixes that included crushed granite. At 550°C, an 8% weight drop in the GPCSC mix was noted.

TGA of GPCC and GPCSC.
3.6 Properties of concrete mixes
Table 4 shows the properties of concrete tested after 3, 7, and 28 days of GPCC and GPCSC. Table 5 shows the comparison of mix parameters, workability, and strength with previous studies.
Workability, density, and compressive strength of GPCSC and GPCC
| Mix no. | Slump (mm) | Fresh density (kg/m3) | Hardened density (kg/m3) | Compressive strength (MPa) | 28-day compressive strength in percentage | ||||
|---|---|---|---|---|---|---|---|---|---|
| Ambient curing | Ambient curing | ||||||||
| 3-day | 7-day | 28-day | 3-day | 7-day | 28-day | ||||
| GPCSC | |||||||||
| A1 | 12 | 1,984 | 1,914 | 25 | 31 | 33 | 76 | 94 | 100 |
| A2 | 8 | 2,003 | 1,965 | 26 | 30 | 31 | 84 | 97 | 100 |
| A3 | 10 | 1,994 | 1,920 | 26 | 31 | 32 | 81 | 97 | 100 |
| GPCC | |||||||||
| B1 | 14 | 2,461 | 2,411 | 11 | 26 | 32 | 34 | 81 | 100 |
| B2 | 16 | 2,440 | 2,401 | 11 | 25 | 31 | 35 | 81 | 100 |
| B3 | 16 | 2,662 | 2,234 | 11 | 27 | 35 | 31 | 77 | 100 |
Comparison of mix parameters, strength, and workability in earlier study
| Materials | Ingredients (kg/m3) | ||||
|---|---|---|---|---|---|
| Existing study | Previous study | ||||
| GPCSC | GPCC | Arunachalam et al. [40] | Arunachalam et al. [40] | Gunasekaran et al. [28] | |
| (A)*1 | (B)*2 | (C)*3 | (C1)*4 | (D)*5 | |
| OPC | — | — | — | — | 510 |
| POFA | — | — | 88 | 88 | — |
| Fly ash | — | — | — | — | — |
| GGBS | 420 | 282 | 132 | 132 | — |
| Sand | 1,064 | 1,172 | 884 | 750 | |
| Granite | — | 1,004 | 994 | — | — |
| OPS | — | — | — | 255 | — |
| CS | 443 | — | — | — | 332 |
| NaOH solution (ml) | 46 (10M) | 25 (10M) | 25 (12M) | 49 (12M) | — |
| Na2SiO2 solution (ml) | 228 | 126 | 63 | 122 | — |
| Binder/alkaline content | 0.65 | 0.65 | 0.64 | 0.30 | 0.42 |
| Excess water (ml) | — | — | 141 | 128 | 0 |
| Mix | 1:2.53:1.05 | 1:4.15:3.56 | 1:4:4.5 | 1:2.5:0.6 | 1:1.47:0.65 |
| Slump | 10 | 15 | 10 | 05 | 05 |
| Compressive strength in (MPa) | 32 | 33 | 39 | 31 | 26.70 |
(A)*1 Mix with geopolymer lightweight coconut shell concrete with GGBFS as binder and coconut shell, manufactured sand as coarse and fine aggregate.
(B)*2 Mix with geopolymer conventional concrete with GGBFS as binder, manufactured sand (M-Sand) as fine aggregate, and granite as coarse aggregate.
(C)*3 Mix with normal weight geopolymer concrete with GGBS and POFA as binder and granite as coarse aggregate.
(C1)*4 Mix with geopolymer lightweight oil palm shell concrete with GGBFS and POFA as binder and granite and oil palm shell as coarse aggregate.
(D)*5 Mix with lightweight coconut shell conventional concrete with cement as binder POFA, OPC, OPS- palm oil fuel ash, ordinary portland cement, crushed oil palm shell aggregate.
3.6.1 Workability
According to IS1199:1959 and ASTM C143 [44,45], the slump test revealed that the workability of GPCC and GPCSC was 15 and 10 mm, respectively. Due to the geopolymer mix’s high degree of viscosity, resulting in reduced segregation during the mixing and compacting in comparison to traditional concrete, the slump values are extremely low. The quantities of alkaline activator solution in the mix were primarily responsible for maintaining the viscosity and cohesiveness throughout mixing. The interface of the Na2SiO2 and NaOH solution, the binder, and the liquid/ingredients proportions are the important parameters that impact geopolymer characteristics [53]. The initial setting time was 921 min, while the final setting time was 1,200 min for both GPCC and GPCSC.
3.6.2 Fresh and hardened density
For GPCC and GPCSC, the fresh and hardened densities (at 28 days) are 2,349 and 1,933 kg/m3, respectively. The difference in density is due to the CS’s smaller weight as compared to CGA. According to the literature cited in [14,15], for structural LWC, the hardened density should be equal to or less than 2,000 kg/m3. The average hardened density of GPCSC was 2,000 kg/m3, which satisfied the permissible range as per structural LWC. Because of decreased self-weight in GPCSC, it results in reduced overall moment and minimised area of the reinforcement. The 28-day density of GPCSC was almost 18% lesser than the GPCC mix. This decrease in the area of reinforcement can ultimately result in savings.
3.6.3 Compressive strength
Table 4 shows the compressive strengths of the GPCC and GPCSC after 3, 7, and 28 days. The maximum compressive strength of GPCC was approximately 3% greater than that of GPCSC. Previous research indicates that GGBFS-based geopolymer concrete that was cured without heat attained sufficient strength [54]. GPCC, on the contrary, was able to attain 80% of the 28-day strength in 7 days and 33% in 3 days with ambient curing, whereas GPCSC reached 96% strength in 7 days and 80% in 3 days. This study demonstrates that regardless of the aggregates utilised, the key bonding characteristics of GGBFS content and Na2SiO2 and NaOH proportion control the strength of the concrete. The traditional approach of temperature curing in geopolymer concrete was completely eliminated with the usage of the GGBFS binder since outdoor curing is the only method that can be employed for in situ construction. The compressive strength of geopolymer oil palm shell concrete (cured at room temperature) was found to be comparable after 3, 7, and 28 days [40]. Therefore, the temperature curing process needed for polymerization was completely eliminated because of the glassy structure of the binder and liquid/solid proportion, resulting in anticipated strength.
3.6.4 Failure mode
The cube’s shape has changed once it reaches its point of failure in the compression testing equipment. Whether it is satisfactory or not is shown by the failure shape. Figure 24a depicts multiple cube failure types that are acceptable according to BS EN 12390-3:2009 [55]. Figure 24b depicts the tested cubes. According to code [56], the test results for the GPCC and GPCSC demonstrate a satisfactory failure mode.
![Figure 24
Failure mode of samples tested (GPCSC and GPCC): (a) failure mode as per code [55,56] and (b) failure of GPCSC and GPCC specimens before and after testing.](/document/doi/10.1515/jmbm-2024-0023/asset/graphic/j_jmbm-2024-0023_fig_024.jpg)
Table 5 compares the current study to previous research. Despite variations in the ingredients and mix quantities, the slump test is the most often used workability test. The current study’s findings are consistent with those reported in the literature. The proportion liquid binder ratio used to make the mix is the key difference between this investigation and the prior study. As shown in Table 5, the binder concentration is substantial; however, the activator employed in this study was lower than in previous investigations. The larger binder concentration was primarily employed to generate early strength, which would be advantageous since it would facilitate the construction process for structure, rapid construction, and formwork reuse.
3.7 Mechanical properties of GPCC and GPCSC
Tables 6–10 gives the mechanical properties of GPCC and GPCSC tested for 28 days. Studying the specimens’ mechanical characteristics included measuring their impact resistance, flexural strength, elastic modulus STS, and ultrasonic pulse velocity.
STS for GPCSC and GPCC in MPa
| Mix | Current study | Previous study | Previous study | |||||
|---|---|---|---|---|---|---|---|---|
| Specimen | Arunachalam et al. [40] | Gunasekaran et al. [24] | ||||||
| Compressive strength | Experimental split strength | Compressive strength | Experimental split strength | Compressive strength | Experimental split strength | |||
| (A)*1 | (B)*2 | (C)*3 | (D)*4 | (D)*5 | ||||
| GPCSC and GPCC | GPCSC | GPCC | NWGC and OPSGC | NWGC | OPSGC | NWCSC | ||
| A1 | 33 | 3.15 | — | 38 | 2.94 | — | — | — |
| A2 | 31 | 3.01 | — | 40 | 2.87 | — | — | — |
| A3 | 32 | 3.22 | — | 36 | 2.61 | — | — | — |
| B1 | 32 | — | 2.96 | 32 | — | 2.44 | — | — |
| B2 | 31 | — | 3.08 | 33 | — | 2.09 | — | — |
| B3 | 35 | — | 3.06 | 29 | — | 1.88 | — | — |
| M11 | — | — | — | — | — | — | 26.7 | 2.7 |
Flexural strength for GPCSC and GPCC in MPa
| Mix | Current study | Previous study | Previous study | |||||
|---|---|---|---|---|---|---|---|---|
| Specimen | Arunachalam et al. [40] | Gunasekaran et al. [24] | ||||||
| Compressive Strength | Experimental flexural strength | Compressive strength | Experimental flexural strength | Compressive strength | Experimental flexural strength | |||
| (A)*1 | (B)*2 | (C)*3 | (D)*4 | (D)*5 | ||||
| GPCSC and GPCC | GPCSC | GPCC | NWGC and OPSGC | NWGC | OPSGC | NWCSC | ||
| A1 | 33 | 3.9 | — | 38 | 3.6 | — | — | — |
| A2 | 31 | 3.4 | — | 40 | 3.8 | — | — | — |
| A3 | 32 | 3.7 | — | 36 | 3.2 | — | — | — |
| B1 | 32 | — | 4 | 32 | — | 3 | — | — |
| B2 | 31 | — | 4.5 | 33 | — | 3 | — | — |
| B3 | 35 | — | 4 | 29 | — | 2.8 | — | — |
| M11 | — | — | — | — | — | — | 26.7 | 4.7 |
Elastic modulus of tested specimens
| MIX | Current study | Previous study | ||||
|---|---|---|---|---|---|---|
| Specimen | Compressive strength (MPa) | Modulus of elasticity (MPa) | Gunasekaran et al. [28] (MPa) | Kavitha et al. [18] | ||
| Compressive strength (MPa) | Modulus of elasticity (MPa) | Compressive strength (MPa) | Modulus of elasticity (MPa) | |||
| GPCSC | NWGC | |||||
| A1 | 33 | 7.76 | 38 | 16.86 | — | — |
| A2 | 31 | 6.83 | 40 | 14.80 | — | — |
| A3 | 32 | 7.36 | 36 | 13.74 | — | — |
| GPCC | OPSGC | |||||
| B1 | 37 | 12.01 | 32 | 11.12 | — | — |
| B2 | 39 | 14.62 | 33 | 8.93 | — | — |
| B3 | 37 | 12.22 | 29 | 8.51 | — | — |
| NWCSC | ||||||
| M11 | — | — | — | — | 26.10 | 10.465 |
NWCSC – normal weight conventional light weight coconut shell concrete(no geopolymer).
NWGC – normal weight geopolymer concrete with GGBS as binder and crushed granite as coarse aggregate.
OPSGC – light weight geopolymer oil palm shell concrete with GGBS as binder and oil palm shell as coarse aggregate.
Impact resistance of GPCSC and GPCC
| Specimen | Compressive strength (MPa) | Initial cracks-No of blows (Nos) | Fractured pieces-No of blows (Nos) |
|---|---|---|---|
| GPCSC | |||
| A1 | 33 | 33 | 49 |
| A2 | 31 | 37 | 52 |
| A3 | 32 | 35 | 47 |
| GPCC | |||
| B1 | 32 | 32 | 45 |
| B2 | 31 | 30 | 43 |
| B3 | 35 | 31 | 48 |
3.7.1 STS of GPCC and GPCSC
The tensile strengths at which GPCC and GPCSC separate are presented in Table 6. The experimental 28-day splitting tensile strength of GPCC and GPCSC was 3.13 and 3.03 MPa, respectively. The tensile strength of the GPCC mixes was approximately 3% higher than that of the GPCSC, which could be because of texture of CS aggregate in the interfacial transition zone, which has a substantial impact on the samples. ASTM C330 requires structural-grade lightweight aggregate concrete to have a minimum splitting tensile strength of 2.0 MPa. Figure 25 shows a comparison of the test findings with those of other researchers. The splitting tensile strength obtained by a standard [42] is found to be closer to the experimental results of the previous investigation. However, Jenima et al. [12] demonstrate a larger STS range, owing mostly to the % substitution of CS for a lower compressive strength of 26.70 MPa. Figure 26 depicts the test setup and failure mode of the sample tested for split strength.

STS and compressive strength relationship with earlier studies.

STS – sample specimen – GPCSC mix (M11 – Table 3).
3.7.2 Flexural strength of GPCC and GPCSC
The experimental flexural strength at 28 days for GPCC and GPCSC was calculated to be between 3.67 and 4.12 MPa, as shown in Table 7. Tensile strength obtained by the GPCSC mixtures was 11% higher than that of GPCC. It might be because of the interaction between the fibre CS, alkaline activator, and binder. Figure 27 illustrates the experimental configuration and a failure pattern sample utilised in the flexure strength test. The failure pattern during the flexural strength test clearly demonstrates bond failure between the binder and CS. Similar results for concrete made from oil palm shells were reported in [42]. But for Gunasekaran et al. [24], the ratio of flexural strength to compressive strength was 17%, and this is mainly due to the weaker interfacial zone in the mix. The difference in flexural strength between the current study and earlier literature for GPCC and NWGC (Figure 26) is generally attributable to the quantity of binder and alkaline activator utilised in the mix.

Flexural testing – sample specimen – GPCSC mix (M11 – Table 3).
3.7.3 Elastic modulus of GPCC and GPCSC
When evaluating deflections and cracks in the structure, the modulus of elasticity of each part mostly depends on its restraining impact. The tested modulus of elasticity (E) for GPCC and GPCSC is presented in Table 8. For GPCC and GPCSC, the experimental E-values were 12.95 and 7.32 MPa, respectively. In GPCC, the crushed granite, in addition to the binder content and alkaline activator, the bond strength between the aggregate and the matrix, resulting in a higher modulus of elasticity. The stiffness, amount, and binder matrix with an alkaline activator all affect the GPCSC’s elastic modulus. The greater amount of CS utilised in the mix mostly results in a lower elastic modulus of CS concrete. The E-values recorded for oil palm shell [40] were greater, which might be related to the amount and size of oil palm shell utilised, as well as the binder concentration, molarity, and alkaline activator. Also, the elastic modulus value reported in this investigation was lower than earlier research by Gunasekaran et al. [24] (Table 8), and it is mainly due to the binder (fly ash and cement) and minimum quantity of CS used.
3.7.4 Ultrasonic pulse velocity for GPCC and GPCSC
In the current study, all of the GPCC mixes produced an ultrasonic pulse velocity (UPV) value of 4.80 km/s tested at 28 days, which is higher than that for GPCSC (4.12 km/s). This indicates that both GPCC and GPCSC result in “good” concrete quality. When compared to traditional concrete, geopolymer concrete has a lower UPV because it produces less micro-voids inside the specimen and is more cohesive overall. The UPV values for all of Kavitha et al.’s [25] CS concrete mixes were discovered to be in the range of 4.17–4.57 km/s (at 365 days), indicating “good” concrete quality and demonstrating the thick packing and proper grading of typical CS concrete used.
3.7.5 Impact resistance of GPCC and GPCSC
In this test, each specimen was subjected to a certain number of blows until the initial crack (or first crack) emerged on the specimen, and the blows were repeated until the specimen was shattered into a number of pieces. Table 9 presents the outcomes. When compared to the results reported by Kavitha et al. [25], the impact resistance of both GPCC and GPCSC was high. This variance is mostly caused by the interaction caused by the liquid binder ratio. Due to the nature of the fibre contained in CS and the fact that CS has a higher impact resistance than CSA, it can be seen that the impact energy was higher for GPCSC than GPCC.
3.8 Bond strength of GPCC and GPCSC
Table 10 lists the bond strength of deformed bars with diameters of 10, 12, and 16 mm. For GPCC and GPCSC, the bond strength ranged from 5.31 to 7.10 MPa and 6.09 to 8.25 MPa, respectively. Comparing all bars’ values to the guidelines bond strength advised by BS 8110 (2.42 MPa) [57] and IS456 (2.24 MPa) [58], the GPCSC and GPCC values were all greater. All of the examples were destroyed by longitudinal cracks and cracking of the concrete covers. Furthermore, as bar size increases, there is a decrease in bond strength, owing to the volume of the concrete surrounded and the lesser confining pressure created by the larger bar. Similar findings were reported in [26].
Bond strength of geopolymer concrete (GPCC and GPCSC)
| Theoretical bond stress (MPa) | |||
|---|---|---|---|
| Mix | Diameter of bar | ||
| Diameter of rods | 10 mm | 12 mm | 16 mm |
| GPCC | 8.25 | 7.55 | 6.09 |
| GPCSC | 7.10 | 6.09 | 5.31 |
4 Discussion and perspectives
According to the experimental investigations, lightweight geopolymers concrete can be used as a structural grade concrete. This innovative building material combines the sustainability of geopolymer technology with the benefits of reduced density. Made from industrial by-products like slag and lightweight aggregates (CS), GPC offers an eco-friendly alternative to traditional concrete. Its lower weight not only reduces the overall load on structures but also enhances thermal insulation properties, making it ideal for energy-efficient buildings. As a structural-grade material, lightweight geopolymer concrete is increasingly recognized for its potential to meet modern engineering demands while promoting sustainable construction practices.
However, research on lightweight geopolymer concrete using CS is still in its early stages, and there is a lack of comprehensive studies in this area. Currently, standard codes for lightweight geopolymer concrete have not been established, which poses challenges for its widespread adoption in the construction industry. Controlling the properties of lightweight geopolymer concrete is challenging due to several varying factors, including the quantity of aggregate used, the composition of the slag, curing conditions, the molarity of alkaline solutions, and the alkaline binder ratio. Each of these elements can significantly influence the final characteristics of the concrete, such as its strength, workability, and durability. As a result, achieving consistent performance across different batches requires careful consideration and precise control of these variables.
To create a reliable framework for the use of this innovative material, more experiments and investigations are necessary. By advancing research in this field, we can better understand the potential of CS-based lightweight geopolymer concrete and facilitate its integration into sustainable building practices.
5 Conclusions
The following conclusions are made based on the current research
The comparison analysis unequivocally demonstrates the environmental competitiveness of lightweight GPCSC compared to traditional concrete systems. Future prospects for the concrete industry look bright thanks to the GPCSC’s outstanding characteristics and microstructure.
Conventional pozzolona (cement) can entirely be replaced by GGBFS. Additionally, a microstructural study shows that GGBFS binder can be ambient-cured to arrive at the desired strength. The maximum compressive strength of about 32 MPa was achieved in GPCSC, and it is mainly based on the optimized liquid binder proportion used in creating the specimen.
The rapid strength development of geopolymer concrete significantly contributes to faster construction timelines. Also, early strength development facilitates quicker progression through various construction phases with a reduced curing period.
GPCSC’s hardened density (2,003 kg/m3) satisfies the requirements for lightweight aggregate concrete.
Microstructure examination of the mixture demonstrates that it has a consistent texture with light microcracks because of the texture of the CS aggregate. The mechanical characteristics were adequate despite crack formation.
The STS, flexural strength, and static modulus of elasticity increase with the increase in compressive strength of the mix.
The lower modulus of elasticity observed in this research (6.83–7.76 MPa), compared to other studies, can be attributed to the high percentage of CS used in the concrete mix. While this reduction in modulus indicates a decrease in stiffness, it may also confer advantages in specific applications. For instance, a lower modulus of elasticity allows for greater flexibility, which can be beneficial in seismic-resistant structures.
The GPCSC mixes demonstrated “good” quality, as indicated by the UPV value of more than 4.12 km/s. The amount of CS added to the mixture is the primary cause of the lower UPV value.
The geopolymerization technique, the quantity of binder, and the alkaline activator in the mixture all contributed to the increased impact resistance and bond strength.
Acknowledgments
The authors thank the SRM Institute of Science and Technology and Universidad Tecnológica Metropolitana for their support in completing this study and those who were directly or indirectly involved in this study. Also, the authors express their thanks to the Nano Research Centre, SRM Institute of Science and Technology, for their help with microanalysis.
-
Funding information: The authors wish to thank the ANID FONDECYT de Iniciacion – Grant 11240066 for funding the research work and the Faculty of Engineering and Sciences, Universidad Adolfo Ibáñez, Santiago, Chile, for funding this article publishing chargers.
-
Author contributions: Nithya Swaminathan – conceptualization, methodology; formal analysis; investigation; data curation; writing – original draft preparation; writing – review and editing. Veerabadrasamy Arularasi – conceptualization, methodology; formal analysis; investigation; data curation; writing – original draft preparation; writing – review and editing. Kandaswamy Gunasekaran – methodology; formal analysis; data curation; writing – review and editing. Siva Avudaiappan – conceptualization, methodology; formal analysis.; investigation; data curation; writing – original draft preparation; writing – review and editing. Pablo Fernando Parra – methodology; investigation; data curation; writing – review and editing. All authors have accepted responsibility for the entire content of this manuscript and approved its submission.
-
Conflict of interest: Authors state no conflict of interest.
References
[1] Klee H, Initiative CS. World business council for sustainable development–WBCSD. North Am; 2009.Search in Google Scholar
[2] Jin R, Chen Q. An investigation of current status of “green” concrete in the construction industry. In 49th ASC Annual International Conference Proceedings; 2013. p. 1–8.Search in Google Scholar
[3] Lepech MD, Li VC, Robertson RE, Keoleian GA. Design of green engineered cementitious composites for improved sustainability. ACI Mater J. 2008;105(6):567–75.10.14359/20198Search in Google Scholar
[4] Davidovits J. Global warming impact on the cement and aggregates industries. World Resour Rev. 1994;6(2):263–78.Search in Google Scholar
[5] Davidovits J. Properties of geopolymer cements. Vol. 1, Ukraine: SRIBM, Kiev; 1994. p. 131–49.Search in Google Scholar
[6] Wu Y-H, Huang R, Tsai C-J, Lin W-T. Recycling of sustainable co-firing fly ashes as an alkali activator for GGBS in blended cements. Mater (Basel). 2015;8(2):784–98.10.3390/ma8020784Search in Google Scholar PubMed PubMed Central
[7] El-Mir A, Hwalla J, El-Hassan H, Assaad JJ, El-Dieb A, Shehab E. Valorization of waste perlite powder in geopolymer composites. Constr Build Mater. 2023;368:130491.10.1016/j.conbuildmat.2023.130491Search in Google Scholar
[8] Hwalla J, El-Hassan H. Development of carbonation-cured alkali-activated slag masonry units. Proceedings of the 9th International Conference on Civil Structural and Transportation Engineering (ICCSTE 2024), Chestnut Conference Centre – University of Toronto, Toronto, Canada, 2024. doi: 10.11159/iccste24.153.10.11159/iccste24.153Search in Google Scholar
[9] Chokkalingam P, El-Hassan H, El-Dieb A, El-Mir A. Multi-response optimization of ceramic waste geopolymer concrete using BWM and TOPSIS-based taguchi methods. J Mater Res Technol. 2022;21:4824–45.10.1016/j.jmrt.2022.11.089Search in Google Scholar
[10] Davidovits J. Geopolymer chemistry and applications. France: Geopolymer Institute; 2008.Search in Google Scholar
[11] Rekha MS, Sumathy SR, Arunachalam KP, Avudaiappan S, Abbas M, Fernande DB. Effects of alkaline concentration on workability and strength properties of ambient cured green geopolymer concrete. Asian J Civ Eng. 2024;25(6):4893–910. 10.1007/s42107-024-01087-9.Search in Google Scholar
[12] Jenima J, Priya Dharshini M, Ajin ML, Jebeen Moses J, Retnam KP, Arunachalam KP, et al. A comprehensive review of titanium dioxide nanoparticles in cementitious composites. Heliyon. 2024 Oct;10(20). 10.1016/j.heliyon.2024.e39238.Search in Google Scholar PubMed PubMed Central
[13] Torgal FP, Jalali S. 5 – Natural fiber reinforced concrete. In Fangueiro RBT-F and CM for CEA, editor. Woodhead Publishing Series in Textiles. Cambridge, UK: Woodhead Publishing; 2011. p. 154–67. https://www.sciencedirect.com/science/article/pii/B9781845695583500053.Search in Google Scholar
[14] Weigler H, Karl S. Structural lightweight aggregate concrete with reduced density – lightweight aggregate foamed concrete. Int J Cem Compos Light Concr. 1980;2(2):101–4.10.1016/0262-5075(80)90029-9Search in Google Scholar
[15] Shetty MS. Concrete Technology Theory and Practice. New Delhi, India: S. Chand & Company Ltd; 2005.Search in Google Scholar
[16] En BS. 1-1. Eurocode 2: Design of concrete structures–Part 1-1: General rules and rules for buildings. Eur Comm Stand; 2004.Search in Google Scholar
[17] Abisha M, Priya RK, Arunachalam KP, Avudaiappan S, Saavedra Flores EI, Parra PF. Biodegradable green composites: Effects of potassium permanganate (KMnO4) treatment on thermal, mechanical, and morphological behavior of Butea Parviflora (BP) fibers. Polym (Basel). 2023 May;15(9):2197.10.3390/polym15092197Search in Google Scholar PubMed PubMed Central
[18] Kavitha SA, Priya RK, Arunachalam KP, Avudaiappan S, Maureira-Carsalade N, Roco-Videla Á. Investigation on properties of raw and alkali treated novel cellulosic root fibres of zea mays for polymeric composites. Polymers. 2023;15:1802.10.3390/polym15071802Search in Google Scholar PubMed PubMed Central
[19] Ahmed HU, Mohammed AS, Mohammed AA. Engineering properties of geopolymer concrete composites incorporated recycled plastic aggregates modified with nano-silica. J Build Eng. 2023;75:106942, https://www.sciencedirect.com/science/article/pii/S235271022301121X.10.1016/j.jobe.2023.106942Search in Google Scholar
[20] Ahmed HU, Mohammed AS, Mohammed AA. Proposing several model techniques including ANN and M5P-tree to predict the compressive strength of geopolymer concretes incorporated with nano-silica. Env Sci Pollut Res. 2022;29(47):71232–56.10.1007/s11356-022-20863-1Search in Google Scholar PubMed
[21] Oyejobi D, Jameel M, Adewuyi A, Aina S, Avudaiappan S, Maureira-Carsalade N. Analyzing influence of mix design constituents on compressive strength, setting times, and workability of geopolymer mortar and paste. Adv Civ Eng. 2023;2023(1):5522056.10.1155/2023/5522056Search in Google Scholar
[22] Sheeba KR, Priya RK, Arunachalam KP, Avudaiappan S, Maureira-Carsalade N, Roco-Videla Á. Characterisation of sodium acetate treatment on Acacia pennata natural fibres. Polymers. 2023;15:1996.10.3390/polym15091996Search in Google Scholar PubMed PubMed Central
[23] Gunasekaran K, Kumar PS, Lakshmipathy M. Compatibility studies on the coconut shell cement composites. Ind J Ind Concr Ins. 2010;11(1):27–31.Search in Google Scholar
[24] Gunasekaran K, Kumar PS, Lakshmipathy M. Study on properties of coconut shell as an aggregate for concrete. Ind J Ind Concr Ins. 2011;12(2):27–33.Search in Google Scholar
[25] Kavitha SA, Priya RK, Arunachalam KP, Avudaiappan S, Saavedra Flores EI, Blanco D. Experimental investigation on strengthening of Zea mays root fibres for biodegradable composite materials using potassium permanganate treatment. Sci Rep. 2024;14(1):12754. 10.1038/s41598-024-58913-y.Search in Google Scholar PubMed PubMed Central
[26] Gunasekaran K, Kumar PS, Lakshmipathy M. Mechanical and bond properties of coconut shell concrete. Constr Build Mater. 2011;25(1):92–8.10.1016/j.conbuildmat.2010.06.053Search in Google Scholar
[27] Gunasekaran K, Annadurai R, Kumar PS. Long term study on compressive and bond strength of coconut shell aggregate concrete. Constr Build Mater. 2012;28(1):208–15.10.1016/j.conbuildmat.2011.08.072Search in Google Scholar
[28] Gunasekaran K, Annadurai R, Kumar PS. Plastic shrinkage and deflection characteristics of coconut shell concrete slab. Constr Build Mater. 2013;43:203–7.10.1016/j.conbuildmat.2013.02.019Search in Google Scholar
[29] Gunasekaran K, Annadurai R, Kumar PS. Study on reinforced lightweight coconut shell concrete beam behavior under flexure. Mater Des. 2013;46:157–67.10.1016/j.matdes.2012.09.044Search in Google Scholar
[30] Gunasekaran K, Ramasubramani R, Annadurai R, Chandar SP. Study on reinforced lightweight coconut shell concrete beam behavior under torsion. Mater Des. 2014;57:374–82.10.1016/j.matdes.2013.12.058Search in Google Scholar
[31] Vikesh BS, Gunasekaran K. Study for the development of stress block for coconut shell concrete. Int J Civ Eng Technol. 2017 Jan;8:770–6.Search in Google Scholar
[32] Juluru S, Gunasekaran K. Study on determination of coefficient of modulus of elasticity for coconut shell concrete. Int J Civ Eng Technol. 2017;8(3):654–61.Search in Google Scholar
[33] Jayan S, Gunasekaran K. Study on determination of coefficient of modulus of rupture for coconut shell concrete. Int J Civ Eng Technol. 2017 Jan;8:1746–51.Search in Google Scholar
[34] Gunasekaran K, Annadurai R, Chandar SP, Anandh S. Study for the relevance of coconut shell aggregate concrete non-pressure pipe. Ain Shams Eng J. 2017;8(4):523–30.10.1016/j.asej.2016.02.011Search in Google Scholar
[35] Chakrawarthi V, Raj Jesuarulraj L, Avudaiappan S, Rajendren D, Amran M, Guindos P, et al. Effect of design parameters on the flexural strength of reinforced concrete sandwich beams. Crystals. 2022;12:1021.10.3390/cryst12081021Search in Google Scholar
[36] Soumya S, Pennarasi G, Gunasekaran K. Study on the reinforced manhole cover slab using coconut shell aggregate concrete. Mater Today Proc. 2019;14:386–94.10.1016/j.matpr.2019.04.161Search in Google Scholar
[37] Nithya S, Gunasekaran K, Sankar G. A study on the flexural behaviour of geopolymer lightweight eco‐friendly concrete using coconut shell as coarse aggregate. Adv Civ Eng. 2021;2021(1):5534019.10.1155/2021/5534019Search in Google Scholar
[38] Criado M, Aperador W, Sobrados I. Microstructural and mechanical properties of alkali activated Colombian raw materials. Mater (Basel). 2016;9(3):158.10.3390/ma9030158Search in Google Scholar PubMed PubMed Central
[39] Kabir SMA, Alengaram UJ, Jumaat MZ, Yusoff S, Sharmin A, Bashar II. Performance evaluation and some durability characteristics of environmental friendly palm oil clinker based geopolymer concrete. J Clean Prod. 2017;161:477–92.10.1016/j.jclepro.2017.05.002Search in Google Scholar
[40] Arunachalam KP, Avudaiappan S, Flores EIS, Parra PF. Experimental study on the mechanical properties and microstructures of cenosphere concrete. Mater (Basel). 2023;16(9):3518. https://www.mdpi.com/1996-1944/16/9/3518.10.3390/ma16093518Search in Google Scholar PubMed PubMed Central
[41] IS 383 BIS. Specification for coarse and fine aggregates from natural sources for concrete. Bur Indian Stand New Delhi; 1970.Search in Google Scholar
[42] ASTM. C138/C138M − 16a C138/C138M − 17 Standard Test Method for Density (Unit Weight), Yield, and Air Content (Gravimetric) of Concrete 1. 4, 2017. p. 4–7. www.astm.org.Search in Google Scholar
[43] ASTM 16 C. Standard specification for sheet materials for curing concrete. Des E 778 – 87 (Reapproved 2004). 2018. p. 3–5.Search in Google Scholar
[44] ASTM C143 A. Standard test method for slump of hydraulic-cement concrete. Annual Book of ASTM Standards. Conshohocken, PA: ASTM International; 2015.Search in Google Scholar
[45] Indian-Standard. 1199:1959, Stabilized metal nanoparticles from organometallic precursors for low temperature fuel cells. Recent Pat Nanotechnol. 2012;7(1):13–25.10.2174/1872210511307010013Search in Google Scholar
[46] Standard I. 516 (1959) Methods of tests for strength of concrete. Bur Indian Stand N Delhi (India)(Reaffirmed 2004). 2004;24.Search in Google Scholar
[47] ASTM-C496-90. Standard test method for splitting tensile strength of cylindrical concrete specimens. Annu B ASTM Stand. 2017;i:4–6.Search in Google Scholar
[48] ASTM. C 78-94 Standard test method for flexural strength of concrete. Des E 778 – 87 (Reapproved 2004). 2018. p. 3–5.Search in Google Scholar
[49] ACI. 544.1R-96, Report on Fibre Reinforced Concrete; America Concrete Institute: Change. 2009. p. 1–6.Search in Google Scholar
[50] ASTM C469-02. Standard test method for static modulus of elasticity and poisson’s ratio of concrete in compression. ASTM Stand B. 2002;4:1–5, http://portales.puj.edu.co/wjfajardo/mecanica de solidos/laboratorios/astm/C469.pdf.Search in Google Scholar
[51] ASTM. Standard test method for comparing concretes on the basis of the bond developed with reinforcing steel. 1918. p. 3–4.Search in Google Scholar
[52] IS 13311 (Part 1). Method of Non-destructive testing of concret, Part 1: Ultrasonic pulse velocity. Bur Indian Satandards. 1992;1:1–14.Search in Google Scholar
[53] Muthalvan RS, Selvaraj L, Avudaiappan S, Liseitsev Y. Performance evaluation of super absorbent polymer modified cement mortar with nano-silica/GGBS. Case Stud Constr Mater. 2023;19:e02359, https://www.sciencedirect.com/science/article/pii/S2214509523005399.10.1016/j.cscm.2023.e02359Search in Google Scholar
[54] Avudaiappan S, Cuello Moreno PI, Montoya RLF, Chávez-Delgado M, Arunachalam KP, Guindos P, et al. Experimental investigation on the physical, microstructural, and mechanical properties of hemp limecrete. Sci Rep. 2023;13(1):22650. 10.1038/s41598-023-48144-y.Search in Google Scholar PubMed PubMed Central
[55] BS EN 12390-3. Testing hardened concrete - Part 3: Compressive strength of test specimens. BSI Stand Publ. 2002;38(10):18.Search in Google Scholar
[56] BS 1881-116. Testing concrete – compressive strength of concrete cubes.Search in Google Scholar
[57] BS. 8110 Structural use of concrete. 1986.Search in Google Scholar
[58] IS 456. Plain concrete and reinforced. Bur Indian Stand Dehli. 2000;4:1–114.Search in Google Scholar
© 2025 the author(s), published by De Gruyter
This work is licensed under the Creative Commons Attribution 4.0 International License.
Articles in the same Issue
- Research Articles
- Probing microstructural evolution and surface hardening of AISI D3 steel after multistage heat treatment: An experimental and numerical analysis
- Activation energy of lime cement containing pozzolanic materials
- Optimizing surface quality in PMEDM using SiC powder material by combined solution response surface methodology – Adaptive neuro fuzzy inference system
- Experimental study of the mechanical shear behaviour of steel rebar connectors in timber–concrete structure with leafy wood species
- Development of structural grade lightweight geopolymer concrete using eco-friendly materials
- An experimental approach for the determination of the physical and mechanical properties of a sustainable geopolymer mortar made with Algerian ground-granulated blast furnace slag
- Effect of using different backing plate materials in autogenous TIG welding on bead geometry, microhardness, tensile strength, and fracture of 1020 low carbon steel
- Uncertainty analysis of bending response of flexoelectric nanocomposite plate
- Leveraging normal distribution and fuzzy S-function approaches for solar cell electrical characteristic optimization
- Effect of medium-density fiberboard sawdust content on the dynamic and mechanical properties of epoxy-based composite
- Mechanical properties of high-strength cement mortar including silica fume and reinforced with single and hybrid fibers
- Study the effective factors on the industrial hardfacing for low carbon steel based on Taguchi method
- Analysis of the combined effects of preheating and welding wire feed rates on the FCAW bead geometric characteristics of 1020 steel using fuzzy logic-based prediction models
- Effect of partially replacing crushed oyster shell as fine aggregate on the shear behavior of short RC beams using GFRP rebar strengthened with TRC: Experimental and numerical studies
- Micromechanic models for manufacturing quality prediction of cantula fiber-reinforced nHA/magnesium/shellac as biomaterial composites
- Numerical simulations of the influence of thermal cycling parameters on the mechanical response of SAC305 interconnects
- Impact of nanoparticles on the performance of metakaolin-based geopolymer composites
- Enhancing mechanical and thermal properties of epoxy-based polymer matrix composites through hybrid reinforcement with carbon, glass and steel
- Prevention of crack kinetic development in a damaged rod exposed to an aggressive environment
- Ideal strain gauge location for evaluating stress intensity factor in edge-cracked aluminum plates
- Experimental and multiscale numerical analysis of elastic mechanical properties and failure in woven fabric E-glass/polyester composites
- Optimizing piezoelectric patch placement for active repair of center-cracked plates
- Experimental investigation on the transverse crushing performance of 3D printed polymer composite filled aluminium tubes
- Review Articles
- Advancing asphaltic rail tracks: Bridging knowledge gaps and challenges for sustainable railway infrastructure
- Chemical stabilization techniques for clay soil: A comprehensive review
- Development and current milestone of train braking system based on failure phenomenon and accident case
- Rapid Communication
- The role of turbulence in bottom-up nanoparticle synthesis using ultrafast laser filamentation in ethanol
- Special Issue on Deformation and Fracture of Advanced High Temperature Materials - Part II
- Effect of parameters on thermal stress in transpiration cooling of leading-edge with layered gradient
- Development of a piezo actuator-based fatigue testing machine for miniature specimens and validation of size effects on fatigue properties
- Development of a 1,000°C class creep testing machine for ultraminiature specimens and feasibility verification
- Special Issue on Advances in Processing, Characterization and Sustainability of Modern Materials - Part II
- Surface integrity studies in microhole drilling of Titanium Beta-C alloy using microEDM
- Experimental investigation on bacterial concrete by using Cantabro loss and UPV
- Influence of gas nitriding on the surface layer of M50 NiL steel for aerospace-bearing applications
- Experimental investigation on the spectral, mechanical, and thermal behaviors of thermoplastic starch and de-laminated talc-filled sustainable bio-nanocomposite of polypropylene
- Synthesis and characterization of sustainable hybrid bio-nanocomposite of starch and polypropylene for electrical engineering applications
- Microstructural and mechanical characterization of Al6061-ZrB2 nanocomposites fabricated by powder metallurgy
- Effect of edge preparation on hardness and corrosion behaviour of AA6061-T651 friction stir welds
- Mechanical improvement in acetal composites reinforced with graphene nanotubes and Teflon fibers using loss functions
- Experimental investigation on the mechanical properties of aluminum-based metal matrix composites by the squeeze casting method
- Investigation on punch force–displacement and thickness changes in the shallow drawing of AA2014 aluminium alloy sheets using finite element simulations
- Influence of liquid nitriding on the surface layer of M50 NiL steel for bearing applications
- Mechanical and tribological analyses of Al6061-GO/CNT hybrid nanocomposites by combined vacuum-assisted and ultrasonicated stir casting method
- Strengthening of structures with bacterial concrete for effective crack repair and durability enhancement
- Unique approaches in developing novel nano-composites: Evaluating their mechanical and tribological characteristics
- Load-carrying capacity of highly compact rigid deployable booms
- Investigating the influence of SiC and B4C reinforcements on the mechanical and microstructural properties of stir-casted magnesium hybrid composites
- Evaluation of mechanical and performance characteristics of bitumen mixture using waste septage ash as partial substitute
- Mechanical characterization of carbon/Kevlar hybrid woven 3D composites
- Development of a 3D-printed cervical collar using biocompatible and sustainable polylactic acid
- Mechanical characterization of walnut shell powder-reinforced neem shell liquid composite
- Special Issue on Structure-energy Collaboration towards Sustainability Societies
- Effect of tunneling conductivity of CNTs on the EMI shielding effectiveness of nanocomposite in the C-band
- Evaluation of the effect of material selection and core geometry in thin-walled sandwich structures due to compressive strength using a finite element method
- Special Issue on Sustainability and Development in Civil Engineering - Part III
- The optimum reinforcement length for ring footing resting on sandy soils resisting inclined load
- Special Issue on Advanced Materials in Industry 4.0
- Cross-dataset evaluation of deep learning models for crack classification in structural surfaces
- Mechanical and antibacterial characteristics of a 3D-printed nano-titanium dioxide–hydroxyapatite dental resin-based composite