Effect of multi-pass deformation on microstructure evolution of spark plasma sintered TC4 titanium alloy
-
 ,
,

Abstract
The TC4 titanium alloy powder test piece was prepared by spark plasma sintering. The multi-pass hot deformation of the TC4 titanium alloy was tested by using the Gleeble-1500 experiment machine. Measurement of relative density, X-ray diffraction, optical microscopy, scanning electron microscopy and electron backscatter diffraction were carried out for the TC4 titanium alloy. In order to reveal the evolution of the microstructure, describing its changes systematically is necessary, which has become the focus of this article. The results show that after multi-pass hot deformation, the relative density of the TC4 titanium alloy could reach 99.93%. With the increase in deformation and decrease in temperature, the β-transformed phase was retained, and many fine β-transformed phases were formed between two adjacent lamellar α. During the one-pass hot deformation, the rapid increase in relative density was the main reason for the instability of the flow stress in the stress–strain curve. For two-pass and three-pass hot deformations, more features of dynamic recrystallization and the characteristics of dynamic recovery at high strain rates (5 s−1) could be found. The size of the grains was about 15 µm after the three-pass hot deformation.
1 Introduction
As a typical α + β titanium alloy, TC4 has the characteristics of good corrosion resistance, high specific strength, light specific gravity and good comprehensive mechanical properties [1,2]. Due to its wide application in aerospace and automotive manufacturing, the abilities of high load capacity [3], high reliability and light weight have become the direction of development and goals of today’s TC4 titanium alloys [4,5]. However, the workability of titanium alloys is also limited by its great wear resistance and hardness. Especially in the forging process, it is necessary for the titanium alloy to have a very high forming force to complete the large plastic deformation. Hot-rolled TC4 alloy sheets are often used as the research materials for hot deformation [6,7]. This forming method is suitable for large sheet members. For complex components, it will result in the waste of titanium alloy in the subsequent machining by this way. Therefore, powder metallurgy (PM) technology with short production cycle and high metal utilization rate has become one of the important methods to reduce the cost of titanium alloy parts to achieve the near-net shape and convenient processing.
Spark plasma sintering (SPS) is one of the sintering methods of PM titanium alloy. Compared with the hot isostatic pressing (HIP) [8] and cold forming vacuum sintering, it has the characteristics of fast heating rate, short sintering time, controllable structure and uniform density [9,10,11]. Meanwhile, SPS can effectively suppress the growth of sintered grains and obtain a homogeneous block of fine structure. For these reasons, many studies have been developed on this basis. The influence of different temperatures on mechanical properties of TC4 titanium alloy after SPS was studied by Sun et al. [12]. It showed that the relative density was 98.11%, the offset yield strength was 1034.09 MPa, the tensile strength was 1028.14 MPa and the Vickers hardness was 389.7 HV. From another perspective, many analyses have been developed to study the microstructure and mechanical properties of TC4 titanium alloy composites after SPS [13,14]. The Vickers hardness has also reached 727.41 HV [15]. Meanwhile, the TC4 titanium alloy doped with rare earth [16] or other metals can also improve the mechanical properties.
In actual production, the forging process is an indispensable process for the preparation of complex components. Full density is usually the basis for components to reach normal standards. In related studies on density, the process of powder densification at high temperature was analyzed for two deformation mechanisms [17,18], and the change of density of powder at different temperatures and pressures was investigated. Based on these research studies, the hot deformation of TC4 titanium alloy was carried out under the conditions of non-full density. The feasibility analysis and microstructure analysis of the experimental results were performed. In the experiment, a TC4 titanium alloy with the suitable density was prepared by SPS. The TC4 titanium alloy was subjected to a multi-pass thermostatic compression test using the thermal simulator. The changes of density, microstructure evolution and grain refinement behavior of the TC4 titanium alloy during high temperature plastic deformation were observed and analyzed. It provided the experimental basis for theoretical analysis and formulation of hot deformation process parameters.
2 Experiment
The powder of experimental material TC4 titanium alloy powder was produced as the experimental material by Sino-Euro Materials Technologies of Xi’an Co., Ltd. The main components of the TC4 titanium alloy powder are listed in Table 1. The whole process is shown in Figure 1. Also, the TC4 titanium alloy powder could be observed with the spherical particle size in the range of 80–100 µm, and the average size was estimated to be 90 µm. The TC4 titanium alloy sample was prepared by SPS. The equipment used in the SPS process was of SPS331-Lx type. Then, the pressure during the sintering process was 30 MPa and the sintering temperature was 850°C. It was cooled with the furnace after 5 min of heat preservation.
Main components of the TC4 titanium alloy powder (wt%)
| O | Al | V | Fe | C | H | N | Ti |
|---|---|---|---|---|---|---|---|
| 0.18 | 6.1 | 4.2 | 0.04 | 0.015 | 0.02 | 0.021 | Bal. |

Diagram of the process.
The sample was machined into the cylinder of Φ 8 mm × 12 mm for thermal simulation experiments. The multi-pass compression test was performed on the Gleeble-1500 experiment machine at the strain rate ranging from 0.001 to 5 s−1. The total amount of deformation was 70%. Among them, the specimens were deformed with 20% height reduction (2.4 mm) in one-pass deformation at 1,050°C. The deformation amount of the two-pass deformation was 30% (3.6 mm) at the temperature of 1,000°C. In the three-pass deformation, the deformation was 20% (2.4 mm) at the temperature of 950°C. The specimens were subjected to rapid water for quenching treatment after deformation. The relative density was measured by the Archimedes principle multiple times, and the average values were taken of the TC4 titanium alloy sample both before and after deformation. The sample was taken through the center, parallel to the longitudinal section of the compression axis. The microstructure of TC4 was analyzed by optical microscope (OM) and SU5000 scanning electron microscope (SEM). X-ray diffraction (XRD) was used to detect the phase composition of the TC4 titanium alloy. The change of grains was analyzed using electron backscattered diffraction (EBSD).
3 Results
3.1 Stress and strain analysis
The stress–strain curve can truly reflect the relationship between the flow stress and strain of the material. In Figure 2, the curve reflected some changes in the microstructure of the TC4 titanium alloy during hot deformation. For two-pass and three-pass hot deformations, the flow stress curve obviously exhibited the characteristic of softening, and the flow stress dropped rapidly after reaching the peak value at the higher strain rate of 5 s−1. However, at lower strain rates (<1 s−1), the stress decreased after reaching the peak value and tended to stabilize with an increase in strain. In addition, the stress–strain curve remained relatively stable under different passes at the strain rate of 0.001 s−1, and the value of the peak stress did not change much. The reasons for these two changes would be further discussed in the Section 3.2.

True stress–true strain curve of the TC4 titanium alloy.
In general, with the increase in the amount of deformation and the decrease in temperature, the stress increased significantly. But relatively speaking, the curve at one-pass (20% deformation) did not fit this characteristic of the stress–strain curve. This was because the change in relative density was the main factor to influence the change of stress during the first deformation (Figure 3). It could be found in the figure that the relative density produced by SPS at 850°C could be measured to be 90.2% and increasing to 98.3% after the one-pass deformation. Figure 3(a) shows the microstructure of the TC4 titanium alloy after SPS. Spherical particles and sintered neck formation were clearly observed from the figures. The initial grain boundaries were more pronounced and there were pore microstructures between the particles. However, it was difficult to find the existence of pore structure in Figure 3(b). This process reduced a large number of pore structures. So, this was the main reason for the instability of flow stress in the stress–strain curve. Sun et al. [12] mentioned that when the SPS temperature was above 900°C, the relative density could reach 98.11%, and on this basis, the increase in temperature would not have a greater impact on the relative density. This was consistent with the relative density of this experiment under one-pass deformation. After two-pass and three-pass hot deformations, the relative density of the TC4 titanium alloy could reach 99.93% by measuring many times. This was a new idea of SPS application in production, which could reduce energy consumption and improve the efficiency during the hot deformation.

Average of the relative density of each pass and the microstructures of the TC4 titanium alloy.
3.2 Microstructure evolution
3.2.1 Effect of deformation on microstructure
At low strain rate, the stress–strain curve remained relatively stable at each pass, and the peak stress value did not change much, so the strain rate was selected to be 0.001 s−1. In Figure 4(a), the grain boundary was obvious, and the lamellar α was parallel to each other in the β grains, showing the Widmanstatten structure distinctly. This was because the degree of the deformation was low at one-pass (20% deformation) with the temperature at 1,050°C. The gradual phase transformation from the prior β grains through the β-transformed phase to the primary α phase results in a large number of lamellar α and acicular α, and the degree of coarsening was low, which were not sufficient to further transform into lath α. With the increase in deformation and the decrease in temperature, the lamellar α gradually increased and the acicular α gradually decreased (Figure 4(b)). The grain boundaries became inconspicuous at this time. In the case of three-pass deformation, the microstructure of phase included coarse colonies with the typical weave-basket structure. It showed that the lamellar α gradually formed at the discontinuous α phase after the deformation (shown in the rectangle in Figure 4(c)). Therefore, it could be clearly concluded that as the number of passes increased and the temperature decreased, the Widmanstatten structure gradually changed to the weave-basket structure. However, at this low strain rate (0.001 s−1), the equiaxed α phase did not appear. Correspondingly, the plasticity of the TC4 titanium alloy had not been improved to a large extent. The lamellar structure contributes little to the flow softening [19]. Therefore, the phenomenon of lamellar α phase coarsening has little effect on the stress–strain curve, which was consistent with the data of strain rate of 0.001 s−1 in Figure 2.

SEM of the samples at the strain rate of 0.001 s−1: (a) one-pass, (b) two-pass and (c) three-pass.
Figure 5 shows the XRD patterns of the TC4 titanium alloy before and after the deformation. In terms of diffraction peak intensity, it remained stable except for (0002) and (10−11). The difference was that the peak intensity increased with the increase in deformation at the α lattice plane of (10−11). For the α lattice plane of (0002), the peak intensity increased first and then decreased. This feature was clearly demonstrated by comparing the XRD patterns of the deformations at 20% and 70%. An increase in the intensity of the diffraction peak indicated an increase in the corresponding phase shown by the diffraction peak. Therefore, it could be proved that as the amount of deformation increased and the temperature decreased, the α phase gradually increased, which was consistent with the previous characteristics of microstructure. The α + α′ phase could be shown as the diffraction peak of the plane of (0002). This was a transition phase from the β-transformed phase to the α phase, in which hexagonal α′ martensite appeared as lath martensite in the microstructure. This feature could explain the change in lath α in Figure 4. Compared with the deformation of one-pass, the content of lath α greatly increased in Figure 4(b). For lath α in Figure 4(c), the growth rate was greatly reduced, and the evolution trend of lath α at this time changed from the β-transformed phase to the α phase, with the coarsening of lath α. The discontinuous lath α began to appear.

XRD patterns of the TC4 titanium alloy at different amounts of deformation: (a) one-pass, (b) two-pass and (c) three-pass.
In terms of the XRD pattern before and after the deformation, the main changes were expressed at the diffraction peak in the (10−10) of the α phase and (110) of the β phase. As shown in the XRD pattern in Figure 5, the (10−10) diffraction peak exhibited two phase structures of α″ and α + α′. The content of the phase structure is related to the element [20]. α″ is an orthorhombic martensite, and its stability is related to the Al element [21], shown as an acicular martensite structure. The Al element makes an effect and can stabilize the orthorhombic martensite. Also, the diffraction peak of the β phase gradually appeared at the diffraction peak of (110) as the amount of deformation increased. It remained stable after the 50% deformation. The increase in this β phase was attributed to the grain refinement at the time of deformation. This grain refinement provided greater resistance to dislocation movement and enhanced the strength of the material [22].
3.2.2 Effect of strain rate on microstructure
The OM images of the TC4 titanium alloy deformed at 1,050°C are shown in Figure 6. The amount of one-pass deformation was 20% (2.4 mm). It can be seen that all images exhibited coarse initial β grains with elongated and parallel lamellar α phases on them. In addition, at the strain rate of 1 s−1, the phenomenon of dynamic recrystallization (DRX; shown in ellipse) occurred as shown in Figure 6(c). The grain size was about 30 µm, compared with the grain size larger than 120 µm (Figure 6(a and d)). The grain size of DRX grew relatively as shown in Figure 6(b) and was about 40 µm. Therefore, the degree of grain refinement increased first and then decreased as the strain rate increased. The appearance of this feature was related to the softening mechanism [23]. The initial α martensite was composed of acicular martensite platelets and had a large number of defects due to displacement during hot deformation. Recrystallized grains began to nucleate in the platelets and gradually developed with strain at the process of deformation. During the subsequent cooling process, the acicular martensite transforms into the lamellar α phase. It was remarkable that the discontinuous α phase appeared in Figure 6(d). This kind of lamellar α phase had the tendency to transform into the weave-basket structure.
OM images of the samples at the deformation of one-pass: (a) 0.01 s−1, (b) 0.1 s−1, (c) 1 s−1 and (d) 5 s−1.
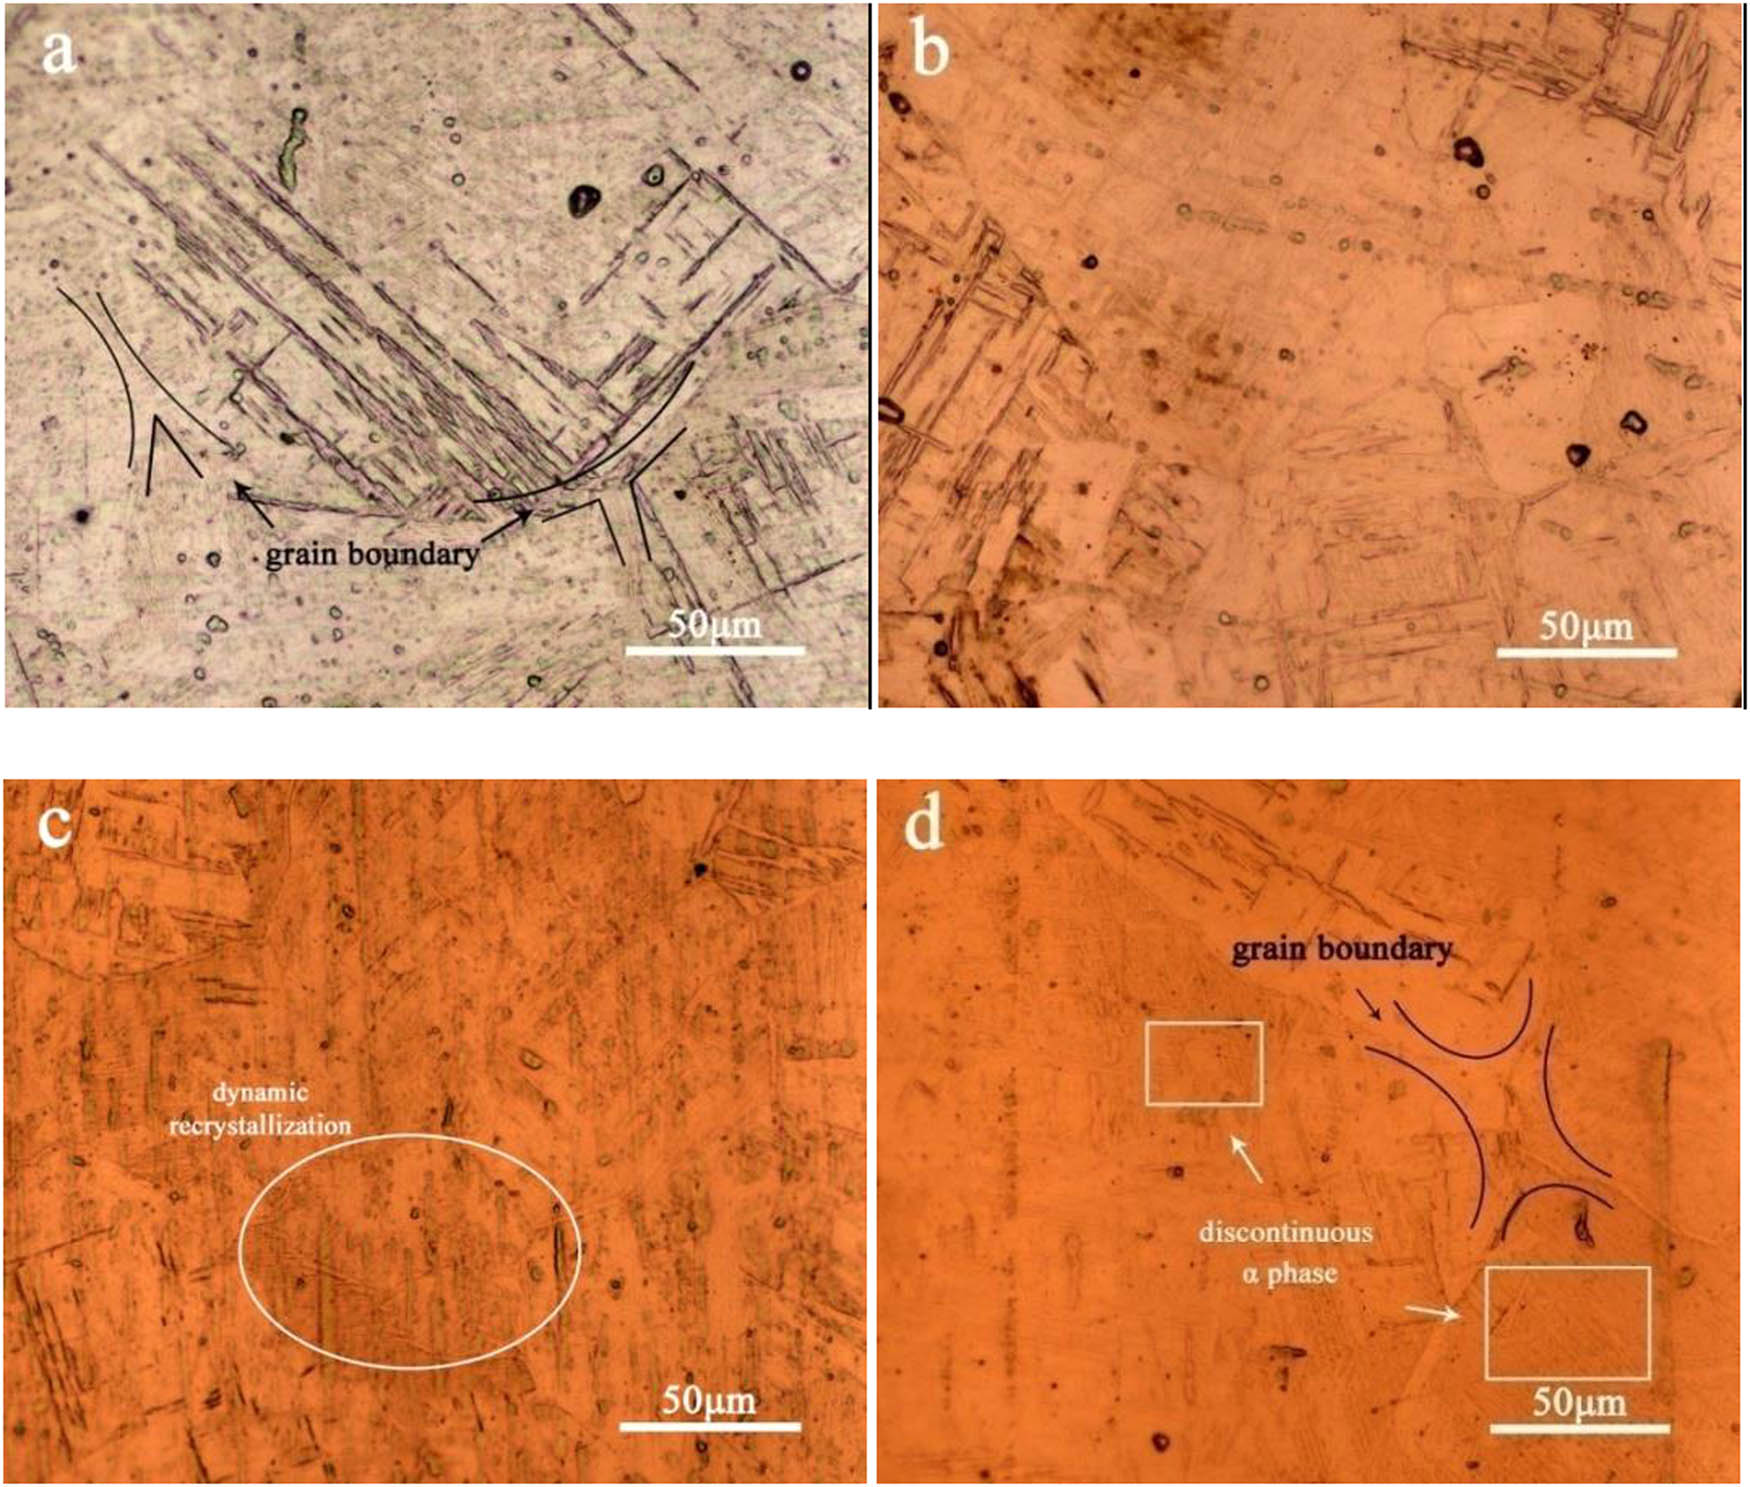
The OM images of the TC4 titanium alloy deformed at 1,000°C are shown in Figure 7. The amount of two-pass deformation was 30% (3.6 mm). As the temperature decreased, the characteristic of the weave-basket structure was exhibited during the two-pass deformation (Figure 7(a)). At the same time, the tendency of change from the α phase to the discontinuous α phase was found in the grain (indicated in the ellipse), compared with the grain which exhibited the weave-basket structure. This change in tendency was related to temperature and deformation [21,24]. Upon comparing Figure 7(b) with Figure 7(c), it can be seen that as the strain rate increased, the grain refinement effect was remarkable, and the feature of DRX (circle area) was presented apparently. The finer grains of DRX could reach 25 µm in Figure 7(c). As the strain rate increased to 5 s−1, the lamellar α structure began the process of globularization, shown in the elliptical region (Figure 7(d)), during which, the equiaxed α phase was just beginning to appear. However, the α phase could not form the equiaxed structure only by the change of temperature, and it could not be spheroidized by cyclic heating like steel. Therefore, the appearance of the globularization process could explain to a certain extent that the sample had undergone sufficient plastic deformation and the process of DRX [25]. In addition, the 50% deformation also provided the condition for the occurrence of the equiaxed α phase.

OM images of the samples at the deformation of two-pass: (a) 0.01 s−1, (b) 0.1 s−1, (c) 1 s−1 and (d) 5 s−1.
Figure 8 shows the IPF and the misorientation angles of the TC4 titanium alloy at different strain rates under two-pass deformation. The different colors in the figures represented different crystal orientations, and the coloring principle is shown in the IPF scale in Figure 8(b). In order to avoid the decrease in confidence factor caused by data noise and the deviation of grain boundary identification, the orientation less than 2° was not considered [26]. At the strain rate of 5 s−1, more characteristics of DRX between the grain boundaries appeared in Figure 8(b). It confirmed the characteristics of grain structure in the OM images. In addition, these grain boundaries showed the serrated feature. The main reason of this feature was the process of elongation and deformation accompanied by the migration of grain boundaries. It is worth noting that in the IPF diagram, there were two regions in a grain that were similar in color but were not divided into new grains. The region of A1 and A2 and the region of B1 and B2 are shown in Figure 8(b), respectively. Sun et al. [12] considered that it was covalent grain boundary, which appeared in the different gray levels in the same grain. This phenomenon provided a larger space for dislocation movement. Besides, it was indicated that the microstructure inside of the grains was inhomogeneous during deformation, which caused the occurrence of DRX. Figure 8(c and d) provides the evidence for this conclusion. Therefore, the covalent grain boundary affected the dislocations and promoted the DRX of the grains, which increased the strength of the material.

Inverse pole figure of the samples at the deformation of two-pass: (a) 1 s−1; (b) 5 s−1, misorientation angles of the samples at the deformation of two-pass; (c) 1 s−1; and (d) 5 s−1.
In order to better explore the impact of covalent grain boundary, the grain orientation of (10−12) was used to explore this phenomenon. Fan et al. [27] mentioned that the appearance of different gray levels would have an effect on the appearance of subgrains. Showing the lattice phase, a polyline was drawn to better explain the misorientation in Figure 9 and to understand the inhomogeneity of the microstructure. This low angle of dislocation relationship existed even within the same grain orientation. Thus, such low-angle dislocations were consumed in large quantities by DRX, so that the grain structure could be refined. As the amount of deformation increased and the temperature decreased, the gradual globularization of the lamellar α phase was also regarded as DRX.

Inverse pole figure of the sample at the grain orientation of (10−12) after deformation, and the misorientation along the black line.
The OM images of the TC4 titanium alloy deformed at 950°C are shown in Figure 10. The amount of three-pass deformation was 20% (2.4 mm). Overall, the grain size decreased with the increase in strain rate in Figure 10. It refined the grains from about 150 µm (Figure 10(a)) to about 15 µm (Figure 10(b and c)). The degree of grain refinement was significantly improved compared to the grain of one-pass and two-pass deformations. A large number of characteristics of DRX were clearly presented at the grain boundaries in Figure 10(c). It was remarkable that the elongated dynamic recovery (DRV) grains appeared in Figure 10(d), and the process of DRX was produced during the continuous deformation of the DRV grains (shown in the rectangle). Moreover, the DRX grains also grew at the grain boundaries (shown in the ellipse of Figure 10(c)). Combined with the stress–strain curve of Figure 2, it could be seen that at higher strain rates (5 s−1), the grains undergone more DRV processes, especially when the deformation reached 70%. In addition, with the increase in strain rates, the tendency was shown about the transformation from the lamellar α phase to the equiaxed α phase at this higher deformation (shown in ellipse of Figure 10(d)). It could not be ignored that the temperature of 950°C at this time also had a large influence with the appearance of the equiaxed α phase.

OM images of the samples at the deformation of three-pass: (a) 0.01 s−1, (b) 0.1 s−1, (c) 1 s−1 and (d) 5 s−1.
Figure 11 is represented from the perspective of EBSD and is consistent with the view of the OM. It could be clearly seen that after 70% hot deformation, the increase in strain rate had a great influence on the microstructure of the TC4 titanium alloy. At the high strain rate (5 s−1), DRX existed not only in the grains but also at the grain boundaries (Figure 11(c)). With the decrease in strain rate, the DRX grains gradually became larger. At the strain rate of 0.1 s−1, the DRX grains grew into fine grains with the size of 10–20 µm. However, the grains at this time had the HAGB, which meant more dislocation accumulation. The increase in dislocation accumulation would directly affect the strength and plasticity of the TC4 titanium alloy. For Figure 11(e and f), there were low-angle grain boundaries, and two of the figures were close. Therefore, the sensitivity of the response from the strain rate to the changes of microstructure and grain refinement decreased, when it was higher than 0.1 s−1.

Inverse pole figure of the samples at the deformation of two-pass: (a) 0.1 s−1, (b) 1 s−1, (c) 5 s−1, misorientation angles of the samples at the deformation of two-pass: (d) 0.1 s−1, (e) 1 s−1 and (f) 5 s−1.
3.2.3 Evolution of microstructure
In this part, the changes of microstructure and grain refinement were mainly discussed under the influence of hot deformation. In the previous comparison, it was believed that the change of temperature had more important effect on the microstructure of the TC4 titanium alloy. As it was known that the lath α and the lamellar α tended to be the equiaxed α phase when the TC4 titanium alloy was cooled from the high temperature, and the discontinuous α phase was the transition phase of this process. The variation in this feature is illustrated in Figure 12. In Figure 12(a), the area of line scan was divided into three nodes, which represented the β-transformed phase. It is shown as bright silver in the figure according to the color contrast. The part between these three nodes was the α phase. It could be found that the α phase at this time was lamellar α, and the lamellar α near node 1 thickened in the figure which showed the beginning of the roughened α-phase, which was shown in the ellipse in Figure 12(a). As the deformation continued, squeezing and stacking began to occur between two adjacent thicken lamellar α. In Figure 12(b), three equiaxed α phases were used as the main regions, and it could be seen that there were β-transformed phases between the three equiaxed α phases. Many white area were shown in the SEM figure that the area between the α phases, which were obtained by squeezing and stacking between the two thicken α phases mentioned above (shown in the ellipse). Therefore, the dislocations formed, and the method of energy conversion was to transfer from high potential energy to low potential energy. During the thickening of the α phase, due to the accumulation of more and more α phase and β-transformed phase affected by dislocations, the potential energy continued to increase under the influence of high temperature. But when the temperature gradually decreased, the lamellar α gradually tended to be equiaxed. However, if the potential energy was not enough to deform it, the morphology of the lamellar α was maintained. The evolution process is shown in Figure 13. The effect of strain rate on the grain refinement of TC4 titanium alloy was more obvious. This change was very limited for the microstructure mainly composed of lamellar α phase and martensite. When the lamellar α phase was gradually transformed into the equiaxed α phase, the high dislocation density during hot deformation contributed to grain refinement and significantly promoted uniform nucleation.

The line scan of energy-dispersive X-Ray spectroscopy on the SEM of the TC4 titanium alloy.

The evolution process of the α phase and β-transformed phases.
4 Conclusion
After multi-pass hot deformation, the relative density of the TC4 titanium alloy could reach 99.93%.
The change of the microstructure of TC4 titanium alloy was greatly affected by the amount of deformation and temperature. With the increase in deformation and decrease in temperature, the β-transformed phase was retained, and many fine β-transformed phases were formed between two adjacent lamellar α.
During the one-pass hot deformation, the rapid increase in relative density was the main reason for the instability of the flow stress in the stress–strain curve. For two-pass and three-pass hot deformations, more features of DRX and the characteristics of DRV at high strain rates (5 s−1) could be found combined with microscopic organization. The size of the grains was about 15 µm after the three-pass hot deformation.
Acknowledgments
The present research was supported by the National Natural Science Foundation of China (Grant No. 51675492).
References
[1] Norouzi, E., M. Shamanian, M. Atapour, and B. Khosravi. Diffusion brazing of Ti–6Al–4V and AISI 304: an EBSD study and mechanical properties. Journal of Materials Science, Vol. 52, 2017, pp. 12467–12475.10.1007/s10853-017-1376-zSearch in Google Scholar
[2] Yuan, G. S., L. P. Yan, and Y. Y. Han. Application progress of titanium alloy. Hot Working Technology, Vol. 4, 2017, pp. 21–24.Search in Google Scholar
[3] Zhang, M. J., H. Nan, Z. Q. Ju, and F. Gao. Aeronautical cast Ti alloy and forming technology development. Journal of Aeronautical Materials, Vol. 36, 2016, pp. 13–19.Search in Google Scholar
[4] Feng, Q. Y., X. W. Tong, J. Wang, D. C. Wang, and Q. Gao. Status quo and development tendency on the research of low cost titanium alloy. Materials Review, Vol. 31, 2017, pp. 128–134.Search in Google Scholar
[5] Gazder, A. A., V. Q. Vu, A. A. Saleh, P. E. Markovsky, O. M. Ivasishin, C. H. J. Davies, et al. Recrystallisation in a cold drawn low cost beta titanium alloy during rapid resistance heating. Journal of Alloys and Compounds, Vol. 585, 2014, pp. 245–259.10.1016/j.jallcom.2013.09.122Search in Google Scholar
[6] Sun, S. D., Y. Y. Zong, D. B. Shan, and B. Guo. Hot deformation behavior and microstructure evolution of TC4 titanium alloy. Transactions of Nonferrous Metals Society of China, Vol. 20, 2010, pp. 2181–2184.10.1016/S1003-6326(09)60439-8Search in Google Scholar
[7] Liu, J. L., W. D. Zeng, Y. C. Zhu, H. Q. Yu, and Y. Q. Zhao. Hot deformation behavior and flow stress prediction of TC4-DT alloy in single-phase region and dual-phase regions. Journal of Materials Engineering and Performance, Vol. 24, 2015, pp. 2140–2150.10.1007/s11665-015-1456-7Search in Google Scholar
[8] Sim, K. H., G. F. Wang, T. J. Kim, and K. S. Ju. Fabrication of a high strength and ductility Ti‒22Al‒25Nb alloy from high energy ball-milled powder by spark plasma sintering. Journal of Alloys and Compounds, Vol. 741, 2018, pp. 1112–1120.10.1016/j.jallcom.2018.01.279Search in Google Scholar
[9] Deng, H., A. J. Chen, L. Q. Chen, Y. Q. Wei, Z. X. Xia, and J. Tang. Bulk nanostructured Ti–45Al–8Nb alloy fabricated by cryomilling and Spark Plasma Sintering. Journal of Alloys and Compounds, Vol. 772, 2019, pp. 140–149.10.1016/j.jallcom.2018.09.095Search in Google Scholar
[10] Miriyev, A., A. Levy, S. Kalabukhov, N. Frage, Interface evolution and shear strength of Al/Ti bi-metals processed by a spark plasma sintering (SPS) apparatus. Journal of Alloys and Compounds, Vol. 678, 2016, pp. 329–336.10.1016/j.jallcom.2016.03.137Search in Google Scholar
[11] Wang, Q. F., Y. M. Zhang, X. H. Guo, and K. X. Song. The latest development and research progress of spark plasma sintering process. Rare Metals and Cemented Carbides, Vol. 42, 2014, pp. 44–47.Search in Google Scholar
[12] Sun, Y., G. Luo, J. Zhang, C. D. Wu, J. Li, Q. Shen, et al. Phase transition, microstructure and mechanical properties of TC4 titanium alloy prepared by plasma activated sintering. Journal of Alloys and Compounds, Vol. 741, 2018, pp. 918–926.10.1016/j.jallcom.2018.01.197Search in Google Scholar
[13] Shao, H. L., L. Cao, D. Q. Sun, and Z. K. Zhao. Low temperature spark plasma sintering of TC4/HA composites. Progress in Natural Science: Materials International, Vol. 26, 2016, pp. 192–196.10.1016/j.pnsc.2016.03.014Search in Google Scholar
[14] Kgoete, F. M., A. P. I. Popoola, and O. S. I. Fayomi. Data on the influence of tin on wear and corrosion behavior of Ti–6Al–4V alloy fabricated through spark plasma sintering. Data in Brief, Vol. 19, 2018, pp. 1989–1996.10.1016/j.dib.2018.06.049Search in Google Scholar PubMed PubMed Central
[15] Kgoete, F. M., A. P. I. Popoola, O. S. I. Fayomi, and I. D. Adebiyi. Spark plasma sintered Ti–6Al–4V–Si3N4–TiN ternary composites: effect of combined microsized Si3N4 and TiN addition on microstructure and mechanical properties for aerospace application. Journal of Alloys and Compounds, Vol. 769, 2018, pp. 817–823.10.1016/j.jallcom.2018.07.204Search in Google Scholar
[16] Chen, A. J., H. Deng, L. Q. Chen, Y. Q. Wei, Z. X. Xia, and J. Tang. Structure and mechanical properties of low doped-Zr TC4 alloy prepared by spark plasma sintering. Advanced Engineering Materials, Vol. 20, 2018, p. 1800739.10.1002/adem.201800739Search in Google Scholar
[17] Taylor, N., D. C. Dunand, and A. Mortensen. Initial stage hot pressing of monosized Ti and 90% Ti-10% TiC powders. Acta Materialia, Vol. 41, 1993, pp. 955–965.10.1016/0956-7151(93)90030-VSearch in Google Scholar
[18] Li, Q. Z., E. Y. Chen, D. R. Bice, and D. C. Dunand. Transformation superplasticity of cast titanium and Ti–6Al–4V. Metallurgical and Materials Transactions A, Vol. 38, 2007, pp. 44–53.10.1007/s11661-006-9020-6Search in Google Scholar
[19] Park, C. H., J. H. Kim, Y.-T. Hyun, J.-T. Yeom, and N. S. Reddy. The origins of flow softening during high-temperature deformation of a Ti–6Al–4V alloy with a lamellar microstructure. Journal of Alloys and Compounds, Vol. 582, 2014, pp. 126–129.10.1016/j.jallcom.2013.08.041Search in Google Scholar
[20] Bayode, B. L., M. L. Lethabane, P. A. Olubambi, I. Sigalas, M. B. Shongwe, and M. M. Ramakokovhu. Densification and micro-structural characteristics of spark plasma sintered Ti–Zr–Ta powders. Powder Technology, Vol. 321, 2017, pp. 471–478.10.1016/j.powtec.2017.08.031Search in Google Scholar
[21] Xu, W., E. W. Lui, A. Pateras, M. Qian, and M. Brandt. In situ tailoring microstructure in additively manufactured Ti–6Al–4V for superior mechanical performance. Acta Materialia, Vol. 125, 2017, pp. 390–400.10.1016/j.actamat.2016.12.027Search in Google Scholar
[22] Yongqing, Z., Phase transformation and heat treatment of titanium alloys. Changsha: Central South University Press, 2012, pp. 103–105.Search in Google Scholar
[23] Matsumoto H., L. Bin, S.-H. Lee, and Y. Li. Frequent occurrence of discontinuous dynamic recrystallization in Ti–6Al–4V alloy with α′ martensite starting microstructure. Metallurgical & Materials Transactions A, Vol. 44, No. 7, 2013, pp. 3245–3260.10.1007/s11661-013-1655-5Search in Google Scholar
[24] Elmer, J. W., T. A. Palmer, S. S. Babu, and E. D. Specht. In situ observations of lattice expansion and transformation rates of α and β phases in Ti–6Al–4V. Materials Science and Engineering: A, Vol. 391, 2005, pp. 104–113.10.1016/j.msea.2004.08.084Search in Google Scholar
[25] Seshacharyulu, T., S. C. Medeiros, J. T. Morgan, J. C. Malas, W. G. Frazier, and Y. V. R. K. Prasad. Hot deformation mechanisms in ELI Grade Ti–6a1–4V. Scripta Materialia, Vol. 41, 1999, pp. 283–288.10.1016/S1359-6462(99)00163-3Search in Google Scholar
[26] Kim, Y., Y. B. Song, and S. H. Lee. Microstructure and intermediate-temperature mechanical properties of powder metallurgy Ti–6Al–4V alloy prepared by the prealloyed approach. Journal of Alloys and Compounds, Vol. 637, 2015, pp. 234–241.10.1016/j.jallcom.2015.03.019Search in Google Scholar
[27] Fan, J. K., H. C. Kou, M. J. Lai, B. Tang, H. Chang, and J. S. Li. Hot deformation mechanism and microstructure evolution of a new near β titanium alloy. Materials Science & Engineering A, Vol. 584, 2013, pp. 121–132.10.1016/j.msea.2013.07.019Search in Google Scholar
© 2020 Jiangpeng Yan et al., published by De Gruyter
This work is licensed under the Creative Commons Attribution 4.0 International License.
Articles in the same Issue
- Research Article
- Electrochemical reduction mechanism of several oxides of refractory metals in FClNaKmelts
- Study on the Appropriate Production Parameters of a Gas-injection Blast Furnace
- Microstructure, phase composition and oxidation behavior of porous Ti-Si-Mo intermetallic compounds fabricated by reactive synthesis
- Significant Influence of Welding Heat Input on the Microstructural Characteristics and Mechanical Properties of the Simulated CGHAZ in High Nitrogen V-Alloyed Steel
- Preparation of WC-TiC-Ni3Al-CaF2 functionally graded self-lubricating tool material by microwave sintering and its cutting performance
- Research on Electromagnetic Sensitivity Properties of Sodium Chloride during Microwave Heating
- Effect of deformation temperature on mechanical properties and microstructure of TWIP steel for expansion tube
- Effect of Cooling Rate on Crystallization Behavior of CaO-SiO2-MgO-Cr2O3 Based Slag
- Effects of metallurgical factors on reticular crack formations in Nb-bearing pipeline steel
- Investigation on microstructure and its transformation mechanisms of B2O3-SiO2-Al2O3-CaO brazing flux system
- Energy Conservation and CO2 Abatement Potential of a Gas-injection Blast Furnace
- Experimental validation of the reaction mechanism models of dechlorination and [Zn] reclaiming in the roasting steelmaking zinc-rich dust process
- Effect of substituting fine rutile of the flux with nano TiO2 on the improvement of mass transfer efficiency and the reduction of welding fumes in the stainless steel SMAW electrode
- Microstructure evolution and mechanical properties of Hastelloy X alloy produced by Selective Laser Melting
- Study on the structure activity relationship of the crystal MOF-5 synthesis, thermal stability and N2 adsorption property
- Laser pressure welding of Al-Li alloy 2198: effect of welding parameters on fusion zone characteristics associated with mechanical properties
- Microstructural evolution during high-temperature tensile creep at 1,500°C of a MoSiBTiC alloy
- Effects of different deoxidization methods on high-temperature physical properties of high-strength low-alloy steels
- Solidification pathways and phase equilibria in the Mo–Ti–C ternary system
- Influence of normalizing and tempering temperatures on the creep properties of P92 steel
- Effect of temperature on matrix multicracking evolution of C/SiC fiber-reinforced ceramic-matrix composites
- Improving mechanical properties of ZK60 magnesium alloy by cryogenic treatment before hot extrusion
- Temperature-dependent proportional limit stress of SiC/SiC fiber-reinforced ceramic-matrix composites
- Effect of 2CaO·SiO2 particles addition on dephosphorization behavior
- Influence of processing parameters on slab stickers during continuous casting
- Influence of Al deoxidation on the formation of acicular ferrite in steel containing La
- The effects of β-Si3N4 on the formation and oxidation of β-SiAlON
- Sulphur and vanadium-induced high-temperature corrosion behaviour of different regions of SMAW weldment in ASTM SA 210 GrA1 boiler tube steel
- Structural evidence of complex formation in liquid Pb–Te alloys
- Microstructure evolution of roll core during the preparation of composite roll by electroslag remelting cladding technology
- Improvement of toughness and hardness in BR1500HS steel by ultrafine martensite
- Influence mechanism of pulse frequency on the corrosion resistance of Cu–Zn binary alloy
- An interpretation on the thermodynamic properties of liquid Pb–Te alloys
- Dynamic continuous cooling transformation, microstructure and mechanical properties of medium-carbon carbide-free bainitic steel
- Influence of electrode tip diameter on metallurgical and mechanical aspects of spot welded duplex stainless steel
- Effect of multi-pass deformation on microstructure evolution of spark plasma sintered TC4 titanium alloy
- Corrosion behaviors of 316 stainless steel and Inconel 625 alloy in chloride molten salts for solar energy storage
- Determination of chromium valence state in the CaO–SiO2–FeO–MgO–CrOx system by X-ray photoelectron spectroscopy
- Electric discharge method of synthesis of carbon and metal–carbon nanomaterials
- Effect of high-frequency electromagnetic field on microstructure of mold flux
- Effect of hydrothermal coupling on energy evolution, damage, and microscopic characteristics of sandstone
- Effect of radiative heat loss on thermal diffusivity evaluated using normalized logarithmic method in laser flash technique
- Kinetics of iron removal from quartz under ultrasound-assisted leaching
- Oxidizability characterization of slag system on the thermodynamic model of superalloy desulfurization
- Influence of polyvinyl alcohol–glutaraldehyde on properties of thermal insulation pipe from blast furnace slag fiber
- Evolution of nonmetallic inclusions in pipeline steel during LF and VD refining process
- Development and experimental research of a low-thermal asphalt material for grouting leakage blocking
- A downscaling cold model for solid flow behaviour in a top gas recycling-oxygen blast furnace
- Microstructure evolution of TC4 powder by spark plasma sintering after hot deformation
- The effect of M (M = Ce, Zr, Ce–Zr) on rolling microstructure and mechanical properties of FH40
- Phase evolution and oxidation characteristics of the Nd–Fe–B and Ce–Fe–B magnet scrap powder during the roasting process
- Assessment of impact mechanical behaviors of rock-like materials heated at 1,000°C
- Effects of solution and aging treatment parameters on the microstructure evolution of Ti–10V–2Fe–3Al alloy
- Effect of adding yttrium on precipitation behaviors of inclusions in E690 ultra high strength offshore platform steel
- Dephosphorization of hot metal using rare earth oxide-containing slags
- Kinetic analysis of CO2 gasification of biochar and anthracite based on integral isoconversional nonlinear method
- Optimization of heat treatment of glass-ceramics made from blast furnace slag
- Study on microstructure and mechanical properties of P92 steel after high-temperature long-term aging at 650°C
- Effects of rotational speed on the Al0.3CoCrCu0.3FeNi high-entropy alloy by friction stir welding
- The investigation on the middle period dephosphorization in 70t converter
- Effect of cerium on the initiation of pitting corrosion of 444-type heat-resistant ferritic stainless steel
- Effects of quenching and partitioning (Q&P) technology on microstructure and mechanical properties of VC particulate reinforced wear-resistant alloy
- Study on the erosion of Mo/ZrO2 alloys in glass melting process
- Effect of Nb addition on the solidification structure of Fe–Mn–C–Al twin-induced plasticity steel
- Damage accumulation and lifetime prediction of fiber-reinforced ceramic-matrix composites under thermomechanical fatigue loading
- Morphology evolution and quantitative analysis of β-MoO3 and α-MoO3
- Microstructure of metatitanic acid and its transformation to rutile titanium dioxide
- Numerical simulation of nickel-based alloys’ welding transient stress using various cooling techniques
- The local structure around Ge atoms in Ge-doped magnetite thin films
- Friction stir lap welding thin aluminum alloy sheets
- Review Article
- A review of end-point carbon prediction for BOF steelmaking process