DTM-based analysis of the spatial distribution of topolineaments
-
Mirosław Kamiński


Abstract
The research area is located on the boundary between two Paleozoic structural units: the Radom–Kraśnik Block and the Mazovian–Lublin Basin in the southeastern Poland. The tectonic structures are separated by the Ursynów–Kazimierz Dolny fault zone. The digital terrain model obtained by the ALS (Airborne Laser Scanning) method was used. Classification and filtration of an elevation point cloud were performed. Then, from the elevation points representing only surfaces, a digital terrain model was generated. The model was used to visually interpret the course of topolineaments and their automatic extraction from DTM. Two topolineament systems, trending NE–SW and NW–SE, were interpreted. Using the kernel density algorithm, topolineament density models were generated. Using the Empirical Bayesian Kriging, a thickness model of quaternary deposits was generated. A relationship was observed between the course of topolineaments and the distribution and thickness of Quaternary formations. The topolineaments were compared with fault directions marked on tectonic maps of the Paleozoic and Mesozoic. Data validation showed consistency between topolineaments and tectonic faults. The obtained results are encouraging for further research.
1 Introduction
The issue of neotectonic activity in the southwestern part of the Lublin Upland has not received much attention so far. The research area is located in the Teisseyre–Tornquist tectonic zone and in the Ursynów–Kazimierz fault zone [1]. The latter is located at the boundary between the Lublin Basin and the Radom–Kraśnik Block [2] (Figure 1). In the literature, this zone was described as a single normal fault [2–6]. Other researchers believed that it was a complex of steep inverted faults [7,8]. According to ref. [9,10], these are steep inverted faults formed as a result of sliding movements. Another view was presented by ref. [11] who considers the Ursynów–Kazimierz fault zone to be single overlaps propagating from the SW. This zone is also marked in satellite images in the form of clear photolineaments [12]. The analysis of satellite images, digital terrain models, and geophysical data is often used in geology to interpret and determine the course of lineaments [13,14].
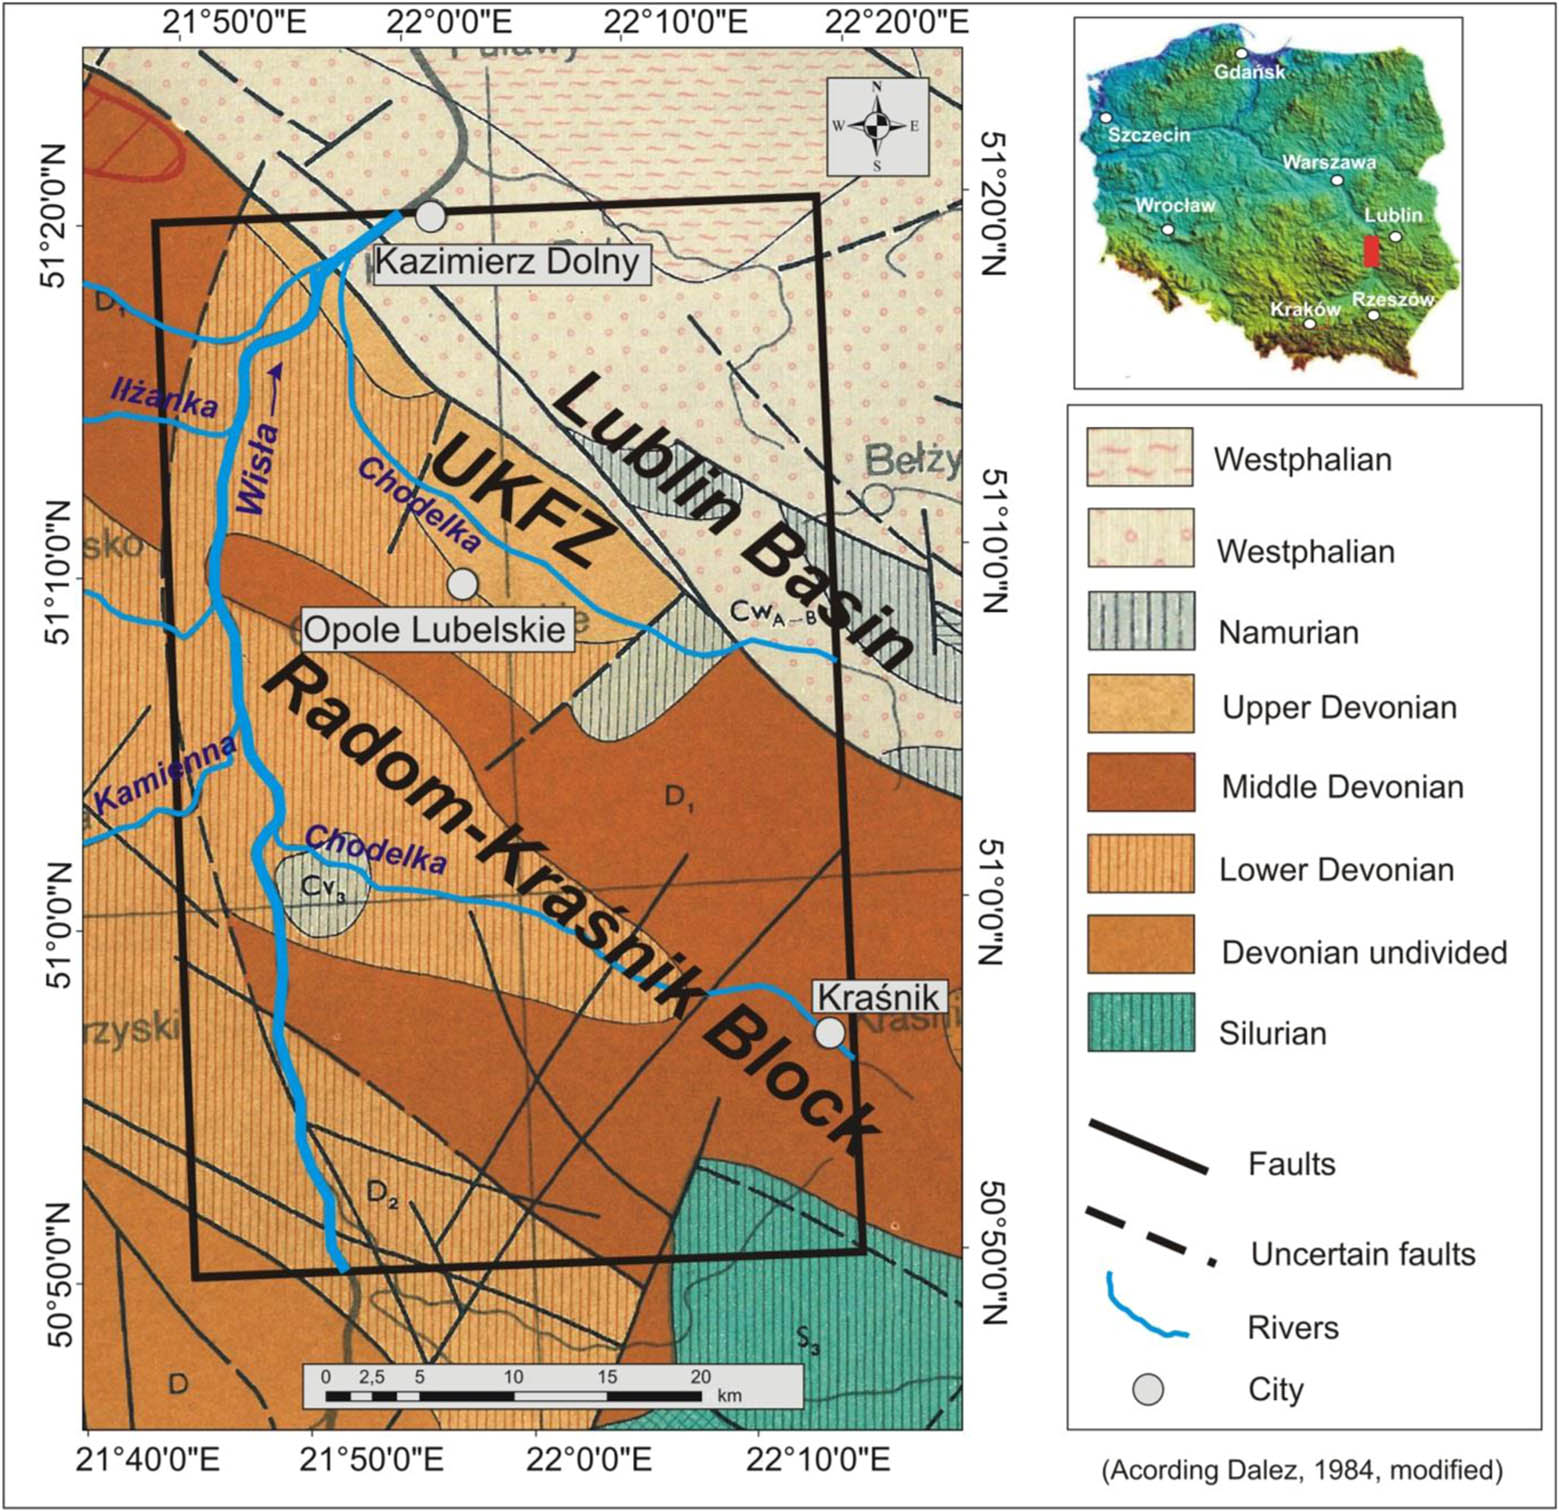
Study area location and geological setting.
The fundamental concept of lineaments was introduced by ref. [15] and described it as significant lines in the Earth’s landscape which reveal the hidden architecture of the basement. Since then, several definitions have been put forth by many studies such as refs. [16,17], which have defined lineaments as mappable linear or curvilinear features of a surface whose parts align in a straight or slightly curving relationship that may be the expression of a fault or other linear zones of weakness as derived from remote sensing sources such as optical imagery, radar imagery, or digital elevation models.
In a lineament mapping procedure, the lineaments are often visually identified by an interpreter (e.g., a geologist), which implies that the obtained lineaments are in some way subjective interpretations and that they often are extracted manually, e.g., lineaments from the remote sensing data are hand-drawn on transparent overlays [18]. This methodology produces results to a large extent that cannot be reproduced because the identification criteria are not agreed upon by different analysts and usually cannot be expressed in quantitative terms but, rather, are based on sensory impressions. Practically, all geologic work includes some amount of subjective interpretation, but it is desirable to minimize this kind of uncertainty. Lineament extraction could be more highly valued if the results were reproducible. This would be achieved by using some form of automatic, or criteria-based, lineament extraction algorithm [19]. Therefore, a large number of researchers have designed and implemented a series of automatic interpretation algorithm [20]. This work presents a comprehensive approach to use GIS techniques. A combination of the traditional method and the automatic lineament extraction method was used. The Geographical Information System (GIS) technique has become an indispensable tool in the analysis of lineaments because of its ability to process quickly, store results quantitatively, and also to generate maps that facilitate the study of their spatial distribution. In remote sensing images, geological lineaments show up as lines or linear structures that are significantly brighter or darker than the background pixels. Such lineaments include faults and fractures that have obvious displacement, ruptures that have no significant fracture displacement (e.g., joint zones, cleavage belts, structural fissures, and tectonic crush zones), and large crustal fractures, deep faults, buried faults, linear microgeomorphological features, and linear traces that reflect abnormal hues. Their occurrence is used to identify the geological structure and neotectonic activity. Especially, the analysis of relief on digital terrain models combined with field studies provides a lot of information on the neotectonic activity. Often, geological and geomorphological surveys conducted in the field can help identify the occurrence of neotectonic processes. According to ref. [21], the Ursynów–Kazimierz fault zone is visible in the landscape around Dobre. A pronounced morphological slope that has neotectonic genesis occurs in that area. According to ref. [22], the main stage of the neotectonic rise of the Lublin Upland and Roztocze began already in the early Pleistocene. The reactivation of old faults and the formation of neotectonic trenches took place mainly in the late Sarmatian and early Pleistocene [23]. According to ref. [24], the amplitude of the Quaternary vertical movements in this region of the Lublin region was about 50 m. Therefore, this could have triggered strong erosion processes leading to sediment removal. Currently, neotectonic movements are at 0.5 mm/year [25–27] (Figure 2).
![Figure 2 Vertical movements in the Kazimierz Dolny region. According to ref. [25–27].](/document/doi/10.1515/geo-2020-0059/asset/graphic/j_geo-2020-0059_fig_002.jpg)
Therefore, the question arises what is the relationship between the thickness of the Quaternary deposits and their distribution and the activation of neotectonic movements. This is an important question because very weak seismic shocks with magnitude values from 1 to 2 on the Richter scale are still recorded here (http://www.isc.ac.uk). Which may suggest a contemporary weak tectonic activity in this area. Therefore, the question arises what is the relationship between the thickness of the Quaternary deposits and their distribution and the activation of neotectonic movements. This is an important question because very weak seismic shocks with magnitude values from 1 to 2 on the Richter scale are still recorded here (http://www.isc.ac.uk). It may suggest a contemporary weak tectonic activity in this area.
2 Geomorphological and geological characteristics of the study area
The Nałęczów Plateau is different from the monotonous Bełżec Plain. The plateau is heavily cut with a network of dry valleys and gorges. These incisions are associated with the occurrence of a thick loess cover. The top area of the hills gives a homogeneous hypsometric surface at 200–220 m a.s.l. The axis of the plateau trends WNW–ESE, following the Upper Cretaceous layers. The Chodel Basin is a triangular depression adjacent to the Vistula valley from the east, extending over a distance of 20 km. It is a subsequent denudative depression created in the outcrop area of low-resistant Upper Maastrichtian marl, marly limestone, and chalk. From the northeast, it borders with the Bełżec Plain and from the south with the Urzędów Hills (Figure 3).
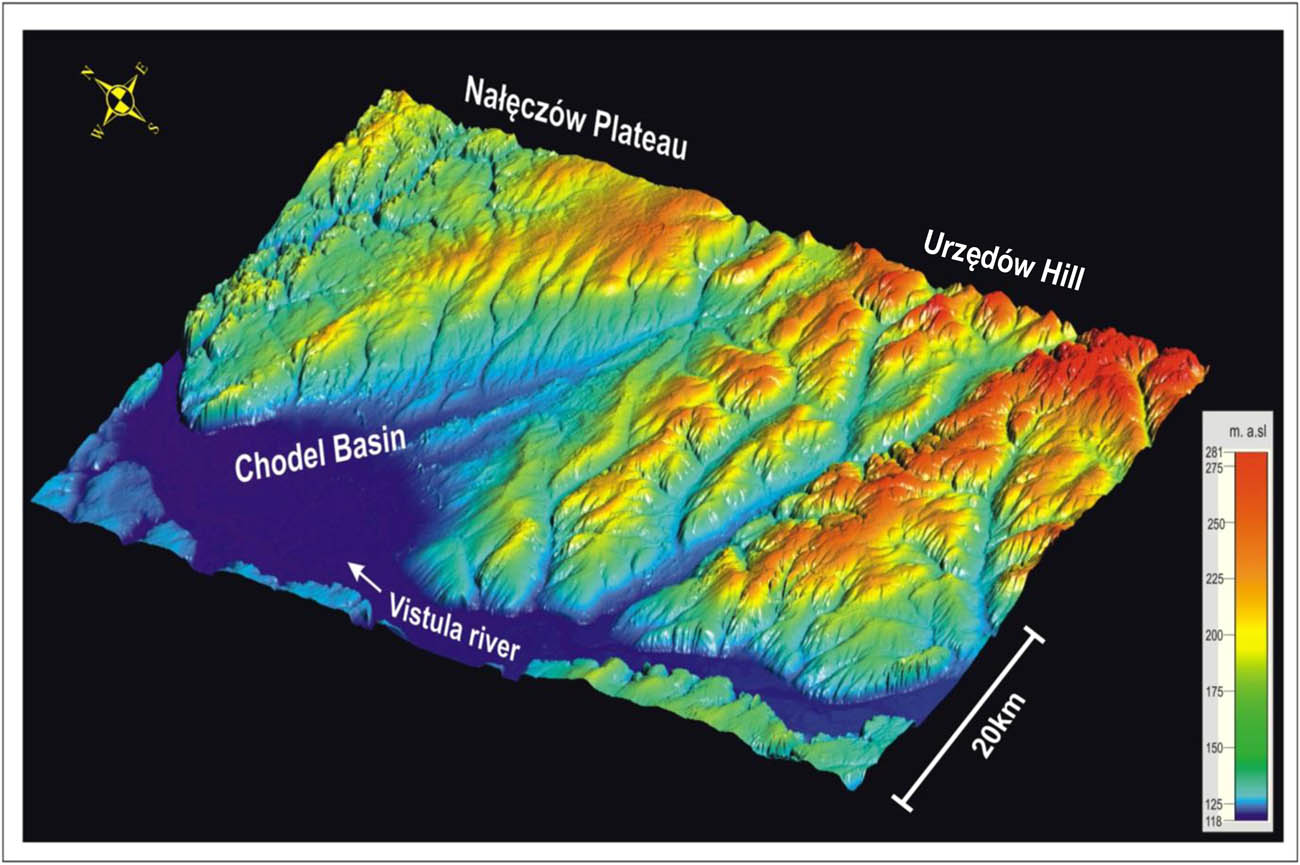
The geomorphological setting of the study site.
These are plateaus in character with flat hills, cut by river valleys, and gorges characteristic for loess areas. The nature of the valley varies greatly depending on the hardness of the Upper Cretaceous rocks. Geologically, the research area is located within the Paleozoic Radom–Kraśnik Elevation, which is the basement of the southwestern flank of the Lublin Basin. It separates the rigid East European platform from the folded structures of Western Europe. The Paleozoic basement is located at a depth of 1,000–1,500 m. It is composed of Devonian limestones and dolomites, as well as Carboniferous mudstones, clays, and sandstones. The Upper Jurassic sediments are lying inconsistently above the Paleozoic deposits. Upper Cretaceous deposits lie in the Jura deposits. The Upper Cretaceous is represented by Cenomanian, Turonian, Coniacian, Santonian, Campanian, and Maastrichtian deposits [28]. Quaternary sediments occur only locally in this area. The southwestern part is covered with a thick layer of loess 20 m. The loess layer is underlain by Middle Polish glaciation, e.g. glacial sands and gravels, and residual sands with boulders and clays.
3 Methods
3.1 Data preprocessing
3.1.1 Digital terrain model (LiDAR–DTM)
The elevation data from the flood-prevention ISOK project were used for studying topography. The products of the ISOK project are provided by the Geodesic and Cartographic Documentation Center in Warsaw (www.codgik.gov.pl). The data obtained during laser scanning are saved in the form of ASPRS LAS files called LAS (Laser File Format). The scanning density was four points per square meter. The primary processes for processing the points cloud provided by the ALS scan are classification and filtration [29]. Elevation data were acquired in September 2014. The DTM generation process involved the classification of the points cloud. The points cloud was divided into the following layers: surface, low vegetation, medium vegetation, high vegetation, and buildings. Then, the tools available in the QCoharent software were applied to filter the points related to the surface topography from the cloud. The next step was the interpolation of elevation points using the deterministic algorithm IDW (Inverse Distance Weight). The effect was a DTM with a grid mesh size of 10 m.
3.1.2 Edge detection
Er Mapper and QGis software were used to detect edges on the LiDAR–DTM model. After importing the digital terrain model into the Er Mapper program, two high-pass filters were used for further analysis: Sharpen.11.ker and a Gaussian filter. Both filters have significantly improved the readability of the surface relief of the digital terrain model. Then, DTM was imported into QGis. The Terrain surface classification algorithm was used to classify the edges. This algorithm is often used in machine learning used in neural networks [30]. The Laplacian filter kernel plays a key role in this algorithm. The Laplacian is a 2D isotropic measure of the second spatial derivative of an image. The Laplacian of an image highlights regions of rapid intensity change and is therefore often used for edge detection (see zero-crossing edge detectors). The Laplacian is often applied to an image that has first been smoothed with something approximating a Gaussian smoothing filter to reduce its sensitivity to noise. As a result of the classification, four classes were obtained. Three classes representing different types of edges were used for further analysis.
3.1.3 Lineaments extraction
In ArcGis.10.6, automatic vectorization of the results of the digital terrain model classification was performed. Before automatic vectorization, the raster was cleaned of individual pixels and various artifacts. The program only vectorizes lines, does not recognize symbols or texts. It also does not keep the colors or the line thickness.
3.2 Geostatistical modeling
3.2.1 Kernel density algorithm
In statistics, kernel density estimation is a nonparametric way to estimate the probability density function of a random variable. Kernel density estimation is a fundamental data smoothing the problem where inferences about the population are made, based on a finite data sample [31]. The studied random variable can be one- or multidimensional. Belonging to a group of nonparametric methods means that when using them, a priori information on the type of distribution is not required. The classic parametric methods of density estimation required a prior determination of this type, after which – as part of their application – only the values of existing parameters in its definition were determined [32].
3.2.2 Empirical Bayesian Kriging
Empirical Bayesian Kriging automates the most difficult aspects through a process of subsetting and simulations. The EBK process implicitly assumes that the estimated semivariogram is the true semivariogram for the interpolation region and a linear prediction that incorporates variable spatial damping. The result is a robust nonstationary algorithm for spatial interpolating geophysical corrections. This algorithm extends local trends when the data coverage is good and allows for bending to an a priori background mean when the data coverage is poor [33] (Figure 4).
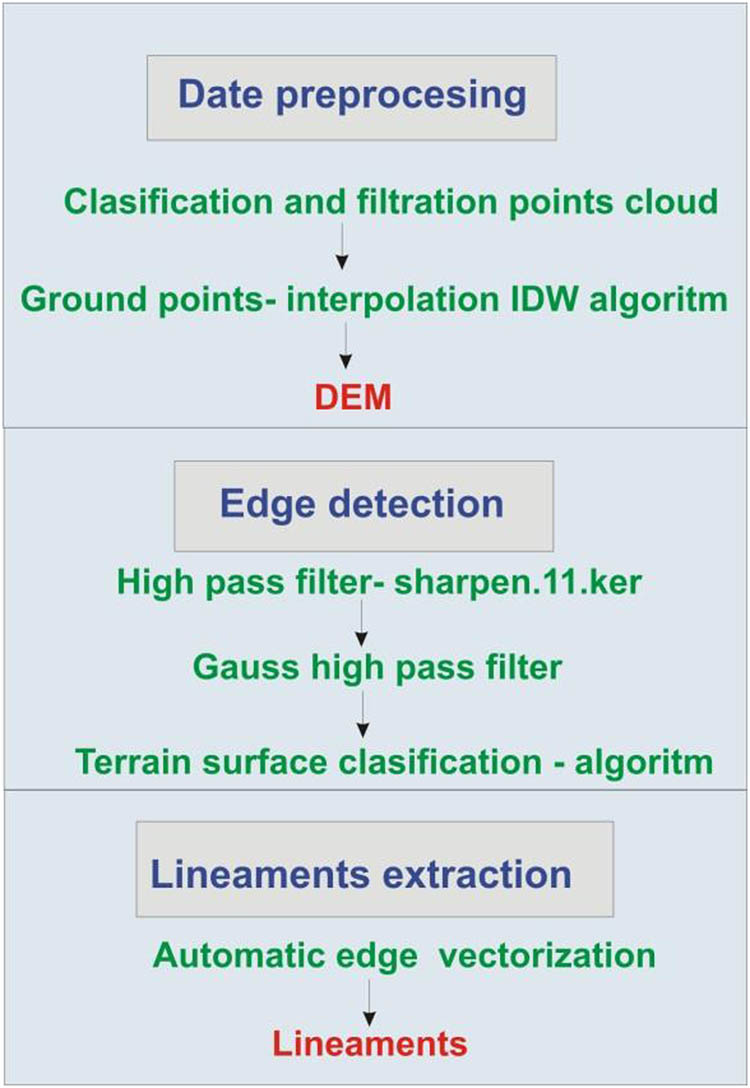
Algorithm for extracting topolineaments from DTM.
4 Results
4.1 Visual interpretation of topolineaments
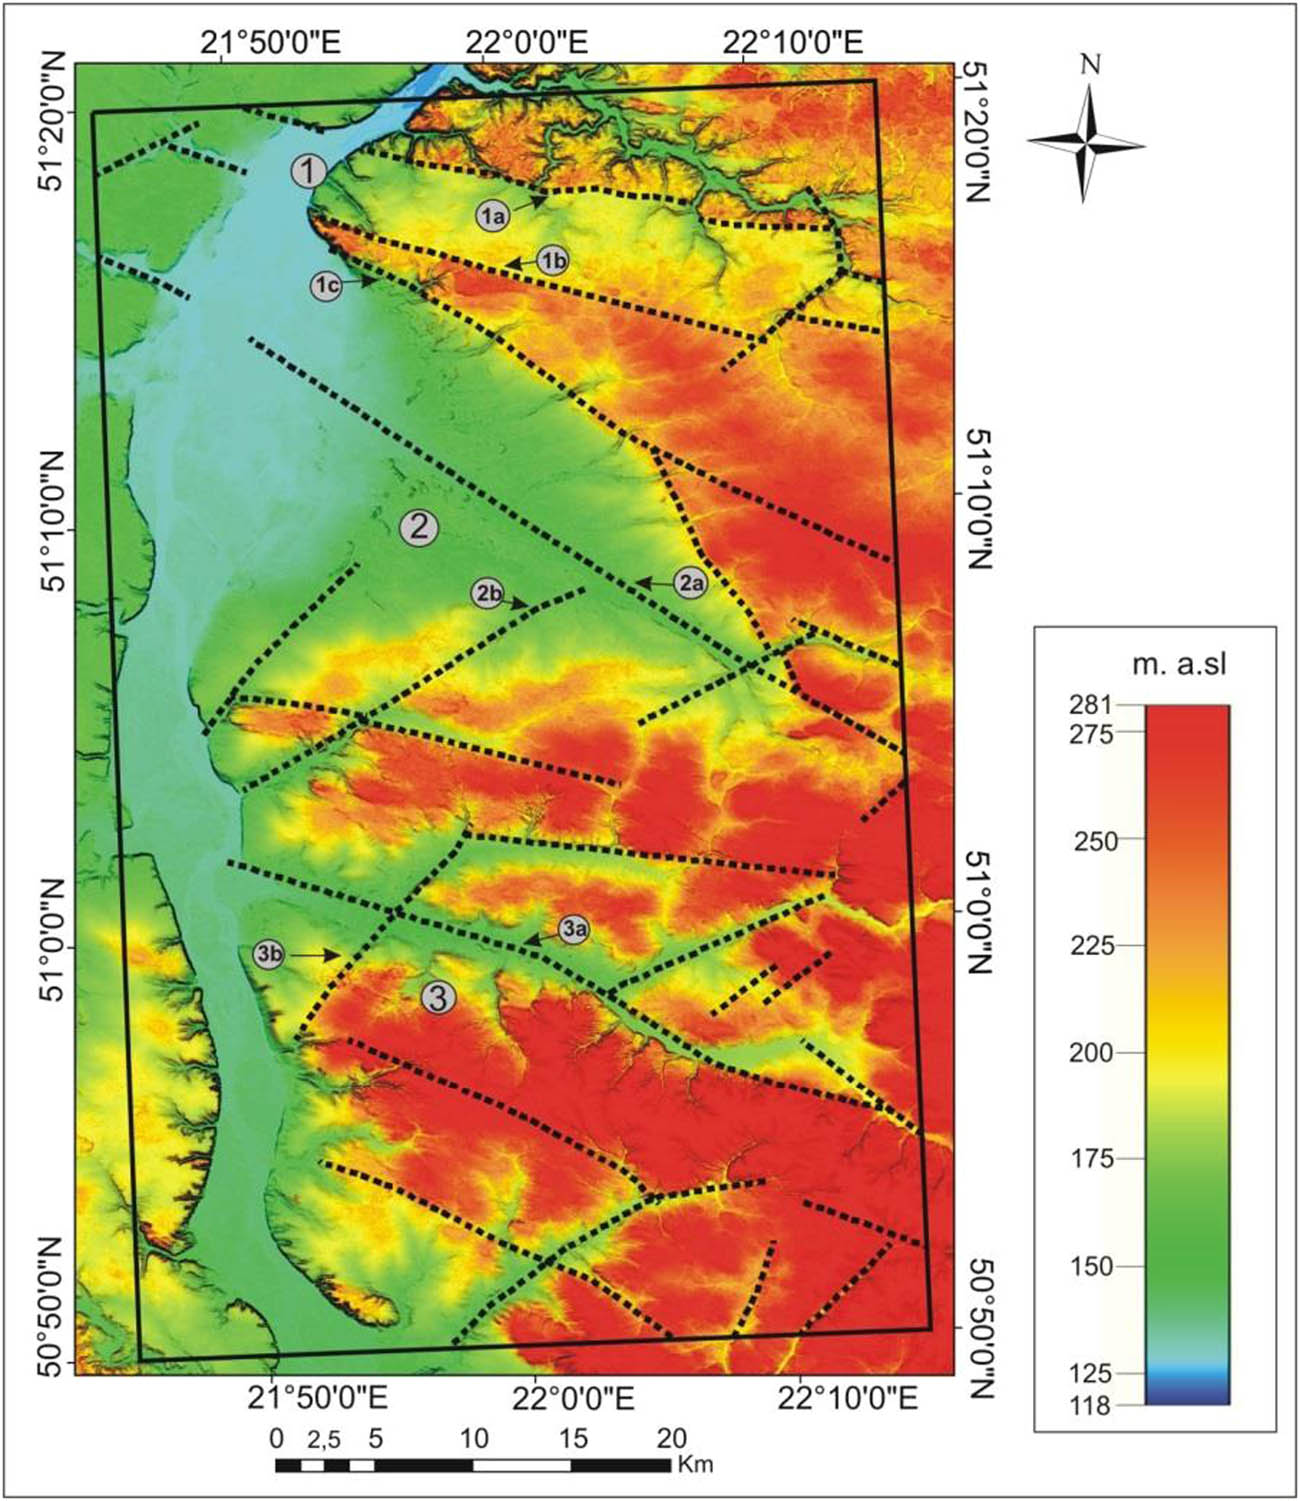
Based on field observations, as well as the analysis of the shaded terrain model (Figure 5) and the use of high-pass filters, two main topolineament systems were interpreted, spatially orientated NW–SE and SW–NE. Three groups of topolineaments were distinguished.
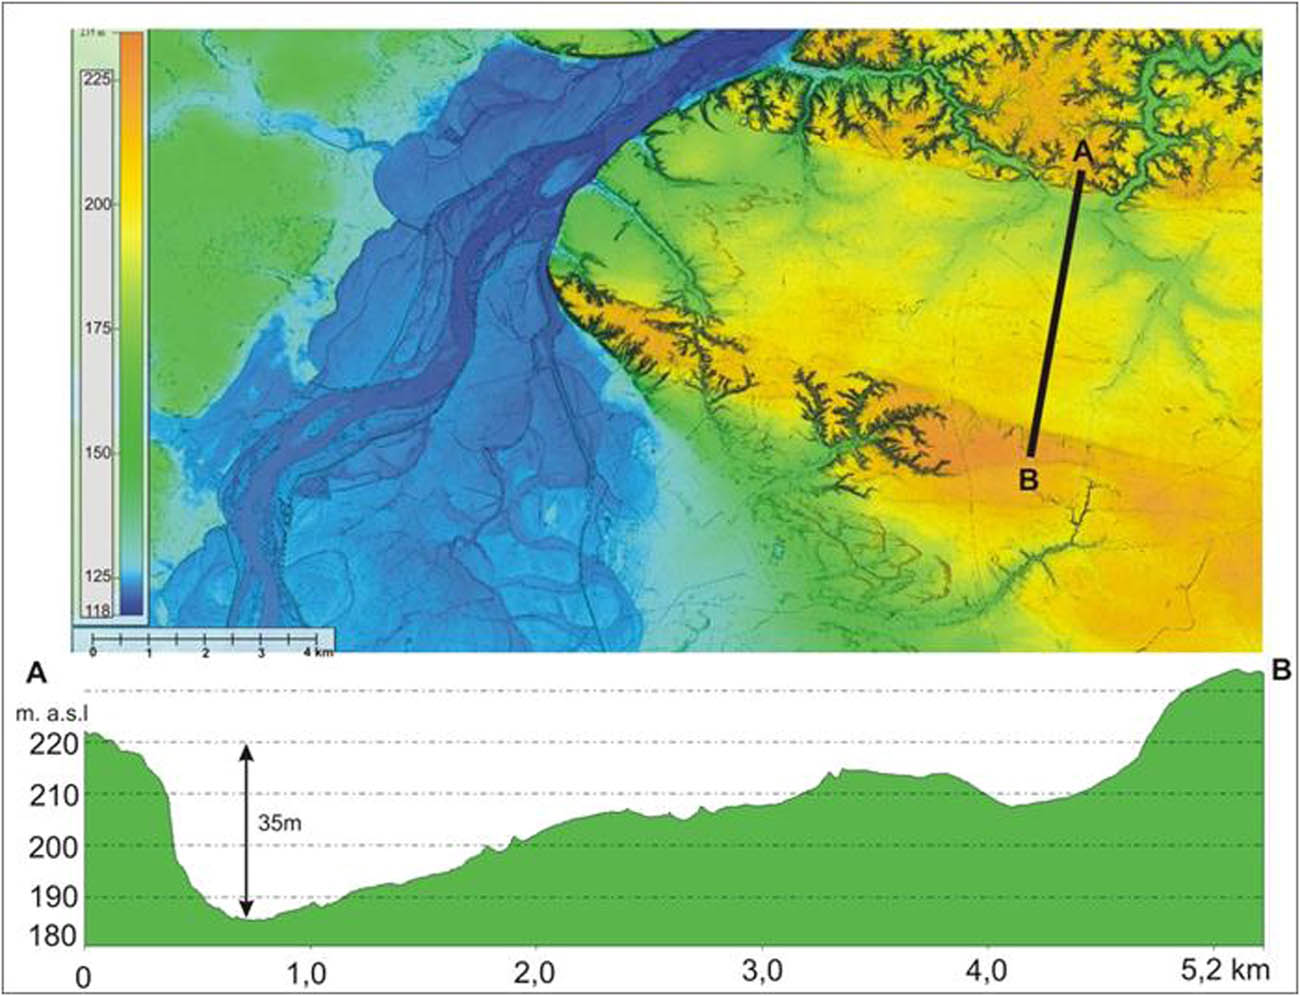
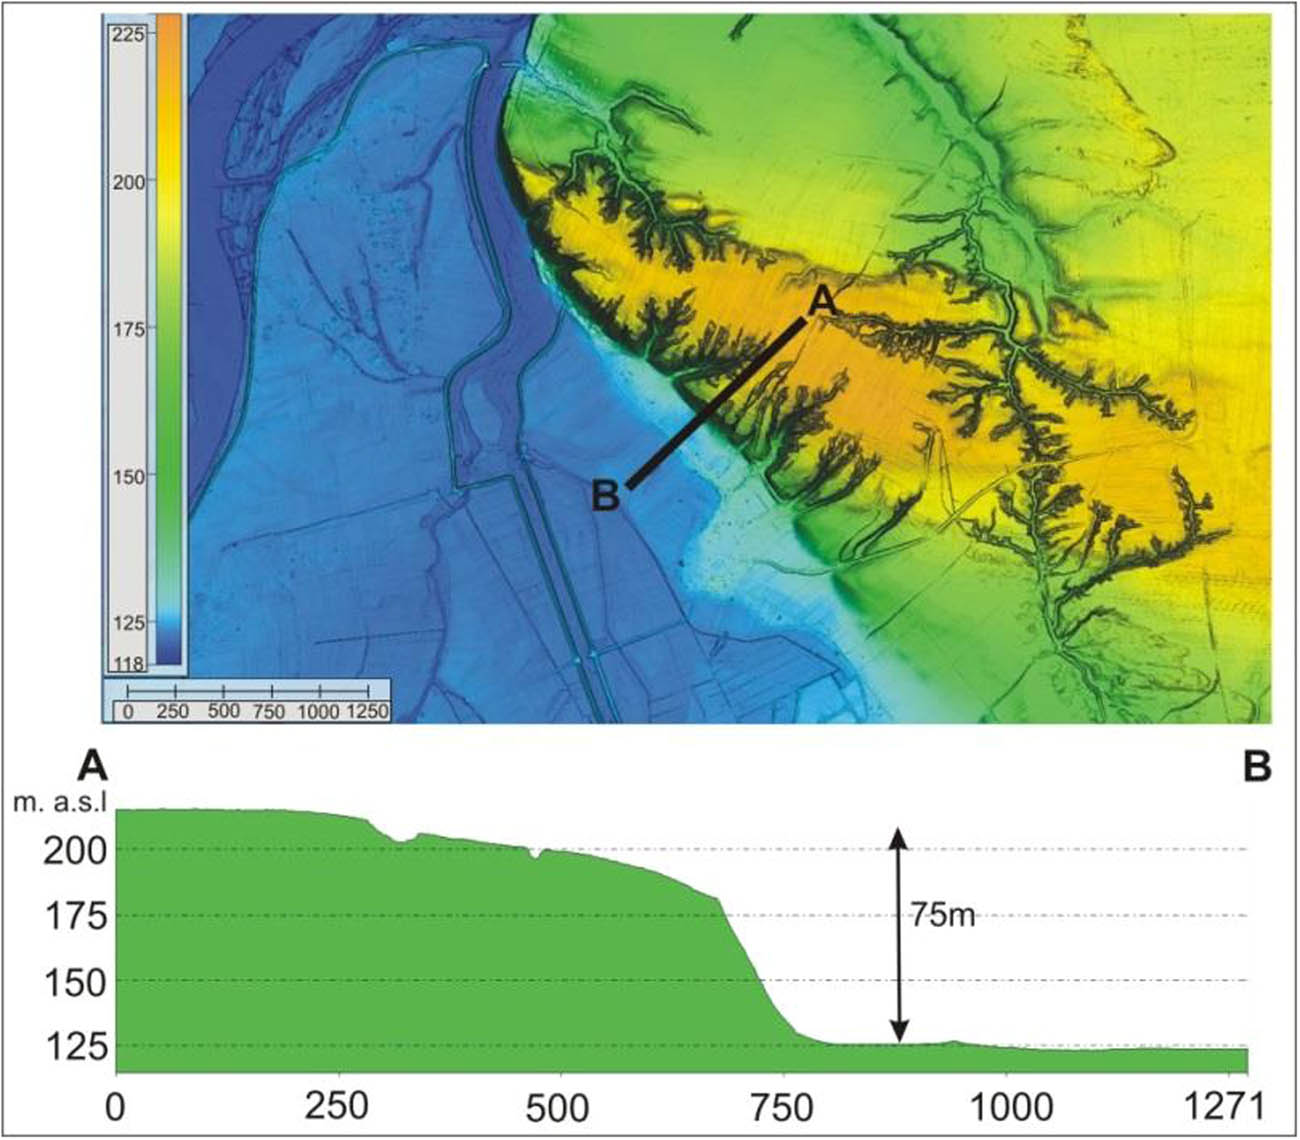
The first group of topolineaments was interpreted in the northern and northeastern parts of the study area. Three main topolineaments NW–SE (1c) run here WNW–ESE (1a, 1b). Topolineaments 1a and 1b were formed on lithostratigraphic boundaries between loess from the North Polish glaciation and clays and glaciofluvial sands from the Middle Polish glaciation. The course of both topolineaments is emphasized by a sudden change in terrain (about 35 m-high morphological thresholds) (Figure 6). Topolineament 1c has been distinguished on the lithostratigraphic boundary between loess and terraces above the floodplain originating from the North–Polish glaciation in the Vistula valley. It is also distinguished in the land relief by a distinct, over 75 m-high escarpment (Figures 7 and 8).
The second group of topolineaments was interpreted in the area of the Chodel Basin (Figure 8). These topolineaments show spatial directions NW–SE and NE–SW. Two topolineaments (2a and 2b) have been distinguished. The first one, about 35 km long, runs along the Chodelka River valley. It is relatively well readable in the relief of the digital terrain model. The NW–SE spatial orientation refers to the main directions of tectonic structures and faults developed in Cretaceous rocks. The second of the highlighted 2b topolineaments, 17 km long and oriented NE–SW, in the southwestern part refers to the direction of the Węglowiecki stream. Areas located southeast of the topolineament are built of loess cover around 15 m as well as clays, sands, and gravels of the Central Polish glaciation. The northwestern areas of the topolineament are built mainly of chalk rocks.
The third group of topolineaments was interpreted in the southern part of the study area. There are two main topolineaments. The first one, about 35 km long and oriented NE–SW, runs along the Wyżnianka River (Figures 8 and 9). The southwestern area is covered by loess with a thickness of about 20 m. The relief of these areas is varied and characterized by a dense network of gullies, e.g. near Kraśnik and Wyżnica. This topolineament refers to its course to both Paleozoic and Mesozoic tectonic directions. The other topolineament, 3b, about 16 km long and oriented SW–NE, runs mainly along the valley of the Tuczyn stream (Figures 8 and 9). Areas located on the northwestern side are covered by loess with a maximum thickness of about 20 m. In contrast, the areas located on the northeastern side are characterized by less varied relief and a much smaller thickness of Quaternary deposits, in places, e.g. around Gościeradów.
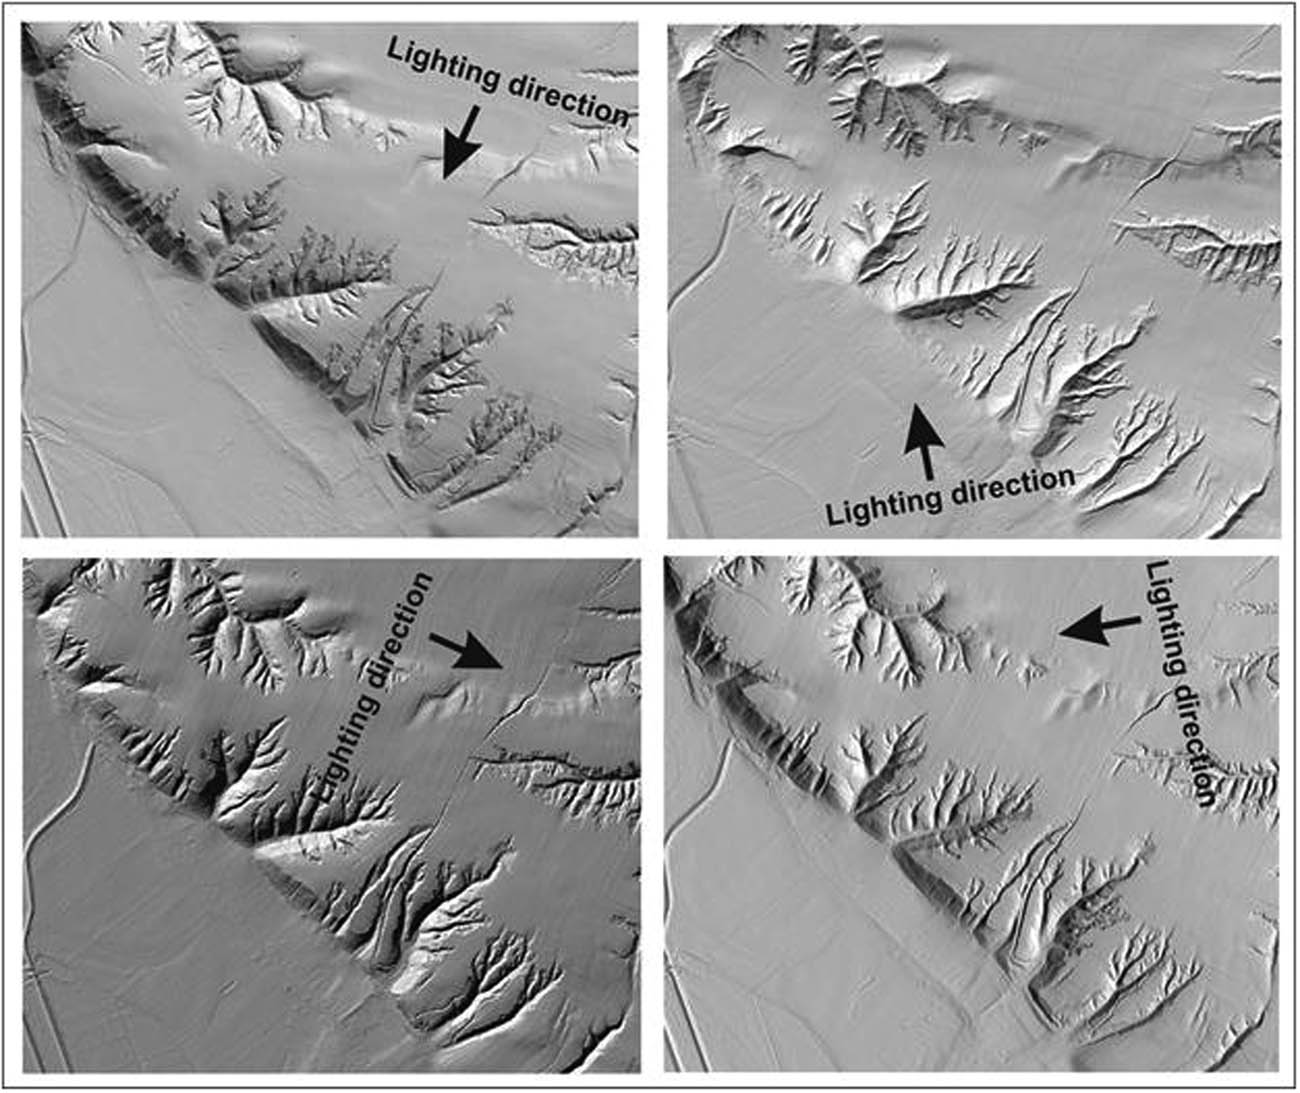
Lighting from the different sides of the LiDAR DTM.
The course of both topolineaments is emphasized by the sudden change in terrain.
Topolineaments are underlined by the morphological threshold.
Visual interpretation of topolineaments.
Topolineaments length chart.
4.2 Automatic extraction topolineaments
Automatically generated topolineaments are fundamentally different from visually interpreted topolineaments. The main difference lies in the greater number of topolineaments, length, and spatial orientation (Figure 10).
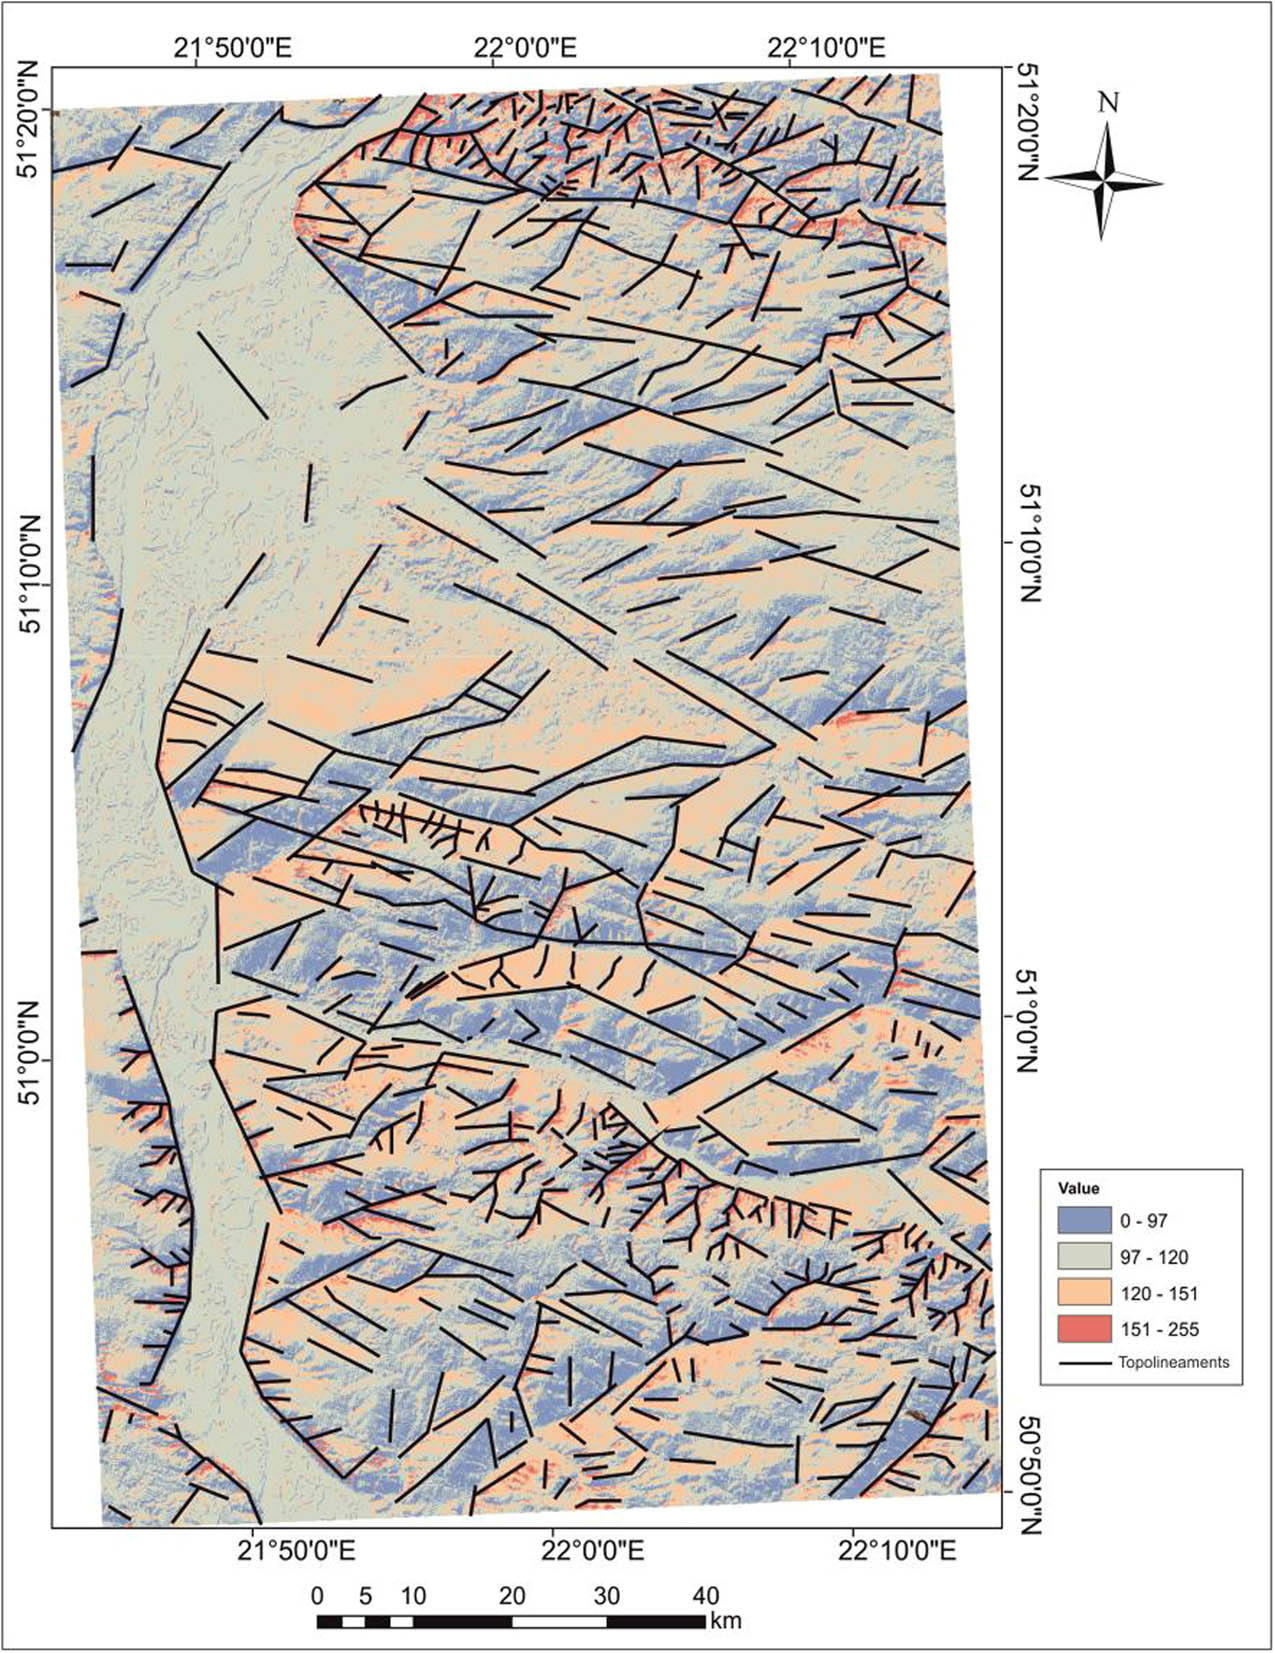
Automatic extracting topolineaments.
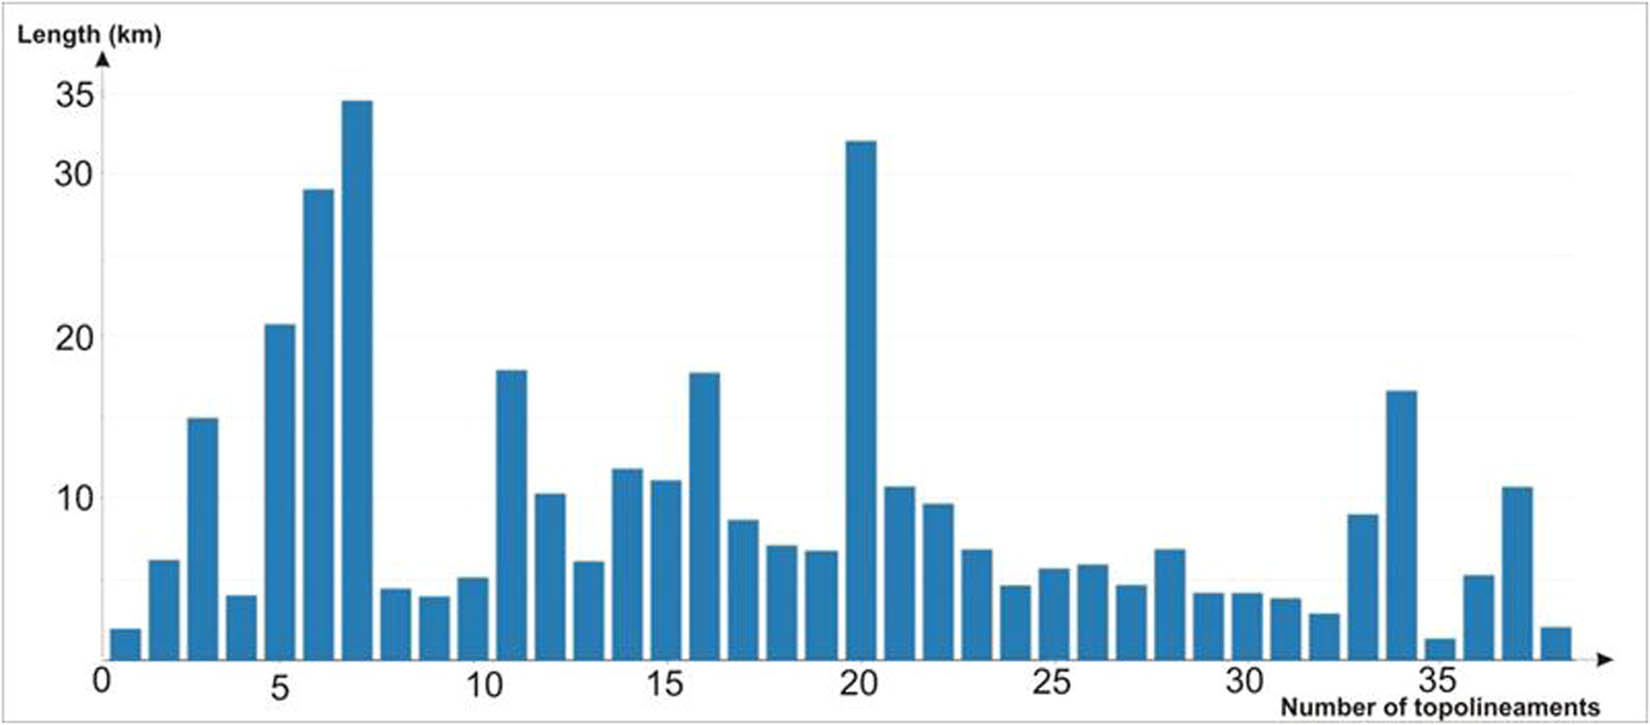
Almost 800 topolineaments were generated automatically. The longest lineaments are about 10 km long, and the shortest lineaments are less than 2 km long (Figure 11).
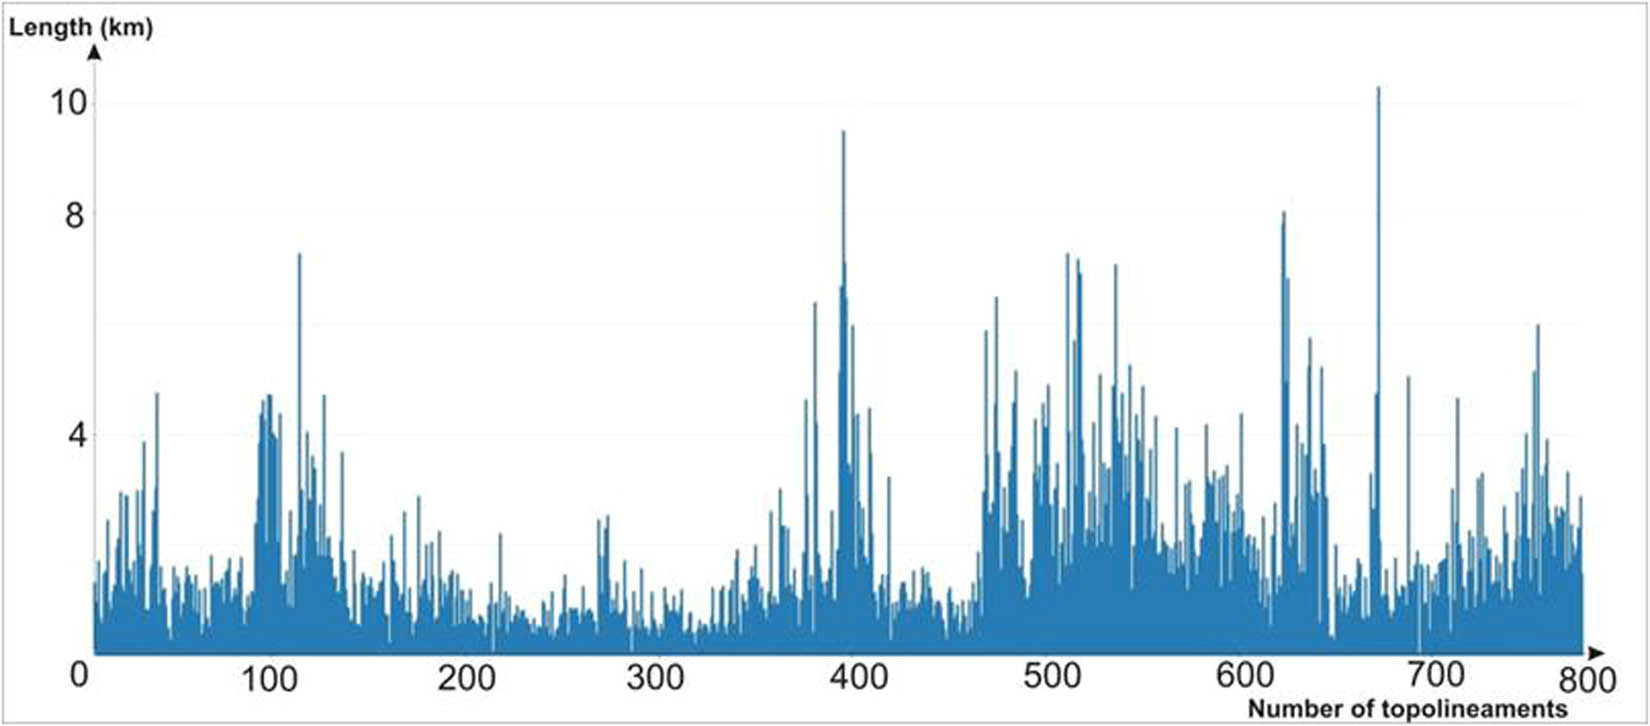
Topolineaments length chart.
Most topolineaments occur in loess areas. These are generally shorter lineaments. They are from 2 km to over 4 km long. They also show spatial orientation in different directions. However, topolineaments found in Cretaceous limestone rocks are longer than in loess and have from 6 to 10 km. They have two directions of spatial orientation: the first, of course, NE–SW and the second NW–SE.
4.3 Density topolineaments
Topolineaments generated automatically and interpreted visually were imported into the program ArcGis. The Spatial Analyst Tool module uses a kernel density algorithm to generate model density of topolineaments. As a result, two models of topolineament density were obtained. The first model for visually interpreted lineaments and the second for topolineaments obtained automatically. The obtained results showed a diverse picture of the spatial density of topolineaments on both density models (Figure 12). In the first model, the highest densities of topolineaments were obtained for area B located on the border with the Chodelska Basin, as well as area C located in the Wyżnianki valley near Kraśnik (Figure 12).
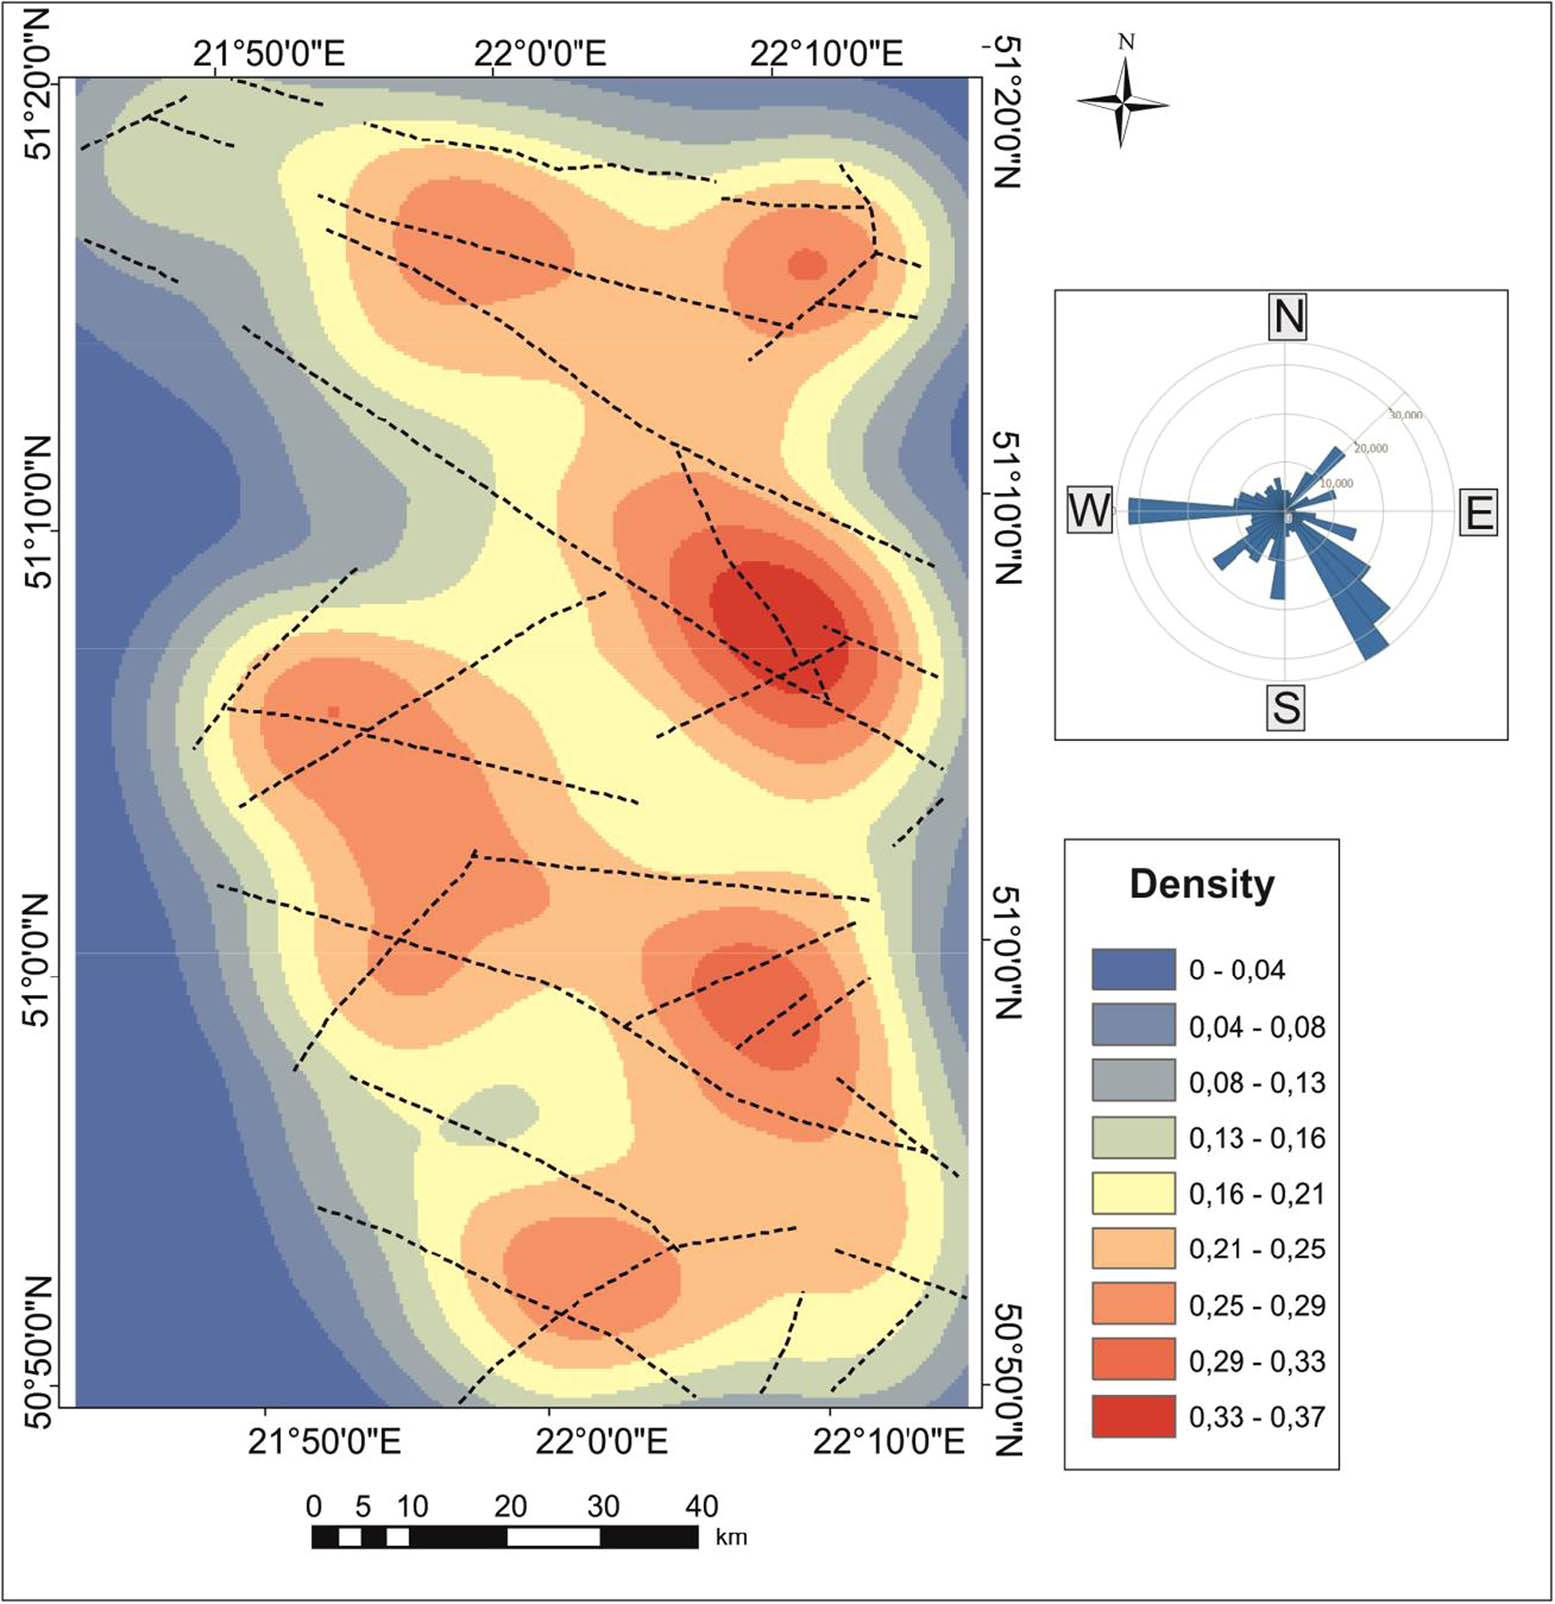
Visual interpretation topolineaments density model.
These are regions with chalk chalky limestone. In the second model, the highest densities of topolineaments were obtained for regions A, B, and C (Figure13). These are areas where there are in large numbers short topolineaments with lengths from 1 to 4 km. Their occurrence is closely related to the lithological structure of the rocks. Networks of these topolineaments occur in loess areas.
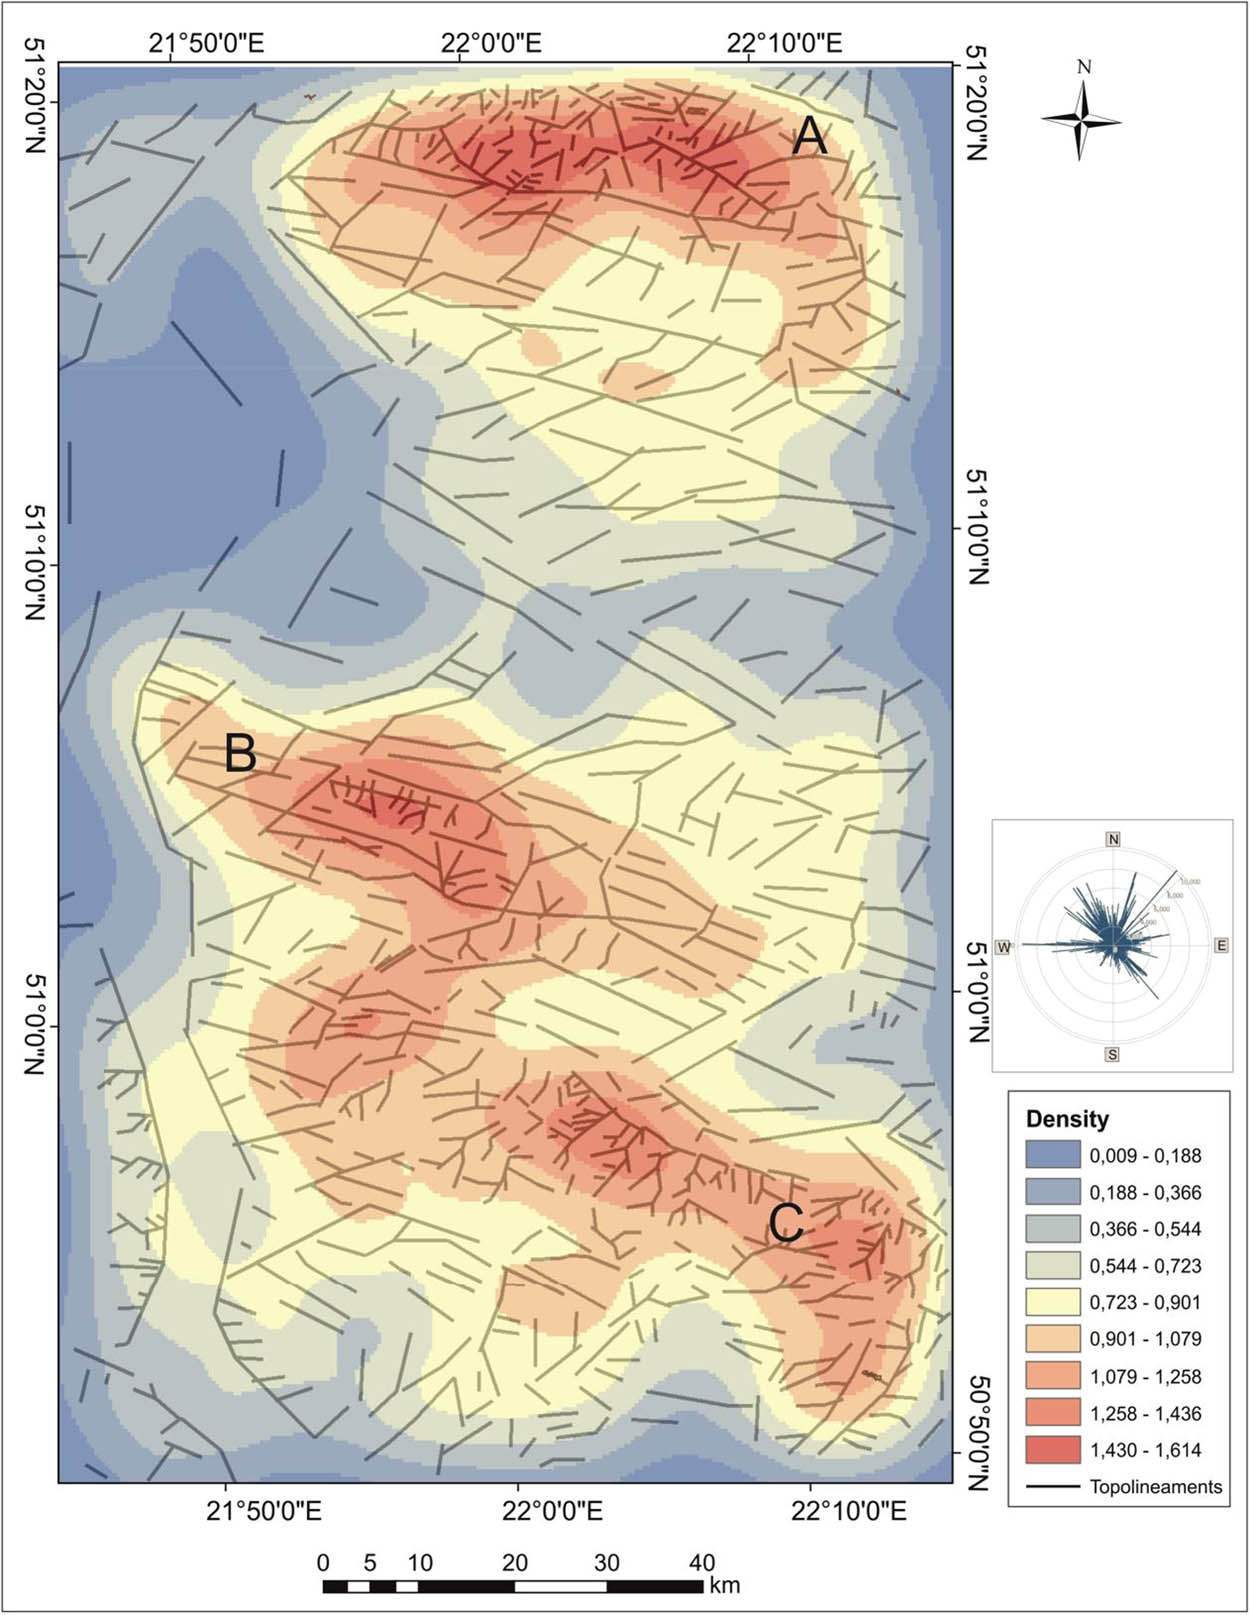
Automatic extraction topolineaments density model.
4.4 Thickness model of Quaternary sediments vs topolineaments
Forty-three historical drillings were used to develop the Quaternary sediment thickness model. The obtained data were then interpolated in ArcGis using the Empirical Bayesian Kriging algorithm (Figure 14).
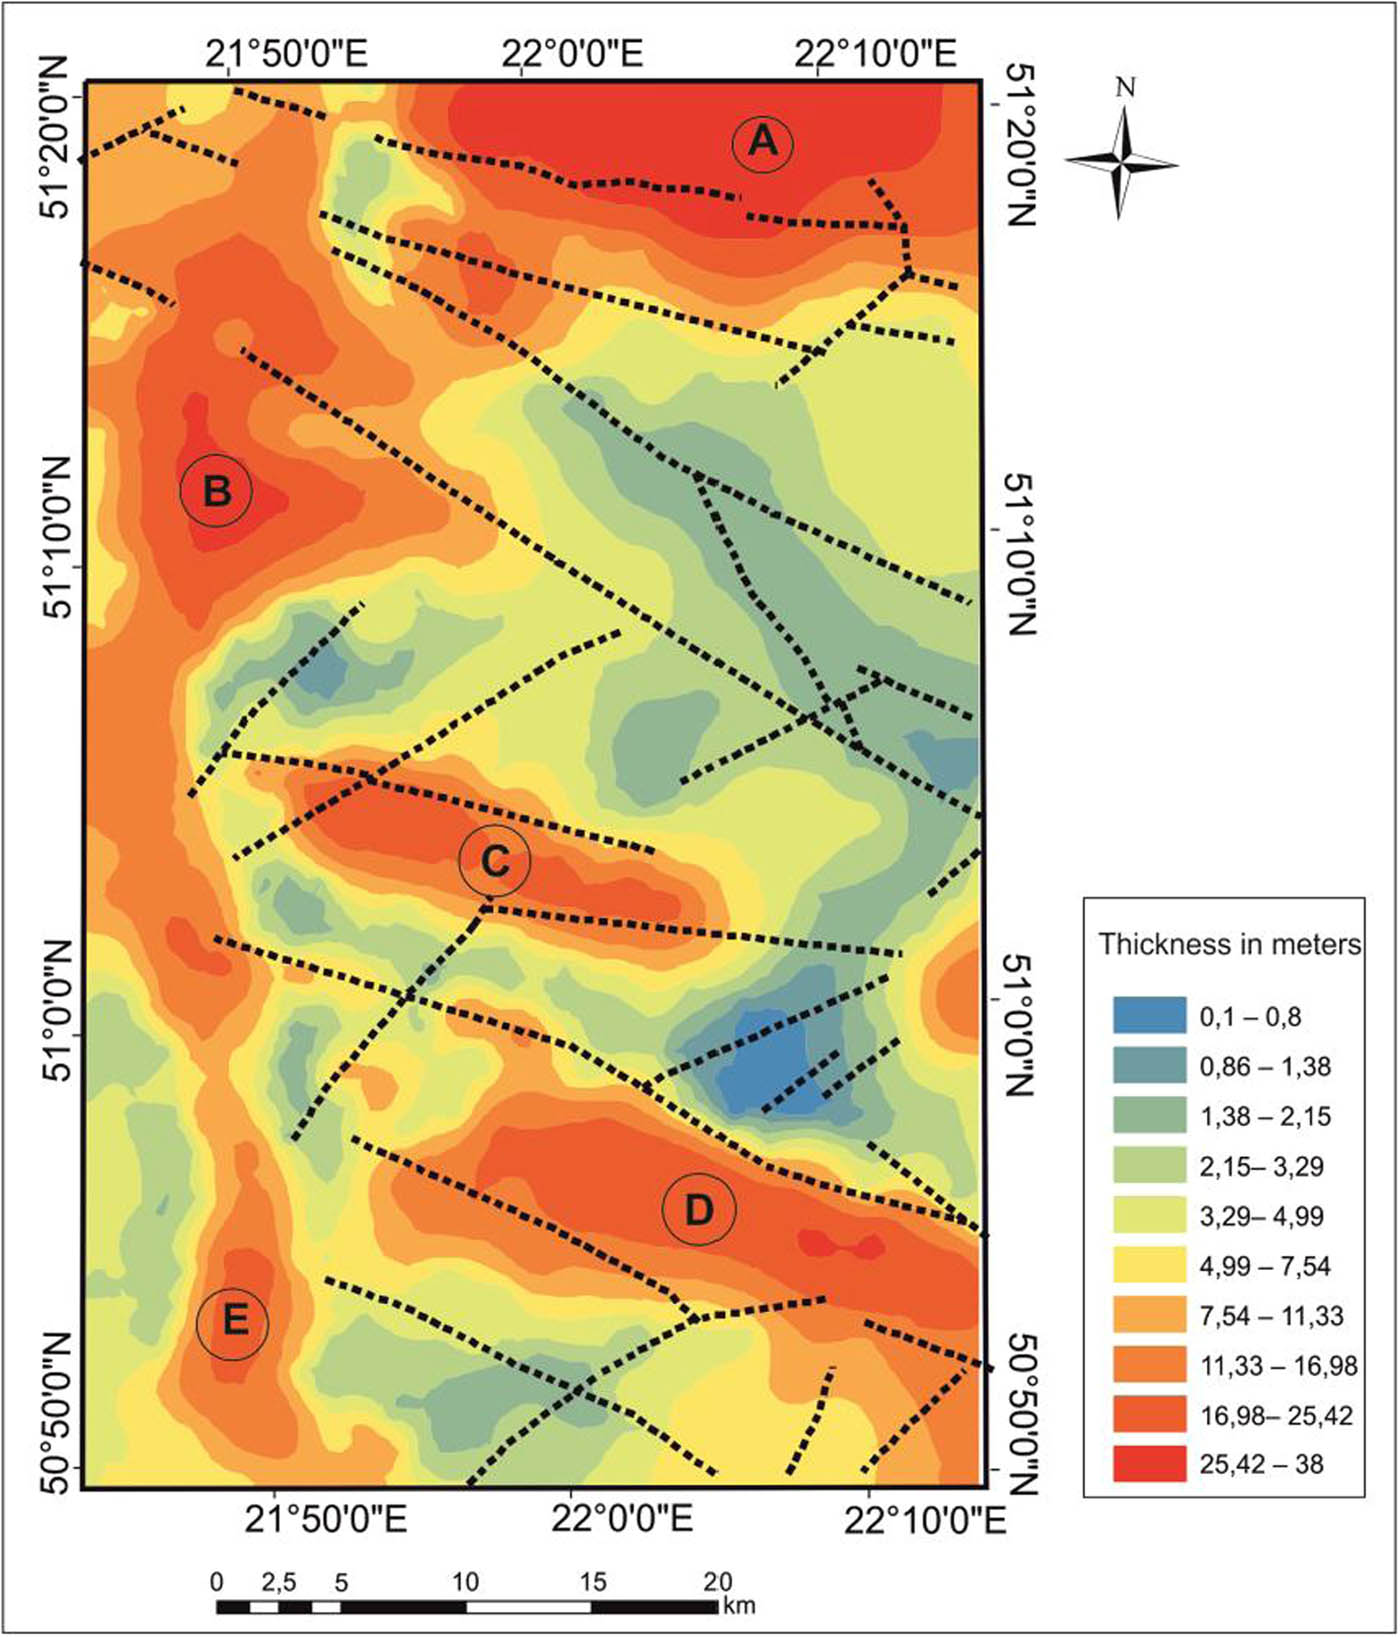
Quaternary deposits thickness model with topolineaments
As a result of interpolation, a spatial picture of the thickness variability of Quaternary sediments was obtained. Five regions (A to E) with significant thicknesses exceeding 16 m were distinguished (Figure 14). Area A is located in the northeast of the study area. The maximum thickness even exceeds 25 m in this area. At its southeastern boundary, there is a WNW–ESE-oriented topolineament. Region B is located in the Vistula valley in the Chodel Basin. From the northeast, this region is bounded by an NW–SE-trending topolineament. Its course is associated with a change in the thickness of Quaternary sediments. Region C is located in the middle of the study area. The thickness of Quaternary sediments ranges from 16 to 25 m. This area is limited by three topolineaments (Figure 14). Two of them run WNW–ESE and the third trends NW–SE. The fourth region (D) is located in the southeastern part of the research area. It is characterized by a large thickness of Quaternary sediments, exceeding 25 m in the Kraśnik area. This area limits the course of three topolineaments: two of them oriented NW–SE and one oriented NE–SW. The fifth region (E) is located in the southwestern part of the research area in the Vistula valley. The sediment thickness is over 16 m. In the second case, three areas A, B, and C were specified (Figure 15).
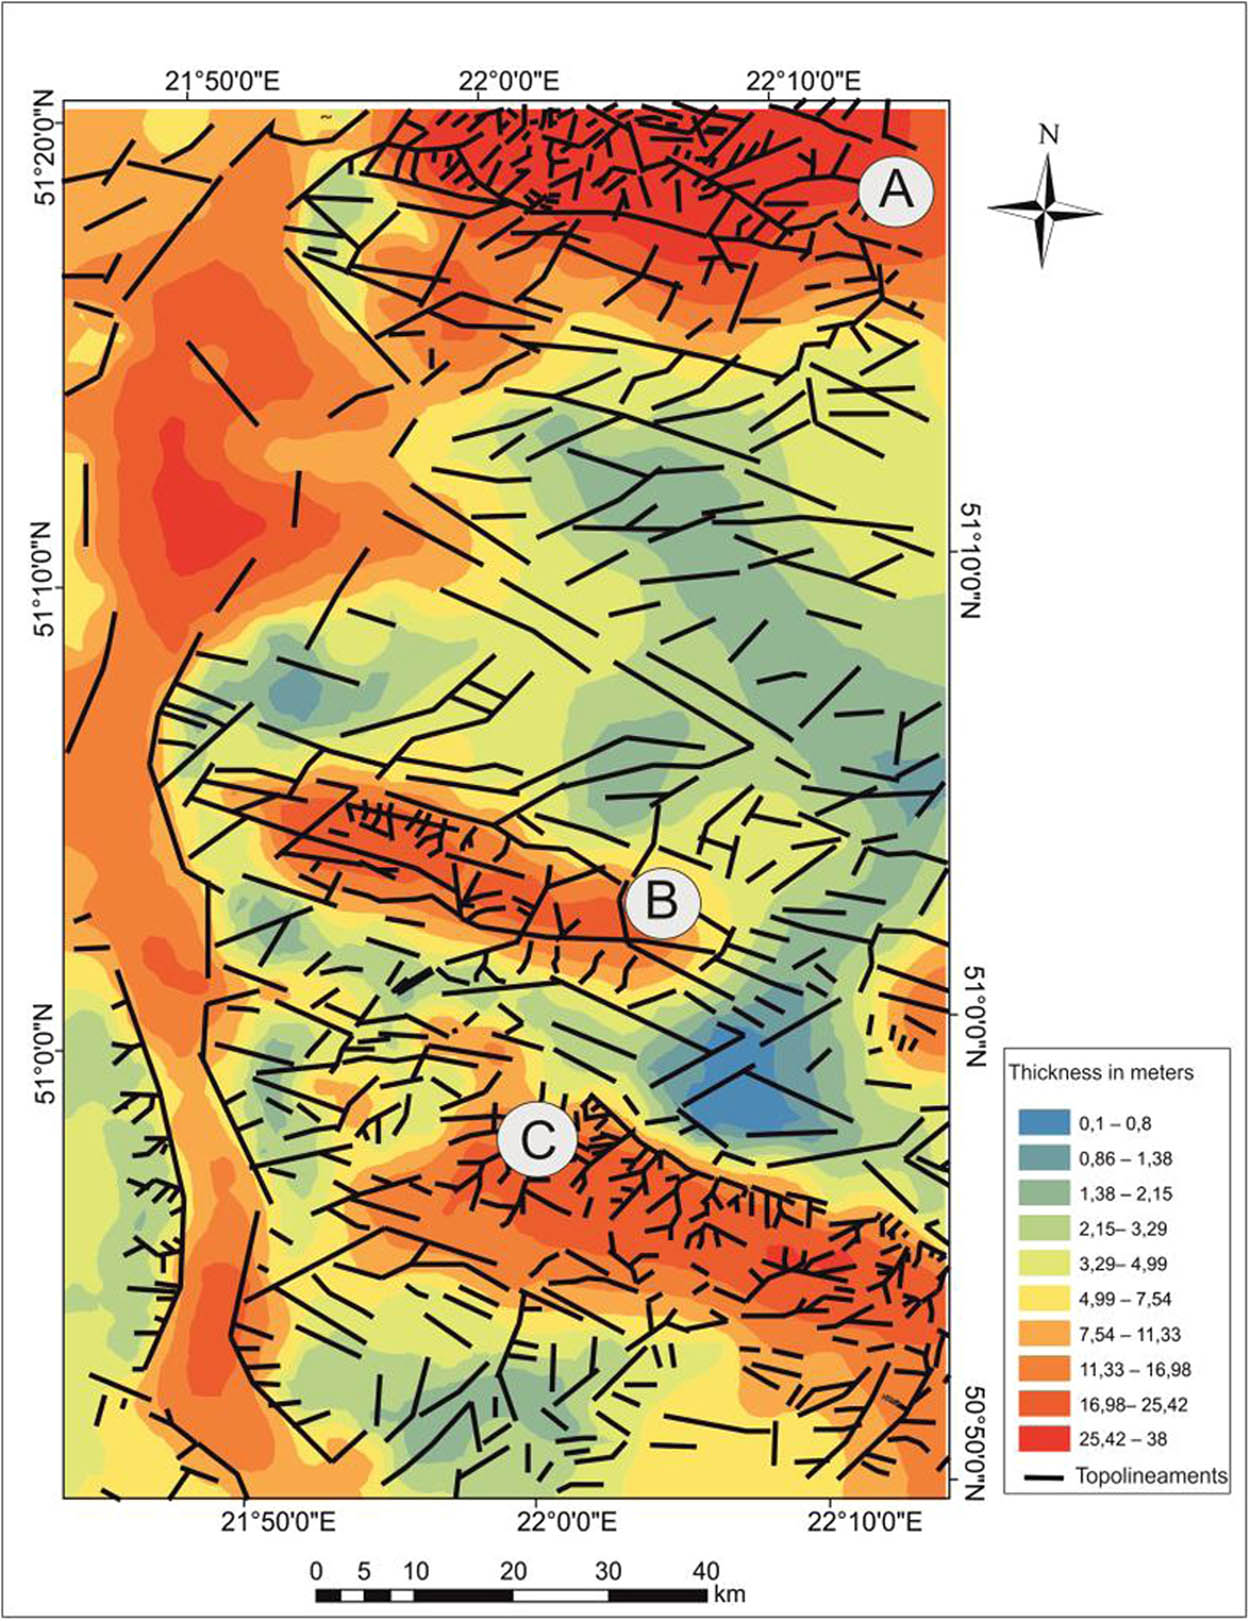
Quaternary deposits thickness model with automatic extracting topolineaments
Their distinction was due to a comparison of the thickness distribution of quaternary deposits with the number of automatic topolineaments. The density of topolineaments depends on the lithology of the geological base. Most topolineaments were recorded in areas covered with loess, which are prone to developing erosion processes. The thickness of these deposits is from 16 m to over 25 m. Topolineaments are not legible in fluvial deposits of the Vistula River. The thickness of these deposits is up to over 20 m.
5 Discussion
The thickness model of Quaternary sediments showed a close relationship with the geological and geomorphological structure of the study area. The thickness obtained was compared with the geological structure presented, among others, on detailed geological maps of Poland on a scale of 1: 50,000 Kazimierz Dolny sheet [34], Opole Lubelskie sheet [35], Chodel sheet [36], Kraśnik sheet [37], and Nałęczów sheet [38]. Based on field research and analysis of geological maps, it was found that the areas of thick (over 16 m) Quaternary sediments are composed mainly of loess, e.g. regions A, C, and D, or sediments of floodplain and floodplain terraces in regions B and E in the Vistula valley (Figures 14 and 15). There is also a close relationship between the course of topolineaments and the variability in the thickness of Quaternary sediments. It should be assumed that the areas of outcrops of Cretaceous rocks or small thicknesses of Quaternary sediments were subject to tectonic uplift. These areas were heavily eroded and most of the Quaternary sediments have been removed. When analyzing the spatial orientation of topolineaments, it should be concluded that the sub-Quaternary substrate may represent a block tectonic structure. The spatial orientation of lineaments was compared with the course of Paleozoic faults [39] and Mesozoic faults [40] (Figure 16). The most pronounced relationship between the directions of the lineaments and faults was obtained in the northern part of the study area. The fault zone of Ursynów–Kazimierz runs here. This zone was reactivated in the Quaternary. Due to this, some areas of the Lublin region were elevated and erosion of the Quaternary deposits occurred. This is now particularly evident in the Quaternary thickness changes.
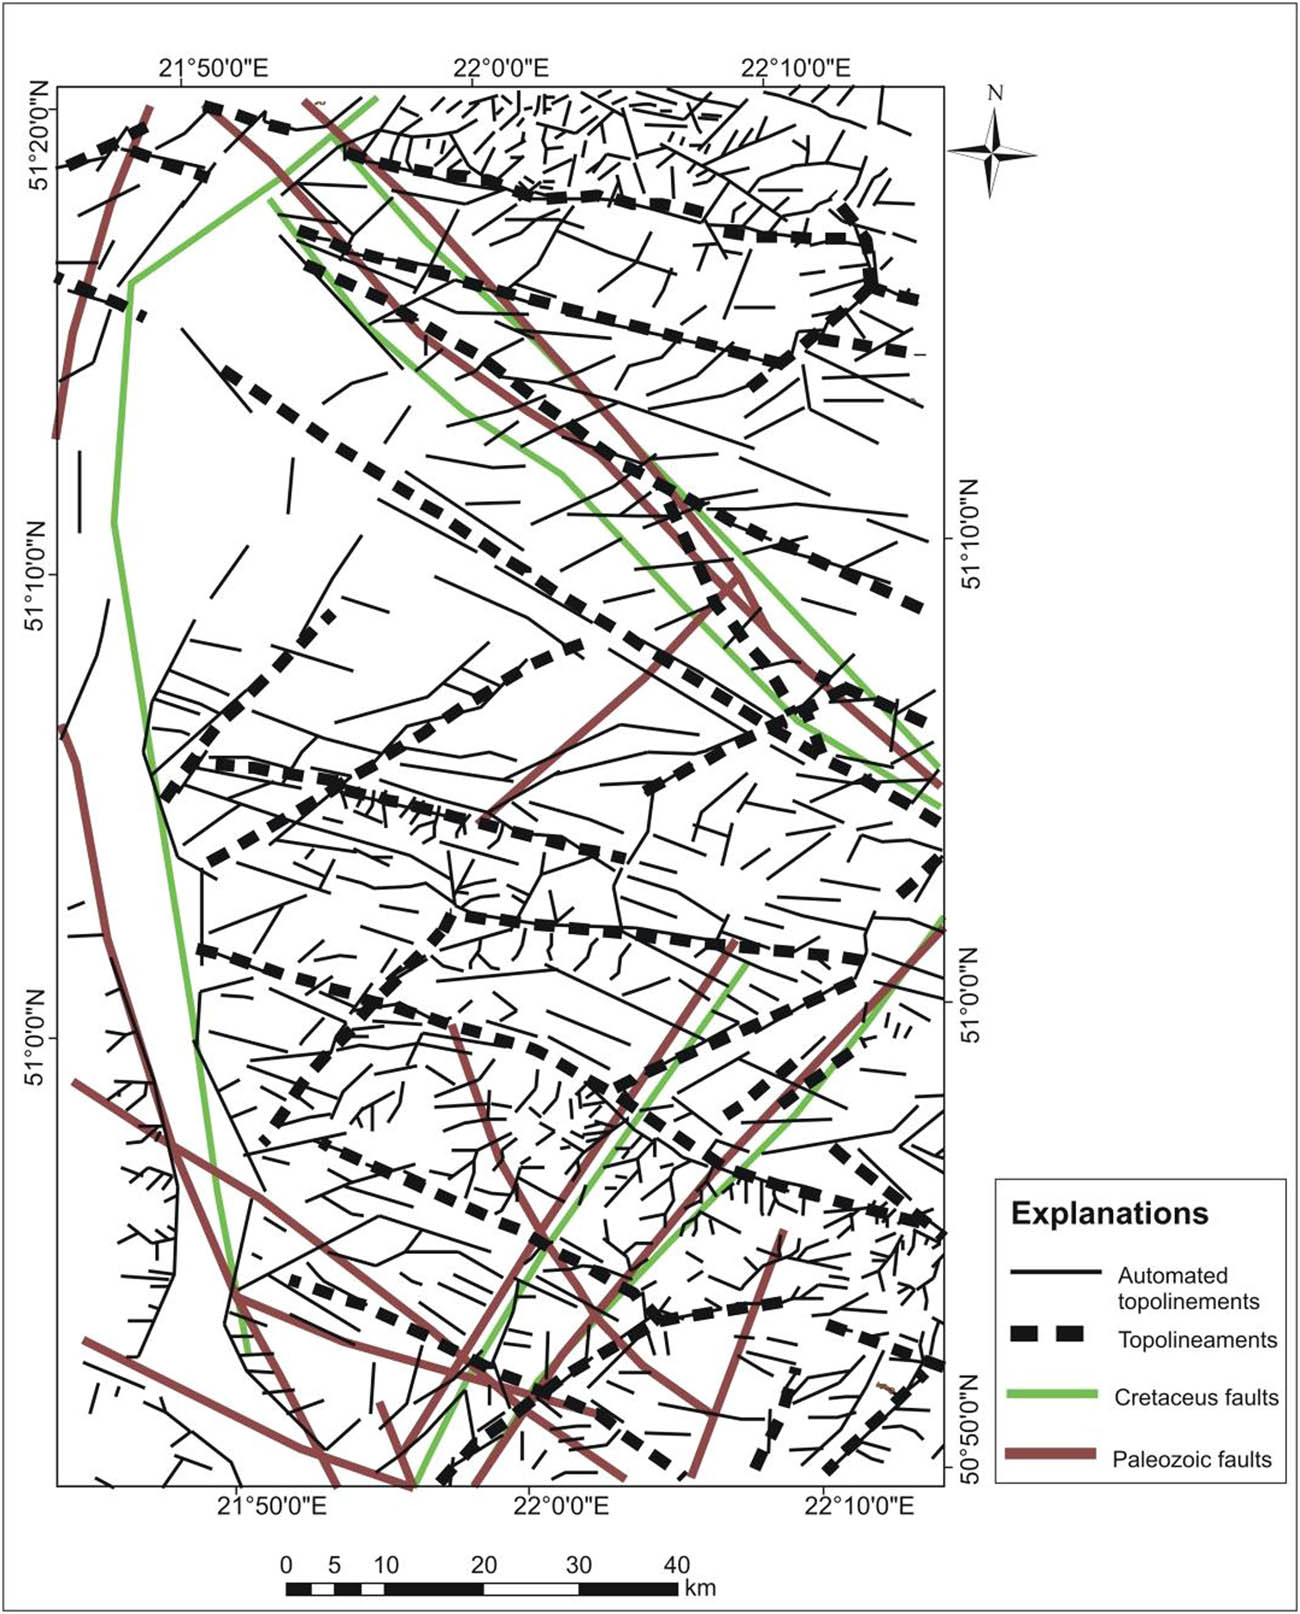
Comparison of distribution and spatial orientation between faults and topolineaments.
6 Conclusions
This article presents the results of the combined use of remote sensing and GIS techniques to interpret the distribution of topolineaments in Cretaceous and Quaternary rocks. Geostatistical methods, borehole profiles, geological maps, and 10 m LiDAR DTM were used for research and modeling. The following conclusions can be drawn from the spatial analysis, geostatistical modeling, and interpretation of the digital terrain model:
Combining methods of the traditional interpretation of the digital terrain model and automatic extraction of topolineaments give comprehensive and complete information about the distribution of topolineaments.
Short and small topolineaments correspond to the shallow-rooted discontinuity zone and longer topolineaments are deeper rooted discontinuity zone.
Short and small topolineaments were formed mainly in Quaternary deposits. However, longer in hard chalk rocks.
Due to the use of geostatistical methods, a spatial model of topolineaments density was developed, and historical drilling data were used to generate a thickness model for Quaternary sediments.
The distribution and number of topolineaments were compared with the spatial distribution model of the Quaternary deposit thickness. A close relationship between topolineaments density and the quaternary deposit thickness was found.
The uneven occurrence of Quaternary deposits and Cretaceous rocks in connection with the course of the main Palaeozoic and Mesozoic faults as well as the density and spatial orientation of topolineaments indicates the existence of neotectonic movements in the discussed area.
References
[1] Żelichowski AM. Development of the geological structure of the area between the Świętokrzyskie Mountains and the Bug River (in Polish). Biul Inst Geol. 1972;263:79–124.Suche in Google Scholar
[2] Dadlez R. Tectonic map of the zechstein-mesozoic complex in the Polish lowlands at 1:500,000 scale. PIG-PIB; 1984.Suche in Google Scholar
[3] Żelichowski AM. Radom–Lublin area.: geological structure of Poland. 4. Tectonics (in Polish). Wyd Geol, Warsz. 1974;4:28–45.Suche in Google Scholar
[4] Żelichowski AM. Development of the Carboniferous of the SW margin of the east-European platform in Poland (in Polish). Przegl Geol. 1987;35(5):230–7.Suche in Google Scholar
[5] Dadlez R. Epicontinental basins in Poland: Devonian to Cretaceous—relationships between the crystal line basement and sedimentary infill. Geol Quart. 1998;41(4):419–32.Suche in Google Scholar
[6] Doktór S, Graniczny M, Kanasiewicz J, Kucharski R. Methodology of comprehensive remote sensing and geophysical data analysis for determining ore-bearing structures in Polish. Przegl Geol. 1990;38:86–90.Suche in Google Scholar
[7] Narkiewicz M. Tectonic controls of the Lublin Graben (Late Devonian -Carboniferous) (in Polish with English summary). Przegl Geol. 2003;51:771–6.Suche in Google Scholar
[8] Narkiewicz M. Development and in version of Devonian and Carboniferous bas ins in the eastern part of the Variscan foreland (Poland). Geol Q. 2007;51(3):231–56.Suche in Google Scholar
[9] Krzywiec P. Tectonics of the Lublin area (SE Po land) – new views based on result of seismic data interpretation (in Polish with English summary). Biul Państ Inst Geol. 2007;422:1–18.Suche in Google Scholar
[10] Krzywiec P. Devonian–Cretaceous subsidence and up lift along the Teisseyre–Tornquist zone in SE Po land – in sight from seismic data interpretation. Tectonophysics. 2009;475:142–59.10.1016/j.tecto.2008.11.020Suche in Google Scholar
[11] Tomaszczyk M. Tectonic evolution of the central part of the Lublin basin. Unpublished PhD dissertation. Polish Geological Institute (In Polish). 2015. p. 10–5.Suche in Google Scholar
[12] Doktór S, Graniczny M. Map of the main photolineaments of Poland. Państw Inst Geol. 1993.Suche in Google Scholar
[13] Ostaficzuk S. Lineaments as a mapping of tectonic phenomena against the background of selected examples from Poland (in Polish with English summary). Biul Geol UW. 1981;29:195–267.Suche in Google Scholar
[14] Doktór S, Graniczny M, Kanasiewicz J, Kucharski M. The main tectonic features in the Sudeten Mts. (SW Poland) and their relationship with ore mineralization. Geotectonica Metallogenia. 1991;15:25–40.Suche in Google Scholar
[15] Hobbs WH. Lineaments of the Atlantic border region. Geol Soc Am Bull. 1903;15:483–506.10.1130/GSAB-15-483Suche in Google Scholar
[16] O’Leary DW, Friedman JD, Pohn HA. Lineaments, linear, linea-tion: some proposed new names and standards. Geol Soc Am Bull. 1976;87:1463–9.10.1130/0016-7606(1976)87<1463:LLLSPN>2.0.CO;2Suche in Google Scholar
[17] Sabins FF. Remote sensing: principles and interpretation. 3rd edn. New York: W. H. Freeman and Company; 1996. p. 494–6.Suche in Google Scholar
[18] Gustafsson P. SPOT satellite data for exploration of fractured aquifers in a semi-arid area in southeastern Botswana. Appl Hydrogeol. 1994;2(2):9–18.10.1007/s100400050246Suche in Google Scholar
[19] Wladis D. Automatic lineament detection using digital elevation models with second derivative filters. Photogrammetric Eng Remote Sens. 1999;65:453–8.Suche in Google Scholar
[20] Raj J, Prabhakaran A, Achary A. Extraction and analysis of geological lineaments of Kolli hills, Tamil Nadu: a study using remote sensing and GIS. Arab J Geosci. 2017;10. 10.1007/s12517-017-2966-4Suche in Google Scholar
[21] Henkiel A. Tectonics of the Mezo-Cenozoic cover on the northern slope of the Metacarpatian embankment (in Polish). Ann UMCS Sect B. 1988;39:23–36.Suche in Google Scholar
[22] Maruszczak H. Stratigraphy and chronology of loess in Poland. Stratigraphy and chronology of loess and lower and middle Pleistocene glacial formations in Poland SE (in Polish). Lublin: Przew. Semin. Teren; 2001. 23–29.09, p. 43–54.Suche in Google Scholar
[23] Jarosiński M, Poprawa P, Ziegler PA. Cenozoic dynamic evolution of the Polish Platform. Geol Q. 2009;53(1):3–26.Suche in Google Scholar
[24] Zuchiewicz W, Badura J, Jarosiński M. Neotectonics of Poland:an overwiev of active Faulting (in Polish with English summary). Studia Quaternaria. 2007;24:105–28.Suche in Google Scholar
[25] Wyrzykowski T. New appointing the velocities of contemporary vertical movements of the surface of the Earth’s crust on the area of Poland (in Polish). Tom XXXIV, Zeszyt. Prace Instytutu Geodezji i Kartografii; 1987; vol. 1. p. 78.Suche in Google Scholar
[26] Kowalczyk K. Modelling the vertical movements of the earth’s crust with the help of the collocation method. Rep Geodesy. 2006;2(77):171–8.Suche in Google Scholar
[27] Kontny B, Bogusz J. Models of vertical movements of the earth crust surface in the area of Poland derived from leveling and GNSS data. Acta Geodynamica Et Geomater. 2012;9:331–7.Suche in Google Scholar
[28] Pożaryski W. Post-Varistian tectonics of the Świętokrzyskie-Lublin region against the background of the ground structure (in Polish with English summary). Przegl Geol. 1997;45(12):1265–70.Suche in Google Scholar
[29] Kurczyński Z. Photogrammetry (in Polish). PWN Warsz. 2014;241–60.Suche in Google Scholar
[30] Lu L, Ordonez C, Collins E, DuPont E. Terrain surface classification for autonomous ground vehicles using a 2D laser stripe-based structured light sensor. 2009. p. 2174–81. 10.1109/IROS.2009.5354799.Suche in Google Scholar
[31] Silverman BW. Density estimation for statistics and data analysis. London: Chapman and Hall; 1986. p. 124–31.10.1007/978-1-4899-3324-9Suche in Google Scholar
[32] Kulczycki P, Charytanowicz M, Kowalski PA, Łukasik S. The complete gradient clustering algorithm: properties in practical applications. J Appl Stat. 2012;39:35–52.10.1080/02664763.2011.644526Suche in Google Scholar
[33] Gribov A, Krivoruchko K. New flexible non-parametric data transformation for trans-gaussian kriging. Quant Geol Geostatistics. 2012;17(1):51–65.10.1007/978-94-007-4153-9_5Suche in Google Scholar
[34] Kamiński M. Detailed geological maps of Poland at a scale of 1:50,000 Kazimierz Dolny sheet. PIG-PIB; 2019.Suche in Google Scholar
[35] Dowgiałło AD. Detailed geological maps of Poland at a scale of 1:50,000 Opole Lubelskie sheet. PIG-PIB; 1986.Suche in Google Scholar
[36] Marszałek S. Detailed geological maps of Poland at a scale of 1:50,000 Chodel sheet. PIG-PIB; 2002.Suche in Google Scholar
[37] Kamiński M. Detailed geological maps of Poland at a scale of 1:50,000 Kraśnik sheet. PIG-PIB; 2015.Suche in Google Scholar
[38] Buraczyński J, Henkiel A, Szwajgier W. Detailed geological maps of Poland at a scale of 1:50,000 Nałęczów sheet. PIG-PIB; 2006.Suche in Google Scholar
[39] Dadlez R. Epicontinental basins in Poland: Devonian to Cretaceous – relationships between the crystal line basement and sedimentary infill. Geol Quart. 1998;41(4):419–32.Suche in Google Scholar
[40] Dadlez R, Marek S, Pokorski J, Palaeogeographic atlas of the epicontinental Permian and Mesozoic in Poland (1:2 500 000), 1998.Suche in Google Scholar
© 2020 Mirosław Kamiński, published by De Gruyter
This work is licensed under the Creative Commons Attribution 4.0 International License.
Artikel in diesem Heft
- Regular Articles
- The simulation approach to the interpretation of archival aerial photographs
- The application of137Cs and210Pbexmethods in soil erosion research of Titel loess plateau, Vojvodina, Northern Serbia
- Provenance and tectonic significance of the Zhongwunongshan Group from the Zhongwunongshan Structural Belt in China: insights from zircon geochronology
- Analysis, Assessment and Early Warning of Mudflow Disasters along the Shigatse Section of the China–Nepal Highway
- Sedimentary succession and recognition marks of lacustrine gravel beach-bars, a case study from the Qinghai Lake, China
- Predicting small water courses’ physico-chemical status from watershed characteristics with two multivariate statistical methods
- An Overview of the Carbonatites from the Indian Subcontinent
- A new statistical approach to the geochemical systematics of Italian alkaline igneous rocks
- The significance of karst areas in European national parks and geoparks
- Geochronology, trace elements and Hf isotopic geochemistry of zircons from Swat orthogneisses, Northern Pakistan
- Regional-scale drought monitor using synthesized index based on remote sensing in northeast China
- Application of combined electrical resistivity tomography and seismic reflection method to explore hidden active faults in Pingwu, Sichuan, China
- Impact of interpolation techniques on the accuracy of large-scale digital elevation model
- Natural and human-induced factors controlling the phreatic groundwater geochemistry of the Longgang River basin, South China
- Land use/land cover assessment as related to soil and irrigation water salinity over an oasis in arid environment
- Effect of tillage, slope, and rainfall on soil surface microtopography quantified by geostatistical and fractal indices during sheet erosion
- Validation of the number of tie vectors in post-processing using the method of frequency in a centric cube
- An integrated petrophysical-based wedge modeling and thin bed AVO analysis for improved reservoir characterization of Zhujiang Formation, Huizhou sub-basin, China: A case study
- A grain size auto-classification of Baikouquan Formation, Mahu Depression, Junggar Basin, China
- Dynamics of mid-channel bars in the Middle Vistula River in response to ferry crossing abutment construction
- Estimation of permeability and saturation based on imaginary component of complex resistivity spectra: A laboratory study
- Distribution characteristics of typical geological relics in the Western Sichuan Plateau
- Inconsistency distribution patterns of different remote sensing land-cover data from the perspective of ecological zoning
- A new methodological approach (QEMSCAN®) in the mineralogical study of Polish loess: Guidelines for further research
- Displacement and deformation study of engineering structures with the use of modern laser technologies
- Virtual resolution enhancement: A new enhancement tool for seismic data
- Aeromagnetic mapping of fault architecture along Lagos–Ore axis, southwestern Nigeria
- Deformation and failure mechanism of full seam chamber with extra-large section and its control technology
- Plastic failure zone characteristics and stability control technology of roadway in the fault area under non-uniformly high geostress: A case study from Yuandian Coal Mine in Northern Anhui Province, China
- Comparison of swarm intelligence algorithms for optimized band selection of hyperspectral remote sensing image
- Soil carbon stock and nutrient characteristics of Senna siamea grove in the semi-deciduous forest zone of Ghana
- Carbonatites from the Southern Brazilian platform: I
- Seismicity, focal mechanism, and stress tensor analysis of the Simav region, western Turkey
- Application of simulated annealing algorithm for 3D coordinate transformation problem solution
- Application of the terrestrial laser scanner in the monitoring of earth structures
- The Cretaceous igneous rocks in southeastern Guangxi and their implication for tectonic environment in southwestern South China Block
- Pore-scale gas–water flow in rock: Visualization experiment and simulation
- Assessment of surface parameters of VDW foundation piles using geodetic measurement techniques
- Spatial distribution and risk assessment of toxic metals in agricultural soils from endemic nasopharyngeal carcinoma region in South China
- An ABC-optimized fuzzy ELECTRE approach for assessing petroleum potential at the petroleum system level
- Microscopic mechanism of sandstone hydration in Yungang Grottoes, China
- Importance of traditional landscapes in Slovenia for conservation of endangered butterfly
- Landscape pattern and economic factors’ effect on prediction accuracy of cellular automata-Markov chain model on county scale
- The influence of river training on the location of erosion and accumulation zones (Kłodzko County, South West Poland)
- Multi-temporal survey of diaphragm wall with terrestrial laser scanning method
- Functionality and reliability of horizontal control net (Poland)
- Strata behavior and control strategy of backfilling collaborate with caving fully-mechanized mining
- The use of classical methods and neural networks in deformation studies of hydrotechnical objects
- Ice-crevasse sedimentation in the eastern part of the Głubczyce Plateau (S Poland) during the final stage of the Drenthian Glaciation
- Structure of end moraines and dynamics of the recession phase of the Warta Stadial ice sheet, Kłodawa Upland, Central Poland
- Mineralogy, mineral chemistry and thermobarometry of post-mineralization dykes of the Sungun Cu–Mo porphyry deposit (Northwest Iran)
- Main problems of the research on the Palaeolithic of Halych-Dnister region (Ukraine)
- Application of isometric transformation and robust estimation to compare the measurement results of steel pipe spools
- Hybrid machine learning hydrological model for flood forecast purpose
- Rainfall thresholds of shallow landslides in Wuyuan County of Jiangxi Province, China
- Dynamic simulation for the process of mining subsidence based on cellular automata model
- Developing large-scale international ecological networks based on least-cost path analysis – a case study of Altai mountains
- Seismic characteristics of polygonal fault systems in the Great South Basin, New Zealand
- New approach of clustering of late Pleni-Weichselian loess deposits (L1LL1) in Poland
- Implementation of virtual reference points in registering scanning images of tall structures
- Constraints of nonseismic geophysical data on the deep geological structure of the Benxi iron-ore district, Liaoning, China
- Mechanical analysis of basic roof fracture mechanism and feature in coal mining with partial gangue backfilling
- The violent ground motion before the Jiuzhaigou earthquake Ms7.0
- Landslide site delineation from geometric signatures derived with the Hilbert–Huang transform for cases in Southern Taiwan
- Hydrological process simulation in Manas River Basin using CMADS
- LA-ICP-MS U–Pb ages of detrital zircons from Middle Jurassic sedimentary rocks in southwestern Fujian: Sedimentary provenance and its geological significance
- Analysis of pore throat characteristics of tight sandstone reservoirs
- Effects of igneous intrusions on source rock in the early diagenetic stage: A case study on Beipiao Formation in Jinyang Basin, Northeast China
- Applying floodplain geomorphology to flood management (The Lower Vistula River upstream from Plock, Poland)
- Effect of photogrammetric RPAS flight parameters on plani-altimetric accuracy of DTM
- Morphodynamic conditions of heavy metal concentration in deposits of the Vistula River valley near Kępa Gostecka (central Poland)
- Accuracy and functional assessment of an original low-cost fibre-based inclinometer designed for structural monitoring
- The impacts of diagenetic facies on reservoir quality in tight sandstones
- Application of electrical resistivity imaging to detection of hidden geological structures in a single roadway
- Comparison between electrical resistivity tomography and tunnel seismic prediction 303 methods for detecting the water zone ahead of the tunnel face: A case study
- The genesis model of carbonate cementation in the tight oil reservoir: A case of Chang 6 oil layers of the Upper Triassic Yanchang Formation in the western Jiyuan area, Ordos Basin, China
- Disintegration characteristics in granite residual soil and their relationship with the collapsing gully in South China
- Analysis of surface deformation and driving forces in Lanzhou
- Geochemical characteristics of produced water from coalbed methane wells and its influence on productivity in Laochang Coalfield, China
- A combination of genetic inversion and seismic frequency attributes to delineate reservoir targets in offshore northern Orange Basin, South Africa
- Explore the application of high-resolution nighttime light remote sensing images in nighttime marine ship detection: A case study of LJ1-01 data
- DTM-based analysis of the spatial distribution of topolineaments
- Spatiotemporal variation and climatic response of water level of major lakes in China, Mongolia, and Russia
- The Cretaceous stratigraphy, Songliao Basin, Northeast China: Constrains from drillings and geophysics
- Canal of St. Bartholomew in Seča/Sezza: Social construction of the seascape
- A modelling resin material and its application in rock-failure study: Samples with two 3D internal fracture surfaces
- Utilization of marble piece wastes as base materials
- Slope stability evaluation using backpropagation neural networks and multivariate adaptive regression splines
- Rigidity of “Warsaw clay” from the Poznań Formation determined by in situ tests
- Numerical simulation for the effects of waves and grain size on deltaic processes and morphologies
- Impact of tourism activities on water pollution in the West Lake Basin (Hangzhou, China)
- Fracture characteristics from outcrops and its meaning to gas accumulation in the Jiyuan Basin, Henan Province, China
- Impact evaluation and driving type identification of human factors on rural human settlement environment: Taking Gansu Province, China as an example
- Identification of the spatial distributions, pollution levels, sources, and health risk of heavy metals in surface dusts from Korla, NW China
- Petrography and geochemistry of clastic sedimentary rocks as evidence for the provenance of the Jurassic stratum in the Daqingshan area
- Super-resolution reconstruction of a digital elevation model based on a deep residual network
- Seismic prediction of lithofacies heterogeneity in paleogene hetaoyuan shale play, Biyang depression, China
- Cultural landscape of the Gorica Hills in the nineteenth century: Franciscean land cadastre reports as the source for clarification of the classification of cultivable land types
- Analysis and prediction of LUCC change in Huang-Huai-Hai river basin
- Hydrochemical differences between river water and groundwater in Suzhou, Northern Anhui Province, China
- The relationship between heat flow and seismicity in global tectonically active zones
- Modeling of Landslide susceptibility in a part of Abay Basin, northwestern Ethiopia
- M-GAM method in function of tourism potential assessment: Case study of the Sokobanja basin in eastern Serbia
- Dehydration and stabilization of unconsolidated laminated lake sediments using gypsum for the preparation of thin sections
- Agriculture and land use in the North of Russia: Case study of Karelia and Yakutia
- Textural characteristics, mode of transportation and depositional environment of the Cretaceous sandstone in the Bredasdorp Basin, off the south coast of South Africa: Evidence from grain size analysis
- One-dimensional constrained inversion study of TEM and application in coal goafs’ detection
- The spatial distribution of retail outlets in Urumqi: The application of points of interest
- Aptian–Albian deposits of the Ait Ourir basin (High Atlas, Morocco): New additional data on their paleoenvironment, sedimentology, and palaeogeography
- Traditional agricultural landscapes in Uskopaljska valley (Bosnia and Herzegovina)
- A detection method for reservoir waterbodies vector data based on EGADS
- Modelling and mapping of the COVID-19 trajectory and pandemic paths at global scale: A geographer’s perspective
- Effect of organic maturity on shale gas genesis and pores development: A case study on marine shale in the upper Yangtze region, South China
- Gravel roundness quantitative analysis for sedimentary microfacies of fan delta deposition, Baikouquan Formation, Mahu Depression, Northwestern China
- Features of terraces and the incision rate along the lower reaches of the Yarlung Zangbo River east of Namche Barwa: Constraints on tectonic uplift
- Application of laser scanning technology for structure gauge measurement
- Calibration of the depth invariant algorithm to monitor the tidal action of Rabigh City at the Red Sea Coast, Saudi Arabia
- Evolution of the Bystrzyca River valley during Middle Pleistocene Interglacial (Sudetic Foreland, south-western Poland)
- A 3D numerical analysis of the compaction effects on the behavior of panel-type MSE walls
- Landscape dynamics at borderlands: analysing land use changes from Southern Slovenia
- Effects of oil viscosity on waterflooding: A case study of high water-cut sandstone oilfield in Kazakhstan
- Special Issue: Alkaline-Carbonatitic magmatism
- Carbonatites from the southern Brazilian Platform: A review. II: Isotopic evidences
- Review Article
- Technology and innovation: Changing concept of rural tourism – A systematic review