Explore the application of high-resolution nighttime light remote sensing images in nighttime marine ship detection: A case study of LJ1-01 data
-
Liang Zhong
 ,
Xiaosheng Liu
,
Xiaosheng Liu

Abstract
Nighttime light remote sensing images show significant application potential in marine ship monitoring, but in areas where ships are densely distributed, the detection accuracy of the current methods is still limited. This article considered the LJ1-01 data as an example, compared with the National Polar-orbiting Partnership (NPP)/Visible Infrared Imaging Radiometer Suite (VIIRS) data, and explored the application of high-resolution nighttime light images in marine ship detection. The radiation values of the aforementioned two images were corrected to achieve consistency, and the interference light sources of the ship light were filtered. Then, when the threshold segmentation and two-parameter constant false alarm rate methods are combined, the ships’ location information was with obtained, and the reliability of the results was analyzed. The results show that the LJ1-01 data can not only record more potential ship light but also distinguish the ship light and background noise in the data. The detection accuracy of the LJ1-01 data in both ship detection methods is significantly higher than that of the NPP/VIIRS data. This study analyzes the characteristics, performance, and application potential of the high-resolution nighttime light data in the detection of marine vessels. The relevant results can provide a reference for the high-precision monitoring of nighttime marine ships.
1 Introduction
With the accelerated development and utilization of marine resources, marine vessels sail more and more frequently. In addition to the existence of reefs on the sea, there are also a large number of oil and gas extraction platforms, small icebergs, etc., and hence, the navigation of marine ships faces many hidden safety risks. Although there are many methods for monitoring ships at sea, such as optical and synthetic-aperture radar (SAR) remote sensing images [1,2,3]. However, the optical remote sensing image cannot detect the ship at night. While the SAR image has the characteristics of all-weather and all-day imaging, the method has large data volume and high cost, which makes it lack of universal ship recognition capabilities in large-area sea areas [4,5]. Therefore, there are still many limitations in the monitoring of marine vessels, especially the lack of monitoring means for marine vessels at night. Based on the current research, the search for more diverse methods of marine vessel extraction is of great significance for the safety monitoring of marine vessels.
With the development of nighttime light remote sensing data study, researchers have generally found that it can effectively reflect the characteristics of the human spatial activity [6,7]. It has been widely used in urban time and space dynamic analysis, population spatialization, power consumption, and GDP spatialization [8,9,10,11]. In addition, nighttime light data also show strong application potential for ship identification and fishery resource management. In the early days, nighttime light data obtained by the US Air Force’s Defense Meteorological Satellite Program Operation Line Scanning System (DMSP/OLS) provide the lighting information about the fishing fleet [12,13]. However, due to the limited resolution of the data, its identification for ships can achieve only a rough estimate. Recent studies have found that nighttime light data obtained by the Visible Infrared Imaging Radiometer Suite (VIIRS) equipped with the Suomi National Polar-orbiting Partnership Satellite (NPP) enables the management of fishery resources and the identification of marine vessels [14,15,16,17]. Compared to DMSP/OLS data (resolution 2.7 km), SNPP/VIIRS nighttime light data (resolution 740 m) have a higher resolution and can more accurately identify the light generated by the fishing activity of the ship [18,19]. However, the accuracy of these data onto independent ship detection is still limited. In the sea area where ships are densely distributed, it is difficult to meet the more precise nighttime distribution monitoring of ships. Besides, the Automatic Identification System of ship positions provides real-time position dynamic information of ships at sea, which provides a significant guarantee for ship safety monitoring. However, for ships that do not have the system installed, such as offshore fishing vessels, illegally invaded ships, and small transport ships, monitoring cannot be achieved [20,21,22]. Therefore, exploring more efficient and more refined monitoring methods for nighttime marine vessels has become the current main goal [23,24].
On June 2, 2018, the LJ1-01 nighttime lights remote sensing satellite developed and produced by the team of Wuhan University of China was successfully launched and operated stably. The LJ1-01 is capable of imaging the entire world in 15 days with a resolution of 130 m. These data show a higher application potential compared to the existing nighttime light data. Jiang et al. [25] analyzed the LJ1-01 nighttime light data to investigate the potential for light pollution and found that the LJ1-01 data can detect a higher dynamic range and capture finer details of the artificial nighttime light. Li et al. [26] used the LJ1-01 nighttime light data for mapping urban extent and found that the data can greatly improve the accuracy of urban extent extraction. Zhang et al. [27] analyzed the potential of LJ1-01 nighttime light data to model socioeconomic parameters and compared it with VIIRS data and found that the former data provided better socioeconomic parameter modeling potential. High-resolution nighttime light images have shown excellent development potential in many fields, but there is still a lack of relevant research in the detection of nighttime marine ships.
This study applies LJ1-01 nighttime light data for detection of ship and analysis in Beibu Gulf. It aims to explore the application of high-resolution nighttime light data in the detection of marine ships at night by comparing the characteristics of high-resolution and traditional nighttime light images (VIIRS data) in marine ship monitoring. This article first introduces the research materials and methodology in Section 2 and then analyzes the results of data preprocessing and ship detection in Section 3, and finally discusses and summarizes in Sections 4 and 5. The results of this research will help to solve the problems of safety monitoring at night in high-density areas of ships, as well as navigation planning, illegal fishing fleet tracking, and illegal intrusion monitoring of sea areas.
2 Materials and methodology
2.1 Research area and data
2.1.1 Research area
This study selected the northeastern part of the Beibu Gulf as the study area (19.40° N-21.92° N, 107.92° E-110.16° E) (Figure 1). It is located between China and Vietnam, surrounded by land on three sides, with an average water depth of 42 m and a maximum depth of more than 100 m. Affected by tropical and subtropical climates, the average annual temperature is above 20°C (68°F). The northeastern part of the Beibu Gulf forms a semi-enclosed sea area, which facilitates the accumulation of fish stocks, making a large number of fishing fleets in the area [28]. Also, the Beibu Gulf area contains many large ports and shipping routes, and it is a gateway for cargo to the southwest and south China. Among them, Fangcheng Port is the shortest voyage port from mainland China to Southeast Asia, Africa, Europe, and Oceania. It is one of the China’s major coastal ports and has navigation to more than 100 countries and regions in the world [29]. Therefore, there are often a large number of different types of ships in the Beibu Gulf area. Selecting this area as a research area can avoid the contingency of ship detection results and facilitate the comparison of experimental results.

Schematic diagram of the study area.
2.1.2 Research data
The research data mainly include LJ1-01 and VIIRS nighttime light remote sensing images. LJ1-01 nighttime imagery is provided by the Hubei Province High-resolution Earth Observation System Data and Application Network (http://59.175.109.173:8888/app/login_en.html). The VIIRS imagery is downloaded from the National Oceanic and Atmospheric Administration (NOAA) Comprehensive Large Array-Data Stewardship System (https://www.avl.class.noaa.gov/saa/products/welcome). As presented in Table 1, the main orbit parameters of the two satellites are shown.
LJ1-01 and NPP-VIIRS satellite orbit parameters
| Satellites | Orbit type | Orbit height (km) | Orbit inclination (°) | Orbit period (min) | Descending node time (UT) |
|---|---|---|---|---|---|
| NPP-VIIRS | Solar synchronous orbit | 824 | 98.70 | 102 | 13:30 pm |
| LJ1-01 | Solar synchronous orbit | 645 | 98.04 | 98 | 2:30 am |
In the currently published data set, we collected data for three different dates in the study area. For each image on a different date, the LJ1-01 and VIIRS images were taken on the same night. The reason for choosing these image data is that they all contain a large number of densely distributed ship lights, which is conducive to determine the reliability of ship detection results. We have numbered them according to the source of the image data and the release date (for example, the image number of LJ1-01 on September 4, 2018, is LJ_20180904) for easy distinction (Figure 2).
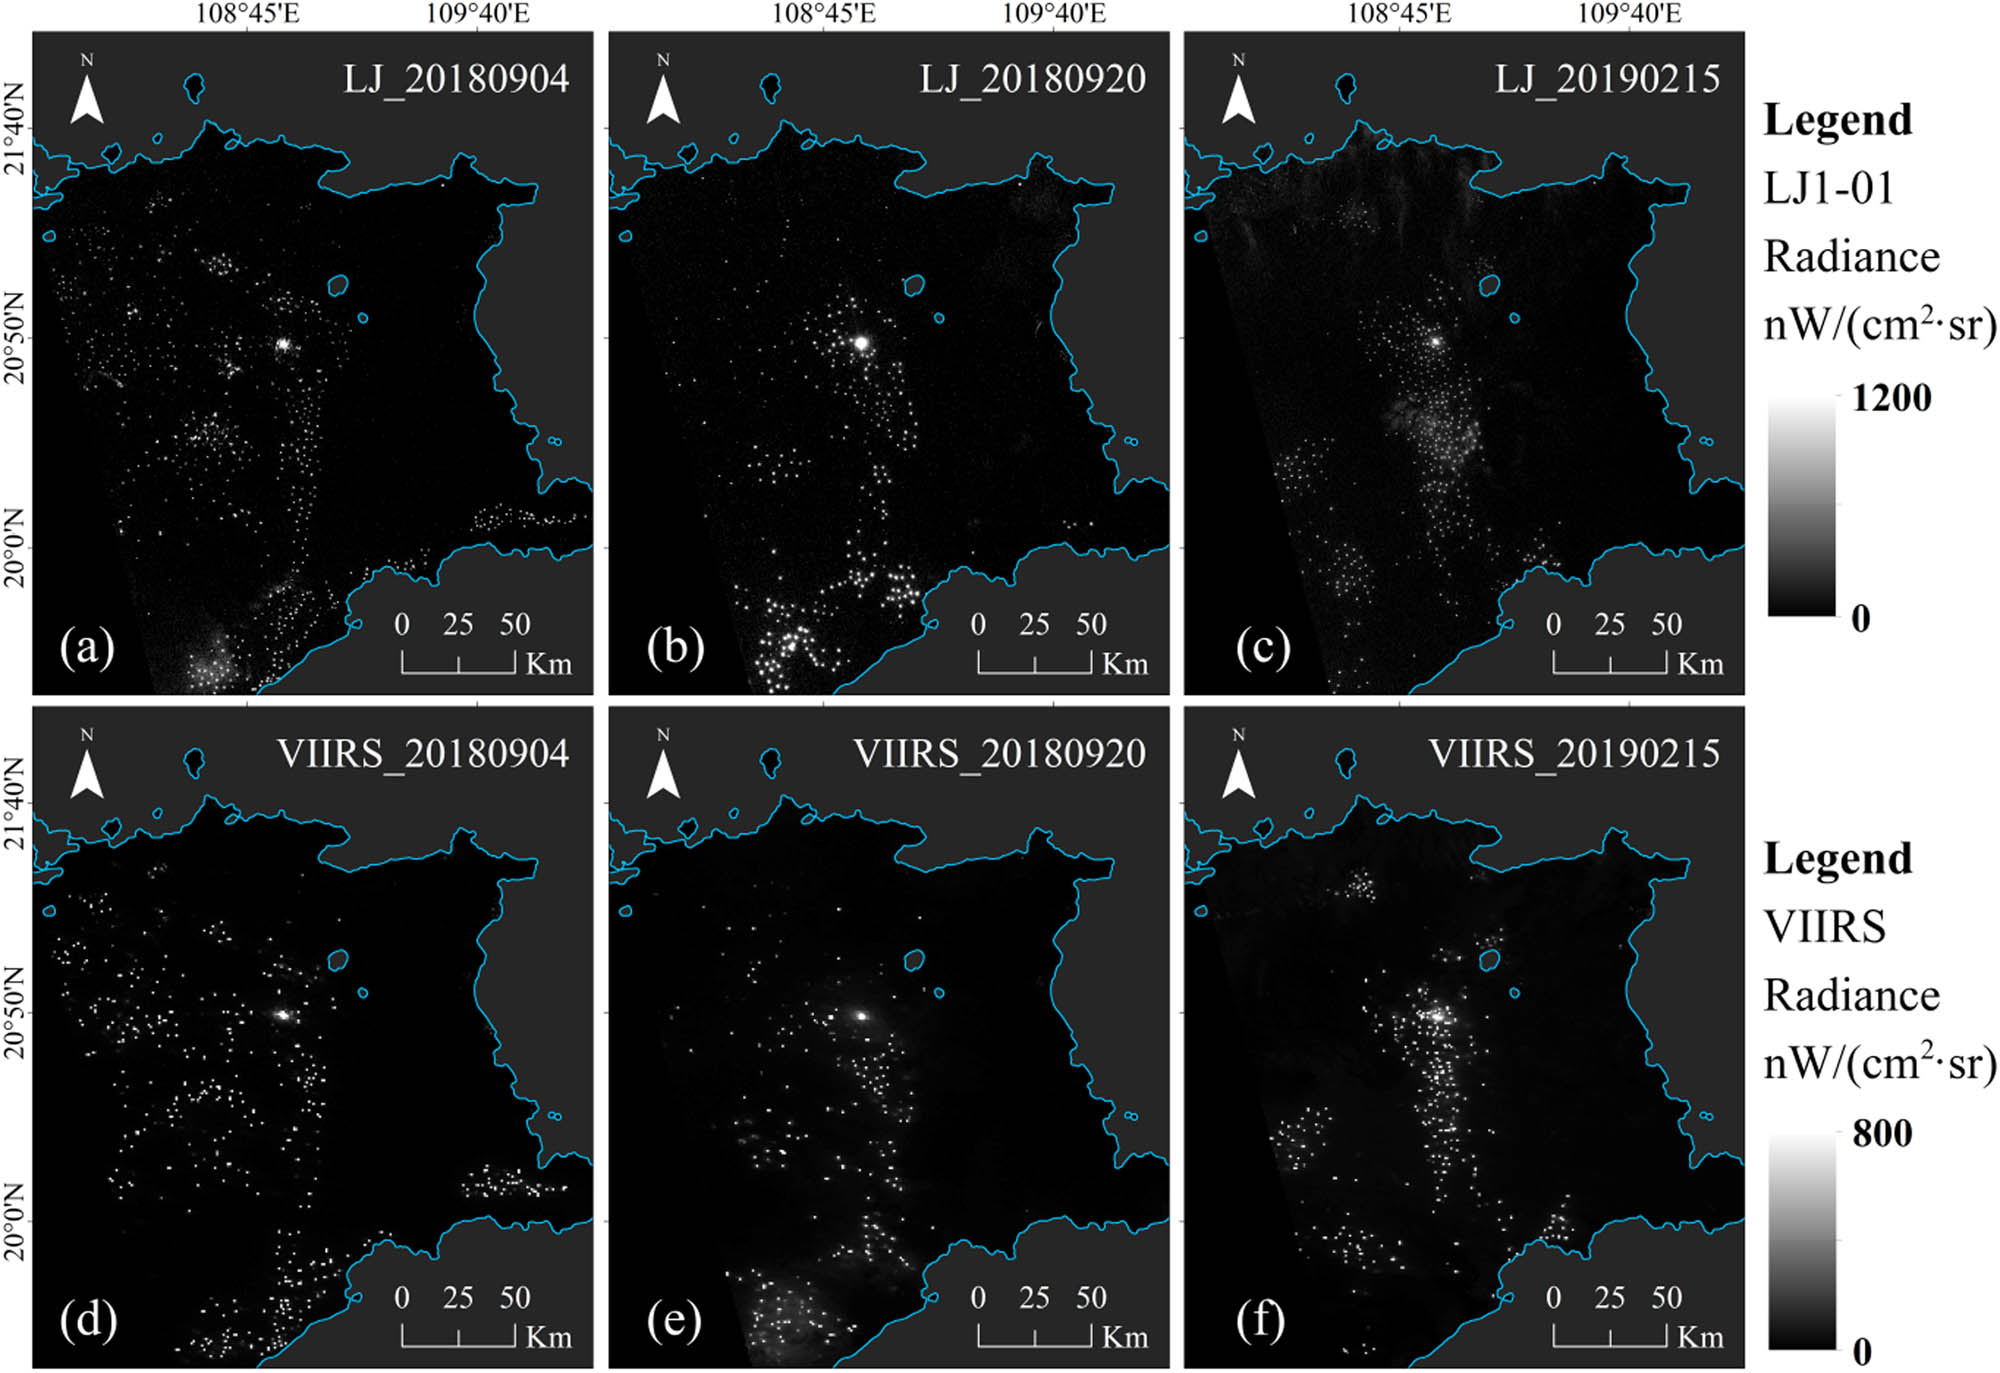
LJ1-01 and VIIRS nighttime light data. (a) LJ1-01 image on September 4, 2018; (b) LJ1-01 image on September 20, 2018; (c) LJ1-01 image on February 15, 2019; (d) VIIRS image on September 4, 2018; (e) VIIRS image on September 20, 2018; and (f) VIIRS image on February 15, 2019.
2.2 Data preprocessing methods
2.2.1 Radiation value correction
Due to the differences in sensors, the radiation values in the original nighttime light images of VIIRS and LJ1-01 were saved in different ways. Among them, the original VIIRS data adopted a very small value (1E-9) to record more faint lights. Therefore, to facilitate the use of data, the radiation values in the VIIRS images need to be enlarged first and calculated as follows:
where DNV is the original pixel value of the VIIRS image, and RV is the radiation value of the corrected VIIRS image; the unit is nW/(cm2 sr).
Similarly, when the LJ1-01 satellite collects nighttime light data, to facilitate storage, it adopts a method of enlarging the floating-point pixel value by 1E10 times and then converting it to an integer type for storage. Therefore, it is necessary to correct the data before using it as follows:
where DNL is the original pixel value of the LJ1-01 image; L denotes the corrected LJ1-01 image radiation value and the unit is W/(m2 sr µm).
Comparing the corrected image radiation values of VIIRS and LJ1-01, it can be found that the units of the two are not consistent. To unify the radiation value units of the LJ1-01 and VIIRS images, the radiation value of the LJ1-01 image is converted as follows:
where B is the LJ1-01 satellite bandwidth and the value is 5.2 × 10⁻⁷ m [30], LV is the converted to LJ1-01 image radiation value, and the unit is the same as the VIIRS image radiation value (nW/(cm2 sr)).
2.2.2 Masking nearshore lights and filtering gas flares
Generally, there are three types of light sources on the sea, one is ship light and the other two are islands and offshore oil and gas extraction platforms [31]. Because architectural lights on islands or near shores and light sources generated by offshore oil and gas exploitation are very similar to ship lights, to avoid the effects of the two kinds of stray light on ship detection results, corresponding methods need to be used to filter them.
For offshore oil and gas platform light sources (gas flares), the detailed location of these light sources is recorded in the daily global VIIRS night-fire detection data provided by NOAA/NCEI (https://www.ngdc.noaa.gov/eog/viirs/download_viirs_fire.html). These data will be used to filter the combustion source (gas flares) in the LJ1-01 and VIIRS images detection results. The specific filtration process of the combustion source is shown in Figure 3. First, the grid with the largest radiation value near it was searched based on the position of the light source point (Figure 3a) and marked as the center of the light source (Figure 3b). Then, grids near the light source center that are larger than the gas flare threshold are searched and assigned the radiation values of to 0 (Figure 3c) to achieve the effect of filtering the gas flare. Since the radiation value of the gas flare is very similar to that of the ship lights, the setting of the gas flare threshold is consistent with the ship light threshold.

Gas flare light source filtering process. (a) Gas flare radiation intensity and light source coordinates; (b) mark light source center; and (c) filter gas flare light.
Besides, due to the overglow effect of the light [32], architectural lights on islands and city lights near the coast will extend 0–2 km to the sea surface. This part of the light will seriously affect the judgment of the ship lights, and hence, before the experiment, a buffer is built on the original land vector boundary to cover the nearshore lights and island building lights.
2.2.3 Marking valid ships
Based on the preprocessed images, the effective ship’s position in the images is manually marked for the accuracy verification data of the ship detection results. The spatial and radiance resolution of the LJ1-01 and VIIRS images are different, resulting in differences in the number of ships recorded in these two types of images. Therefore, the ship lights in the aforementioned two types of images are marked separately to achieve a fair comparison of the detection results. These manually marked ships will be used as verification data for ship detection results. Through the appearance and radiation characteristics of the lights in the LJ1-01 and VIIRS images, the ship’s target can be effectively judged [15]. Figure 4 shows the ship’s lights characteristics of LJ1-01 and VIIRS nighttime light images. It can be seen that the appearance of the ship lights in the LJ1-01 image (Figure 4a) has a clear outline and is significantly different from noise. Therefore, the combination of the appearance of the ship’s lights and the characteristics of the radiation value (Figure 4b) can completely identify the ship in the image. On the contrary, the appearance of a small number of ship lights in the VIIRS image (Figure 4c) is relatively blurred, but it can be still effectively identified in combination with the characteristics of the radiation value (Figure 4d).

Characteristics of ship lights. (a) Appearance of ship lights in LJ1-01 image; (b) radiation value of ship lights in LJ1-01 image; (c) appearance of ship lights in VIIRS image; and (d) radiation value of ship lights in VIIRS image.
2.3 Ship detection methods
2.3.1 Threshold segmentation (TS) method
The TS method is the most commonly used target detection method, which is easy to implement and has certain practicability [33]. This article regards it as one of the ship detection methods. On the one hand, it can be used to compare the effects and characteristics of the aforementioned nighttime light images in different ship detection methods. On the other hand, the threshold value obtained by the TS method will also be used for the filtering of offshore gas flares (see Section 3.1.2).
Before using the TS method for ship detection, it is necessary to define the threshold of the division. After a preliminary analysis of the radiation values of the LJ1-01 nighttime light images, we determined that the threshold is between 0 and 20. The threshold was then tested using the dichotomy. After comparing the large amount of data, the segmentation threshold of ship lights in the LJ1-01 images was finally determined to be 7.2 nW/(cm2 sr) (Figure 5a). According to the aforementioned method, it is determined that the segmentation threshold of ship lights in the VIIRS images is 18.6 nW/(cm2 sr) (Figure 5b).

The TS method of ship lights. (a) Horizontal view of ship lights in the LJ1-01 image and (b) horizontal view of ship lights in the VIIRS image.
2.3.2 Two-parameter constant false alarm rate (TP-CFAR) method
Among the many methods of marine ship detection, CFAR is a relatively excellent and commonly used algorithm [34,35,36]. With the development of research, the CFAR algorithm is gradually combined with machine learning methods such as convolutional neural networks and support vector machines, which further optimize the detection results [37,38,39]. According to the characteristics of the detected data, many scholars have also designed CFAR detectors based on cell averaging, greatest-of selection, smallest option, ordered statistics, etc. [40,41,42,43]. However, due to the interference of clouds, aurora, moonlight, and other light, the noise characteristics in nighttime light images vary greatly. Therefore, for large-scale and even worldwide images, the aforementioned CFAR ship detection method based on the global analysis cannot meet the demand.
As a classical algorithm, the TP-CFAR method is widely used in the research related to ship detection. This article combines it with nighttime light data to explore the application of high-resolution nighttime light remote sensing images in marine vessel detection at night. The method assumes that the background noise conforms to the Gaussian distribution model and uses three independent windows to accommodate the change in noise (Figure 6) [44,45]. The protection window is also called a hollow window. The purpose of setting this window is to separate the target from the background noise and to ensure that the area (background window) used for statistical background noise characteristics does not contain a valid target. There is also a target window in the protection window, and the target window is used to traverse the grid inside the protection window to detect the target. The size of each window depends on the size of the ship’s lights target in the image. The width of the target window is generally the width of the smallest ship, the width of the protection window is slightly larger than the width of the largest ship, and the width of the background window is twice the width of the protection window [46].

Working principle of the TP-CFAR method.
In the target window, the radiation value is compared with the threshold to determine whether the radiation value is a valid target. The size of the threshold can be determined by the probability density function of the background noise and the false alarm rate.
where Pt is the false alarm rate, T is the detection threshold, and f(x) is the background noise probability density function. The background noise in the nighttime light data usually conforms to the log-normal distribution [47], and the method is shown in equations (5)–(7):
where μb is the background noise mean, σb is the background noise standard deviation, and N is the number of pixels in the protection window.
Among the aforementioned parameters, Pt requires artificial settings. Generally, when the TP-CFAR method is used for ship detection in SAR images, Pt is set to be between 1 × 10⁻³ and 1 × 10⁻⁶ [48,49]. Because of the difference between nighttime light images and SAR images, this article tested the two types of nighttime light images using the TP-CFAR method, and finally, the false alarm rate is set to 1 × 10⁻⁵. Then, the target is determined according to the detection threshold:
where R is the detection result and
3 Results
3.1 Results of nighttime light images preprocessing
3.1.1 Comparison of radiation value characteristics
After the radiation value correction process, the LJ1-01 and VIIRS nighttime light data have a unified unit. This is conducive to the fair comparison of the aforementioned two types of data to analyze the characteristics of high-resolution nighttime light data in ship detection. This article categorizes all the radiation values in the corrected LJ1-01 and VIIRS images and arranges them from small to large. On this basis, after analyzing the two data, it is found that the LJ1-01 image not only has a higher radiation range than the VIIRS image but also has a higher resolution of the radiation value (Figure 7). In the image taken during the same time, the radiation values in the VIIRS data are mainly distributed between 3 and 7 nW/(cm2 sr), while the radiation values in the LJ1-01 data are mainly distributed between 0 and 3 nW/(cm2 sr). In addition, in the same radiation value interval, there are 46,723 kinds of radiation values of different sizes in the VIIRS image, while there are 3,06,850 kinds in the LJ1-01 image, which is 6.57 times the former. The analysis shows that, compared with the VIIRS image, the radiation value in the LJ1-01 image is concentrated at a lower level and has a more detailed spatial distribution, which is more conducive to distinguish ship lights and background noise.

Radiation value distribution characteristics. (a) VIIRS image and (b) LJ1-01 image.
3.1.2 Analysis of filtering results of nearshore lights and gas flares
From the VIIRS night-fire detection data provided by NOAA, we found that the study area contains five offshore oil and gas exploration combustion sources. Related location information is presented in Table 2. According to the coordinates of these gas flares and the corresponding threshold values, the results of filtering the gas flare light in the LJ1-01 and VIIRS images are shown in Figure 8a and b. Figure 8a shows two very close gas flare light sources, and the coordinate positions correspond to points 4 and 5 in Table 2, respectively. As shown in Figure 8b, the method provided in this article can effectively filter the radiation value of the gas flare and has little effect on other light sources.
Related parameters of gas flares in the study area
| Points | Lat | Lon | T (degrees K) | RHI (W/m2) |
|---|---|---|---|---|
| 1 | 20.678520 | 108.681686 | 1649 | 1.1723 |
| 2 | 20.814327 | 108.711853 | 1778 | 0.9948 |
| 3 | 20.821079 | 108.712738 | 1763 | 1.3482 |
| 4 | 20.817251 | 108.895042 | 1648 | 13.9078 |
| 5 | 20.814484 | 108.895042 | 1710 | 12.4793 |
Note: T is the IR-source temperature assuming blackbody source; RHI is the IR-source radiant heat intensity.

Filtering results of nearshore lights and gas flare. (a) Location of gas combustion source; (b) filtering results of gas flare light; (c) nearshore lights; and (d) nearshore buffer zone.
Besides, as shown in Figure 8c, after being covered by the land mask, a few nearshore building lights are still exposed. By setting the nearshore and island buffer zones, these light radiations can be effectively covered, and the results are shown in Figure 8d.
3.1.3 Valid ship marking results
The effective ship marking results are shown in Figure 9, where the green vector dots represent the position of the vessel. Figure 9a–c represents the distribution of ships in LJ1-01 images on different dates; and Figure 9d–f shows the distribution of ships in VIIRS images on different dates. It can be seen from the figure that the ship’s distribution in the two images on the same date is very similar, indicating that most ship lights can be recorded by nighttime light images with different resolutions. However, in the LJ1-01 images, the number of valid ships is more than the VIIRS images, with an average of 108 more ships per image.

Valid ship marking results. (a–c) Effective ships in LJ1-01 images and (d–f) effective ships in VIIRS images.
According to the data analysis results (see Section 4.1.1), the LJ1-01 image has a stronger light recognition ability than the VIIRS image. Therefore, the LJ1-01 image can record more ship lights, and these lights are very weak or invisible in the VIIRS image. The aforementioned analysis unilaterally shows that more potential ship lights can be identified in the high-resolution image, but it cannot represent that the image has better detection accuracy in the automatic detection method. Based on this, the valid ship marking results shown in Figure 9 will be used as the standard data to verify the accuracy of different nighttime light data in the ship’s automatic detection methods.
3.2 Ship detection results
By using the corrected LJ1-01 and VIIRS nighttime light images and standard ship marking results (Figure 9), this section analyzes the detection characteristics of these two nighttime light images in different ship detection methods. Figure 10 shows the detection results using the TS method. Figure 10a and c shows the detection results of ship lights in LJ1-01 and VIIRS images, respectively. It can be seen that the coverage area of the ship light detection results of the LJ1-01 images is significantly smaller than that of the VIIRS images, but the ship lights of the LJ1-01 images show richer details. The main reason is that the LJ1-01 data have a higher resolution, and the coverage area of a single-pixel is smaller, making the detection result more detailed. Besides, Figure 10b and d shows the classification of the ship detection results. It can be seen that the number of correct detected ships (green dots) in the LJ1-01 images is significantly more than that in the VIIRS images; the number of missed detection ships (yellow dots) is equivalent. However, compared with the VIIRS images, there are also more false detection results (red dots) in the LJ1-01 images.

Detection results using the TS method. (a) Ship lights detection results in the LJ1-01 images; (b) detection result classification in the LJ1-01 images; (c) ship lights detection results in the VIIRS images; and (d) detection results classification in the VIIRS images.
Figure 11 shows the results of the ship detected using the TP-CFAR method. Judging from the detection results of ship lights, the results in the LJ1-01 images (Figure 11a) are significantly smaller than the VIIRS images (Figure 11c), which is consistent with the TS method detection results. However, it can be seen from the classification of the results that there is a significant difference in the detection accuracy between the two types of images. In the LJ1-01 images detection results (Figure 11b), a large number of correct detection results (green dots) and a small number of missed detection results (yellow dots) can be observed, but there are also a small number of false detection results (red dots). In the VIIRS images detection results (Figure 11d), except for a small number of false detection results, the correct detection results are significantly less and are accompanied by a large number of missed detection results.

Detection results using the TP-CFAR method. (a) Ship lights detection results in the LJ1-01 images; (b) detection results classification in the LJ1-01 images; (c) ship light detection results in the VIIRS images; and (d) detection result classification in the VIIRS images.
Combined with the aforementioned, Figure 12 and Table 3 present the quantitative evaluation results of the ship detection accuracy of the two types of images using the TS and TP-CFAR methods. Analyzing the detection results of the TS method, it is found that the correct detection rate of ships in the LJ1-01 images on different dates is all higher than that of the VIIRS images, and it has a lower missed detection rate, but the false detection rate is slightly higher than that of the VIIRS images. In addition, by comparing the detection results of the TP-CFAR method, it can be found that the correct detection rate of the ship in the LJ1-01 images is significantly higher than that of the VIIRS images, and it has a lower false detection rate. The aforementioned results indicate that no matter which method is used, the accuracy of ship detection using the LJ1-01 data is higher than that of the VIIRS data (Table 3). Among them, when using the TS method, the correct detection rate of the ship in the LJ1-01 images is 10.59% (mean) higher than the VIIRS images; when using the TP-CFAR method, the former is 19.38% (mean) higher than the latter.

Accuracy assessment of ship detection results.
Quantitative results of ship detection accuracy
| Methods | Images | Number of standard ships | Correct detection results | Missed detection results | False detection results | |||
|---|---|---|---|---|---|---|---|---|
| Number | Proportion (%) | Number | Proportion | Number | Proportion (%) | |||
| TS | LJ_20180904 | 587 | 490 | 83.48 | 97 | 16.52% | 82 | 13.97 |
| LJ_20180920 | 320 | 263 | 82.19 | 57 | 17.81% | 76 | 23.75 | |
| LJ_20190215 | 468 | 372 | 79.49 | 96 | 20.51% | 64 | 13.68 | |
| VIIRS_20180904 | 478 | 348 | 72.80 | 130 | 27.20% | 44 | 9.21 | |
| VIIRS_20180920 | 240 | 165 | 68.75 | 75 | 31.25% | 40 | 16.67 | |
| VIIRS_20190215 | 332 | 243 | 73.19 | 89 | 26.81% | 61 | 18.37 | |
| TP-CFAR | LJ_20180904 | 587 | 476 | 81.09 | 111 | 18.91% | 84 | 14.31 |
| LJ_20180920 | 320 | 265 | 82.81 | 55 | 17.19% | 29 | 9.06 | |
| LJ_20190215 | 468 | 399 | 85.26 | 69 | 14.74% | 23 | 4.91 | |
| VIIRS_20180904 | 478 | 306 | 64.02 | 172 | 35.98% | 31 | 6.49 | |
| VIIRS_20180920 | 240 | 158 | 65.83 | 82 | 34.17% | 32 | 13.33 | |
| VIIRS_20190215 | 332 | 201 | 60.54 | 131 | 38.46% | 57 | 17.17 | |
Besides, Figure 12 shows that using the TS method to detect ships in the VIIRS images seems to have a better effect than using the TP-CFAR method, while the LJ1-01 images are the opposite. The main reason is that the TP-CFAR method requires a certain number of pixels to fitting the relevant parameters of the distribution function when detecting ships. In low-resolution images, there are far fewer pixels available for detection between adjacent ships than in high-resolution images, resulting in lower accuracy of the fitted parameters. Although there is no such problem when using the TS method to detect ships, this method will also bring a higher false detection result while ensuring the correct detection rate of the ship. It can be speculated that compared with the traditional nighttime light data, the high-resolution nighttime light data will have better adaptability in the smarter ship detection algorithms. In summary, the LJ1-01 nighttime light data can not only record more potential ship lights but also have higher accuracy in ship detection algorithms, which has great application potential in nighttime marine ship detection.
4 Discussion
The use of nighttime light remote sensing data to monitor marine vessels is a novel topic. The nighttime light remote sensing technology has a unique night imaging capability, which can overcome the problem that traditional daytime remote sensing images cannot monitor targets at night. Although there have been application studies of nighttime light data in the monitoring of marine vessels at night, the detection accuracy is still limited in the sea area where ships are densely distributed. Based on the LJ1-01 nighttime light images, this study explores the application of high-resolution nighttime light data in marine vessel detection at night and compares it with the current commonly used VIIRS nighttime light images. After the unified correction of the radiation value, the gas flare search method and the nearshore mask were designed to filter the offshore oil and gas exploration combustion sources and nearshore or island-building lights in the two types of images. Finally, combined with the TS and TP-CFAR methods, the spatial location information of ships in the Beibu Gulf area was obtained.
In the research of using nighttime light remote sensing images to detect marine ships, it is usually believed that higher resolution will naturally bring better detection results. But the premise of this result is that there is no noise or the same noise conditions in the two types of images. In fact, higher resolution usually also brings more prominent noise distribution, and these noises include outlier noise, background noise, and high-energy noise [50,51], which make the ship detection results to have many uncertainties. This study found that, compared with the low-resolution data, LJ1-01 high-resolution nighttime light data can record more potential weak ship lights, but also accompanied by some sharper noise. When the LJ1-01 data are processed using the TS method, more false detection results were displayed. In the TP-CFAR method, the false detection results are relatively reduced. However, compared with the VIIRS data, the accuracy of using LJ1-01 data to detect ships in both methods has been significantly improved, especially in the sea area where ships are densely distributed. However, this study still has some limitations. Due to the lack of actual data of the ship’s position, this article uses the preprocessed nighttime light images to manually mark the effective ship position, and hence, the verification of data may have slight errors. Moreover, this article only compares two relatively typical ship detection algorithms, and the accuracy will be reduced compared to the more intelligent detection algorithms. Nevertheless, this article can still provide a reliable reference for the application exploration of high-precision nighttime marine vessel detection.
High-resolution nighttime light data play an important role in the safety monitoring of high-density ship areas and have significant application potential in channel planning, tracking of illegal fishing fleets, and monitoring of illegal invasions in sea areas [52]. Also, with the further development of the high-resolution nighttime light remote sensing technology, more high-resolution nighttime light data are gradually available [53,54,55], which will make the application of night marine ship detection more reliable. In the future, it can also integrate diversified high-resolution remote sensing images to achieve all-weather and high-precision ship monitoring, which will be the main goal of the further work.
5 Conclusion
Based on LJ1-01 high-resolution nighttime light data, this article compares the currently commonly used VIIRS data and combined the TS and TP-CFAR methods to explore the characteristics, performance, and application potential of high-resolution data in marine ship detection.
The analysis of the data shows that the LJ1-01 nighttime light image has a higher radiation range and a higher resolution of the radiation value. It can record more potential ship lights, and the ship lights and background noise in the image are more accessible to distinguish. In addition, for the interference of offshore oil and gas burning light sources and nearshore architectural lights on ship detection, the gas flare filtering method and buffer zone designed in this article can effectively filter them and has a little effect on other light sources. Ship detection results show that the accuracy of ship detection using the LJ1-01 data is significantly higher than that of the VIIRS data. Among them, when using the TS method, the correct detection rate of the ship in the LJ1-01 images is 10.59% (mean) higher than the VIIRS images; when using the TP-CFAR method, the former is 19.38% (mean) higher than the latter.
This study considered the LJ1-01 data as an example and achieved the refined detection of nighttime marine vessels, which is of prominent significance to the safety management of marine ships. Moreover, comparing the characteristics of high-resolution and low-resolution nighttime light data in ship detection and providing corresponding data preprocessing methods can provide a significant reference for the application of high precision nighttime marine ship detection.
Acknowledgments
This work was funded by the National Natural Science Foundation of China (No.41561091) and the Key Project of Jiangxi Science and Technology Department (No.20142BBE50024). We thank the editors and anonymous reviewers for their constructive comments, which are very helpful for improving the quality of the paper.
Author contributions: Liang Zhong and Xiaosheng Liu conceived and designed the experiments; Liang Zhong and Peng Yang processed the data; Liang Zhong, Xiaosheng Liu, Peng Yang, and Rizhi Lin analyzed the results and write the paper.
References
[1] Liu Y, Sun C, Yang Y, Zhou M, Zhan W, Cheng W. Automatic extraction of offshore platforms using time-series Landsat-8 Operational Land Imager data. Remote Sens Environ 2016;175:73–91. 10.1016/j.rse.2015.12.047.Search in Google Scholar
[2] Liu Y, Yao L, Xiong W, Zhou Z. Fusion detection of ship targets in low resolution multi-spectral images. International Geoscience and Remote Sensing Symposium; 2016. p. 6545–8. 10.1109/igarss.2016.7730710.Search in Google Scholar
[3] Kang M, Ji K, Leng X, Lin Z. Contextual region-based convolutional neural network with multilayer fusion for SAR ship detection. Remote Sens 2017;9:860. 10.3390/rs9080860.Search in Google Scholar
[4] Zhuang Y, Chen H, Zhou H, Chen L, Bi F. Comprehensive Structure Voting Docked Ship Detection from High-Resolution Optical Satellite Images Based on Combined Multi-Orientation Sparse Representation. IGARSS 2018-2018 IEEE International Geoscience and Remote Sensing Symposium: IEEE; 2018. p. 733–6. 10.1109/igarss.2018.8519112.Search in Google Scholar
[5] Snapir B, Waine TW, Biermann L. Maritime vessel classification to monitor fisheries with sar: demonstration in the north sea. Remote Sens 2019;11:353. 10.3390/rs11030353.Search in Google Scholar
[6] Elvidge CD, Baugh KE, Kihn EA, Kroehl HW, Davis ER, Davis CW. Relation between satellite observed visible-near infrared emissions, population, economic activity and electric power consumption. Int J Remote Sens 1997;18:1373–9. 10.1080/014311697218485.Search in Google Scholar
[7] Doll CN, Muller J-P, Morley JG. Mapping regional economic activity from night-time light satellite imagery. Ecol Econ 2006;57:75–92. 10.1016/j.ecolecon.2005.03.007.Search in Google Scholar
[8] Shi K, Yu B, Huang Y, Hu Y, Yin B, Chen Z, et al. Evaluating the ability of NPP-VIIRS nighttime light data to estimate the gross domestic product and the electric power consumption of China at multiple scales: a comparison with DMSP-OLS data. Remote Sens 2014;6:1705–24. 10.3390/rs6021705.Search in Google Scholar
[9] Yu B, Deng S, Liu G, Yang C, Chen Z, Hill CJ, et al. Nighttime light images reveal spatial-temporal dynamics of global anthropogenic resources accumulation above ground. Environ Sci Technol 2018;52:11520–7. 10.1021/acs.est.8b02838.s001.Search in Google Scholar
[10] Wei Y, Liu H, Song W, Yu B, Xiu C. Normalization of time series DMSP-OLS nighttime light images for urban growth analysis with pseudo invariant features. Landscape Urban Plan 2014;128:1–13. 10.1016/j.landurbplan.2014.04.015.Search in Google Scholar
[11] Shi K, Yu B, Huang C, Wu J, Sun X. Exploring spatiotemporal patterns of electric power consumption in countries along the Belt and Road. Energy 2018;150:847–59. 10.1016/j.energy.2018.03.020.Search in Google Scholar
[12] Cheng T, Zhou W, Xu H, Fan W. Estimation of fishing vessel numbers close to the terminator in the pacific northwest using OLS/DMSP data. In: International Conference on Geo-Informatics in Resource Management and Sustainable Ecosystem. Springer; 2016. p. 321–7. 10.1007/978-981-10-3966-9_36.Search in Google Scholar
[13] Cho K, Ito R, Shimoda H, Sakata T. Technical note and cover fishing fleet lights and sea surface temperature distribution observed by DMSP/OLS sensor. Int J Remote Sens. 1999;20:3–9. 10.1080/014311699213569.Search in Google Scholar
[14] Elvidge CD, Baugh K, Zhizhin M, Hsu F-C, Ghosh T. Supporting international efforts for detecting illegal fishing and GAS flaring using viirs. 2017 IEEE International Geoscience and Remote Sensing Symposium (IGARSS): IEEE; 2017. p. 2802–5. 10.1109/igarss.2017.8127580.Search in Google Scholar
[15] Elvidge CD, Zhizhin M, Baugh K, Hsu F-C. Automatic boat identification system for VIIRS low light imaging data. Remote Sens 2015;7:3020–36. 10.3390/rs70303020.Search in Google Scholar
[16] Hsu F-C, Elvidge CD, Baugh K, Zhizhin M, Ghosh T, Kroodsma D, et al. Cross-matching VIIRS boat detections with vessel monitoring system tracks in Indonesia. Remote Sens. 2019;11:995. 10.3390/rs11090995.Search in Google Scholar
[17] Straka WC, Seaman CJ, Baugh K, Cole K, Stevens E, Miller SD. Utilization of the suomi national polar-orbiting partnership (npp) visible infrared imaging radiometer suite (viirs) day/night band for arctic ship tracking and fisheries management. Remote Sens. 2015;7:971–89. 10.3390/rs70100971.Search in Google Scholar
[18] Geronimo RC, Franklin EC, Brainard RE, Elvidge C, Santos M, Venegas R, et al. Mapping fishing activities and suitable fishing grounds using nighttime satellite images and maximum entropy modelling. Remote Sens. 2018;10:1604. 10.3390/rs10101604.Search in Google Scholar
[19] Lebona B, Kleynhans W, Celik T, Mdakane L. Ship detection using VIIRS sensor specific data. 2016 IEEE International Geoscience and Remote Sensing Symposium (IGARSS): IEEE; 2016. p. 1245–7. 10.1109/igarss.2016.7729315.Search in Google Scholar
[20] Cervera MA, Ginesi A, Eckstein K. Satellite-based vessel automatic identification system: a feasibility and performance analysis. Int J Satellite Commun Network 2011;29:117–42. 10.1002/sat.957.Search in Google Scholar
[21] Tetreault BJ. Use of the Automatic Identification System (AIS) for maritime domain awareness (MDA). Proceedings of Oceans 2005 Mts/Ieee: IEEE; 2005. p. 1590–4. 10.1109/oceans.2005.1639983.Search in Google Scholar
[22] Last P, Bahlke C, Hering-Bertram M, Linsen L. Comprehensive analysis of automatic identification system (AIS) data in regard to vessel movement prediction. J Navigat. 2014;67:791–809. 10.1017/s0373463314000253.Search in Google Scholar
[23] Liu L, Liu G, Chu X, Jiang Z, Zhang M, Ye J. Ship Detection and Tracking in Nighttime Video Images Based on the Method of LSDT. Journal of Physics: Conference Series; 2019: IOP Publishing. p. 042074. 10.1088/1742-6596/1187/4/042074.Search in Google Scholar
[24] Chen G, Liu Y, Tian Y, Tian H. Use of VIIRS DNB Satellite Images to Detect Nighttime Fishing Vessel Lights in Yellow Sea. Proceedings of the 3rd International Conference on Computer Science and Application Engineering; 2019. p. 1–5. 10.1145/3331453.3361661.Search in Google Scholar
[25] Jiang W, He G, Long T, Guo H, Yin R, Leng W, et al. Potentiality of using Luojia 1-01 nighttime light imagery to investigate artificial light pollution. Sensors. 2018;18:2900. 10.3390/s18092900.Search in Google Scholar PubMed PubMed Central
[26] Li X, Zhao L, Li D, Xu H. Mapping urban extent using Luojia 1-01 nighttime light imagery. Sensors. 2018;18:3665. 10.3390/s18113665.Search in Google Scholar PubMed PubMed Central
[27] Zhang G, Guo X, Li D, Jiang B. Evaluating the potential of LJ1-01 nighttime light data for modeling socio-economic parameters. Sensors. 2019;19:1465. 10.3390/s19061465.Search in Google Scholar PubMed PubMed Central
[28] Wang X, Qiu Y, Du F, Liu W, Sun D, Chen X, et al. Roles of fishing and climate change in long-term fish species succession and population dynamics in the outer Beibu Gulf, South China Sea. Acta Oceanol Sin. 2019;38:1–8. 10.1007/s13131-019-1484-5.Search in Google Scholar
[29] Yu H, Lim WX. The Guangxi Beibu Gulf Economic Zone and China’s Maritime Silk Road in the 21st Century. East Asian Policy. 2014;6:16–29. 10.1142/s1793930514000233.Search in Google Scholar
[30] Li X, Li X, Li D, He X, Jendryke M. A preliminary investigation of Luojia-1 night-time light imagery. Remote Sens Lett. 2019;10:526–35. 10.1080/2150704x.2019.1577573.Search in Google Scholar
[31] Liu Y, Sun C, Sun J, Li H, Zhan W, Yang Y, et al. Satellite data lift the veil on offshore platforms in the South China Sea. Sci Rep. 2016;6:1–9. 10.1038/srep33623.Search in Google Scholar PubMed PubMed Central
[32] Small C, Elvidge CD, Baugh K. Mapping urban structure and spatial connectivity with VIIRS and OLS night light imagery. Joint Urban Remote Sensing Event 2013: IEEE; 2013. p. 230–3. 10.1109/jurse.2013.6550707.Search in Google Scholar
[33] Ai J, Yang X, Dong Z, Zhou F, Jia L, Hou L. A new two parameter CFAR ship detector in Log-Normal clutter. 2017 IEEE Radar Conference (RadarConf): IEEE; 2017. p. 0195–9. 10.1109/radar.2017.7944196.Search in Google Scholar
[34] Ghosh R, Vajpeyi A, Akula A, Shaw V, Kumar S, Sardana H. Performance evaluation of a real-time seismic detection system based on CFAR detectors. IEEE Sens J. 2019;20:3678–86. 10.1109/jsen.2019.2959652.Search in Google Scholar
[35] Dai H, Du L, Wang Y, Wang Z. A modified CFAR algorithm based on object proposals for ship target detection in SAR images. IEEE Geosci Remote Sens Lett. 2016;13:1925–9. 10.1109/lgrs.2016.2618604.Search in Google Scholar
[36] Liu T, Yang Z, Marino A, Gao G, Yang J. Robust CFAR detector based on truncated statistics for polarimetric synthetic aperture radar. IEEE Trans Geosci Remote Sens. 2020;58:0196–2892. 10.1109/tgrs.2020.2979252.Search in Google Scholar
[37] Wang L, Wang D, Hao C. Intelligent CFAR detector based on support vector machine. IEEE Access. 2017;5:26965–72. 10.1109/access.2017.2774262.Search in Google Scholar
[38] Kang M, Leng X, Lin Z, Ji K. A modified faster R-CNN based on CFAR algorithm for SAR ship detection. 2017 International Workshop on Remote Sensing with Intelligent Processing (RSIP): IEEE; 2017. p. 1–4. 10.1109/rsip.2017.7958815.Search in Google Scholar
[39] Wang R, Li J, Duan Y, Cao H, Zhao Y. Study on the combined application of CFAR and deep learning in ship detection. J Ind Soc Remote Sens. 2018;46:1413–21. 10.1007/s12524-018-0787-x.Search in Google Scholar
[40] Massoud A, Jiang Z, Gao H, Zhou Y, Su R, Wang H, et al. Adaptive CA-CFAR thresholding based on an optimal number of reference cells. SPIE Future Sensing Technologies; 2019: International Society for Optics and Photonics. p. 111970W. 10.1117/12.2542715.Search in Google Scholar
[41] Trunk GV. Range resolution of targets using automatic detectors. IEEE Trans Aerospace Electron Syst 1978;AES-14:750–5. 10.1109/taes.1978.308625.Search in Google Scholar
[42] Weiss M. Analysis of some modified cell-averaging CFAR processors in multiple-target situations. IEEE Trans Aerospace Electron Syst. 1982;AES-18:102–14. 10.1109/taes.1982.309210.Search in Google Scholar
[43] Weber P, Haykin S. Ordered statistic CFAR processing for two-parameter distributions with variable skewness. IEEE Trans Aerospace Electron Syst. 1985;AES-21:819–21. 10.1109/taes.1985.310668.Search in Google Scholar
[44] Zhai L, Li Y, Su Y. A novel ship detection algorithm based on anomaly detection theory for SAR images. 2016 Progress in Electromagnetic Research Symposium (PIERS): IEEE; 2016. p. 2868–72. 10.1109/piers.2016.7735144.Search in Google Scholar
[45] Yin K, Jin L, Zhang C, Guo Y. A method for automatic target recognition using shadow contour of SAR image. IETE Techn Rev. 2013;30:313–23. 10.4103/0256-4602.116721.Search in Google Scholar
[46] Zhang J, Wang Q, Su F. Automatic extraction of offshore platforms in single SAR images based on a dual-step-modified model. Sensors. 2019;19:231. 10.3390/s19020231.Search in Google Scholar PubMed PubMed Central
[47] Ai J, Qi X, Yu W, Deng Y, Liu F, Shi L. A new CFAR ship detection algorithm based on 2-D joint log-normal distribution in SAR images. IEEE Geosci Remote Sens Lett. 2010;7:806–10. 10.1109/lgrs.2010.2048697.Search in Google Scholar
[48] Liu Y, Zhang S, Suo J, Zhang J, Yao T. Research on a new comprehensive CFAR (Comp-CFAR) processing method. IEEE Access. 2019;7:19401–13. 10.1109/access.2019.2897358.Search in Google Scholar
[49] Cui Z, Quan H, Cao Z, Xu S, Ding C, Wu J. SAR target CFAR detection via GPU parallel operation. IEEE J Select Top Appl Earth Observat Remote Sens. 2018;11:4884–94. 10.1109/jstars.2018.2879082.Search in Google Scholar
[50] Elvidge CD, Baugh K, Zhizhin M, Hsu FC, Ghosh T. VIIRS night-time lights. Int J Remote Sens. 2017;38:5860–79. 10.1080/01431161.2017.1342050Search in Google Scholar
[51] Zheng Q, Weng Q, Wang K. Developing a new cross-sensor calibration model for DMSP-OLS and Suomi-NPP VIIRS night-light imageries. ISPRS J Photogramm Remote Sens. 2019;153:36–47. 10.1016/j.isprsjprs.2019.04.019.Search in Google Scholar
[52] Zhao M, Zhou Y, Li X, Cao W, He C, Yu B, et al. Applications of satellite remote sensing of nighttime light observations: advances, challenges, and perspectives. Remote Sens. 2019;11:1971. 10.3390/rs11171971.Search in Google Scholar
[53] Wang C, Ke J, Xiu W, Ye K, Li Q. Emergency response using volunteered passenger aircraft remote sensing data: a case study on flood damage mapping. Sensors. 2019;19:4163. 10.3390/s19194163.Search in Google Scholar PubMed PubMed Central
[54] Levin N, Johansen K, Hacker JM, Phinn S. A new source for high spatial resolution night time images – the EROS-B commercial satellite. Remote Sens Environ. 2014;149:1–12. 10.1016/j.rse.2014.03.019.Search in Google Scholar
[55] Zheng Q, Weng Q, Huang L, Wang K., Deng J., Jiang R., et al. A new source of multi-spectral high spatial resolution night-time light imagery – JL1-3B. Remote Sens Environ. 2018;215:300–12. 10.1016/j.rse.2018.06.016.Search in Google Scholar
© 2020 Liang Zhong et al., published by De Gruyter
This work is licensed under the Creative Commons Attribution 4.0 International License.
Articles in the same Issue
- Regular Articles
- The simulation approach to the interpretation of archival aerial photographs
- The application of137Cs and210Pbexmethods in soil erosion research of Titel loess plateau, Vojvodina, Northern Serbia
- Provenance and tectonic significance of the Zhongwunongshan Group from the Zhongwunongshan Structural Belt in China: insights from zircon geochronology
- Analysis, Assessment and Early Warning of Mudflow Disasters along the Shigatse Section of the China–Nepal Highway
- Sedimentary succession and recognition marks of lacustrine gravel beach-bars, a case study from the Qinghai Lake, China
- Predicting small water courses’ physico-chemical status from watershed characteristics with two multivariate statistical methods
- An Overview of the Carbonatites from the Indian Subcontinent
- A new statistical approach to the geochemical systematics of Italian alkaline igneous rocks
- The significance of karst areas in European national parks and geoparks
- Geochronology, trace elements and Hf isotopic geochemistry of zircons from Swat orthogneisses, Northern Pakistan
- Regional-scale drought monitor using synthesized index based on remote sensing in northeast China
- Application of combined electrical resistivity tomography and seismic reflection method to explore hidden active faults in Pingwu, Sichuan, China
- Impact of interpolation techniques on the accuracy of large-scale digital elevation model
- Natural and human-induced factors controlling the phreatic groundwater geochemistry of the Longgang River basin, South China
- Land use/land cover assessment as related to soil and irrigation water salinity over an oasis in arid environment
- Effect of tillage, slope, and rainfall on soil surface microtopography quantified by geostatistical and fractal indices during sheet erosion
- Validation of the number of tie vectors in post-processing using the method of frequency in a centric cube
- An integrated petrophysical-based wedge modeling and thin bed AVO analysis for improved reservoir characterization of Zhujiang Formation, Huizhou sub-basin, China: A case study
- A grain size auto-classification of Baikouquan Formation, Mahu Depression, Junggar Basin, China
- Dynamics of mid-channel bars in the Middle Vistula River in response to ferry crossing abutment construction
- Estimation of permeability and saturation based on imaginary component of complex resistivity spectra: A laboratory study
- Distribution characteristics of typical geological relics in the Western Sichuan Plateau
- Inconsistency distribution patterns of different remote sensing land-cover data from the perspective of ecological zoning
- A new methodological approach (QEMSCAN®) in the mineralogical study of Polish loess: Guidelines for further research
- Displacement and deformation study of engineering structures with the use of modern laser technologies
- Virtual resolution enhancement: A new enhancement tool for seismic data
- Aeromagnetic mapping of fault architecture along Lagos–Ore axis, southwestern Nigeria
- Deformation and failure mechanism of full seam chamber with extra-large section and its control technology
- Plastic failure zone characteristics and stability control technology of roadway in the fault area under non-uniformly high geostress: A case study from Yuandian Coal Mine in Northern Anhui Province, China
- Comparison of swarm intelligence algorithms for optimized band selection of hyperspectral remote sensing image
- Soil carbon stock and nutrient characteristics of Senna siamea grove in the semi-deciduous forest zone of Ghana
- Carbonatites from the Southern Brazilian platform: I
- Seismicity, focal mechanism, and stress tensor analysis of the Simav region, western Turkey
- Application of simulated annealing algorithm for 3D coordinate transformation problem solution
- Application of the terrestrial laser scanner in the monitoring of earth structures
- The Cretaceous igneous rocks in southeastern Guangxi and their implication for tectonic environment in southwestern South China Block
- Pore-scale gas–water flow in rock: Visualization experiment and simulation
- Assessment of surface parameters of VDW foundation piles using geodetic measurement techniques
- Spatial distribution and risk assessment of toxic metals in agricultural soils from endemic nasopharyngeal carcinoma region in South China
- An ABC-optimized fuzzy ELECTRE approach for assessing petroleum potential at the petroleum system level
- Microscopic mechanism of sandstone hydration in Yungang Grottoes, China
- Importance of traditional landscapes in Slovenia for conservation of endangered butterfly
- Landscape pattern and economic factors’ effect on prediction accuracy of cellular automata-Markov chain model on county scale
- The influence of river training on the location of erosion and accumulation zones (Kłodzko County, South West Poland)
- Multi-temporal survey of diaphragm wall with terrestrial laser scanning method
- Functionality and reliability of horizontal control net (Poland)
- Strata behavior and control strategy of backfilling collaborate with caving fully-mechanized mining
- The use of classical methods and neural networks in deformation studies of hydrotechnical objects
- Ice-crevasse sedimentation in the eastern part of the Głubczyce Plateau (S Poland) during the final stage of the Drenthian Glaciation
- Structure of end moraines and dynamics of the recession phase of the Warta Stadial ice sheet, Kłodawa Upland, Central Poland
- Mineralogy, mineral chemistry and thermobarometry of post-mineralization dykes of the Sungun Cu–Mo porphyry deposit (Northwest Iran)
- Main problems of the research on the Palaeolithic of Halych-Dnister region (Ukraine)
- Application of isometric transformation and robust estimation to compare the measurement results of steel pipe spools
- Hybrid machine learning hydrological model for flood forecast purpose
- Rainfall thresholds of shallow landslides in Wuyuan County of Jiangxi Province, China
- Dynamic simulation for the process of mining subsidence based on cellular automata model
- Developing large-scale international ecological networks based on least-cost path analysis – a case study of Altai mountains
- Seismic characteristics of polygonal fault systems in the Great South Basin, New Zealand
- New approach of clustering of late Pleni-Weichselian loess deposits (L1LL1) in Poland
- Implementation of virtual reference points in registering scanning images of tall structures
- Constraints of nonseismic geophysical data on the deep geological structure of the Benxi iron-ore district, Liaoning, China
- Mechanical analysis of basic roof fracture mechanism and feature in coal mining with partial gangue backfilling
- The violent ground motion before the Jiuzhaigou earthquake Ms7.0
- Landslide site delineation from geometric signatures derived with the Hilbert–Huang transform for cases in Southern Taiwan
- Hydrological process simulation in Manas River Basin using CMADS
- LA-ICP-MS U–Pb ages of detrital zircons from Middle Jurassic sedimentary rocks in southwestern Fujian: Sedimentary provenance and its geological significance
- Analysis of pore throat characteristics of tight sandstone reservoirs
- Effects of igneous intrusions on source rock in the early diagenetic stage: A case study on Beipiao Formation in Jinyang Basin, Northeast China
- Applying floodplain geomorphology to flood management (The Lower Vistula River upstream from Plock, Poland)
- Effect of photogrammetric RPAS flight parameters on plani-altimetric accuracy of DTM
- Morphodynamic conditions of heavy metal concentration in deposits of the Vistula River valley near Kępa Gostecka (central Poland)
- Accuracy and functional assessment of an original low-cost fibre-based inclinometer designed for structural monitoring
- The impacts of diagenetic facies on reservoir quality in tight sandstones
- Application of electrical resistivity imaging to detection of hidden geological structures in a single roadway
- Comparison between electrical resistivity tomography and tunnel seismic prediction 303 methods for detecting the water zone ahead of the tunnel face: A case study
- The genesis model of carbonate cementation in the tight oil reservoir: A case of Chang 6 oil layers of the Upper Triassic Yanchang Formation in the western Jiyuan area, Ordos Basin, China
- Disintegration characteristics in granite residual soil and their relationship with the collapsing gully in South China
- Analysis of surface deformation and driving forces in Lanzhou
- Geochemical characteristics of produced water from coalbed methane wells and its influence on productivity in Laochang Coalfield, China
- A combination of genetic inversion and seismic frequency attributes to delineate reservoir targets in offshore northern Orange Basin, South Africa
- Explore the application of high-resolution nighttime light remote sensing images in nighttime marine ship detection: A case study of LJ1-01 data
- DTM-based analysis of the spatial distribution of topolineaments
- Spatiotemporal variation and climatic response of water level of major lakes in China, Mongolia, and Russia
- The Cretaceous stratigraphy, Songliao Basin, Northeast China: Constrains from drillings and geophysics
- Canal of St. Bartholomew in Seča/Sezza: Social construction of the seascape
- A modelling resin material and its application in rock-failure study: Samples with two 3D internal fracture surfaces
- Utilization of marble piece wastes as base materials
- Slope stability evaluation using backpropagation neural networks and multivariate adaptive regression splines
- Rigidity of “Warsaw clay” from the Poznań Formation determined by in situ tests
- Numerical simulation for the effects of waves and grain size on deltaic processes and morphologies
- Impact of tourism activities on water pollution in the West Lake Basin (Hangzhou, China)
- Fracture characteristics from outcrops and its meaning to gas accumulation in the Jiyuan Basin, Henan Province, China
- Impact evaluation and driving type identification of human factors on rural human settlement environment: Taking Gansu Province, China as an example
- Identification of the spatial distributions, pollution levels, sources, and health risk of heavy metals in surface dusts from Korla, NW China
- Petrography and geochemistry of clastic sedimentary rocks as evidence for the provenance of the Jurassic stratum in the Daqingshan area
- Super-resolution reconstruction of a digital elevation model based on a deep residual network
- Seismic prediction of lithofacies heterogeneity in paleogene hetaoyuan shale play, Biyang depression, China
- Cultural landscape of the Gorica Hills in the nineteenth century: Franciscean land cadastre reports as the source for clarification of the classification of cultivable land types
- Analysis and prediction of LUCC change in Huang-Huai-Hai river basin
- Hydrochemical differences between river water and groundwater in Suzhou, Northern Anhui Province, China
- The relationship between heat flow and seismicity in global tectonically active zones
- Modeling of Landslide susceptibility in a part of Abay Basin, northwestern Ethiopia
- M-GAM method in function of tourism potential assessment: Case study of the Sokobanja basin in eastern Serbia
- Dehydration and stabilization of unconsolidated laminated lake sediments using gypsum for the preparation of thin sections
- Agriculture and land use in the North of Russia: Case study of Karelia and Yakutia
- Textural characteristics, mode of transportation and depositional environment of the Cretaceous sandstone in the Bredasdorp Basin, off the south coast of South Africa: Evidence from grain size analysis
- One-dimensional constrained inversion study of TEM and application in coal goafs’ detection
- The spatial distribution of retail outlets in Urumqi: The application of points of interest
- Aptian–Albian deposits of the Ait Ourir basin (High Atlas, Morocco): New additional data on their paleoenvironment, sedimentology, and palaeogeography
- Traditional agricultural landscapes in Uskopaljska valley (Bosnia and Herzegovina)
- A detection method for reservoir waterbodies vector data based on EGADS
- Modelling and mapping of the COVID-19 trajectory and pandemic paths at global scale: A geographer’s perspective
- Effect of organic maturity on shale gas genesis and pores development: A case study on marine shale in the upper Yangtze region, South China
- Gravel roundness quantitative analysis for sedimentary microfacies of fan delta deposition, Baikouquan Formation, Mahu Depression, Northwestern China
- Features of terraces and the incision rate along the lower reaches of the Yarlung Zangbo River east of Namche Barwa: Constraints on tectonic uplift
- Application of laser scanning technology for structure gauge measurement
- Calibration of the depth invariant algorithm to monitor the tidal action of Rabigh City at the Red Sea Coast, Saudi Arabia
- Evolution of the Bystrzyca River valley during Middle Pleistocene Interglacial (Sudetic Foreland, south-western Poland)
- A 3D numerical analysis of the compaction effects on the behavior of panel-type MSE walls
- Landscape dynamics at borderlands: analysing land use changes from Southern Slovenia
- Effects of oil viscosity on waterflooding: A case study of high water-cut sandstone oilfield in Kazakhstan
- Special Issue: Alkaline-Carbonatitic magmatism
- Carbonatites from the southern Brazilian Platform: A review. II: Isotopic evidences
- Review Article
- Technology and innovation: Changing concept of rural tourism – A systematic review