Deformation and failure mechanism of full seam chamber with extra-large section and its control technology
-
Bingjie Huo
 ,
Xiangbin Meng
,
Xiangbin Meng

Abstract
In order to effectively predict and control the rib spalling and roof leakage, it is necessary to reveal the deformation and failure mechanism of the chamber and propose the corresponding surrounding rock control technology. Based on uniaxial compression experiments and numerical simulations, it is concluded that coal body damage is dominated by shear failure during uniaxial compression, which indicates to some extent the main form of damage of the surrounding rock in the chamber. Then the combined finite and discrete element method is used to establish a numerical model to reveal the evolution law of fracture in the surrounding rock. The simulation results show that after the excavation of the chamber, a large amount of shear failure occurred in the ribs and the roof. Then those cracks further developed, expanded, penetrated, and finally connected with the surface of the chamber. Under the effect of the mine pressure, the coal body is separated from the surface of the chamber, leading to the occurrence of rib spalling and roof leakage. So it was given that support method by controlling crack development. The grouting and high-strength anchor bolt and anchor cable are proposed to improve the shear strength of the surrounding rock, which helps to reduce the occurrence of cracks, and inhibit the cracks from interpenetrating. An industrial test was carried out in the chamber of Tashan Coal Mine, which showed good control effect of the surrounding rock in the chamber.
1 Introduction
Coal is China’s major primary energy source, accounting for more than 70% of the total energy consumption [1,2]. According to the statistics, more than 50% of China’s current coal reserves are thick and extra-thick coal seams [3]. For the thick and extra-thick coal seams, domestic and foreign scholars have developed large mining height method and top coal caving method [4,5]. With the maturity of these two technologies, the mine coal production has increased quickly and the section area of the chamber has been increasing [6]. Generally speaking, the width of the chamber is 6–10 m and the height is 8–10 m in the top coal caving method. Therefore, the chamber area is above 70–100 m2 [7]. When the strength of the coal seam is high, putting the large-section chamber into seam can not only increase coal production but also significantly accelerate the excavation speed [8]. Due to the complicated stress conditions, large chamber height, span, and disturbance during excavation, the roof and the two ribs of the chamber will be deformed and destroyed. In the worst situation, rib spalling and roof leakage could occur. In order to improve the anti-deformation ability and stability of the large-section full seam chamber, domestic and foreign scholars have adopted different research methods to optimize the cross-sectional shape of the chamber. It is concluded that the shape, straight wall with semi-circular arch, is not only relatively easy to excavate and support, but it also has a stable structure and is easy to maintain. Therefore, it is widely used in coal mines.
At present, the studies on deformation and the failure of the large-section chamber or roadway mainly includes the following. Coggan et al. [7] used the Fast Lagrangian Analysis of Continua (FLAC), a differential numerical simulation software, to reveal the influence of weak roof on the stability of the large-section roadway. Tonon et al. [9] studied the effect of grouting on plastic failure of the 260 m2 large-section chamber under the coal mining area. Zheng et al. [10] revealed the failure mechanism of anchor resin coils for the large-section roadway based on the theoretical calculations. Xiong et al. [11] established the three-dimensional numerical models of four excavation schemes for the chamber and revealed the characteristics of the plastic zone of the surrounding rock under these excavation methods. Then the excavation method was optimized. Zhang et al. [12] used FLAC to study the dynamic response of coal mine refuge chamber for underground gas explosion. Zhai et al. [13] used the FLAC to study the control of deformation of the surrounding rock of the large-section chamber by means of bolt support and open-roof groove. Islam et al. [14] studied the influence of gas outburst on roadway of the plastic zone. Yan et al. [15] proposed a new method to predict the roof breakage of the large-section coal roadway in the extra-thick coal seam. Jiang et al. [16] studied the influence of foundation rigidity of the direct roof on the stability of the large-section roadway.
The above studies mainly focus on the use of continuous numerical simulation software to reveal the development law of the plastic zone of the surrounding rock of the chamber or roadway or to analyze their stability based on the theoretical calculations. However, the failure of the surrounding rock of the chamber is a process of initiation, extension, and penetration of the crack. The above two methods cannot simulate the crack development of the surrounding rock of the chamber. Therefore, this article proposed the method of combined finite and discrete element method (FDEM). The FDEM is used to simulate the surrounding rock crack development of the chamber, which can accurately reveal the deformation and failure mechanism. Then the corresponding control measures are proposed to avoid damage to the personnel and equipment caused by rib spalling and roof leakage accidents.
This article takes the chamber of Tashan Coal Mine as the engineering background and reveal the crack development of coal body based on compression test and numerical calculation. Then the FDEM is used to establish the numerical model of the surrounding rock of the chamber. The crack development of the surrounding rock of the chamber is analyzed using the model to reveal the mechanisms of rib spalling and roof leakage. Based on the failure mechanism of the chamber surrounding rock, a support method the combines grouting and high-strength anchor bolt and anchor cable is proposed, and the industrial test is carried out in the chamber of Tashan Coal Mine.
2 Engineering background
2.1 Geological condition of coal mine
As shown in Figure 1, Tashan Coal Mine is in Datong Coalfield, Datong City, Shanxi Province, China, and is mining carboniferous 3–5# coal seam. The thickness of the carboniferous 3–5# coal seam is between 14 and 20 m, the buried depth is 400–800 m, and the dip angle of the coal seam is between 1 and 4°. The 3–5# coal seam is generally stable, with abundant coal reserves and relatively simple geological structure conditions. Therefore, the Tashan coal mine in Datong coal field produces more than 15 million tons for one working face per year.
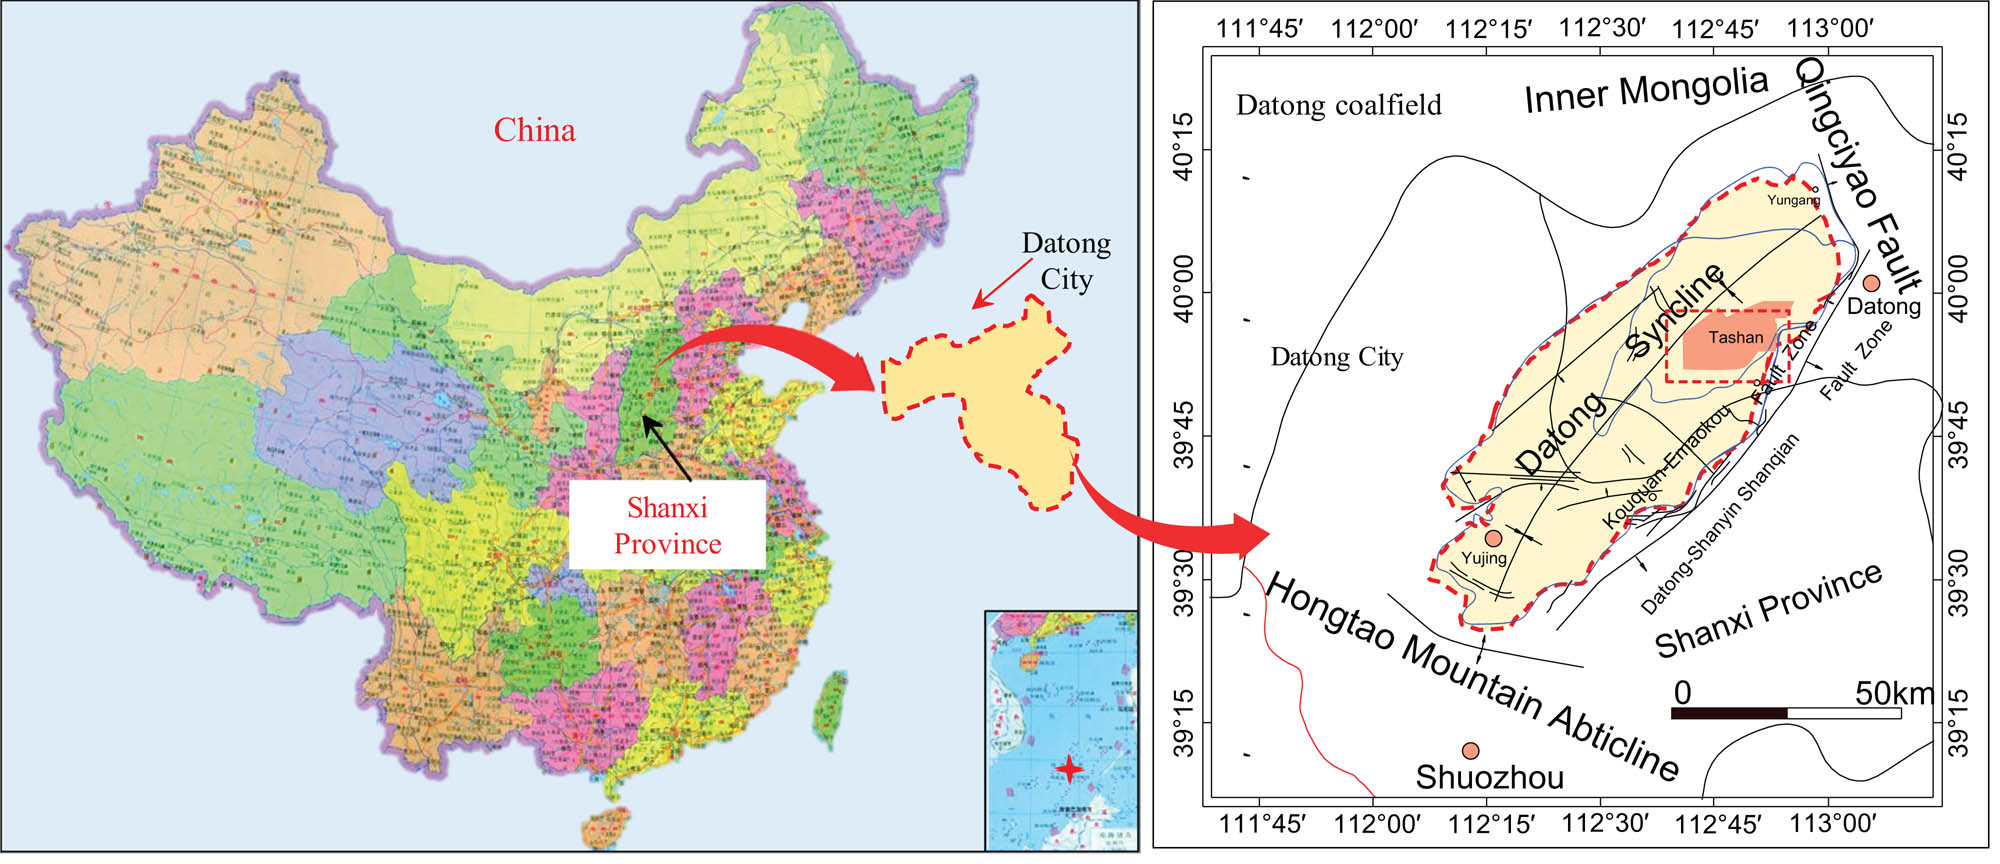
Location of Tashan Coal Mine.
In order to meet the requirements of coal transportation, Tashan Coal Mine arranges the 1,070 transportation main road in the floor of 3–5# coal seam. According to the borehole near the 1,070 transportation main road, the thickness of the 3–5# coal seam is 18.14 m. The occurrence of rock strata is shown in Figure 2.
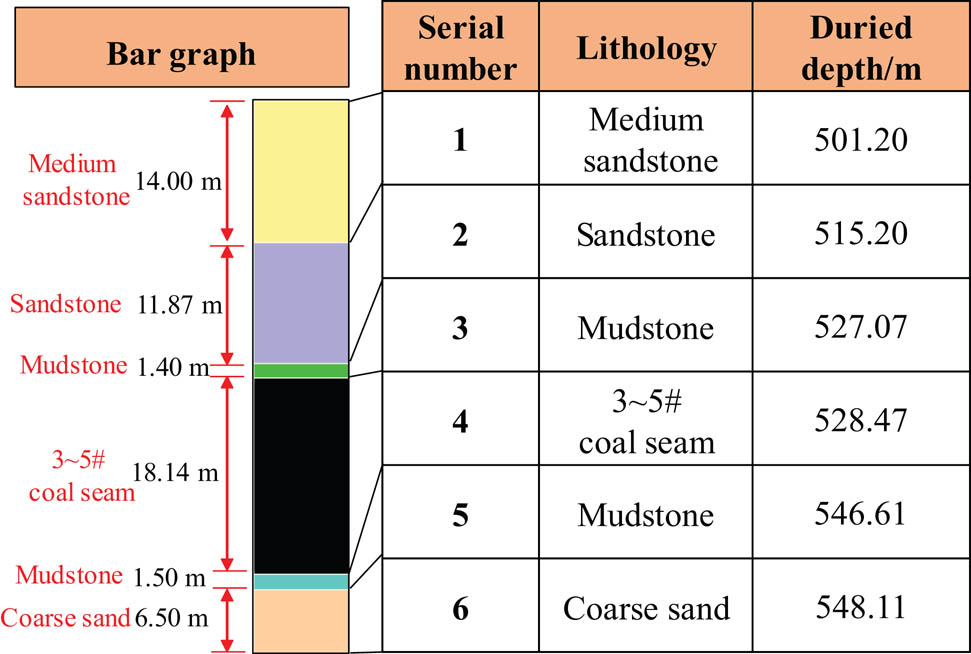
Rock stratum bar graph.
2.2 Chamber conditions
In order to meet the cross-sectional area requirements for the installation of mechanical and electrical equipment, it is necessary to expand it at the local position of the original 1,070 transportation main road and form a large-section full seam chamber. According to the design requirements, the width of the chamber is 9.5 m and the height is 11.85 m, as shown in Figure 3. Rib spalling and roof leakage occurred during chamber excavation, which not only has a serious impact on the safety of the personnel and equipment but also makes it difficult to support the chamber. Therefore, it is first necessary to reveal the deformation and failure mechanism of the surrounding rock of the chamber. Then the corresponding surrounding rock control technology should be proposed.
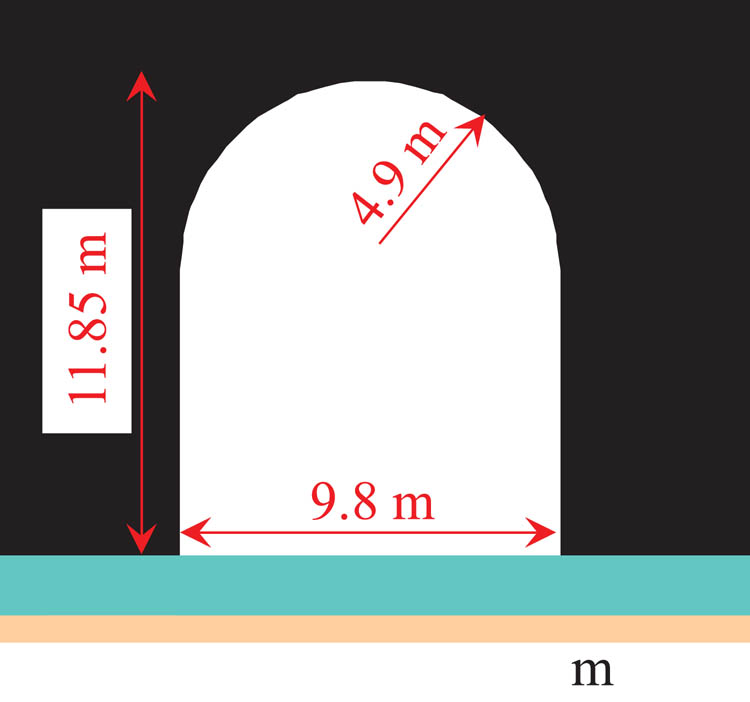
Chamber dimensions.
3 Coal body failure characteristics during uniaxial compression
3.1 Coal sample preparation and experimental equipment
As shown in Figure 4, the coal pieces, selected in the field, are cut into a standard coal sample with a diameter of 50 mm and a height of 100 mm. The non-parallelism of the two ends of the coal sample is less than 0.05 mm, and the diameter deviation of the upper and lower ends is less than 0.3 mm. The surface should be smooth and avoid stress concentration due to irregular surfaces. The coal sample is placed in the MTS815 Flex Test rock mechanics test system, and the PCI-II acoustic emission test system is used for the real-time positioning test of the whole process of uniaxial compression.
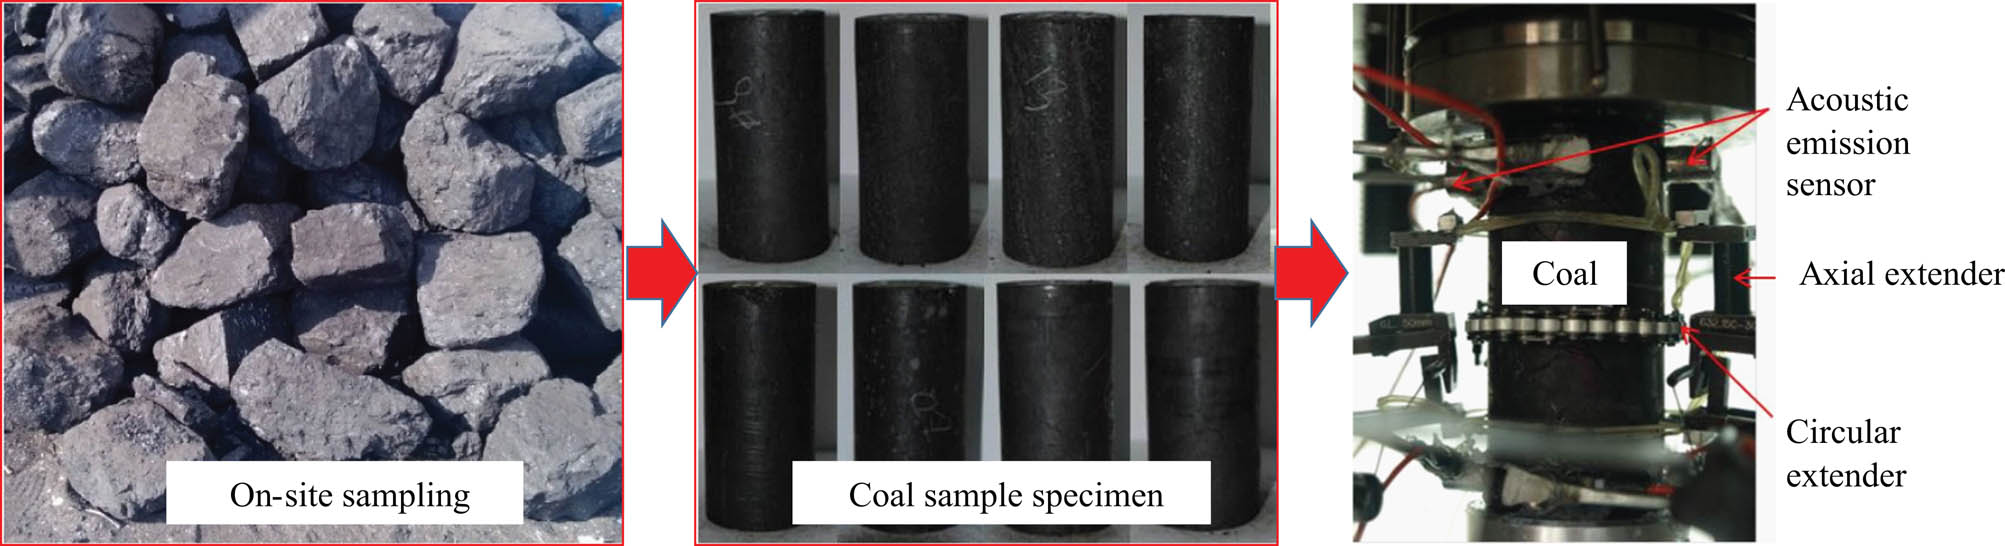
Coal sample preparation and test equipment.
In order to further analyze the number of cracks caused by shear failure and tensile failure of coal samples during uniaxial compression and reveal the main failure modes in the compression process, a numerical simulation of a set of uniaxial compression is added. The Universal Distinct Element Code (UDEC) numerical calculation software was used to simulate the development characteristics of the fissures of rock blocks during uniaxial compression. The UDEC is a two-dimensional numerical program that simulates the quasi-static or dynamic response to loading of media containing multiple intersecting joint structures.
3.2 Coal sample failure characteristics
It can be seen from Figure 5(a) that the uniaxial compressive stress–strain curves of the experiments and numerical simulations are basically consistent, which verify the reliability and accuracy of the simulation. Further, the stress–strain process of the coal sample can be divided into the compaction phase, linear elastic phase, plastic deformation phase, strain-softening phase, and residual strength phases [17], the corresponding strain ranges of which are 0–8.5 × 10⁻⁴, 8.5 × 10⁻⁴–1.95 × 10⁻³, 1.95 × 10⁻³–2.3 × 10⁻³, 2.3 × 10⁻³–2.75 × 10⁻³, and 2.75 × 10⁻³–3.0 × 10⁻³, respectively [18].
Compaction phase: in the stress–strain relationship, as the axial stress increases, the original micro-cracks and pores inside the coal sample are closed, and the coal sample is gradually compacted. When there is an increase in the axial stress, a continuous decrease was observed in the rate of strain increase and the stress–strain curve bends downward. While monitoring the acoustic emission, small energy was observed in the micro-cracks and pore closure process of the coal sample. From the simulation it can be observed that the number of cracks in the coal sample that are caused by shear failure and tensile failure is less and increases slowly.
Linear elastic phase: as the axial stress continues to increase, the coal sample enters the linear elastic phase. The stress–strain curve of the coal sample is almost linear in this phase. While monitoring the acoustic emission, the acoustic emission (AE) signal becomes active and the AE spatial positioning points become obviously denser. New and original micro-cracks extend and connect. Finally, the micro-cracks penetrate each other to form macroscopic cracks. In this phase it has been observed from the simulation that the number of fractures caused by shear failure and tensile failure has significantly increased, with the number of fractures caused by shear failure being significantly more than that of tensile failure.
Plastic deformation phase: after the linear elastic deformation phase, the presence of mineral particles and micro-fracture pores in the coal sample results in the uneven distribution of stress in the sample, causing local stress concentration. The micro-cracks continue to develop and connect with each other, eventually becoming macroscopic cracks.
Strain-softening phase: the specimen is broken and its bearing capacity is reduced. When monitoring the acoustic emission, we can still observe the acoustic emission events in the coal sample, i.e., significance reduction in energy release, which is mainly caused by micro-rupture events. Considering the number of fractures, the number of cracks caused by shear failure and tensile failure tends to be stable.
Residual strength phases: when a rock reaches a residual state, the shear cracks and tensile cracks also reach the stable state. At this time, the bearing capacity of the surrounding rock is maintained at a constant value.
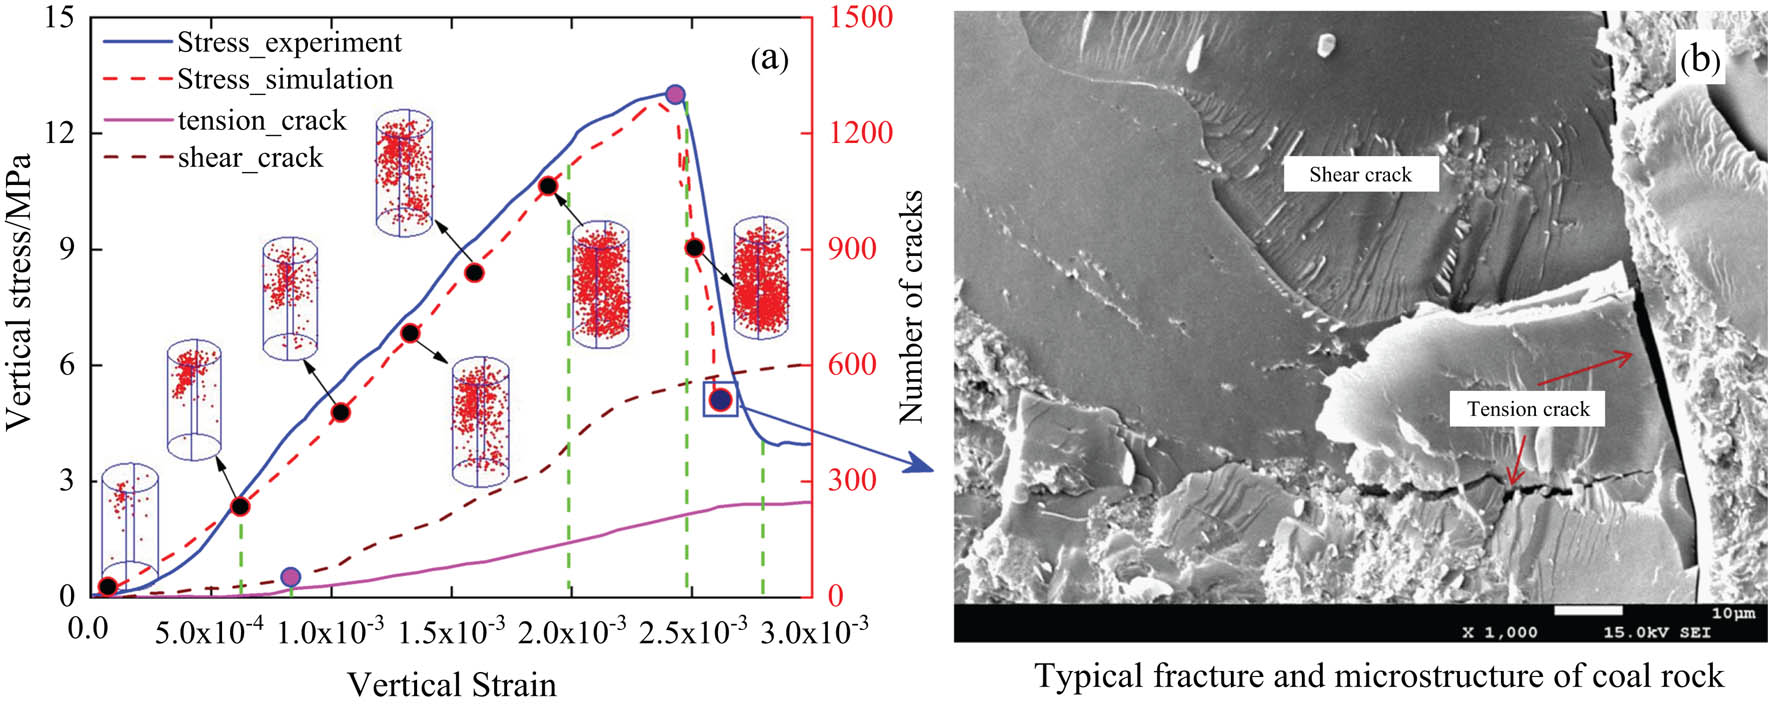
Uniaxial compression for coal sample. (a) Uniaxial compressive stress–strain curves; (b) Typical fracture characteristics of coal rock.
A high-power microscope is used to observe the crack structure, as shown in Figure 5(b). The result shows that the crack section is mainly shear failure, while the tensile failure is relatively less.
The above analysis shows that the stress–strain curve of the coal sample, the intensity and quantity of the acoustic emission AE event, and the number of cracks have a good correspondence at different phases. During the compression process of the coal sample, cracks are mainly produced in the linear phase and are mainly due to shear failure. To a certain extent, this indicates that the surrounding rock of the large-section full seam chamber is mainly destroyed by the shearing force under the effect of the stope stress.
4 The combined FDEM
Traditional methods often use continuous numerical methods to analyze the plastic development of the surrounding rock and reveal the damage area of the chamber. However, the destruction of the surrounding rock of the chamber is a dynamic process of fissure generation, expansion, and penetration. Therefore, the continuous numerical method cannot simulate the development process of cracks and reveal the internal mechanism of deformation and failure of the surrounding rock of chamber. Therefore, it is necessary to combine the continuous numerical method with the discrete element method. The combined FDEM is an effective way to solve the above problem. The finite element method can be used for analyzing the stress evolution of the chamber surrounding the rock, while the discrete element method can be used for analyzing the surrounding rock crack development. These methods are complementary to each other and together they can reveal the complex process of deformation and destruction of the surrounding rock.
4.1 Basic principle of the FDEM
The FDEM is a new simulation method that combines finite element and discrete element methods. As shown in Figure 6, the surrounding rock of the chamber is divided into multiple Voronoi polygons. In each Voronoi polygon, triangular finite elements are used for filling the polygon, while cohesive four-node joint elements are inserted between the Voronoi elements [19]. The stress of continuous medium is approximated using the finite element method before the material is damaged. When the material stress reaches its strength value, the crack propagation is directly reflected by the failure of the joint element. Then the friction of the fracture surface and the displacement of the fracture body are calculated by the discrete element method.
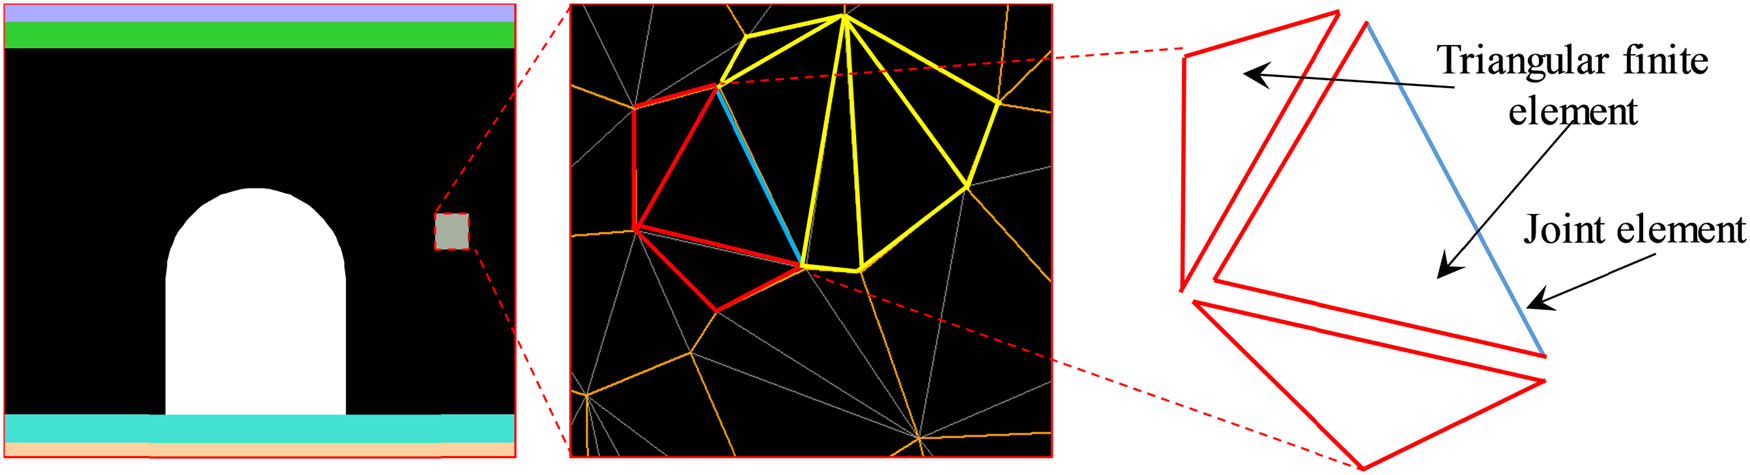
Discrete process and element composition of the FDEM.
The core theories of FDEM mainly include the motion control equations, the model of fracture propagation, the contact retrieval method, and the contact force calculation method.
4.2 Governing equations
The governing equation of the FDEM is
where M and C are nodal mass matrix and viscosity damping matrix, respectively. In addition, x is the nodal displacement vector and F is the nodal force vector. The nodal force includes the elastic deformation force of the element, the deformation force of the joint element, and the contact force between the discrete elements.
In order to simulate the kinetic energy consumption in the quasi-static process and to accelerate the convergence rate, the damping force is added. The damping matrix C of the FDEM is [20]:
where μ is the viscosity damping coefficient and I is the identity matrix. The μ in numerical simulation can speedup the convergence of numerical calculations. However, a larger value of μ will reduce the accuracy of the simulation results. The μ is usually 1.0 × 10⁻⁴–1.0 × 10⁻³. In numerical simulation, the value of μ is 5.0 × 10⁻⁴, which has been obtained through repeated debugging and comparison with the experiment test.
4.3 Model of fracture propagation
In order to simulate the fissure evolution process of the surrounding rock of the chamber, the surrounding rock is divided into Voronoi elements, as shown in Figure 7(a). The model of fracture propagation for Voronoi elements is shown in Figure 7(b) [21].
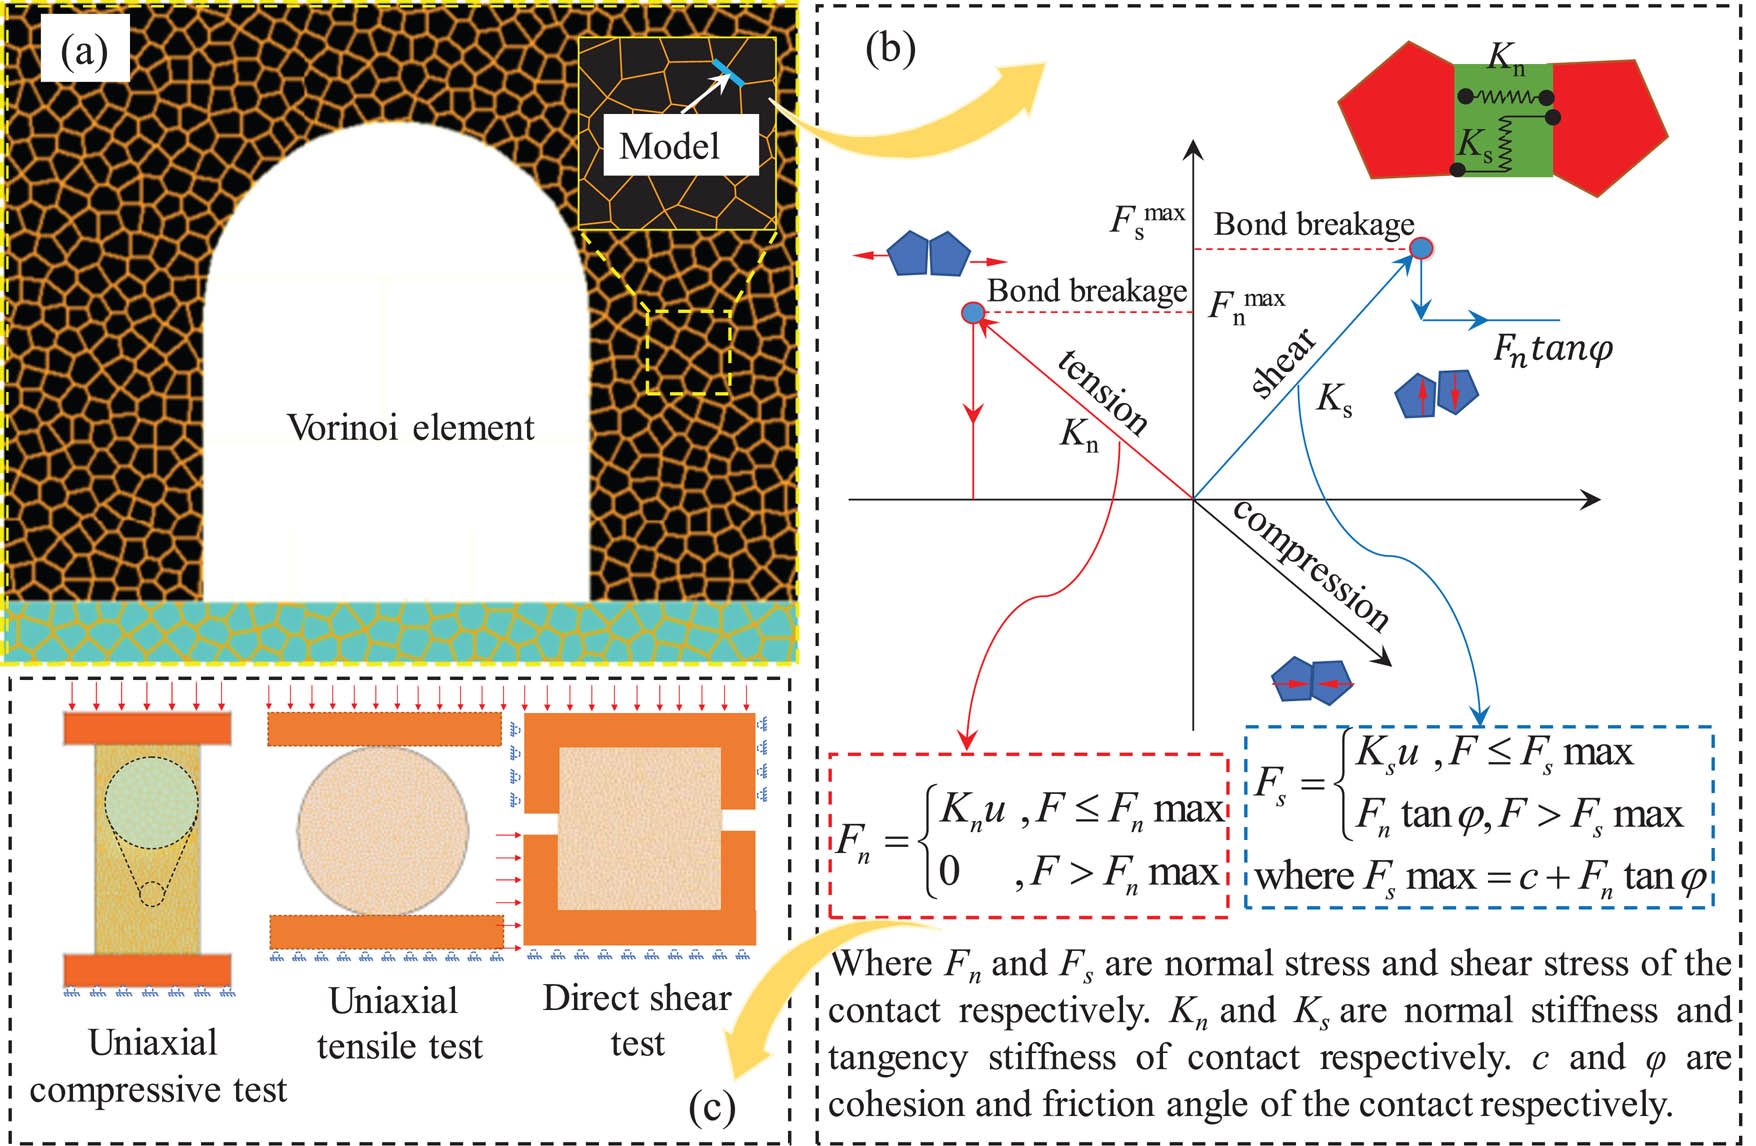
Model of fracture propagation and parameter calibration. (a) Voronoi elements for the chamber; (b) Constitutive model; (c) Tests for calibrating the parameters.
The expressions of Kn and Ks in the model have been given as follows [22,23]:
where ΔZmin is the minimum width of adjacent contact elements in the normal direction. K and G are the bulk modulus and shear modulus of the rock, respectively, the expressions of which are given as [24]:
In the above equations, E and μ are the elastic modulus and Poisson’s ratio of rock, respectively.
To further calibrate Kn and Ks, as shown in Figure 7(c), the FDEM is used to simulate uniaxial compressive, tensile, and shear tests. The stress–strain curves are obtained, which are compared with experiments to obtain more accurate Kn and Ks through multiple adjustments.
4.4 Contact retrieval method
At each time step during the simulation, the position of each element and thus their relative position need to be updated. When the FDEM simulates a non-continuous block system, the contact between the original block and the new rupture block is calculated in real time with the movement between the blocks [25]. This first requires retrieving which blocks may have contact behavior and deleting contacts that have been detached. A non-binary tree (NBS) contact search method was proposed [25]. As shown in Figure 8, the overall idea is to divide the two-dimensional computational domain into square grids of equal size and then map all the discrete elements to the corresponding grid according to their own coordinates. Then the contact search is performed within the elements in each grid and its neighboring girds [26,27]. To gain more knowledge about specific search process, the interested readers can refer to the article “Numerical comparison of some contact detection algorithms” [25].
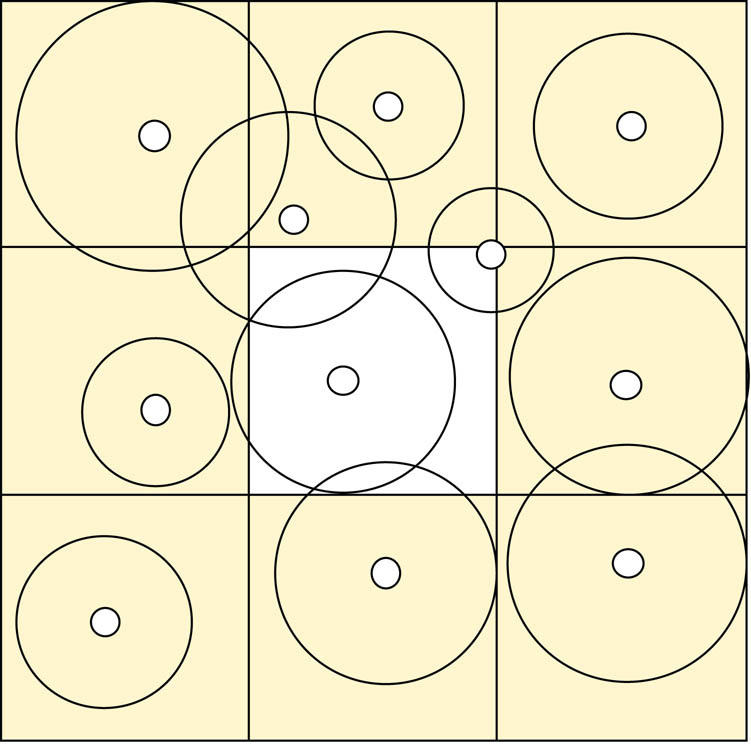
Element and grid mapping and the element contact relationship.
4.5 Contact force calculation method
The FDEM uses the penalty function method to solve the interaction force between the contact pair. The contact force calculated by the traditional penalty function method belongs to the concentrated force, which only considers the intrusive overlapping displacement of the contact pair. This method is more succinct, but it differs greatly from the real contact. In contrast, the distributed contact force is used in FDEM [28]. It uses the triangular constant strain element as the finite element, which simplifies the contact judgment of the contact pair and the deformation simulation of the element. The two elements of a contact pair are, respectively, referred to as the contact element and the target element, and their overlapping area is denoted as S. Assume that a small force on the contact element that must be produced by the target element in an infinitesimal element dA within the overlapping area equals to the difference in the potential function gradient of dA in these two elements [29], which can be expressed as [29]:
In the above equation, df is the small force produced by the infinitesimal element dA and Pc is the location of the infinitesimal element dA in the contact element. Similarly, Pt is the location of the infinitesimal element dA in the target element. φc is the potential at the midpoint of the contact element.
The total contact force can be obtained by integrating the difference in potential function gradient with the total overlapping area S such that [30]:
For more details about the calculation of Voronoi element contact force, please refer to the article “A new penalty method for nonlinear programming” [31].
5 Deformation and failure mechanism of surrounding rock of full seam chamber with extra-large section
5.1 Numerical simulation
5.1.1 Mechanical properties of stope rock
The mechanical parameters of the intact coal rock near the chamber are obtained through experiments. See Table 1 for details. Due to the large number of irregular joints and cracks in the rock, the experimentally determined rock mechanic parameters are usually higher than those of the stope rock mass. In order to further obtain the mechanical parameters of stope rock mass, the rock quality designation (RQD) value is usually used to reduce the rock strength in engineering. In other words, the elastic modulus E of the laboratory rock and the elastic modulus Em of the stope rock mass have the following relationship [32]:
Mechanical parameters of rock and stope rock mass in Tashan Coal Mine
| Lithology | Intact rock | RQD | Rock mass | ||||||
|---|---|---|---|---|---|---|---|---|---|
| E/GPa | σc/MPa | Poisson’s ratio μ | Cohesion c/MPa | Internal friction angle φ/° | Em/GPa | σcm/MPa | σtm/MPa | ||
| Medium sandstone | 45.5 | 69.4 | 0.26 | 10.5 | 23 | 90 | 26.4 | 47.4 | 4.7 |
| Sandstone | 36.2 | 23.6 | 0.32 | 8.2 | 21 | 89 | 20.1 | 15.7 | 1.6 |
| Mudstone | 15.8 | 17.4 | 0.29 | 5.5 | 19 | 57 | 2.2 | 4.4 | 0.4 |
| 3–5# coal seam | 6.8 | 13.2 | 0.26 | 6.1 | 17 | 65 | 1.4 | 4.2 | 0.4 |
| Mudstone | 15.2 | 7.2 | 0.31 | 4.3 | 19 | 63 | 2.8 | 2.2 | 0.2 |
| Coarse sand | 35.1 | 75.6 | 0.25 | 9.2 | 24 | 91 | 21.3 | 53.3 | 5.3 |
Similarly, the ratio of the compressive strength σc of the laboratory rock to the compressive strength σcm of the stope rock mass σcm/σc has the following functional relationship with Em/E [33]:
where q is the empirical parameter and is taken as 0.7 in this study [34]. The uniaxial tensile strength is approximately 0.1 times of the uniaxial compressive strength [35].
Based on the experimentally obtained rock parameters, the mechanical parameters of the stope rock mass are calculated by equations (9) and (10). See Table 1 for details.
5.1.2 Strain softening model of coal and rock
The strain softening phenomenon occurs in the coal and rock body during the compression process, that is, after the stress reaches the peak strength, the strength of the coal body rapidly drops to a lower level as the deformation continues to increase [36]. Based on compaction experiments, the strain softening model of coal can be divided into the elastic phase, softening phase, and residual stress phase [37,38], as shown in Figure 9. The residual elastic modulus, cohesion, and internal friction angle required for the strain softening model are obtained experimentally. As shown in Figure 9, the accuracy of the strain softening model is verified by comparing the uniaxial compressive stress–strain curves of the coal sample in numerical simulation and compaction experiments.
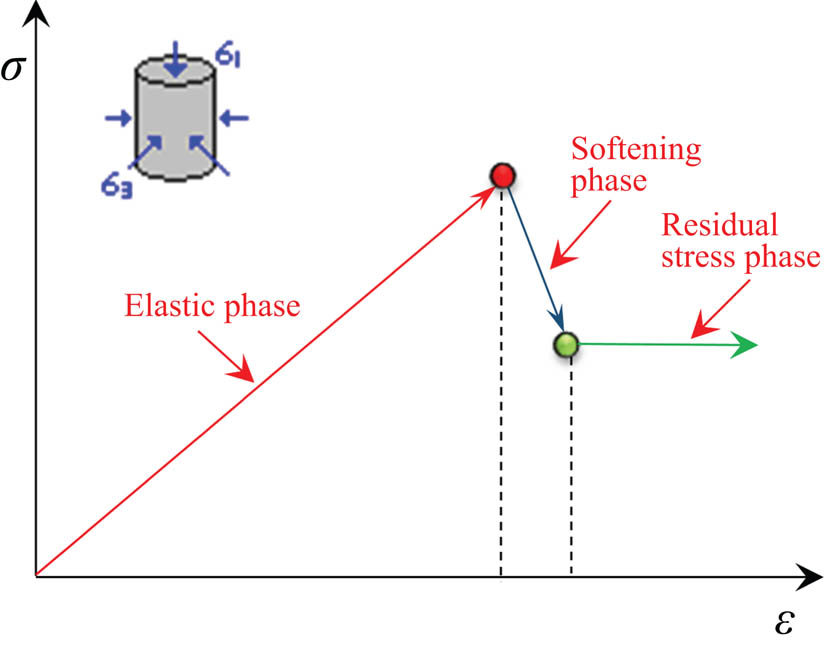
Strain softening model of coal.
5.1.3 Model establishment
The specific modeling process is as follows: as shown in Figure 10, according to the engineering background, a two-dimensional plane numerical model with a length of 150 m and a height of 54.43 m is established using the FDEM numerical method. The mesh size of the model is between 0.2 and 1.0 m [39]. The Mohr–Coulomb strain softening model is used for the coal body and rock mass. The horizontal displacement of the left and right boundaries of the model is constrained, while the vertical displacement of the bottom boundary is constrained. A uniform vertical load of 12.5 MPa is applied on the top boundary to replace the rock mass overlying 500 m [40].
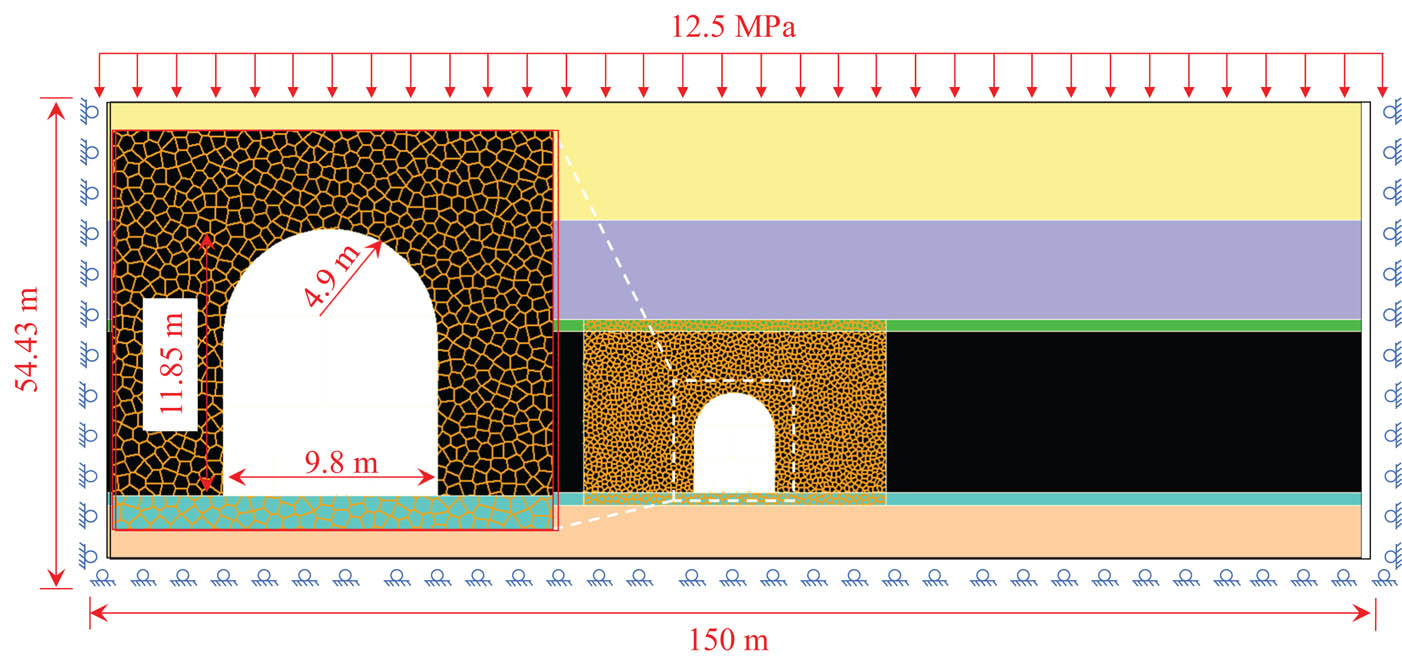
Numerical model.
5.2 Deformation and failure mechanism of surrounding rock
5.2.1 Ribs of the chamber
With the excavation of the full seam chamber with a large section, the surrounding rock of the chamber changes from the original three-direction stress state to the two-direction stress state and even a unidirectional stress state occurs. The compressive stress of the coal in the ribs of the chamber is concentrated under the effect of the floor and roof, where deformation and damage occur. It could also lead to the occurrence of rib spalling. The instability of the coal body in the coal roadway ribs will lead to an increase in the actual suspended area of the roof, which increases the probability of roof failure in the roadway. At the same time, the roadway rib spalling will also hurt the staff and damage the underground equipment.
In order to further reveal the deformation and failure mechanism of the surrounding rock in the chamber ribs, the crack development in the local position of the chamber ribs is extracted as shown in Figure 11.
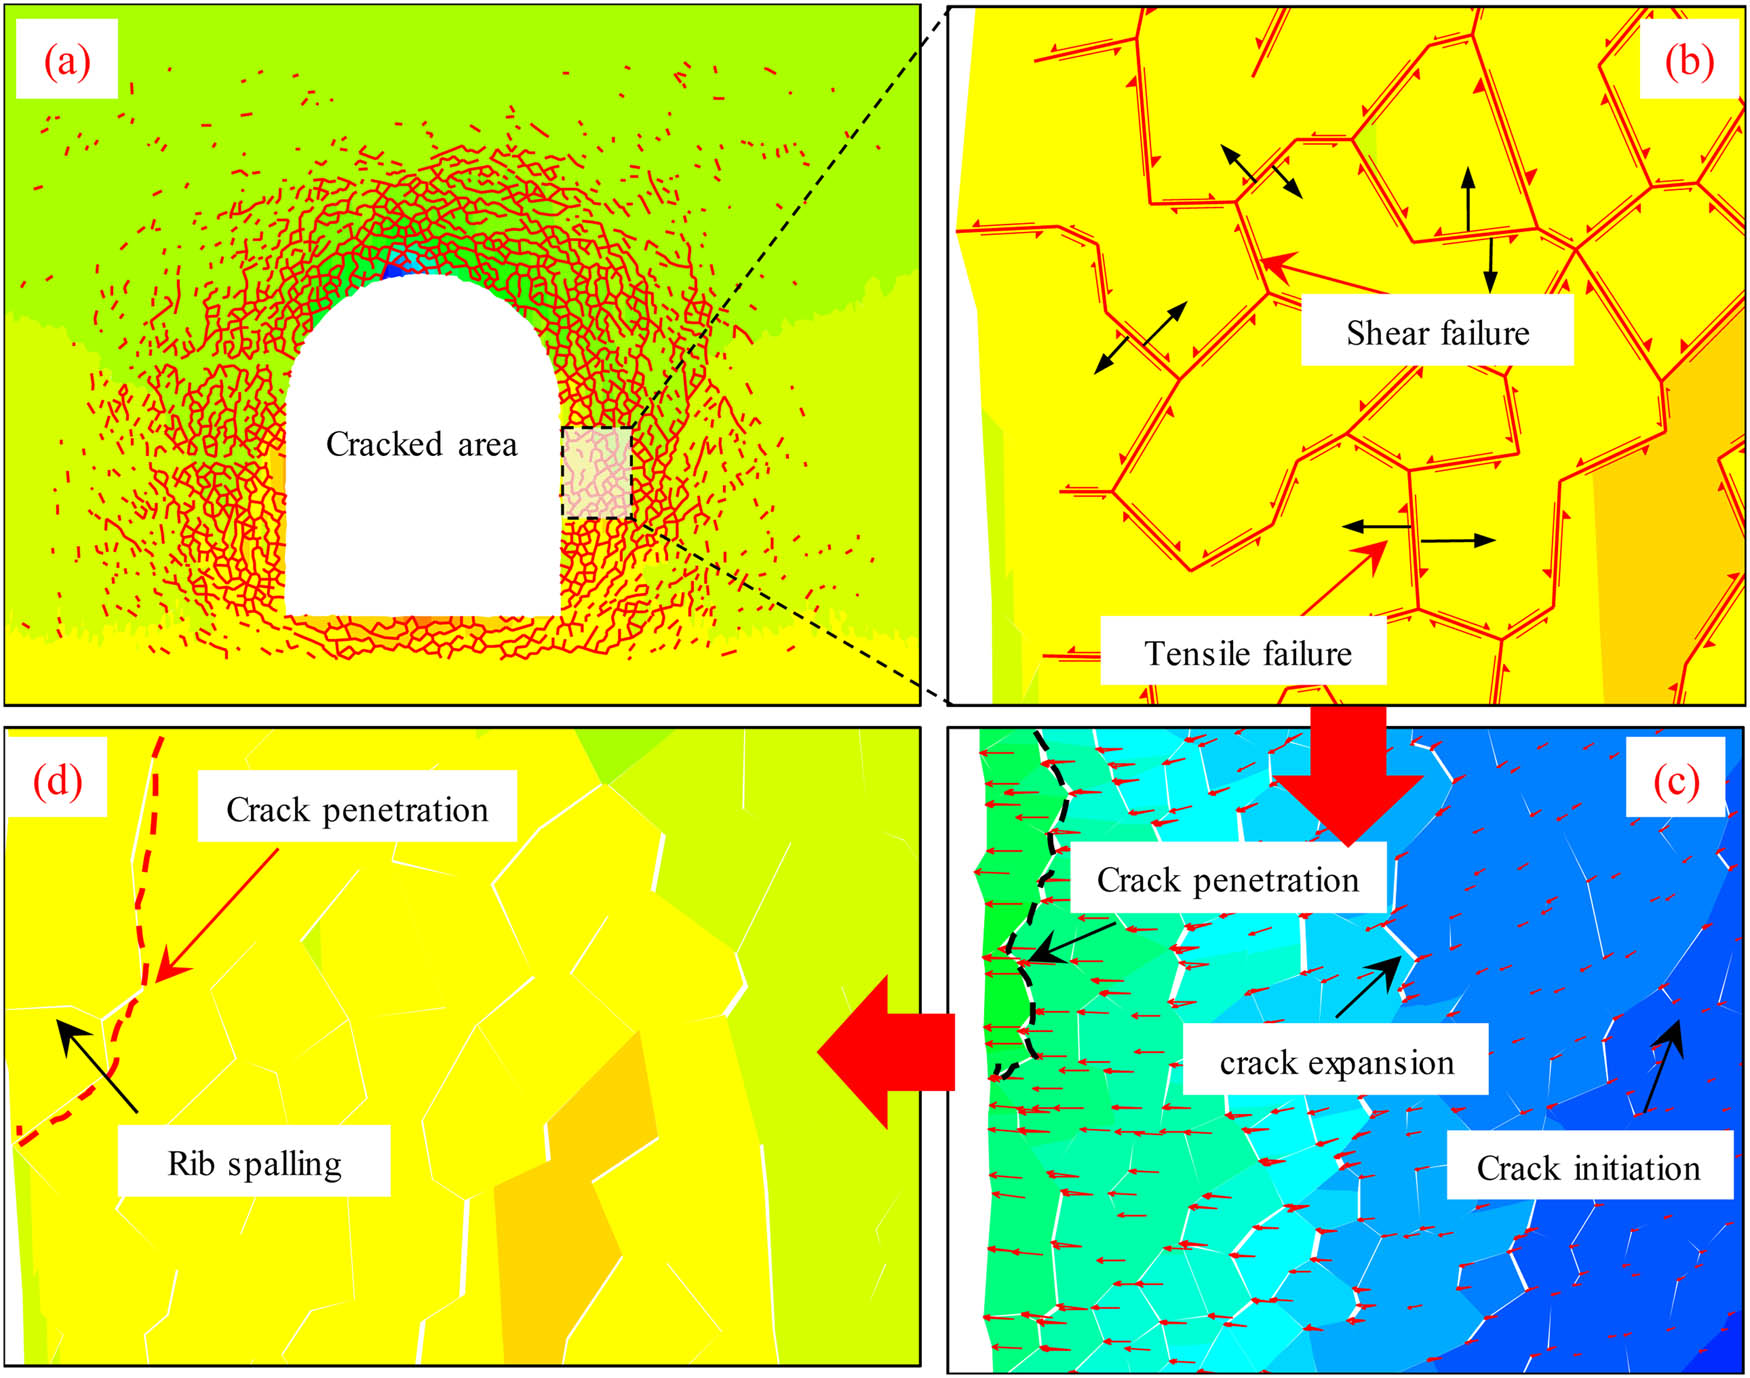
Rib spalling mechanism in the two ribs. (a) Cracks in the ribs; (b) Failure model; (c) Development characteristics of the cracks; (d) Rib spalling.
As shown in Figure 11(a), many cracks are generated in the chamber ribs under the effect of mine pressure and excavation disturbance. As shown in Figure 11(b), the main cause of the crack is that the shear stress on the rib exceeds its shear strength and thus shear failure occurs. Compared with the shear failure, the tensile failure is relatively less. As shown in Figure 11(c), under the effect of mine pressure, the cracks generated in the failure chamber ribs further expand and penetrate each other and finally connect with the free surface of the coal wall. As shown in Figure 11(d), under the effect of lateral stress, the coal body is separated from the ribs, leading to the occurrence of rib spalling.
Based on the crack development in the chamber ribs, the mechanism of rib spalling in chamber ribs is as follows: after the excavation of the chamber, under the effect of mine pressure and excavation disturbance, many shear failures are produced in the surrounding rock of the ribs, which leads to the formation of a large number of cracks. The cracks then further develop, expand, and penetrate. When the crack is connected to the surface of the ribs, under the effect of the lateral pressing force, the coal body is separated from the ribs and thus rib spalling occurs.
5.2.2 Roof of the chamber
The destruction and instability of the chamber roof generally involve no precursor. Once the roof failure occurs, it is often sudden, and in most cases the failed roof has a large area, which can greatly harm the safety of equipment and personnel. Revealing the deformation and failure mechanism of the chamber roof can provide a theoretical basis for the prediction and control of roof leakage.
In order to further reveal the mechanism of crack development in the roof area, as shown in Figure 12, the process of the roof separation in the chamber is analyzed.
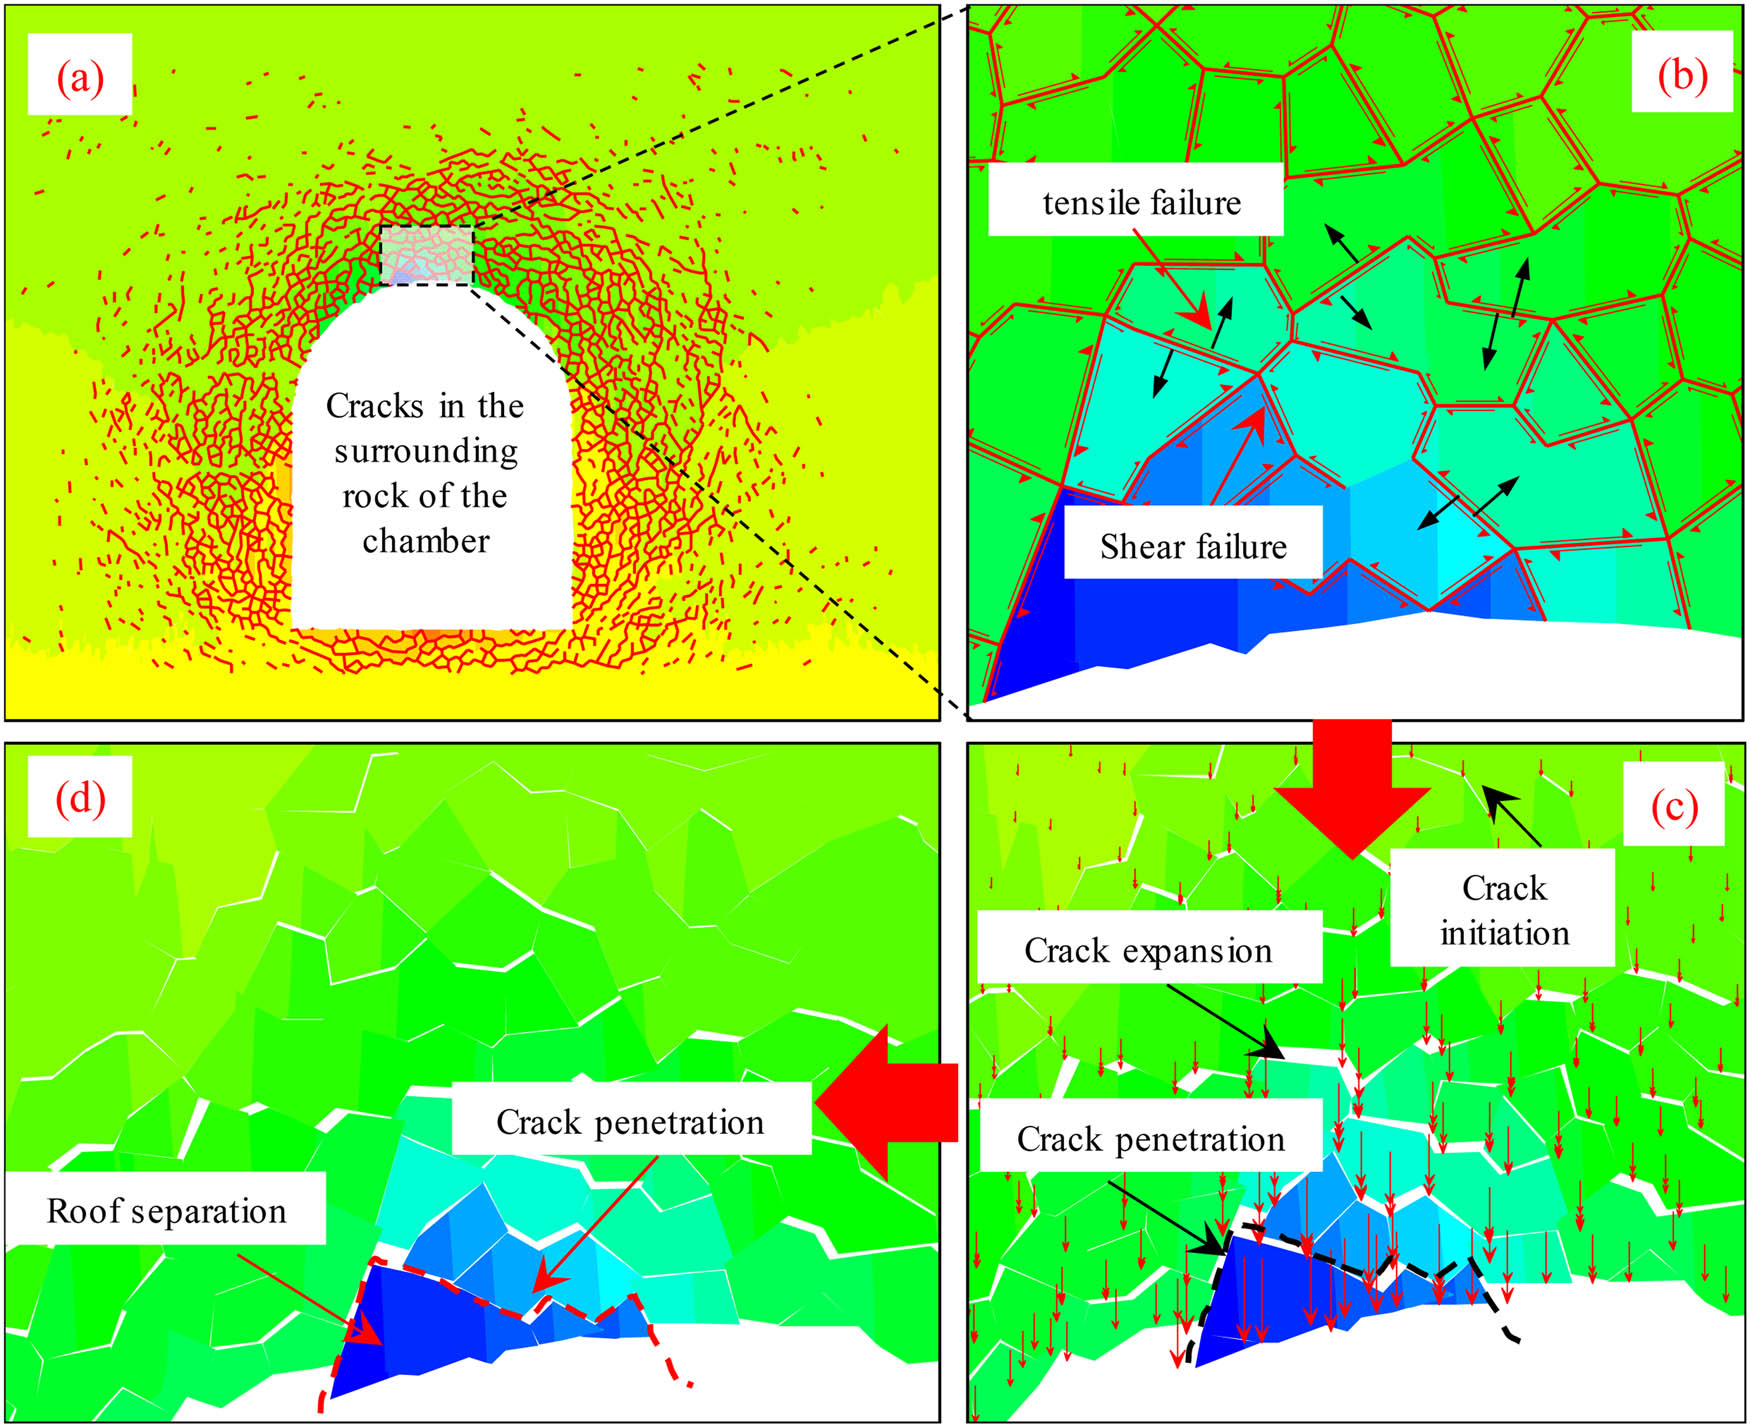
Mechanism of roof separation. (a) Cracks in the roof; (b) Failure model; (c) Development characteristics of the cracks; (d) Rib separation.
As shown in Figure 12(a), many cracks are produced in the chamber roof under the effect of mine pressure and excavation disturbance. As shown in Figure 12(b), the main cause of crack development is also the shear stress on the roof exceeding its shear strength, which leads to shear failure. Compared with shear failure, tensile failure generates relatively less cracks. As shown in Figure 12(c), after the internal cracks of the roof are initiated, they are further expanded under the effect of mine pressure. As a result, they penetrate each other and are finally connected to the roof surface. As shown in Figure 12(d), the tensile strength and cohesion of the surrounding rock in the crack zone of the roof are drastically reduced. Under the effect of mine pressure and self-weight, the coal body is separated from the dome, leading to the occurrence of roof leakage.
Based on the evolution law for cracks in the roof, the mechanism of roof separation in the chamber is as follows: after the excavation of the chamber, under the effect of mine pressure and excavation disturbance, many shear failures are produced in the roof of the surrounding rock, which leads to the formation of cracks. The cracks further develop, expand, and penetrate. When the crack is connected to the roof surface, under the effect of mine pressure and self-weight, the coal body is separated from the roof and thus roof leakage occurs.
6 Control method for the surrounding rock based on crack development characteristics
It can be seen from the deformation and failure mechanism of the chamber with large section that the cause of the surrounding rock failure is mainly shear failure. Therefore, improving the shear strength of the surrounding rock and inhibiting the penetration of cracks are the main ways to control the deformation and failure of the surrounding rock of the chamber. After the excavation of the chamber, the stress of the surrounding rock is released. It is more effective for controlling the deformation and destruction of the surrounding rock of the chamber via increasing the shear strength of the surrounding rock and inhibiting crack penetration. At present, the main reinforcement methods for the broken surrounding rock include grouting reinforcement, high-strength anchor bolt, and anchor cable. Under the effect of the pumping pressure, the slurry can penetrate, fill and close the cracks in the surrounding rock, improve the integrity of the surrounding rock mass, and thus increase the shear strength of the surrounding rock. On the other hand, the action of the anchor on the surrounding rock can improve the shear strength of the fracture surface of the surrounding rock [41,42].
6.1 Anchor bolt and anchor cable parameters
The selection of anchor bolt and anchor cable parameters is the core problem of support, which includes the spacing, length, and pre-tightening force of anchor bolt and anchor cable. Reasonable anchor bolt and anchor cable parameters can inhibit the shear failure of the chamber surrounding the rock and avoid the mutual penetration of the cracks. Taking the spacing between anchor bolts as an example, numerical simulation is used to study the development of shear failure cracks in the surrounding rock of the chamber when the spacing is 1.5, 1.2, 0.9, and 0.6 m. The results are shown in Figure 13.
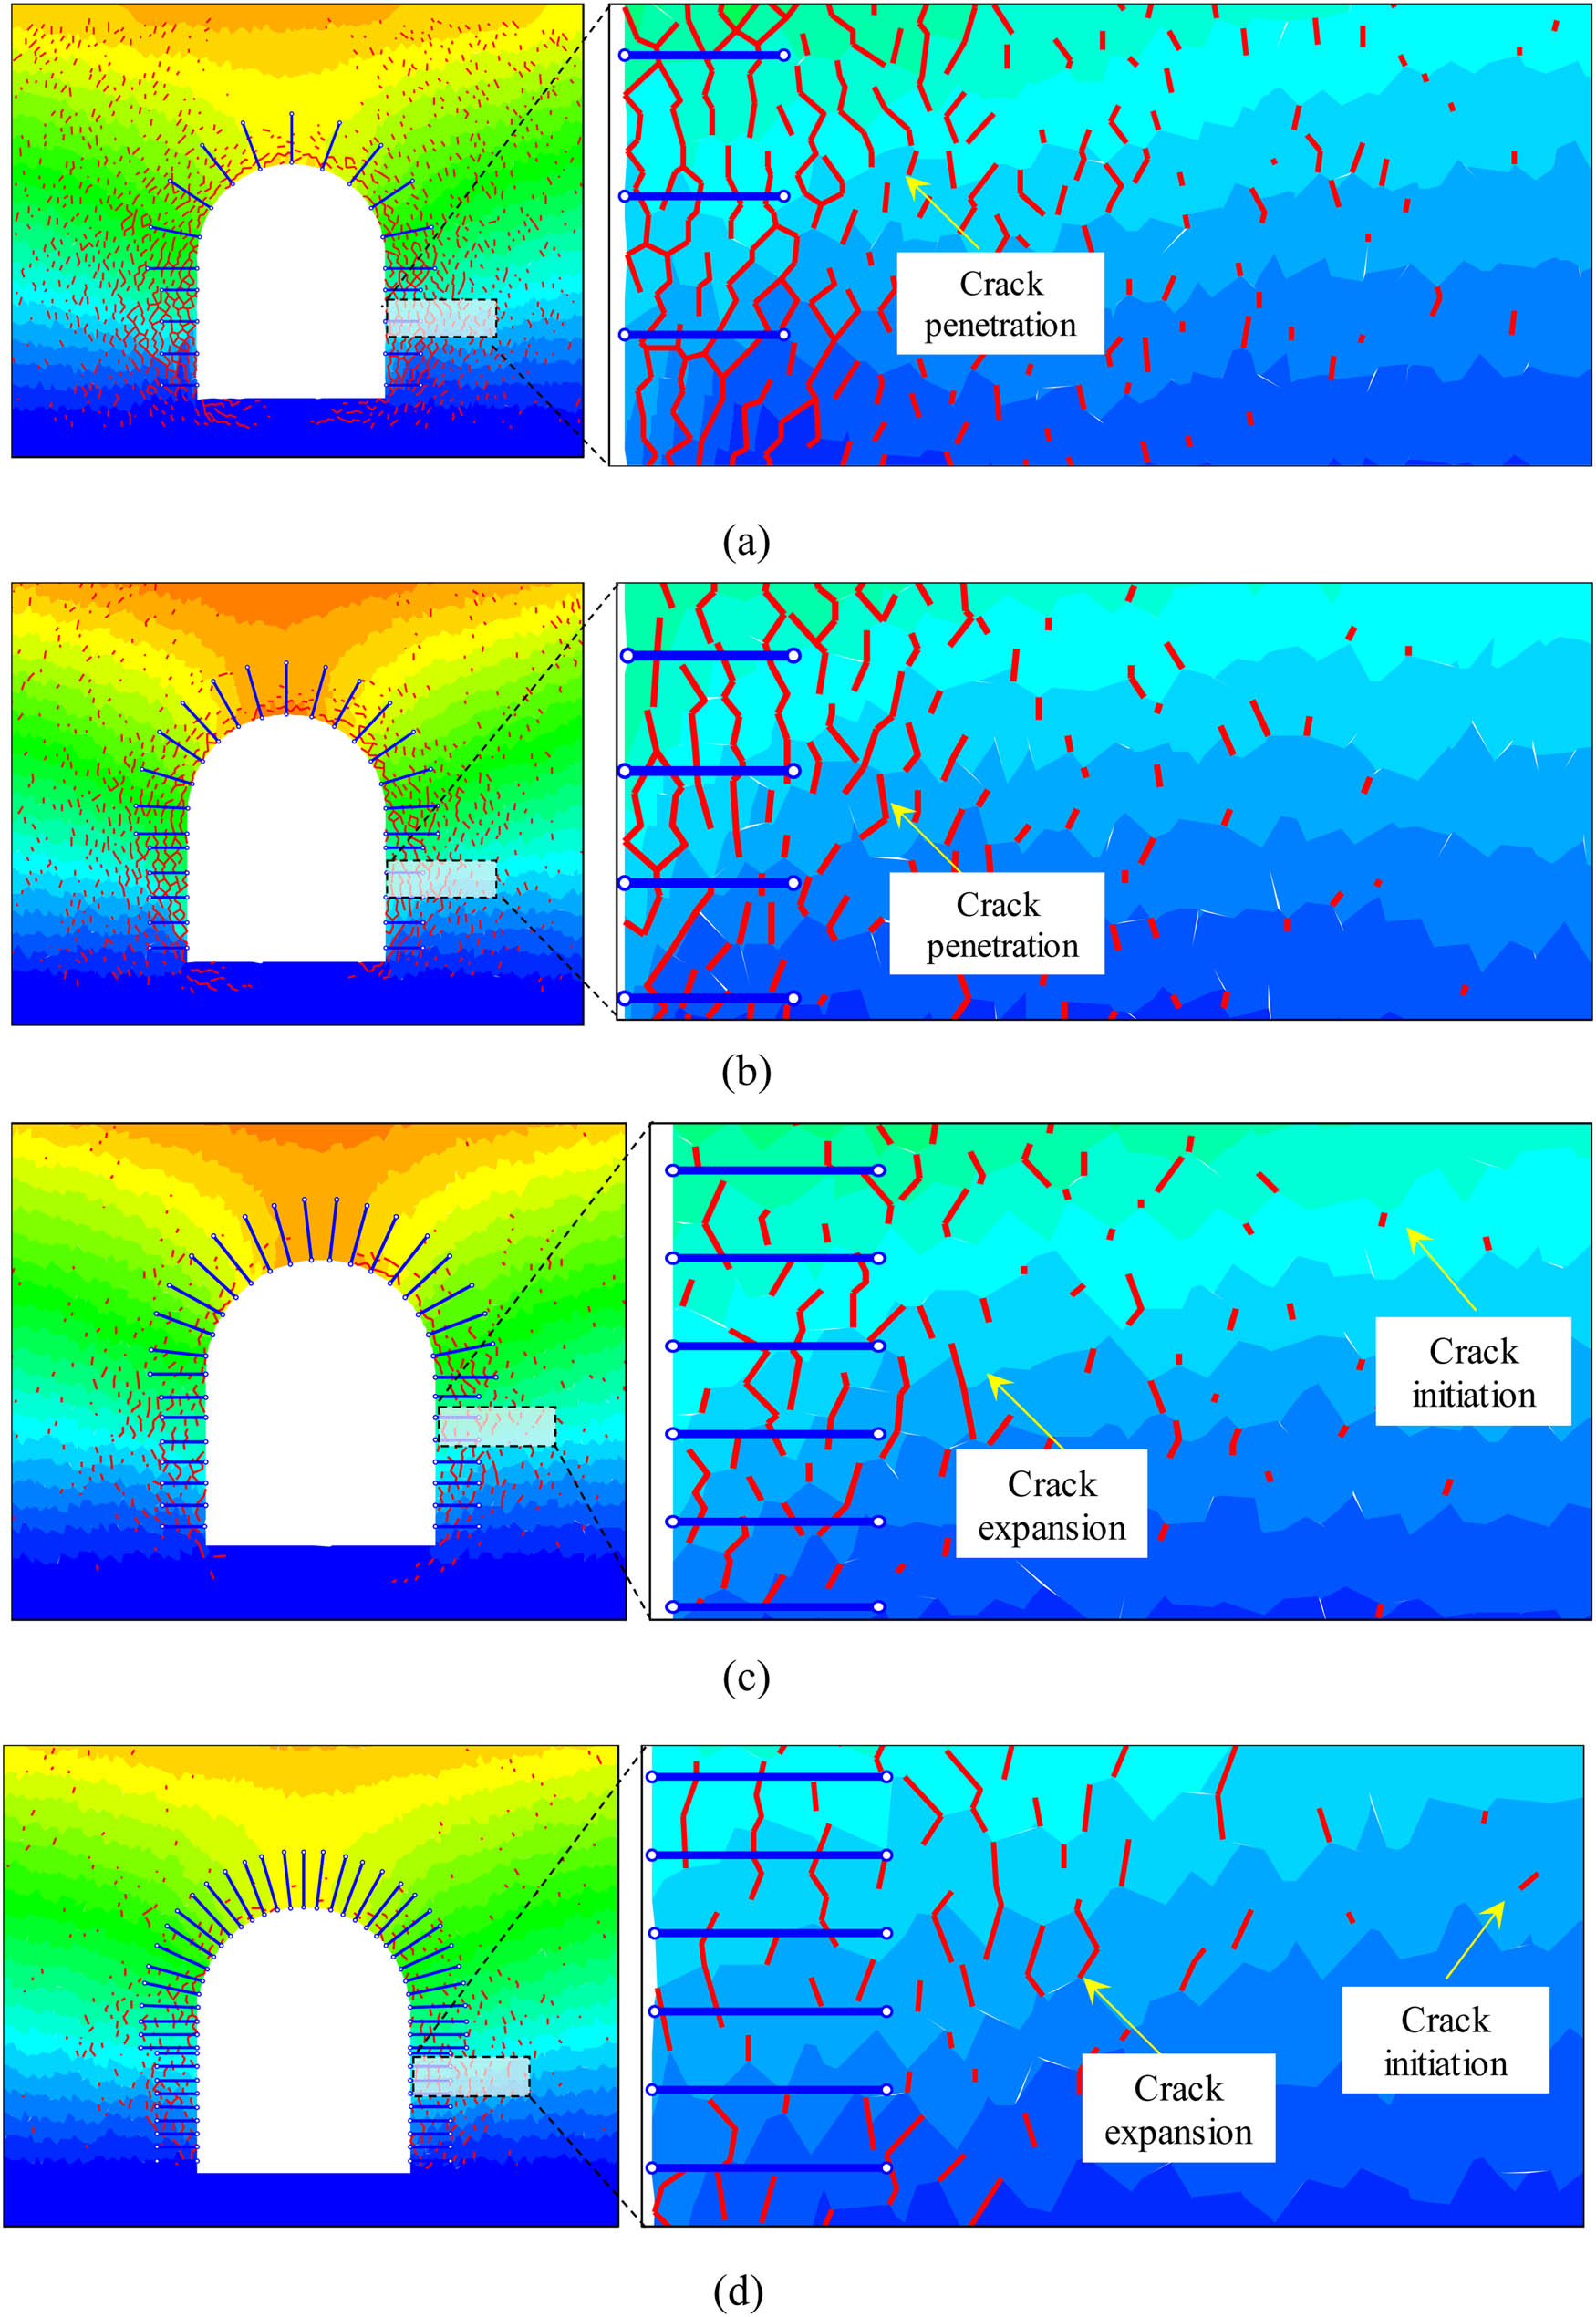
Effect of bolt spacing on cracks in the surrounding rock of the chamber. (a) 1.5 m; (b) 1.2 m; (c) 0.9 m; (d) 0.6 m.
It can be seen from Figure 13 that when the spacing between the anchor bolts is 1.5 and 1.2 m, many cracks can be observed in the surrounding rock of the chamber. The cracks initiate, develop, and penetrate each other. For these cases, the surrounding rock is seriously damaged. When the bolt spacing is 0.9 m, the shear cracks of the surrounding rock of the chamber are obviously reduced. The cracks only initiate and develop. Therefore, there is basically no penetration between them. For this case, the shear failure of the chamber surrounding the rock is relatively less. The deformation and failure of the surrounding rock are well controlled. When the bolt spacing is reduced to 0.6 m, the cracks in the surrounding rock of the chamber do not change much, basically similar to the case with a spacing of 0.9 m.
Based on the above rules, when the bolt spacing is 0.9 m, the cracks generated by the shearing of the surrounding rock of the chamber are well controlled. As a result, the deformation and failure of the surrounding rock are not obvious. Therefore, the spacing of the bolts is determined to be 0.9 m.
Similar methods are used to study other parameters of anchor bolt and anchor cable. The final optimized support parameters are as follows: The bolt spacing of is 900 mm × 900 mm, pre-tightening force is 100 kN. The length of dome anchor cable is 2,500 mm, while the length of the rib anchor cable is 1,800 mm. The cable spacing is 2,700 × 1,800 mm. Its pre-tightening force and length are 150 kN and 8,300 mm, respectively.
6.2 Grouting parameters
Many factors affect grouting, such as the grouting pressure, the mechanical properties of the surrounding rock, the degree of crack development, the flow kinetic parameters of the slurry, and the initial setting time. Therefore, a numerical simulation method was adapted. After grouting, the grouting range of the surrounding rock of the chamber is shown in Figure 14.
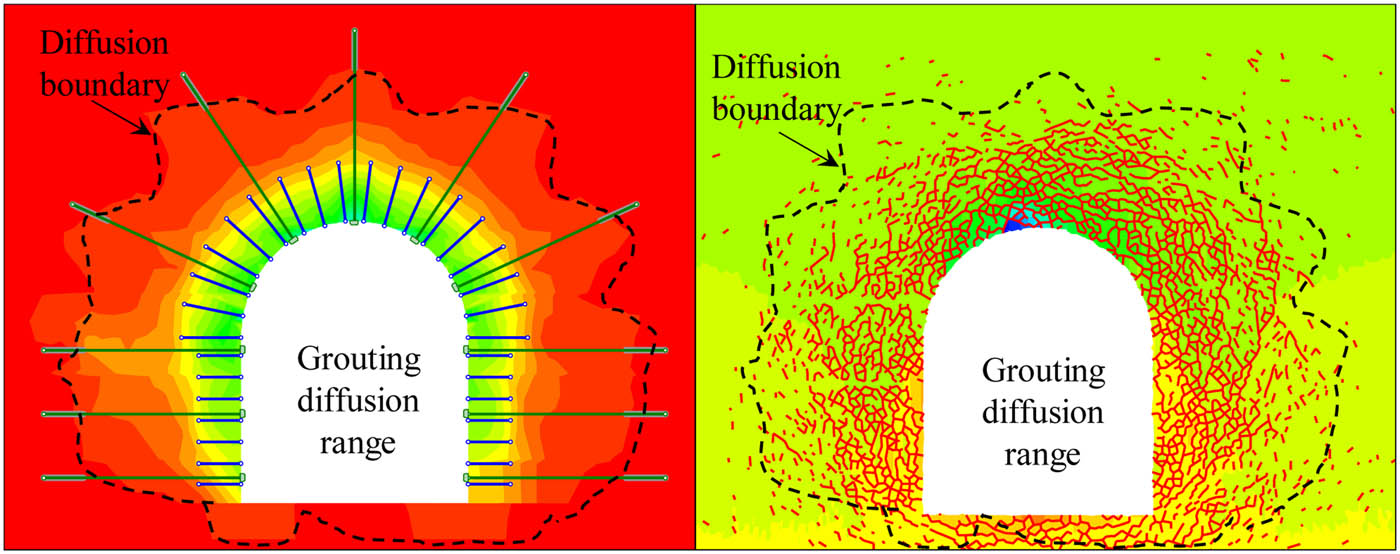
Grouting diffusion range.
It can be seen from Figure 14 that the slurry diffusion range basically covers the crack development area of the surrounding rock of the chamber. Therefore, grouting achieved its expected effect.
Figure 15 further shows the crack development of the surrounding rock of the chamber after grouting. It shows that after grouting, the number of cracks in the roof and the ribs of the chamber are obviously reduced. Also, the cracks only exist in the initiation and development stages, and no mutual penetration is observed. This indicates that grouting reinforcement improves the shear strength of the surrounding rock and effectively suppresses the occurrence of cracks in the surrounding rock.
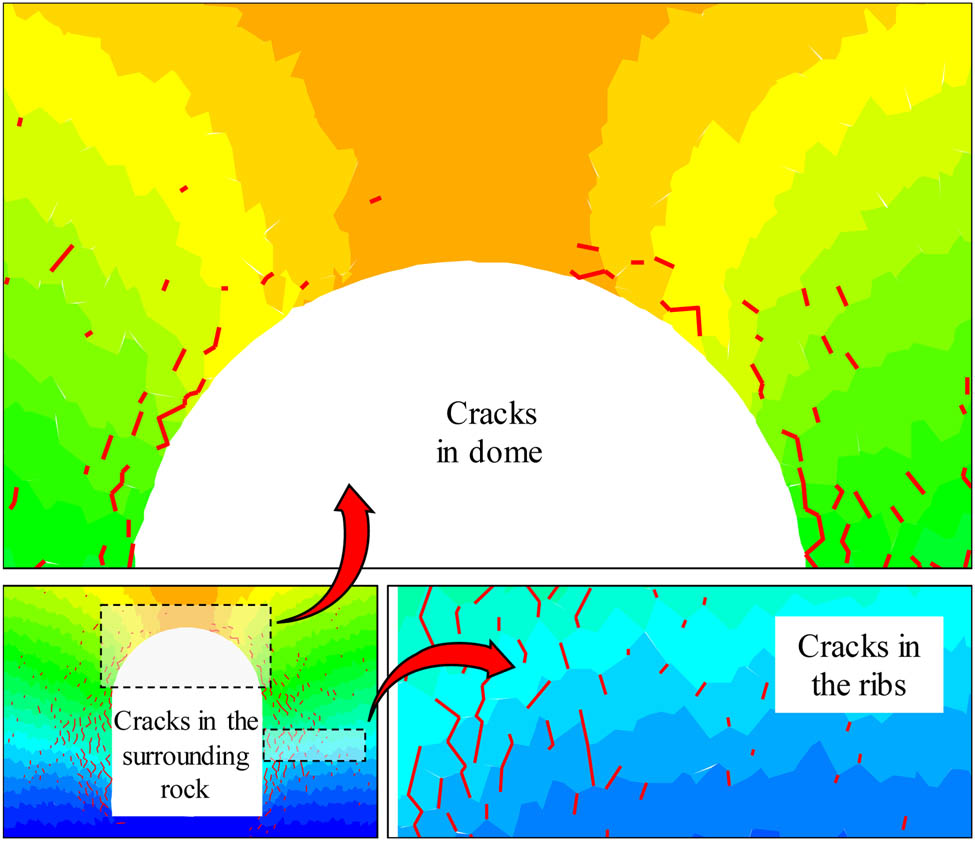
Development of cracks in the surrounding rock of the chamber after grouting.
7 Engineering applications
7.1 Chamber support scheme
According to the above analysis, the grouting pipe is used for grouting with a grouting pressure of 5 MPa. After grouting, the anchor bolt and cable support are carried out. The specific support parameters are as follows:
Dome support: the anchor bolt body consists of a left-handed steel without longitudinal reinforcement, with a yield strength of 600 MPa, a tensile strength of 800 MPa, a diameter of 22 mm, and a length of 2,500 mm. The bolt spacing is 900 mm × 900 mm. The anchorage is lengthened by resin and the bolt pre-tightening force is 100 kN. The tray is made of high-strength tray, the measures of which are 200 mm × 200 mm × 10 mm. A total of five anchor cables are involved, with a diameter of 17.8 mm, a length of 8,300 mm, a spacing of 2,700 × 1,600 mm, and a pre-tightening force of 150 kN. The anchoring length is 1,500 mm. Three resin rolls are used. The specification of one of the resin rolls is K2335, while the specification of the other two is Z2360. The W-shaped steel strip has a thickness of 4 mm and a width of 250 mm. Rib support: The anchoring length is 1,800 mm. Two resin rolls are used, whose specifications are K2335 and Z2360. Other parameters are the same as the dome. The mechanical parameters of anchor cable are shown in Table 2.
Mechanical properties of the supporting materials
| Properties | Values |
|---|---|
| Bolt/anchor cable | |
| Elastic modulus, GPa | 210 |
| Yield strength, kN | 250/470 |
| Pretightening force, kN | 100/150 |
| Resin roll stiffness, N/m/m | 2e9 |
| Resin roll cohesive force | 4e5 |
| W-shaped steel strip and metal mesh | |
| Elastic modulus, GPa | 210 |
| Tensile strength, MPa | 500 |
| Compressive strength, MPa | 500 |
| Normal contact stiffness, GPa/m | 10 |
| Contact shear stiffness, GPa/m | 10 |
7.2 Field measurement of chamber deformation
The deformation of the surrounding rock of the chamber is monitored using the cross method [43]. As shown in Figure 16, four measuring points are arranged in the surrounding rock of the chamber, which are located at the two ribs, the dome, and the roof, respectively [44,45]. The monitoring results provide the magnitudes of the rib convergence and the roof-to-floor convergence.
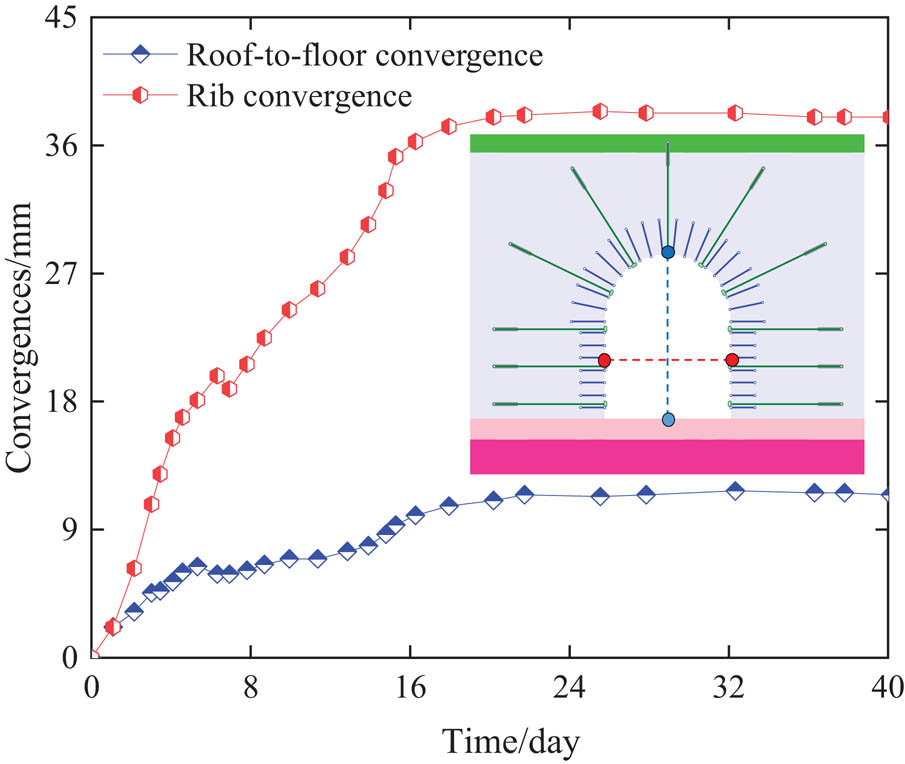
Deformation of the surrounding rock of the chamber.
It can be seen from Figure 16 that during the period of 0–16 days of support, the magnitudes of the rib convergence and the roof-to-floor convergence are increasing but the rate of increase is decreasing. After 16 days of support, the deformation of the surrounding rock of the chamber remained basically the same, with the magnitudes of the rib convergence and the roof-to-floor convergence stabled at 12 and 38 mm, respectively.
Hence, based on the above discussion on deformation, it is concluded that the deformation and failure of the surrounding rock of the chamber is well controlled.
8 Conclusion
Through uniaxial compression experiments and numerical calculations, the law of crack development and evolution during the compression process of coal samples were revealed. It was concluded that shear failure is one of the causes of cracks , which mainly occur in the elastic phase.
The cracks generated in the surrounding rock of chamber are mainly caused by shear failure, while the tensile failure produces relatively few cracks. The roof separation and rib lateral displacement of the surrounding rock of chamber are closely related to the crack development. Both are mainly caused by the development and eventually the penetration of the cracks.
After the excavation of the chamber, the effect of the mine pressure and excavation disturbance causes many shearing damage to the ribs and the roof. As a result, many cracks are formed. The cracks further extend, expand, and penetrate with each other. When the crack is connected to the surface of the chamber, under the effect of the mining pressure, the coal body is separated from the surface of the chamber, leading to the occurrence of rib spalling and roof leakage.
Based on the failure mechanism of the surrounding rock in the chamber, a support method combining grouting and high-strength anchor bolt and cable was proposed to improve the shear strength of the surrounding rock, which helped to reduce the occurrence of cracks and inhibit the cracks from interpenetrating. Also, an industrial test was carried out in the chamber of Tashan Coal Mine, which showed that deformation and damage of the surrounding rock of the chamber is well controlled.
Acknowledgments
This work was supported by the State Key Research Development Program of China (2018YFC0604500) and National Natural Science Foundation of China (51604262). The authors gratefully acknowledge the financial support from the organization.
References
[1] Li Z, Xu JL, Yu SC, Ju JF, Xu JM. Mechanism and prevention of a chock support failure in the longwall top-coal caving faces: a case study in Datong Coalfield, China. Energies. 2018;11:288.10.3390/en11020288Search in Google Scholar
[2] Simsir F, Ozfirat MK. Determination of the most effective longwall equipment combination in longwall top coal caving (LTCC) method by simulation modelling. Int J Rock Mech Mining Sci. 2008;45:1015–23.10.1016/j.ijrmms.2007.11.005Search in Google Scholar
[3] Wang JC, Yang SL, Li Y, Wei LK, Liu HH. Caving mechanisms of loose top-coal in longwall top-coal caving mining method. Int J Rock Mech Mining Sci. 2014;71:160–70.10.1016/j.ijrmms.2014.04.024Search in Google Scholar
[4] Yasitli NE, Unver B. 3D numerical modeling of longwall mining with top-coal caving. Int J Rock Mech Mining Sci. 2005;42:219–35.10.1016/j.ijrmms.2004.08.007Search in Google Scholar
[5] Zhang Z, Bai J, Chen Y, Yan S. An innovative approach for gob-side entry retaining in highly gassy fully-mechanized longwall top-coal caving. Int J Rock Mech Mining Sci. 2015;80:1–11.10.1016/j.ijrmms.2015.09.001Search in Google Scholar
[6] Li Z, Hua X, Zhu R, Zhou D. Numerical simulation of strata behavior in super-long and large mining height working face. In: Zeng JM, Zhu HX, Kong JY, editors. Advances in Chemical, Material and Metallurgical Engineering, Pts 1–5. Berne, Switzerland: Trans Tech Publications Ltd; 2013. p. 3428–32.10.4028/www.scientific.net/AMR.634-638.3428Search in Google Scholar
[7] Coggan J, Gao FQ, Stead D, Elmo D. Numerical modelling of the effects of weak immediate roof lithology on coal mine roadway stability. Int J Coal Geol. 2012;90:100–9.10.1016/j.coal.2011.11.003Search in Google Scholar
[8] Chen Y, Ma S, Yu Y. Stability control of underground roadways subjected to stresses caused by extraction of a 10-m-thick coal seam: a case study. Rock Mech Rock Eng. 2017;50:2511–20.10.1007/s00603-017-1217-zSearch in Google Scholar
[9] Tonon F. ADECO full-face tunnel excavation of two 260 m2 tubes in clays with sub-horizontal jet-grouting under minimal urban cover. Tunnell Underground Space Technol. 2011;26:253–66.10.1016/j.tust.2010.09.006Search in Google Scholar
[10] Zheng X, Feng X, Zhang N, Gong L, Hua J. Serial decoupling of bolts in coal mine roadway supports. Arab J Geosci. 2014;8:6709–22.10.1007/s12517-014-1697-zSearch in Google Scholar
[11] Xiong D, Jiang Y, Zeng Q, Xian X. Three-dimensional numeral analysis on the stability of surrounding rock in large section underground chamber construction. Berne, Switzerland: Trans Tech Publications Ltd; 2007.Search in Google Scholar
[12] Zhang B, Zhao W, Wang W, Zhang X. Pressure characteristics and dynamic response of coal mine refuge chamber with underground gas explosion. J Loss Prevent Proc. 2014;30:37–46.10.1016/j.jlp.2014.03.009Search in Google Scholar
[13] Zhai X, Huang G, Chen C, Li R. Combined supporting technology with Bolt-Grouting and floor pressure-relief for deep chamber: an underground coal mine case study. Energies. 2018;11:67.10.3390/en11010067Search in Google Scholar
[14] Islam MR, Shinjo R. Numerical simulation of stress distributions and displacements around an entry roadway with igneous intrusion and potential sources of seam gas emission of the Barapukuria coal mine, NW Bangladesh. Int J Coal Geol. 2009;78:249–62.10.1016/j.coal.2009.03.001Search in Google Scholar
[15] Yan H, He FL, Yang T, Li LY, Zhang SB, Zhang JX. The mechanism of bedding separation in roof strata overlying a roadway within a thick coal seam: a case study from the Pingshuo Coalfield, China. Eng Fail Anal. 2016;62:75–92.10.1016/j.engfailanal.2015.12.006Search in Google Scholar
[16] Jiang L, Mitri HS, Ma N, Zhao X. Effect of foundation rigidity on stratified roadway roof stability in underground coal mines. Arab J Geosci. 2015;9:32.10.1007/s12517-015-2033-ySearch in Google Scholar
[17] Tutluoğlu L, Öge İF, Karpuz C. Relationship between pre-failure and post-failure mechanical properties of rock material of different origin. Rock Mech Rock Eng. 2014;48:121–41.10.1007/s00603-014-0549-1Search in Google Scholar
[18] Feng F, Chen S, Li D, Hu S, Huang W, Li B. Analysis of fractures of a hard rock specimen via unloading of central hole with different sectional shapes. Energy Sci Eng. 2019;7:2265–86.10.1002/ese3.432Search in Google Scholar
[19] Boaga J. The use of FDEM in hydrogeophysics: a review. J Appl Geophys. 2017;139:36–46.10.1016/j.jappgeo.2017.02.011Search in Google Scholar
[20] Havaej M, Stead D, Eberhardt E, Fisher BR. Characterization of bi-planar and ploughing failure mechanisms in footwall slopes using numerical modelling. Eng Geol. 2014;178:109–20.10.1016/j.enggeo.2014.06.003Search in Google Scholar
[21] Gao FQ, Stead D, Elmo D. Numerical simulation of microstructure of brittle rock using a grain-breakable distinct element grain-based model. Comput Geotech. 2016;78:203–17.10.1016/j.compgeo.2016.05.019Search in Google Scholar
[22] Gao F, Kang H, Wu Y. Experimental and numerical study on the effect of calcite on the mechanical behaviour of coal. Int J Coal Geol. 2016;158:119–28.10.1016/j.coal.2016.03.008Search in Google Scholar
[23] Bai QS, Tu SH, Zhang C. DEM investigation of the fracture mechanism of rock disc containing hole(s) and its influence on tensile strength. Theor Appl Fract Mech. 2016;86:197–216.10.1016/j.tafmec.2016.07.005Search in Google Scholar
[24] Yao QL, Li XH, Sun BY, et al. Numerical investigation of the effects of coal seam dip angle on coal wall stability. Int J Rock Mech Mining Sci. 2017;100:298–309.10.1016/j.ijrmms.2017.10.002Search in Google Scholar
[25] D’Albano GGS, Lukas T, Su F, Korakianitis T, Munjiza A. Numerical comparison of some contact detection algorithms. Eng Comput. 2017;34:832–51.10.1108/EC-01-2016-0047Search in Google Scholar
[26] Yan CZ, Zheng H. A new potential function for the calculation of contact forces in the combined finite-discrete element method. Int J Numer Anal Methods Geomech. 2017;41:265–83.10.1002/nag.2559Search in Google Scholar
[27] Johnson SM, Williams JR, Cook BK. Quaternion-based rigid body rotation integration algorithms for use in particle methods. Int J Numer Methods Eng. 2008;74:1303–13.10.1002/nme.2210Search in Google Scholar
[28] Nie PY. A new semi-penalty method for nonlinear programming. Appl Math Comput. 2004;158:547–60.10.1016/j.amc.2003.09.012Search in Google Scholar
[29] Antczak T. Vector exponential penalty function method for nondifferentiable multiobjective programming problems. Bull Malaysian Math Sci Soc. 2018;41:657–86.10.1007/s40840-016-0340-4Search in Google Scholar
[30] Borggaard J, Iliescu T, Roop JP. An improved penalty method for power-law Stokes problems. J Comput Appl Math. 2009;223:646–58.10.1016/j.cam.2008.02.002Search in Google Scholar
[31] Nie P-Y. A new penalty method for nonlinear programming. Comput Math Appl. 2006;52:883–96.10.1016/j.camwa.2006.05.012Search in Google Scholar
[32] Bai QS, Tu SH, Chen M, Zhang C. Numerical modeling of coal wall spall in a longwall face. Int J Rock Mech Mining Sci. 2016;88:242–53.10.1016/j.ijrmms.2016.07.031Search in Google Scholar
[33] Shabanimashcool M, Li CC. Numerical modelling of longwall mining and stability analysis of the gates in a coal mine. Int J Rock Mech Mining Sci. 2012;51:24–34.10.1016/j.ijrmms.2012.02.002Search in Google Scholar
[34] Ju MH, Li XH, Yao QL, Li DW, Chong ZH, Zhou J. Numerical investigation into effect of rear barrier pillar on stress distribution around a longwall face. J Cent South Univ. 2015;22:4372–84.10.1007/s11771-015-2986-8Search in Google Scholar
[35] Yang X, Wang E, Wang Y, Gao Y, Wang P. A study of the large deformation mechanism and control techniques for deep soft rock roadways. Sustainability. 2018;10:1100.10.3390/su10041100Search in Google Scholar
[36] Pan Y, Wang X, Li Z. Analysis of the strain softening size effect for rock specimens based on shear strain gradient plasticity theory. Int J Rock Mech Mining Sci. 2002;39:801–5.10.1016/S1365-1609(02)00031-XSearch in Google Scholar
[37] Purwodihardjo A, Cambou B. Effect of strain-softening on settlement due to tunnelling in soft soil. In: Rosenbaum MS, Turner AK, editors. New paradigms in subsurface prediction: characterization of the shallow subsurface implications for urban infrastructure and environmental assessment. Berne, Switzerland: Trans Tech Publications Ltd; 2003. p. 173–88.10.1007/3-540-48019-6_16Search in Google Scholar
[38] Bei H, Xia YZ, Barabash RI, Gao YF. A tale of two mechanisms: strain-softening versus strain-hardening in single crystals under small stressed volumes. Scripta Mater. 2016;110:48–52.10.1016/j.scriptamat.2015.07.043Search in Google Scholar
[39] Islavath SR, Deb D, Kumar H. Numerical analysis of a longwall mining cycle and development of a composite longwall index. Int J Rock Mech Mining Sci. 2016;89:43–54.10.1016/j.ijrmms.2016.08.003Search in Google Scholar
[40] Bai QS, Tu SH. Failure analysis of a large span longwall drift under water-rich roofs and its control techniques. Eng Fail Anal. 2016;67:15–32.10.1016/j.engfailanal.2016.05.028Search in Google Scholar
[41] Tian Y, Liu Q, Ma H, Liu Q, Deng P. New peak shear strength model for cement filled rock joints. Eng Geol. 2018;233:269–80.10.1016/j.enggeo.2017.12.021Search in Google Scholar
[42] Gothäll R, Stille H. Fracture–fracture interaction during grouting. Tunnell Underground Space Technol. 2010;25:199–204.10.1016/j.tust.2009.11.003Search in Google Scholar
[43] Kang Y, Liu Q, Xi H, Gong G. Improved compound support system for coal mine tunnels in densely faulted zones: a case study of China’s Huainan coal field. Eng Geol. 2018;240:10–20.10.1016/j.enggeo.2018.04.006Search in Google Scholar
[44] Ma Z, Wang J, He M, Gao Y, Hu J, Wang Q. Key technologies and application test of an innovative noncoal pillar mining approach: a case study. Energies. 2018;11:1–22.10.3390/en11102853Search in Google Scholar
[45] Wang Y, Yang J, He M, et al. Test of a liquid directional roof-cutting technology for pressure-relief entry retaining mining. J Geophys Eng. 2019;16:620–38.10.1093/jge/gxz041Search in Google Scholar
© 2020 Bingjie Huo et al., published by De Gruyter
This work is licensed under the Creative Commons Attribution 4.0 International License.
Articles in the same Issue
- Regular Articles
- The simulation approach to the interpretation of archival aerial photographs
- The application of137Cs and210Pbexmethods in soil erosion research of Titel loess plateau, Vojvodina, Northern Serbia
- Provenance and tectonic significance of the Zhongwunongshan Group from the Zhongwunongshan Structural Belt in China: insights from zircon geochronology
- Analysis, Assessment and Early Warning of Mudflow Disasters along the Shigatse Section of the China–Nepal Highway
- Sedimentary succession and recognition marks of lacustrine gravel beach-bars, a case study from the Qinghai Lake, China
- Predicting small water courses’ physico-chemical status from watershed characteristics with two multivariate statistical methods
- An Overview of the Carbonatites from the Indian Subcontinent
- A new statistical approach to the geochemical systematics of Italian alkaline igneous rocks
- The significance of karst areas in European national parks and geoparks
- Geochronology, trace elements and Hf isotopic geochemistry of zircons from Swat orthogneisses, Northern Pakistan
- Regional-scale drought monitor using synthesized index based on remote sensing in northeast China
- Application of combined electrical resistivity tomography and seismic reflection method to explore hidden active faults in Pingwu, Sichuan, China
- Impact of interpolation techniques on the accuracy of large-scale digital elevation model
- Natural and human-induced factors controlling the phreatic groundwater geochemistry of the Longgang River basin, South China
- Land use/land cover assessment as related to soil and irrigation water salinity over an oasis in arid environment
- Effect of tillage, slope, and rainfall on soil surface microtopography quantified by geostatistical and fractal indices during sheet erosion
- Validation of the number of tie vectors in post-processing using the method of frequency in a centric cube
- An integrated petrophysical-based wedge modeling and thin bed AVO analysis for improved reservoir characterization of Zhujiang Formation, Huizhou sub-basin, China: A case study
- A grain size auto-classification of Baikouquan Formation, Mahu Depression, Junggar Basin, China
- Dynamics of mid-channel bars in the Middle Vistula River in response to ferry crossing abutment construction
- Estimation of permeability and saturation based on imaginary component of complex resistivity spectra: A laboratory study
- Distribution characteristics of typical geological relics in the Western Sichuan Plateau
- Inconsistency distribution patterns of different remote sensing land-cover data from the perspective of ecological zoning
- A new methodological approach (QEMSCAN®) in the mineralogical study of Polish loess: Guidelines for further research
- Displacement and deformation study of engineering structures with the use of modern laser technologies
- Virtual resolution enhancement: A new enhancement tool for seismic data
- Aeromagnetic mapping of fault architecture along Lagos–Ore axis, southwestern Nigeria
- Deformation and failure mechanism of full seam chamber with extra-large section and its control technology
- Plastic failure zone characteristics and stability control technology of roadway in the fault area under non-uniformly high geostress: A case study from Yuandian Coal Mine in Northern Anhui Province, China
- Comparison of swarm intelligence algorithms for optimized band selection of hyperspectral remote sensing image
- Soil carbon stock and nutrient characteristics of Senna siamea grove in the semi-deciduous forest zone of Ghana
- Carbonatites from the Southern Brazilian platform: I
- Seismicity, focal mechanism, and stress tensor analysis of the Simav region, western Turkey
- Application of simulated annealing algorithm for 3D coordinate transformation problem solution
- Application of the terrestrial laser scanner in the monitoring of earth structures
- The Cretaceous igneous rocks in southeastern Guangxi and their implication for tectonic environment in southwestern South China Block
- Pore-scale gas–water flow in rock: Visualization experiment and simulation
- Assessment of surface parameters of VDW foundation piles using geodetic measurement techniques
- Spatial distribution and risk assessment of toxic metals in agricultural soils from endemic nasopharyngeal carcinoma region in South China
- An ABC-optimized fuzzy ELECTRE approach for assessing petroleum potential at the petroleum system level
- Microscopic mechanism of sandstone hydration in Yungang Grottoes, China
- Importance of traditional landscapes in Slovenia for conservation of endangered butterfly
- Landscape pattern and economic factors’ effect on prediction accuracy of cellular automata-Markov chain model on county scale
- The influence of river training on the location of erosion and accumulation zones (Kłodzko County, South West Poland)
- Multi-temporal survey of diaphragm wall with terrestrial laser scanning method
- Functionality and reliability of horizontal control net (Poland)
- Strata behavior and control strategy of backfilling collaborate with caving fully-mechanized mining
- The use of classical methods and neural networks in deformation studies of hydrotechnical objects
- Ice-crevasse sedimentation in the eastern part of the Głubczyce Plateau (S Poland) during the final stage of the Drenthian Glaciation
- Structure of end moraines and dynamics of the recession phase of the Warta Stadial ice sheet, Kłodawa Upland, Central Poland
- Mineralogy, mineral chemistry and thermobarometry of post-mineralization dykes of the Sungun Cu–Mo porphyry deposit (Northwest Iran)
- Main problems of the research on the Palaeolithic of Halych-Dnister region (Ukraine)
- Application of isometric transformation and robust estimation to compare the measurement results of steel pipe spools
- Hybrid machine learning hydrological model for flood forecast purpose
- Rainfall thresholds of shallow landslides in Wuyuan County of Jiangxi Province, China
- Dynamic simulation for the process of mining subsidence based on cellular automata model
- Developing large-scale international ecological networks based on least-cost path analysis – a case study of Altai mountains
- Seismic characteristics of polygonal fault systems in the Great South Basin, New Zealand
- New approach of clustering of late Pleni-Weichselian loess deposits (L1LL1) in Poland
- Implementation of virtual reference points in registering scanning images of tall structures
- Constraints of nonseismic geophysical data on the deep geological structure of the Benxi iron-ore district, Liaoning, China
- Mechanical analysis of basic roof fracture mechanism and feature in coal mining with partial gangue backfilling
- The violent ground motion before the Jiuzhaigou earthquake Ms7.0
- Landslide site delineation from geometric signatures derived with the Hilbert–Huang transform for cases in Southern Taiwan
- Hydrological process simulation in Manas River Basin using CMADS
- LA-ICP-MS U–Pb ages of detrital zircons from Middle Jurassic sedimentary rocks in southwestern Fujian: Sedimentary provenance and its geological significance
- Analysis of pore throat characteristics of tight sandstone reservoirs
- Effects of igneous intrusions on source rock in the early diagenetic stage: A case study on Beipiao Formation in Jinyang Basin, Northeast China
- Applying floodplain geomorphology to flood management (The Lower Vistula River upstream from Plock, Poland)
- Effect of photogrammetric RPAS flight parameters on plani-altimetric accuracy of DTM
- Morphodynamic conditions of heavy metal concentration in deposits of the Vistula River valley near Kępa Gostecka (central Poland)
- Accuracy and functional assessment of an original low-cost fibre-based inclinometer designed for structural monitoring
- The impacts of diagenetic facies on reservoir quality in tight sandstones
- Application of electrical resistivity imaging to detection of hidden geological structures in a single roadway
- Comparison between electrical resistivity tomography and tunnel seismic prediction 303 methods for detecting the water zone ahead of the tunnel face: A case study
- The genesis model of carbonate cementation in the tight oil reservoir: A case of Chang 6 oil layers of the Upper Triassic Yanchang Formation in the western Jiyuan area, Ordos Basin, China
- Disintegration characteristics in granite residual soil and their relationship with the collapsing gully in South China
- Analysis of surface deformation and driving forces in Lanzhou
- Geochemical characteristics of produced water from coalbed methane wells and its influence on productivity in Laochang Coalfield, China
- A combination of genetic inversion and seismic frequency attributes to delineate reservoir targets in offshore northern Orange Basin, South Africa
- Explore the application of high-resolution nighttime light remote sensing images in nighttime marine ship detection: A case study of LJ1-01 data
- DTM-based analysis of the spatial distribution of topolineaments
- Spatiotemporal variation and climatic response of water level of major lakes in China, Mongolia, and Russia
- The Cretaceous stratigraphy, Songliao Basin, Northeast China: Constrains from drillings and geophysics
- Canal of St. Bartholomew in Seča/Sezza: Social construction of the seascape
- A modelling resin material and its application in rock-failure study: Samples with two 3D internal fracture surfaces
- Utilization of marble piece wastes as base materials
- Slope stability evaluation using backpropagation neural networks and multivariate adaptive regression splines
- Rigidity of “Warsaw clay” from the Poznań Formation determined by in situ tests
- Numerical simulation for the effects of waves and grain size on deltaic processes and morphologies
- Impact of tourism activities on water pollution in the West Lake Basin (Hangzhou, China)
- Fracture characteristics from outcrops and its meaning to gas accumulation in the Jiyuan Basin, Henan Province, China
- Impact evaluation and driving type identification of human factors on rural human settlement environment: Taking Gansu Province, China as an example
- Identification of the spatial distributions, pollution levels, sources, and health risk of heavy metals in surface dusts from Korla, NW China
- Petrography and geochemistry of clastic sedimentary rocks as evidence for the provenance of the Jurassic stratum in the Daqingshan area
- Super-resolution reconstruction of a digital elevation model based on a deep residual network
- Seismic prediction of lithofacies heterogeneity in paleogene hetaoyuan shale play, Biyang depression, China
- Cultural landscape of the Gorica Hills in the nineteenth century: Franciscean land cadastre reports as the source for clarification of the classification of cultivable land types
- Analysis and prediction of LUCC change in Huang-Huai-Hai river basin
- Hydrochemical differences between river water and groundwater in Suzhou, Northern Anhui Province, China
- The relationship between heat flow and seismicity in global tectonically active zones
- Modeling of Landslide susceptibility in a part of Abay Basin, northwestern Ethiopia
- M-GAM method in function of tourism potential assessment: Case study of the Sokobanja basin in eastern Serbia
- Dehydration and stabilization of unconsolidated laminated lake sediments using gypsum for the preparation of thin sections
- Agriculture and land use in the North of Russia: Case study of Karelia and Yakutia
- Textural characteristics, mode of transportation and depositional environment of the Cretaceous sandstone in the Bredasdorp Basin, off the south coast of South Africa: Evidence from grain size analysis
- One-dimensional constrained inversion study of TEM and application in coal goafs’ detection
- The spatial distribution of retail outlets in Urumqi: The application of points of interest
- Aptian–Albian deposits of the Ait Ourir basin (High Atlas, Morocco): New additional data on their paleoenvironment, sedimentology, and palaeogeography
- Traditional agricultural landscapes in Uskopaljska valley (Bosnia and Herzegovina)
- A detection method for reservoir waterbodies vector data based on EGADS
- Modelling and mapping of the COVID-19 trajectory and pandemic paths at global scale: A geographer’s perspective
- Effect of organic maturity on shale gas genesis and pores development: A case study on marine shale in the upper Yangtze region, South China
- Gravel roundness quantitative analysis for sedimentary microfacies of fan delta deposition, Baikouquan Formation, Mahu Depression, Northwestern China
- Features of terraces and the incision rate along the lower reaches of the Yarlung Zangbo River east of Namche Barwa: Constraints on tectonic uplift
- Application of laser scanning technology for structure gauge measurement
- Calibration of the depth invariant algorithm to monitor the tidal action of Rabigh City at the Red Sea Coast, Saudi Arabia
- Evolution of the Bystrzyca River valley during Middle Pleistocene Interglacial (Sudetic Foreland, south-western Poland)
- A 3D numerical analysis of the compaction effects on the behavior of panel-type MSE walls
- Landscape dynamics at borderlands: analysing land use changes from Southern Slovenia
- Effects of oil viscosity on waterflooding: A case study of high water-cut sandstone oilfield in Kazakhstan
- Special Issue: Alkaline-Carbonatitic magmatism
- Carbonatites from the southern Brazilian Platform: A review. II: Isotopic evidences
- Review Article
- Technology and innovation: Changing concept of rural tourism – A systematic review