Dynamic simulation for the process of mining subsidence based on cellular automata model
-
Qiuji Chen
 ,
Jiye Li
,
Jiye Li

Abstract
Under the background of the ecological civilization era, rapidly obtaining coal mining information, timely assessing the ecological environmental impacts, and drafting different management and protection measures in advance to enhance the capacity of green mine construction have become the urgent technical problems to be solved at present. Simulating and analyzing mining subsidence is the foundation for a land reclamation plan. The Cellular Automata (CA) model provides a new tool for simulating the evolution of mining subsidence. This paper takes a mine in East China as a research area, analyses the methods and measures for developing a model of mining subsidence based on the theories of CA and mining technology, then discusses the results of simulation from different aspects. Through comparative analysis, it can be found that the predicted result is well consonant with the observation data. The CA model can simulate complex systems. The system of mining subsidence evolution CA is developed with the support of ArcGIS and Python, which can help to realize data management, visualization, and spatial analysis. The dynamic evolution of subsidence provides a basis for constructing a reclamation program. The research results show that the research methods and techniques adopted in this paper are feasible for the dynamic mining subsidence, and the work will continue to do in the future to help the construction of ecological civilization in mining areas.
1 Introduction
Surface subsidence caused by the exploitation of coal resources has led to the devastation of the environment and has affected regular land use. Currently, the main modes of mining reclamation are not performed until subsidence entirely ceased. This could potentially take three or more years before reclamation processed, resulting in an extended period without the use of the land and extended damage to the surface. To shorten the time of reclamation, dynamic reclamation for subsidence land is becoming a trend of ecological restoration in the mining area, because it encourages timely and appropriate measures to control ecosystem degradation and accelerate ecological restoration. It is based on the principle of early intervention. Dynamic reclamation is still in the early stage of wide-spread implementation, mostly because the dynamic prediction theory of mining subsidence is still immature. Mining subsidence dynamics prediction can show the evolution process of surface subsidence and fully reflect the damage of the ecological environment. These aspects will dictate which methods need to be implemented during the reclamation process. Therefore, mining subsidence dynamics prediction has become the technical key for wide-spread dynamic reclamation implementation. Currently, the main research results focus on the construction of a time function, such as the Knothe function, normal distribution function, and the Willbull function [1,2,3,4,5,6]. Due to a large number of calculations that are needed for these methods, the implementation is mainly performed in professional software such as MATLAB or ABAQUS [7]. The cellular automata (CA) model provides a new tool for simulating the evolution of mining subsidence. Although some studies have been conducted in on CA [8,9,10], dynamic simulation for mining subsidence is a complex system problem, the results are largely affected by the model choice and setting [11–13], and different conditions need different methods. Especially when taking into consideration three-dimensional space, there still are many challenges before full implementation of CA modeling for subsidence simulation. For example, how to setup the CA model according to the coal mining technology and integrate the CA model with Geographic information system (GIS) tools to facilitate the ecological restoration.
This paper takes a mine in East China as a research area, analyses the methods and measures for developing a model of mining subsidence based on the theories of CA and mining technology, then discusses the results of simulation from different aspects. The purpose of this study is to (1) establish a mining subsidence CA model under a three-dimensional framework; (2) create a mining subsidence CA model with the support of GIS and Python; and (3) simulate the process of mining subsidence by combining the spatial analysis and three-dimensional visualization functions of GIS.
With the help of CA, the result of the temporal and spatial evolution of subsidence can facilitate the assessment of environmental impact and the optimization of the mining plan. The work can promote the ecological civilization in mining areas and has a wide application prospect in the field of coal mining and land reclamation.
2 Study methodology
2.1 CA
CA is a nonlinear system model with a complete discrete space, time, and state. It can be defined as the following quadruple [14,15,16,17]:
where A is the CA system, Ld is a d-dimensional cellular space, d is a positive integer; S is a discrete finite set of cellular states; N is a combination of cellular states in the neighborhood; and f is a local conversion function.
Evolution can be expressed as the following formula:
where
Compared with the traditional equation-based geographic model, the CA model has better spatio-temporal dynamics and can simulate the emergence, chaos, evolution, and other characteristics of complex nonlinear systems. This tool is commonly used in ecology, environmental, natural disasters, risk predictions, etc. As a powerful tool for highly complex geographical phenomena, many have continued to expand the standard CA model by combining it with fractal theory, the multi-factor evaluation model, artificial neural networks, Markov chain, and multi-agent, etc. [18,19,20].
2.2 Mining subsidence CA model
2.2.1 Establishment of cellular space
Mining subsidence prediction of the CA model relates to the surface cellular space and underground coal cellular space. These two types of cellular space are constructed based on the unified spatial reference, and the evolution of the underground cellular space drives the change of the surface cellular space.
2.2.1.1 Choice of cellular size
A smaller cellular size results in a higher calculation accuracy. However, the calculation time increases rapidly. According to regulations and previous research, suitable size can be chosen according to the mining conditions (Table 1).
Size of cellular for prediction
| Mining depth/m | Size of cellular/m |
|---|---|
| <100 | ≤2 |
| 100–300 | ≤4 |
| 300–500 | ≤8 |
| >500 | ≤16 |
2.2.1.2 Work face cellular space
According to the mining plan, the cellular space of the mining working face is expressed as the following formula:
where
2.2.1.3 Surface cellular space
According to mining subsidence theory, the influence of subsidence is in a specific area, and the distance to the boundary of the working face is the radius of influence of mining subsidence (r). Based on this, the surface cellular space range can be described with the following formula:
where
2.2.2 Cellular neighborhoods
Neighborhoods play essential roles in CA models. The evolution of the surface cellular state depends on the change of the cellular state of underground coal seams. Therefore, the neighbor space of the surface cells is defined in the underground coal cellular space as well. The distance of the neighborhood is determined according to the main influencing radius r, that is, the neighborhood order k = int(r/d + 1). So, for a given surface cellular unit
2.2.3 Evolutionary rule construction
The evolution rule reflects the interaction between the neighboring cellular units and the central cellular unit and is the basis for the automatic evolution of the system.
For a given surface cellular unit
where
where
where m is the thickness of the coal seam, q is the subsidence coefficient, and α is the angle of dip.
The state of the work face cellular unit at a given time t can be described with the following formula:
where x is the time distance, which is dimensionless and can be calculated with the following formula:
where
where v is the advancing speed of the working face and r is the main radius of influence.
2.3 Accuracy testing
To verify whether this method is viable, the predicted values are compared with in situ measured data (Figure 1). The value of subsidence is surveyed with the instrument of electronic level according to third class level requirements. The standard deviation for in situ measured data is ±6 mm/km, so, it can be re guarded as the actual value to evaluate the accuracy of prediction. Through correlation analysis, the correlation coefficient between the predicted value and the in situ measured value is 0.99. So, the accuracy of the CA method meets the requirements for dynamic land reclamation planning.
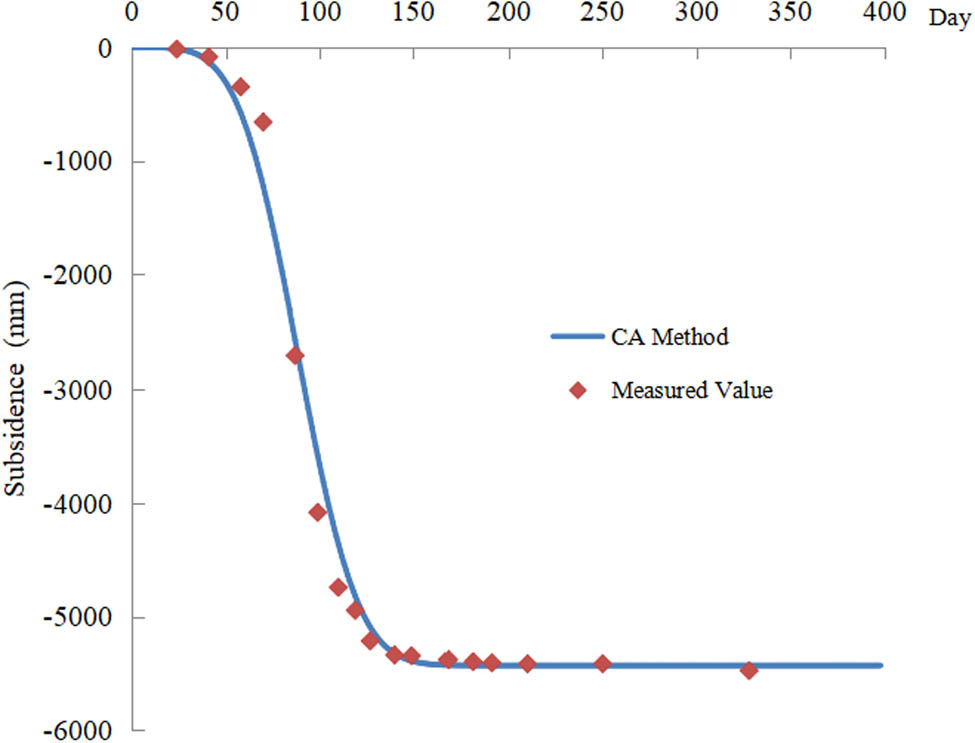
Distribution of predicted value and in situ measured value.
3 Application
3.1 Overview of case study
The study area locates in the in Shandong Province, China. The average thickness of the coal seam is 8.0 m. The burial depth is 320 m. The terrain is overall flat, with an average elevation of 44 m. The simulated working face has a length of 1,580 m along strike and a width of 350 m along dip. It will be exploited with a fully mechanized mining method, and the working face will advance at a speed of 4 m/day. Combined with the rock movement observation data of the surrounding mines, the main influence angle tangent is 2 and the maximum subsidence coefficient is 0.84.
3.2 Implementation of the model
Python and ArcGIS are integrated into the model to implement the mining subsidence CA. Python is an object-oriented, interpreted computer programming language with a rich and powerful library for rapid development and efficient integration with other tools. ArcGIS 10 provides a Python site package (ArcPy), where GIS users can quickly create simple or complex workflows with the help of ArcPy in Python and develop utilities that can be used to process geoscience data [21]. The implementation process of the system is shown in Figure 2.
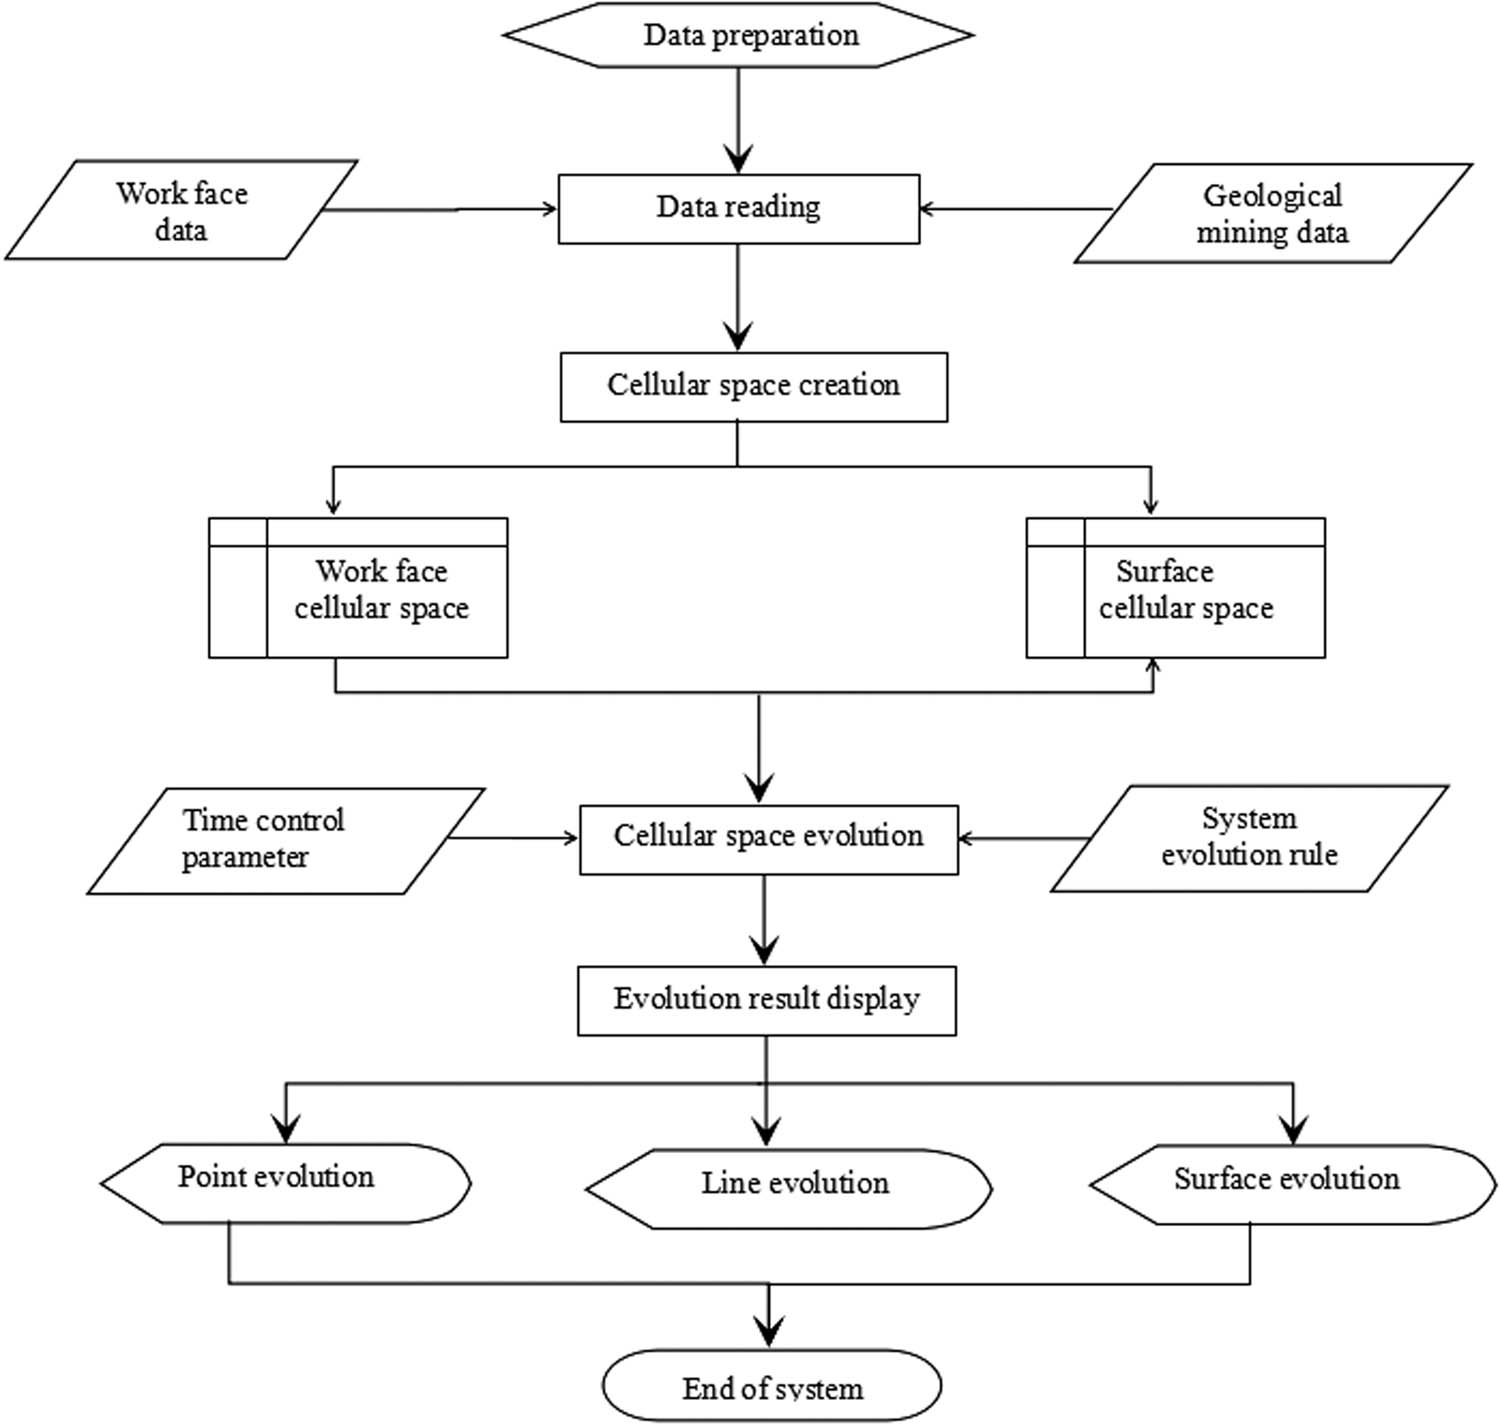
System implementation flow chart.
3.3 Results analysis
3.3.1 The evolution of specific points with mining
In this case, five points (A, B, C, D, E) on the main section of the surface deformation are selected, which are shown in Figure 3. Mining started on the first day, and the values of cellular units are analyzed within 500 days, and the processes of subsidence with time are shown in Figure 4.
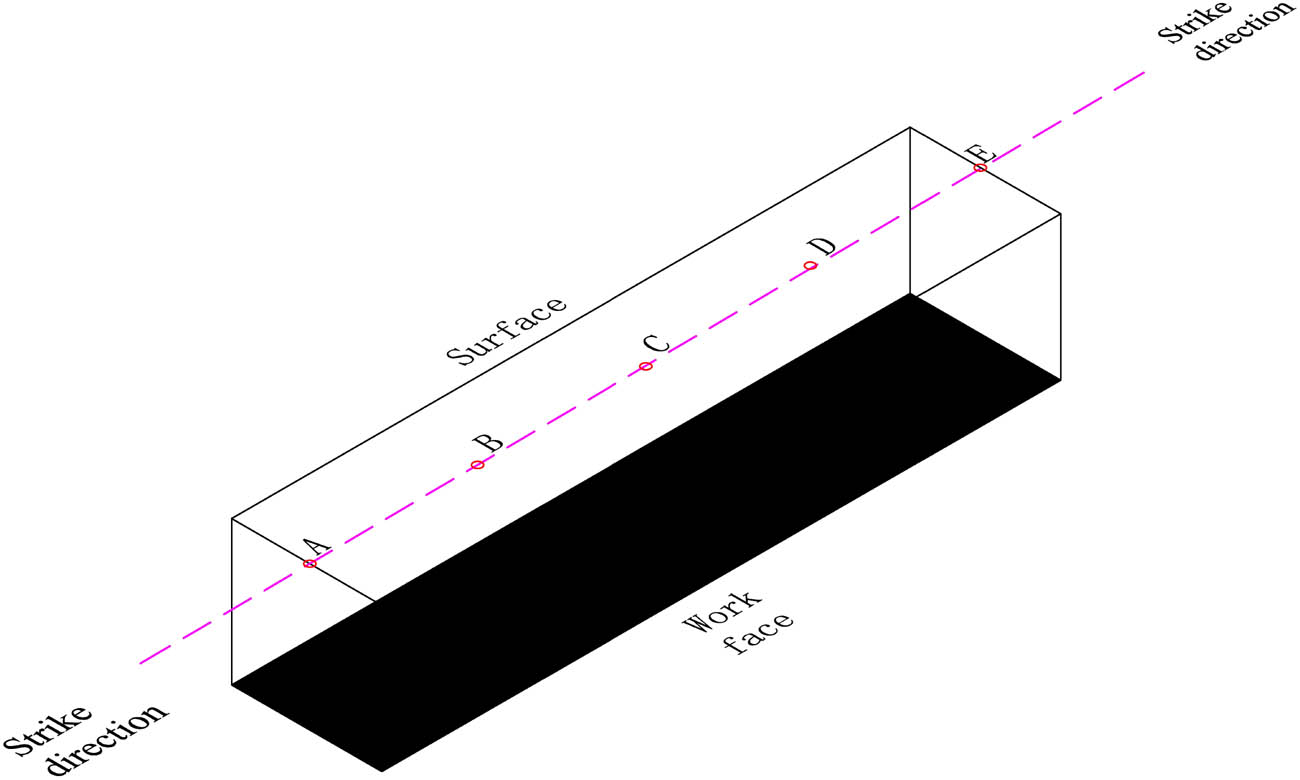
The layout of observation points.

Changes in surface cells with mining.
Initially, for a given cellular unit, the rate of subsidence is slow, yet increases quickly when the position of the working face moves to directly underneath the surface cellular unit. After the working face has passed the cellular unit, the subsidence rate then slowly decreases until the end. The start of subsidence at each point varies with time, as the distance to mining the working face directly affects the state. Therefore, treatment for land reclamation can be selected based on the predicted value. For example, the subsidence at point A approaches an end on the 90th day, at a total depth of 3,300 mm. This location can then be treated with a terrace after that day rather than waiting until the end of all mining.
3.3.2 Subsidence evolution along the main mining section
Changes in subsidence along the main section at five-time points (100th, 200th, 300th, 400th, and 500th day) were selected to analyze the process of subsidence with working face advancement. The amount of subsidence and change in values along the main section during the mining process is shown in Figure 5. During the advancement of the working face, subsidence occurs ahead of the working face, and the subsidence curve continues to progress forward with the advancement of the working face. Subsidence continues to develop even after mining has ended. This figure also shows where the basin and slope are distributed which can aid in the proper selection of treatments as different regions require different methods. Finally, the curve also shows when subsidence end (Figure 5); therefore, timely reclamation can be implemented to minimize the ecological degradation, or before the start of subsidence, some measures, such as planting or drainage, can be applied to the region.
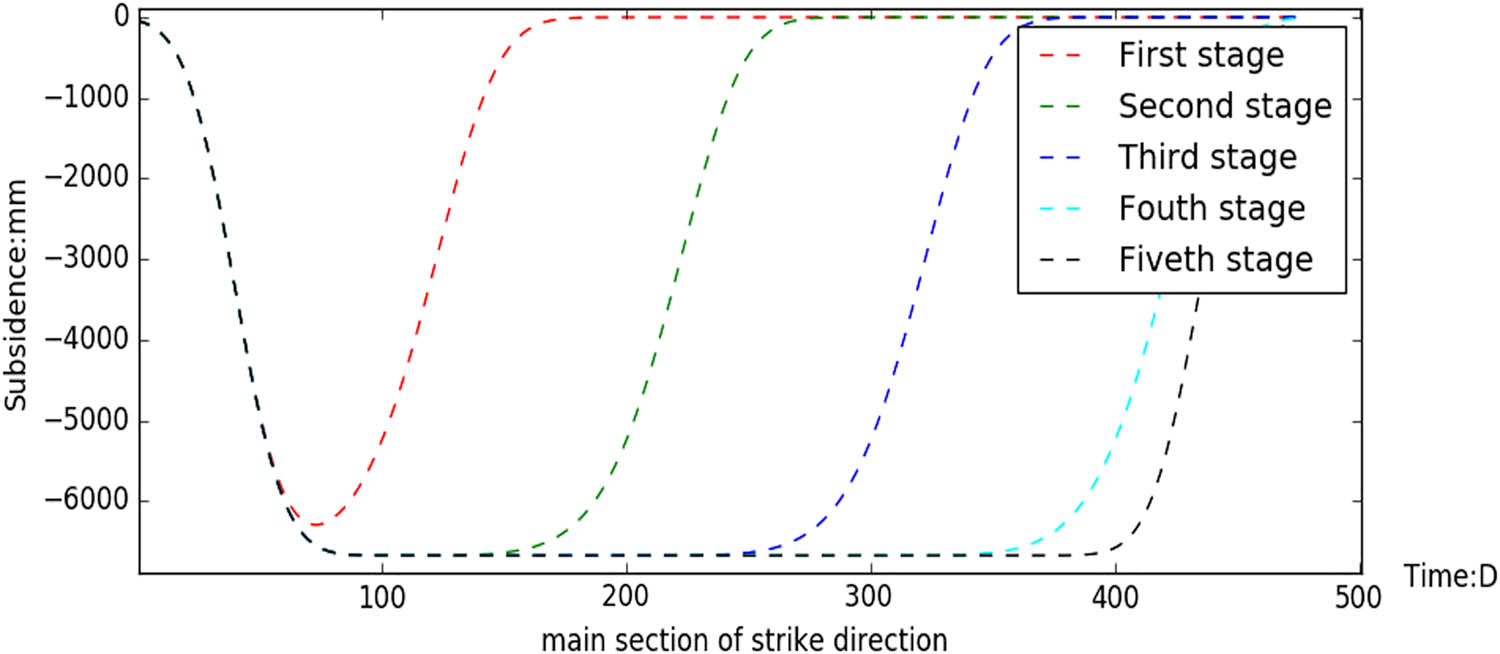
Changes in the amount of subsidence of the surface along the main section with the advancement of the working face.
3.3.3 Changes in subsidence in the total surface
As the analysis of the above, 5-time points were selected (100th, 200th, 300th, 400th, and 500th day) to analyze the changes in subsidence of the surface across the entire region. The calculation results are shown in Figure 6 and provide an overall perspective of subsidence throughout the mining process. The CA model provides the area and depth of subsidence at various times so that a plan for land use can be made in advance. Based on the results, the quantities of earthwork for land reclamation can also be calculated.

Changes in subsidence of the surface over time across the entire region: (a) 100th surface subsidence simulation, (b) 200th surface subsidence simulation, (c) 300th surface subsidence simulation, (d) 400th surface subsidence simulation, (e) 500th surface subsidence simulation.
4 Discussion
From the result of accuracy testing, it can be found that the predicted result is well consonant with the observation data. This indicates that the CA model is in capacity to reveal the mechanism of mining subsidence progress because the model is constructed based on the theory of non-continuous media mechanics. The advantages of the CA model for mining subsidence are that it is easy to calculate and can integrate the process with time.
From the view of point change with mining, the evolution of subsidence on a detailed location can be found. The function is to predict and assess the impact on the place needed to pay attention. Based on the result, it can be determined when to take measures to control the damage and restore the land use; from the view of line change with mining, the shape and scope of subsidence with time can be found which can facilitate the farmland and structure lays out. Through compared with relevant research findings [22,23], the spatial scope and shape of the CA method are consistent with other methods; from the view of area change with mining, the overall perspective of the surface subsidence evolution can be obtained, which can help to fully understand and master the impact of subsidence.
The CA model can integrate with the software of GIS which provides many useful tools for data management and visualization. Moreover, it is simple to conduct a correlation analysis between other spatial data by GIS tools.
5 Conclusions
This paper discusses simulating the process of surface subsidence based on the CA model, which provides a powerful tool and theoretical basis for dynamic reclamation. The main innovations achieved are as follows:
The mining subsidence is affected by many factors and it is a complex progress. The CA model has the ability to simulate complex systems. The CA model of mining subsidence evolution in three-dimensional space is constructed based on mining subsidence theories. The cellular space division, neighborhood definition, evolution rules, and other aspects of the model are defined according to the condition of coal characteristics and mining technology. The result is tested with in situ measured value and has high accuracy. The evolution results reflect the process of surface subsidence and provide a basis for preparing reclamation measures before the initiation of mining.
The system of mining subsidence evolution CA is developed with the support of ArcGIS and Python, which can help to realize data management, visualization, and spatial analysis. The process of mining subsidence is demonstrated from three levels, point, line, and surface by combining the model with a case study of a mine in eastern China. The spatial scope and shape of the CA method are consistent with other methods. The dynamic evolution of subsidence provides a basis for constructing a reclamation program.
The precision of the simulation could be improved by decreasing the cell size. For a mine area with a large space, this would significantly increase the amount of data and dramatically increase the amount of calculation time. The CA model provides a new idea for subsidence simulation, but the subsidence evolution model under complex geological mining conditions still needs further study.
Acknowledgments
This work is financially supported by the Research Project of Key Technologies for Water Resources Protection, Utilization, and Ecological Reconstruction in Northern Shaanxi Coal Mine Area (SMHKJ-A-J-03:2018).
References
[1] Zhang B, Cui XM, Zhao YL, Li CY. Prediction model and algorithm for dynamic subsidence of inclined main section. J China Coal Soc. 10.13225/j.cnki.jccs.2019.1814.Suche in Google Scholar
[2] Zhang B, Cui XM, Hu QF. Study on the normal distribution time function model of mining subsidence dynamic prediction. Coal Sci Technol. 2016;44(4):140–5. 10.13199/j.cnki.cst.2016.04.028.Suche in Google Scholar
[3] Zhang K, Hu HF, Lian XG, Cai YF. Optimization of surface dynamic subsidence prediction normal time function model. Coal Sci Technol. 2019;47(09):235–40. 10.13199/j.cnki.cst.2019.09.030.Suche in Google Scholar
[4] Chen QJ, Zhang Y, Tian LX. Dynamic reclamation for damaged land based on residual deformation of coal mining subsidence. Coal Technol. 2019;39(01):4–6. 10.13301/j.cnki.ct.2019.01.002.Suche in Google Scholar
[5] Wei T, Wang L, Chi SS, Li N, Lv T. Research on dynamic precise prediction method of mining subsidence based on aged knothe function. Met Mine. 2017;(10):16–22. 10.19614/j.cnki.jsks.2017.10.004.Suche in Google Scholar
[6] Zhang JM, Xu LJ, Li JW, Shen Z, Yu LR. Study on dynamic subsidence model of mining subsidence and its parameters. Met Mine. 2017;(10):12–5. 10.19614/j.cnki.jsks.2017.10.003Suche in Google Scholar
[7] Mohammad M, Mahdi K. Investigation of the effect of dimensional characteristics of stone column on load-bearing capacity and consolidation time. Civ Eng J. 2018;4(6):1437–1146. 10.28991/cej-0309184.Suche in Google Scholar
[8] Chen QJ. Simulation of coal mining subsidence based on the model of cellular automata. Sci & Technol Rev. 2013;31(11):65–7.Suche in Google Scholar
[9] Sun XY, Xia YC. Dynamic prediction model of mining subsidence based on cellular automata. Adv Mater Res. 2014;962–5:1056–61. 10.4028/www.scientific.net/amr.962-965.1056.Suche in Google Scholar
[10] Chen QJ. Dynamic prediction for mine subsidence along major profile based on cellular automata. Electron J Geotech Eng. 2017;22(10):4225–34.Suche in Google Scholar
[11] Davide F, Marco T, Stefania V. Response site analyses of 3D homogeneous soil models. Emerg Sci J. 2018;2(5):238–50. 10.28991/esj-2018-01148.Suche in Google Scholar
[12] Elmira N, Hadi F. The effect of suffusion phenomenon in the increasing of land subsidence rate. Civ Eng J. 2016;2(7):316–23. 10.28991/cej-2016-00000036.Suche in Google Scholar
[13] Liu WT, Xie XX, Liu H, Zhao HJ. Analysis of multi-seam mining subsidence dynamic prediction. Safety Coal Min. 2016;47(10):228–230+234. 10.13347/j.cnki.mkaq.2016.10.061.Suche in Google Scholar
[14] Tong XH, Feng YJ. A review of assessment methods for cellular automata models of land-use change and urban growth. Int J Geographical Inf Sci. 2020;34(5):866–98. 10.1080/13658816.2019.1684499.Suche in Google Scholar
[15] Cao Y, Zhang XL, Fu Y, Lu ZW, Shen XQ. Urban spatial growth modeling using logistic regression and cellular automata: a case study of Hangzhou. Ecol Indic. 2020;113:106200. 10.1016/j.ecolind.2020.106200.Suche in Google Scholar
[16] Feng YJ, Tong XH. A new cellular automata framework of urban growth modeling by incorporating statistical and heuristic methods. Int J Geograph Inf Sci. 2020;34(1):74–97. 10.1080/13658816.2019.1648813.Suche in Google Scholar
[17] Zhou X, Zhang RL, Zhong ZY, Guo SL. Developing a hydrology coupled 2D cellular automata model for efficient urban flood simulation. IOP Conf Series: Earth Environ Sci. 2019;304(2):022050. 10.1088/1755-1315/304/2/022050.Suche in Google Scholar
[18] Li Y, Hu BS, Zhang D, Gong JH, Song YQ. Flood evacuation simulations using cellular automata and multiagent systems -a human-environment relationship perspective. Int J Geographical Inf Sci. 2019;33(11):2241–58. 10.1080/13658816.2019.1622015.Suche in Google Scholar
[19] Gao C, Feng YJ, Tong XH, Jin YM, Liu S, Wu PQ, et al. Modeling urban encroachment on ecological land using cellular automata and cross-entropy optimization rules. Sci Total Environ. 2020;(07):149006. 10.1016/j.scitotenv.2020.140996.Suche in Google Scholar PubMed
[20] Zhang YH, Qiao JG, Liu WH, Cai SR, Ding QX, Chen XW. Parameter sensitivity analysis of urban cellular automata model. J Remote Sens. 2018;22(6):1051–9. 10.11834/jrs.20187145.Suche in Google Scholar
[21] Li SY, Deng JQ. Automated processing and analysis method of geoscience data based on ArcPy. Technol Innov Product. 2018;03:44–46. 10.3969/j.issn.1674-9146.2018.03.044.Suche in Google Scholar
[22] Tan ZX, Deng KZ. Theory and practice of coal mining under buildings. Xuzhou: China University of Mining and Technology Press; 2009.Suche in Google Scholar
[23] Wang ZS, Deng KZ. Richards model of surface dynamic subsidence prediction in mining area. Rock Soil Mech. 2011;32(6):1664–8.Suche in Google Scholar
© 2020 Qiuji Chen et al., published by De Gruyter
This work is licensed under the Creative Commons Attribution 4.0 International License.
Artikel in diesem Heft
- Regular Articles
- The simulation approach to the interpretation of archival aerial photographs
- The application of137Cs and210Pbexmethods in soil erosion research of Titel loess plateau, Vojvodina, Northern Serbia
- Provenance and tectonic significance of the Zhongwunongshan Group from the Zhongwunongshan Structural Belt in China: insights from zircon geochronology
- Analysis, Assessment and Early Warning of Mudflow Disasters along the Shigatse Section of the China–Nepal Highway
- Sedimentary succession and recognition marks of lacustrine gravel beach-bars, a case study from the Qinghai Lake, China
- Predicting small water courses’ physico-chemical status from watershed characteristics with two multivariate statistical methods
- An Overview of the Carbonatites from the Indian Subcontinent
- A new statistical approach to the geochemical systematics of Italian alkaline igneous rocks
- The significance of karst areas in European national parks and geoparks
- Geochronology, trace elements and Hf isotopic geochemistry of zircons from Swat orthogneisses, Northern Pakistan
- Regional-scale drought monitor using synthesized index based on remote sensing in northeast China
- Application of combined electrical resistivity tomography and seismic reflection method to explore hidden active faults in Pingwu, Sichuan, China
- Impact of interpolation techniques on the accuracy of large-scale digital elevation model
- Natural and human-induced factors controlling the phreatic groundwater geochemistry of the Longgang River basin, South China
- Land use/land cover assessment as related to soil and irrigation water salinity over an oasis in arid environment
- Effect of tillage, slope, and rainfall on soil surface microtopography quantified by geostatistical and fractal indices during sheet erosion
- Validation of the number of tie vectors in post-processing using the method of frequency in a centric cube
- An integrated petrophysical-based wedge modeling and thin bed AVO analysis for improved reservoir characterization of Zhujiang Formation, Huizhou sub-basin, China: A case study
- A grain size auto-classification of Baikouquan Formation, Mahu Depression, Junggar Basin, China
- Dynamics of mid-channel bars in the Middle Vistula River in response to ferry crossing abutment construction
- Estimation of permeability and saturation based on imaginary component of complex resistivity spectra: A laboratory study
- Distribution characteristics of typical geological relics in the Western Sichuan Plateau
- Inconsistency distribution patterns of different remote sensing land-cover data from the perspective of ecological zoning
- A new methodological approach (QEMSCAN®) in the mineralogical study of Polish loess: Guidelines for further research
- Displacement and deformation study of engineering structures with the use of modern laser technologies
- Virtual resolution enhancement: A new enhancement tool for seismic data
- Aeromagnetic mapping of fault architecture along Lagos–Ore axis, southwestern Nigeria
- Deformation and failure mechanism of full seam chamber with extra-large section and its control technology
- Plastic failure zone characteristics and stability control technology of roadway in the fault area under non-uniformly high geostress: A case study from Yuandian Coal Mine in Northern Anhui Province, China
- Comparison of swarm intelligence algorithms for optimized band selection of hyperspectral remote sensing image
- Soil carbon stock and nutrient characteristics of Senna siamea grove in the semi-deciduous forest zone of Ghana
- Carbonatites from the Southern Brazilian platform: I
- Seismicity, focal mechanism, and stress tensor analysis of the Simav region, western Turkey
- Application of simulated annealing algorithm for 3D coordinate transformation problem solution
- Application of the terrestrial laser scanner in the monitoring of earth structures
- The Cretaceous igneous rocks in southeastern Guangxi and their implication for tectonic environment in southwestern South China Block
- Pore-scale gas–water flow in rock: Visualization experiment and simulation
- Assessment of surface parameters of VDW foundation piles using geodetic measurement techniques
- Spatial distribution and risk assessment of toxic metals in agricultural soils from endemic nasopharyngeal carcinoma region in South China
- An ABC-optimized fuzzy ELECTRE approach for assessing petroleum potential at the petroleum system level
- Microscopic mechanism of sandstone hydration in Yungang Grottoes, China
- Importance of traditional landscapes in Slovenia for conservation of endangered butterfly
- Landscape pattern and economic factors’ effect on prediction accuracy of cellular automata-Markov chain model on county scale
- The influence of river training on the location of erosion and accumulation zones (Kłodzko County, South West Poland)
- Multi-temporal survey of diaphragm wall with terrestrial laser scanning method
- Functionality and reliability of horizontal control net (Poland)
- Strata behavior and control strategy of backfilling collaborate with caving fully-mechanized mining
- The use of classical methods and neural networks in deformation studies of hydrotechnical objects
- Ice-crevasse sedimentation in the eastern part of the Głubczyce Plateau (S Poland) during the final stage of the Drenthian Glaciation
- Structure of end moraines and dynamics of the recession phase of the Warta Stadial ice sheet, Kłodawa Upland, Central Poland
- Mineralogy, mineral chemistry and thermobarometry of post-mineralization dykes of the Sungun Cu–Mo porphyry deposit (Northwest Iran)
- Main problems of the research on the Palaeolithic of Halych-Dnister region (Ukraine)
- Application of isometric transformation and robust estimation to compare the measurement results of steel pipe spools
- Hybrid machine learning hydrological model for flood forecast purpose
- Rainfall thresholds of shallow landslides in Wuyuan County of Jiangxi Province, China
- Dynamic simulation for the process of mining subsidence based on cellular automata model
- Developing large-scale international ecological networks based on least-cost path analysis – a case study of Altai mountains
- Seismic characteristics of polygonal fault systems in the Great South Basin, New Zealand
- New approach of clustering of late Pleni-Weichselian loess deposits (L1LL1) in Poland
- Implementation of virtual reference points in registering scanning images of tall structures
- Constraints of nonseismic geophysical data on the deep geological structure of the Benxi iron-ore district, Liaoning, China
- Mechanical analysis of basic roof fracture mechanism and feature in coal mining with partial gangue backfilling
- The violent ground motion before the Jiuzhaigou earthquake Ms7.0
- Landslide site delineation from geometric signatures derived with the Hilbert–Huang transform for cases in Southern Taiwan
- Hydrological process simulation in Manas River Basin using CMADS
- LA-ICP-MS U–Pb ages of detrital zircons from Middle Jurassic sedimentary rocks in southwestern Fujian: Sedimentary provenance and its geological significance
- Analysis of pore throat characteristics of tight sandstone reservoirs
- Effects of igneous intrusions on source rock in the early diagenetic stage: A case study on Beipiao Formation in Jinyang Basin, Northeast China
- Applying floodplain geomorphology to flood management (The Lower Vistula River upstream from Plock, Poland)
- Effect of photogrammetric RPAS flight parameters on plani-altimetric accuracy of DTM
- Morphodynamic conditions of heavy metal concentration in deposits of the Vistula River valley near Kępa Gostecka (central Poland)
- Accuracy and functional assessment of an original low-cost fibre-based inclinometer designed for structural monitoring
- The impacts of diagenetic facies on reservoir quality in tight sandstones
- Application of electrical resistivity imaging to detection of hidden geological structures in a single roadway
- Comparison between electrical resistivity tomography and tunnel seismic prediction 303 methods for detecting the water zone ahead of the tunnel face: A case study
- The genesis model of carbonate cementation in the tight oil reservoir: A case of Chang 6 oil layers of the Upper Triassic Yanchang Formation in the western Jiyuan area, Ordos Basin, China
- Disintegration characteristics in granite residual soil and their relationship with the collapsing gully in South China
- Analysis of surface deformation and driving forces in Lanzhou
- Geochemical characteristics of produced water from coalbed methane wells and its influence on productivity in Laochang Coalfield, China
- A combination of genetic inversion and seismic frequency attributes to delineate reservoir targets in offshore northern Orange Basin, South Africa
- Explore the application of high-resolution nighttime light remote sensing images in nighttime marine ship detection: A case study of LJ1-01 data
- DTM-based analysis of the spatial distribution of topolineaments
- Spatiotemporal variation and climatic response of water level of major lakes in China, Mongolia, and Russia
- The Cretaceous stratigraphy, Songliao Basin, Northeast China: Constrains from drillings and geophysics
- Canal of St. Bartholomew in Seča/Sezza: Social construction of the seascape
- A modelling resin material and its application in rock-failure study: Samples with two 3D internal fracture surfaces
- Utilization of marble piece wastes as base materials
- Slope stability evaluation using backpropagation neural networks and multivariate adaptive regression splines
- Rigidity of “Warsaw clay” from the Poznań Formation determined by in situ tests
- Numerical simulation for the effects of waves and grain size on deltaic processes and morphologies
- Impact of tourism activities on water pollution in the West Lake Basin (Hangzhou, China)
- Fracture characteristics from outcrops and its meaning to gas accumulation in the Jiyuan Basin, Henan Province, China
- Impact evaluation and driving type identification of human factors on rural human settlement environment: Taking Gansu Province, China as an example
- Identification of the spatial distributions, pollution levels, sources, and health risk of heavy metals in surface dusts from Korla, NW China
- Petrography and geochemistry of clastic sedimentary rocks as evidence for the provenance of the Jurassic stratum in the Daqingshan area
- Super-resolution reconstruction of a digital elevation model based on a deep residual network
- Seismic prediction of lithofacies heterogeneity in paleogene hetaoyuan shale play, Biyang depression, China
- Cultural landscape of the Gorica Hills in the nineteenth century: Franciscean land cadastre reports as the source for clarification of the classification of cultivable land types
- Analysis and prediction of LUCC change in Huang-Huai-Hai river basin
- Hydrochemical differences between river water and groundwater in Suzhou, Northern Anhui Province, China
- The relationship between heat flow and seismicity in global tectonically active zones
- Modeling of Landslide susceptibility in a part of Abay Basin, northwestern Ethiopia
- M-GAM method in function of tourism potential assessment: Case study of the Sokobanja basin in eastern Serbia
- Dehydration and stabilization of unconsolidated laminated lake sediments using gypsum for the preparation of thin sections
- Agriculture and land use in the North of Russia: Case study of Karelia and Yakutia
- Textural characteristics, mode of transportation and depositional environment of the Cretaceous sandstone in the Bredasdorp Basin, off the south coast of South Africa: Evidence from grain size analysis
- One-dimensional constrained inversion study of TEM and application in coal goafs’ detection
- The spatial distribution of retail outlets in Urumqi: The application of points of interest
- Aptian–Albian deposits of the Ait Ourir basin (High Atlas, Morocco): New additional data on their paleoenvironment, sedimentology, and palaeogeography
- Traditional agricultural landscapes in Uskopaljska valley (Bosnia and Herzegovina)
- A detection method for reservoir waterbodies vector data based on EGADS
- Modelling and mapping of the COVID-19 trajectory and pandemic paths at global scale: A geographer’s perspective
- Effect of organic maturity on shale gas genesis and pores development: A case study on marine shale in the upper Yangtze region, South China
- Gravel roundness quantitative analysis for sedimentary microfacies of fan delta deposition, Baikouquan Formation, Mahu Depression, Northwestern China
- Features of terraces and the incision rate along the lower reaches of the Yarlung Zangbo River east of Namche Barwa: Constraints on tectonic uplift
- Application of laser scanning technology for structure gauge measurement
- Calibration of the depth invariant algorithm to monitor the tidal action of Rabigh City at the Red Sea Coast, Saudi Arabia
- Evolution of the Bystrzyca River valley during Middle Pleistocene Interglacial (Sudetic Foreland, south-western Poland)
- A 3D numerical analysis of the compaction effects on the behavior of panel-type MSE walls
- Landscape dynamics at borderlands: analysing land use changes from Southern Slovenia
- Effects of oil viscosity on waterflooding: A case study of high water-cut sandstone oilfield in Kazakhstan
- Special Issue: Alkaline-Carbonatitic magmatism
- Carbonatites from the southern Brazilian Platform: A review. II: Isotopic evidences
- Review Article
- Technology and innovation: Changing concept of rural tourism – A systematic review