New approach of clustering of late Pleni-Weichselian loess deposits (L1LL1) in Poland
-
Marcin Krawczyk
 und
Małgorzata Wieczorek
und
Małgorzata Wieczorek

Abstract
The results of grain size distribution of loess units are suitable for the study of past climate change. There are many methods for the analysis of the grain size, but clustering methods have not been used before. In this article, a new approach in the sediment research, the k-median method was used. This method separates the grain size classes of the youngest loess units of three loess-soil profiles in Poland: Biały Kościół, Złota and Tyszowce. In the analysis, only the content for the loess silt fraction (range from 4 to 63 µm) was used. This allowed eliminating the admixtures of sandy and clay fraction, considered as secondary material. For the purposes of this analysis, silt fractions were divided into smaller units using a 1/4 phi interval, resulting in 16 new subfractions. The grain size data from three profiles were combined into one data set. As a result, four classes with a similar internal of grain structure were obtained. The separated classes showed the sedimentological variability of the sediment well. It has been shown that the k-median method can be used to classify loess in a fast and objective way.
1 Introduction
Loess-paleosol sequences are well suited for studying the past climate change. Unfortunately, in most cases, sediment properties cannot be related to a single process. An important condition for extracting climatic signals from sediments and for further reconstruction of signal-related processes is to study their contemporary spatial variability. The observable properties of the loess material are the result of the interaction of many processes. Depending on their genesis (e.g., soil processes), changes in the original material should show similar characteristics. Therefore, the paleoenvironmental processes save a specific trace in the sediments, which allows them to correlate with each other. For example, during cold and dry climatic conditions that allowed the transport and the sedimentation of the dust fraction, levels of homogeneous loess have been formed. Changing these conditions to more humid and warmer is marked by a change in the grain size distribution and an increase in the proportion of finer fractions by weathering or soil formation. Therefore, the properties of individual archives are not sufficient to decrypt information related to the process or processes responsible for their creation. Thus, with this type of analysis, a wider, regional research area should be considered, not closing to smaller areas showing only local features of the sediments.
Until now loess-paleosol sequences were mainly treated as individual archives, in which the results provided information on local paleoenvironmental conditions. Studies comparing the grain size results in a broader context are still rare. Research covering Central Europe and Central, Eastern and North-West Asia was conducted by Vandenberghe [1]. He attempted to define the characteristic grain size distribution for specific aeolian sediments and to assign them appropriate conditions as well as transport and deposition processes. For this purpose, a combination of visual analysis of grain size distribution curves and the statistical end member analysis (EMMA) was used. The EMMA analysis has proved to be particularly useful for multimodal distributions, whose interpretation is usually qualitative and successful only when subpopulations clearly differ from each other. The EMMA method allows for a quantitative and objective character of the analysis. However, the result of this analysis is to obtain a specific end member that corresponds to the specific grain size.
The aim of this article is to introduce and check the operation of the objective and automatic clustering method of the loess grain structure. The key was to check the sensitivity of the method to the distribution of data. An important element was the selection of the optimal number of clusters in terms of statistics and checking whether the algorithm can work independently or whether it should be treated as a tool supporting the expert knowledge. Another element was whether the division used corresponds to other methods used in profiles research so far. For the statistical separation of classes, the k-median method was used. This method is highly suitable for the multidimensional data, such as grain size results. The k-median method is easy, fairly quick, and universal. It was used in the morphometric analysis [2,3,4] and climate research [5], in search of missing people [6] or in the analysis of depopulation processes [7]. Bhargavi and Jyothi [8] used it to classify soil texture based on soil granulometric properties. The result of the analysis is used to identify ten classes of soil texture. The authors point to the advantages of the method such as its simplicity and systematic structure. The authors of this article made similar observations.
The analysis was limited to the grain size characteristics of the late Pleni-Weichselian loess (L1LL1 according to [9]), least transformed by postsedimentation processes. In the analysis, only the content “typical” for the loess silt fraction (range from 4 to 63 µm) was used. This allowed eliminating the admixtures of sandy and clay fraction, considered as a secondary material. Clay fraction is mainly the result of postdeposition processes. However, the fine sand subfraction is rare in the profiles. Coarser sands are more common, which are certainly associated with the recycled material. For the purposes of the analysis, silt fractions were divided into smaller units using a 1/4 phi interval, resulting in 16 new subfractions.
2 Regional setting
Polish loess covers the central area of the northern loess zone in Europe (Figure 1). Due to their transitional location, they are among the most interesting on the continent [10,22]. The authors dealing with problems of loess in Poland suggest that the development of loess covers reflects the contemporary and Pleistocene features of Poland’s climate: continental in the east and more oceanic in the west [12,13]. This study compares the results of the grain size distribution of L1LL1 loess units of three loess-soil sequences: Biały Kościół (Niemcza-Strzelin Hills), Złota (Sandomierz Upland) and Tyszowce (Sokal Plateau-Ridge). These profiles have been repeatedly analyzed, and the results of these analyses are available in many publications (e.g., [11,14,15,16,17,18,19]). The key element of selection was also the presence of late Pleni-Weichselian loess units and their availability.
![Figure 1 Distribution of loess covers in Poland (modified according to refs. [10,12]).](/document/doi/10.1515/geo-2020-0044/asset/graphic/j_geo-2020-0044_fig_001.jpg)
2.1 Biały Kościół
The loess section in the vicinity of the village Biały Kościół (λ = 17°01′30″E, φ = 50°43′30″N, 193 m a.s.l.) is composed of 9 m interfluve and slope loess facies. The loess profile is situated on the west slope of the Oława river valley at an altitude of approximately 185 m a.s.l. in an old loam pit (Figure 2).
![Figure 2 Location (a) and litological description (b) of Biały Kościół L1LL1 unit (lithological description modified according to ref. [23]).](/document/doi/10.1515/geo-2020-0044/asset/graphic/j_geo-2020-0044_fig_002.jpg)
Location (a) and litological description (b) of Biały Kościół L1LL1 unit (lithological description modified according to ref. [23]).
The loess cover in the surrounding area was previously described by Ciszek [20]. The complete loess-soil sequence at Biały Kościół has been excavated and characterized by Ciszek et al. [21].
The results of the multidisciplinary research have been published in numerous scientific papers. A palaeogeographic interpretation was provided by Jary [10,22]. A chronological framework for this site was established by Moska et al. [15,16]. Grain size characteristics of loess sediments were presented by Krawczyk et al. [23]. The stratigraphic and spatial aspects of the differentiation of the chemical composition of this sequence were presented by Skurzyński et al. [24].
2.2 Złota
The investigated loess section is located in the south-eastern part of Poland in the Vistula river valley (21°39′E, 50°39′N), about 20 m above the current level of water. The section was discovered in 2010 in the Złota village on the northern side of the valley. The thickness of the loess cover in this area exceeds 12 m, and the altitude of this place is approximately 170 m a.s.l. (Figure 3). Another loess site, Samborzec, known since the 1980s, is located at a distance of about 100 m westward at the excavation site of former brickworks.
![Figure 3 Location (a) and litological description (b) of Złota L1LL1 unit (lithological description modified according to ref. [29]).](/document/doi/10.1515/geo-2020-0044/asset/graphic/j_geo-2020-0044_fig_003.jpg)
Location (a) and litological description (b) of Złota L1LL1 unit (lithological description modified according to ref. [29]).
The site was first described by Grygierczyk and Waga [14]. The site was further investigated by Dolecki and Łanczont [25,26], who used the name Polanów Samborzecki. A palaeopedological description of this site was provided by Konecka-Betley et al. [27], and a palaeogeographical interpretation of micromorphological features of the loess-soil sequence was presented by Mroczek [18,28]. The characteristics of the site based on multidisciplinary investigations were published by Jary [10]. A chronological framework for this site was established by Moska et al. [29].
2.3 Tyszowce
The Tyszowce loess section (λ = 23°42′45″E, φ = 50°36′30″N) is located in the northern part of the Sokal Plateau-Ridge (Figure 4), which is the westernmost part of the Volhynia Upland [15,30]. The Sokal Plateau-Ridge is a latitudinal cretaceous hump with a thick loess cover [31]. From the north and south, the region is limited by distinct morphological edges to over 10 m high [32]. The loess sequence in Tyszowce is located at the height of 226 m a.s.l. in the northern margin of loess cover, close to the Huczwa River, about 30 m above the modern valley bottom.
![Figure 4 Location (a) and litological description (b) of Tyszowce L1LL1 unit (lithological description modified according to ref. [19]).](/document/doi/10.1515/geo-2020-0044/asset/graphic/j_geo-2020-0044_fig_004.jpg)
Location (a) and litological description (b) of Tyszowce L1LL1 unit (lithological description modified according to ref. [19]).
The loess deposits at an active brickyard locally reach a thickness of 20 m. The stratigraphy and the palaeoenvironmental interpretation of neighboring loess-paleosol profiles in Tyszowce have been presented several times in Polish literature [17,19,32,33].
3 Methods
Research on the profiles can be divided into three basic stages.
3.1 Field work
Field study consisted of careful cleaning of the profile walls, descriptions and sampling for analysis. Before describing the profiles and sampling, the profile walls were carefully cleaned to expose fresh material. After that the lithological description was prepared. All of these profiles were sampled in vertical continuous sections at close intervals (5 cm) and documented with respect to their sedimentology, paleopedology and stratigraphy.
3.2 Laboratory investigations
Grain size distributions were determined by using a laser diffractometer Mastersizer 2000 (manufactured by Malvern, England) in Soil Laboratory of Department of Physical Geography, University of Wrocław. Before the measurement, organic matter was removed by H2O2 and carbonates by 10% HCl. For better dispersion, sodium hexametaphosphate (calgon) was added to the solution before measurement.
In the analysis, only the silt content (4–63 µm) was used. The fractions were divided into smaller units using a 1/4 phi interval, resulting in 16 new subfractions.
3.3 Statistical analysis – the k-median method
The authors searched for a method that provides an analysis of variables collectively, not separately. Therefore, a method that can be used in a multidimensional analysis was needed. Clustering is defined as a process of separating data into clusters (groups) of similar types using some physical or quantitative measures [34]. An iterated k-median method is one of the clustering methods that divided the data in the disjoint groups (clusters). It is an unsupervised method. The same rules as for the k-mean method apply, but the centre of a cluster is determined by using the median instead of the mean function. The standard k-means method divides a multidimensional set of data into k clusters in the way that the patterns in a cluster are more similar to each other than to patterns in different clusters.
The advantage of this method is the independence from the distribution of data, and it means normal distribution of data is not required. This is very important in the classification of granulometric data, which does not have a normal distribution, and its distribution is not even symmetrical. The k-median method is robust to outliers and results in compact clusters, while the k-mean is easily affected by outliers. Each variable has the same impact in this clustering. An additional advantage is the possibility of clustering in any number of dimensions, i.e., for many variables at once.
The number of clusters is selected a priori [35], whhic could be a problem if the nature of set of data is not known. Different initial partitions can lead to different finial clusters because the algorithm is based on the square-error and can converge to local minima. Therefore, to obtain an optimal solution, several runs must be executed with different initial partitions [36,37]. Usually clustering is done for different k values, and then, the optimal solution is chosen from the statistical point of view or based on the expert knowledge.
Taking into account the aforementioned advantages, universality and objectivity of the method and the statistical distribution of granulation data, the authors decided to use the k-median method to isolate clusters with similar granulation characteristics. In this study, the cluster analysis was performed using Canal software that was specially prepared for clustering, and this was also followed in the previous studies [2,3,5].
4 Results
For the correct separation of grain size classes, the grain size results of younger L1LL1 loess in three selected loess-soil sequences have been combined to form one common granulometric database. The data set was classified into three to six classes (Table 1). The obtained statistical parameters (BSS/k) gave very similar results. However, after running the program several times, the result for the subdivision of the database into four groups gave the same value 3.82 all the time. Hence, we considered this division to be the most powerful and optimal in terms of interpretation. Taking into account statistical criteria and expert knowledge, the optimal division was considered to be into four classes. They are characterized by a similar internal grain structure. The results of the analysis are shown in Figure 5.
Results of k-median analysis
| k – number of clusters | BSS – parameter between cluster sum of squares | BSS/k |
|---|---|---|
| 3 | 11.22 | 3.74 |
| 4 | 15.27 | 3.82 |
| 5 | 19.40 | 3.88 |
| 6 | 23.82 | 3.97 |
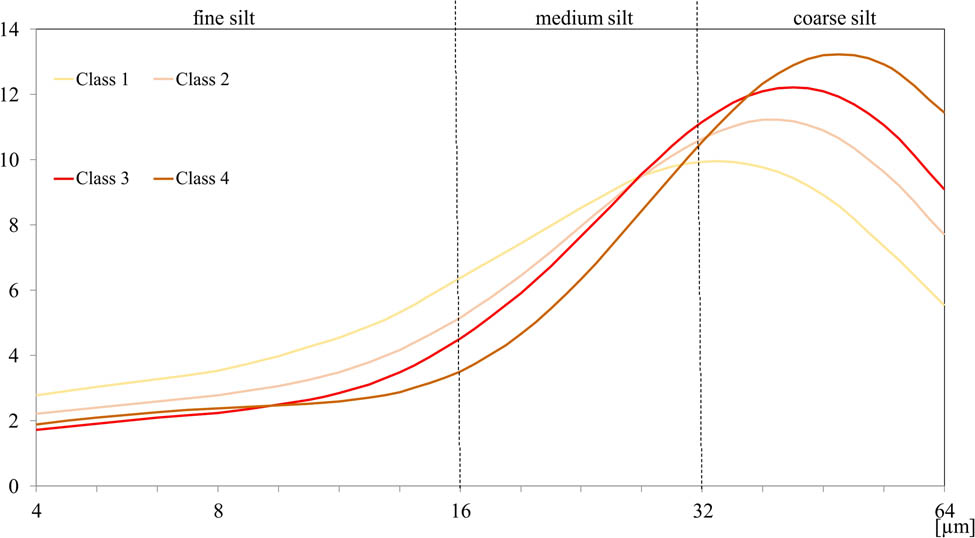
Distribution of grain size of four separated groups by the k-median method.
The first class (Figure 5.) is characterized by the highest content of fine and medium silt fractions (below 32 µm). The shape of the class chart shows the largest flattening relative to the others. The total number of samples included in this group is 81, and this is the least numerous class. Most samples from class 1 are included in the Tyszowce sequence – over 50% all occurring (Table 2).
The number and share of samples in classes in particular analyzed loess sites
| Name of class | Total number | Biały Kościół | Tyszowce | Złota | Biały Kościół % | Tyszowce % | Złota % |
|---|---|---|---|---|---|---|---|
| Class 1 | 81 | 18.0 | 46.0 | 17.0 | 22.2 | 56.8 | 21.0 |
| Class 2 | 137 | 18.0 | 88.0 | 31.0 | 13.1 | 64.2 | 22.6 |
| Class 3 | 165 | 41.0 | 39.0 | 85.0 | 24.8 | 23.6 | 51.5 |
| Class 4 | 83 | — | 80.0 | 3.0 | 0.0 | 96.4 | 3.6 |
The second class, unlike class 1, is characterized by a slight shift in the grain mode toward coarse silt (38 µm level). The graph is less flattened (Figure 5). The content of fine silt is also lower. The number of samples in this class is 137, of which again the largest percentage of them occurs in the profile in Tyszowce – over 60%.
Class 3 is the most common class in results. The course of the curve is similar to that in class 2; however, the content of coarse silt is much higher. This group occurs primarily in the loess-soil sequence in Złota (share over 50%).
Class 4 is distinguished from the others by the largest proportion of coarse silt with a small percentage of fine silt. It appears almost entirely in the profile in Tyszowce (over 90%; Table 2).
The results of k-median analysis were compared with the lithological figure of L1LL1 loess-soil sequence in the Biały Kościół and for the distribution of the particle size of the silt subfraction (Figure 6). Over 50% of all tested samples belong to in class 3 (Table 3). This class occurs in the upper part of the described unit, in the place of homogeneous loess (Figure 2). The lower part of the profile (below 3 m) consists mainly of samples qualified for groups 1 and 2. Group 1 occurs at the site with the highest content of fine dust fractions. At this place, a profile of the gley horizon is clearly visible. Above and below the horizons of laminated loess with gley spots are differentiated (Figure 2).
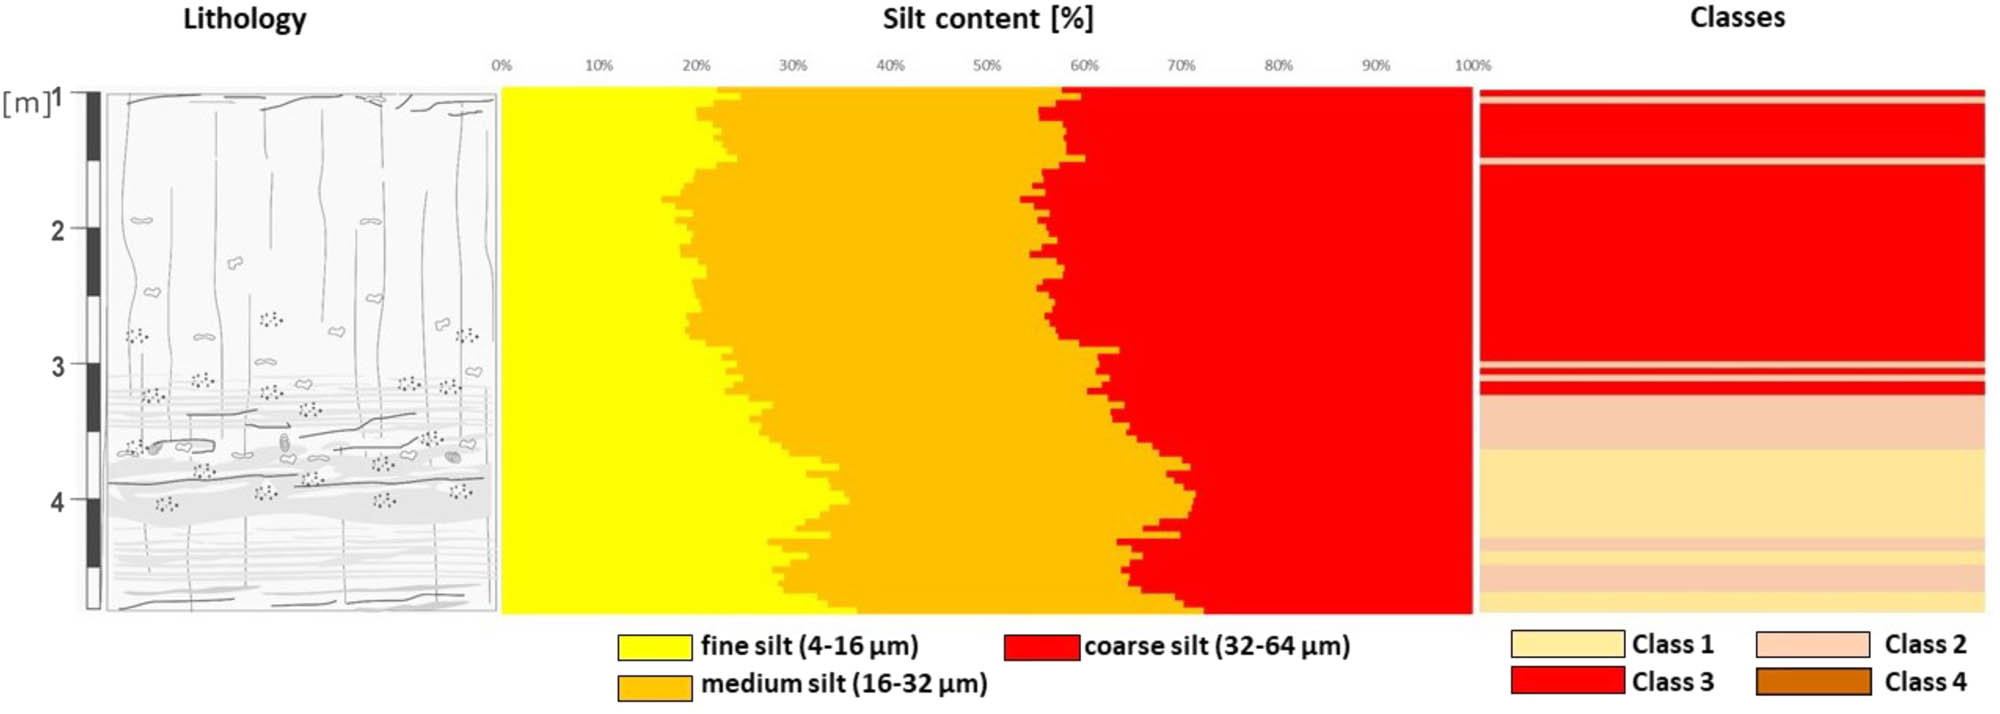
Lithology, k-median classes and silt subpopulation content of L1LL1 unit of Biały Kościół loess-soil sequence.
Class participation in L1LL1 units as a percentage in particular analyzed loess sites
| Name of class | Biały Kościół % | Tyszowce % | Złota % |
|---|---|---|---|
| Class 1 | 23.4 | 18.2 | 12.5 |
| Class 2 | 23.4 | 34.8 | 22.8 |
| Class 3 | 53.2 | 15.4 | 62.5 |
| Class 4 | — | 31.6 | 2.2 |
Samples from these levels are characteristic of class 2. This class is characterized by a significant content of fine silt, slightly less than in class 1. The content of both classes in the profile is the same and amounts to 23.4% (Table 3). Class 4 is not distinguished in the described sequence.
The results of the k-median analysis compared to the lithological figure and the content of the silt subfraction for the L1LL1 unit of the loess-soil sequence in Złota are shown in Figure 7. This sequence has the largest class 3 share compared to the other profiles. As mentioned earlier, over 50% of all samples qualified for class 3 comes from this profile (Table 2). In the L1LL1 unit in Złota, class 3 constitutes over 60% (Table 2). The upper part of the unit (0–5 m) consists of samples classified mainly as class 3. This part of the unit also distinguishes levels classified to other classes in the form of sandy and gley inserts. In places of weak gley horizons (Figure 3), class 2 is distinguished, and in sandy laminates, class 4 is distinguished. The lower part of the L1LL1 loess-soil sequence unit in Złota is built of a tundra gley horizon. The material from this place was qualified for class 1.
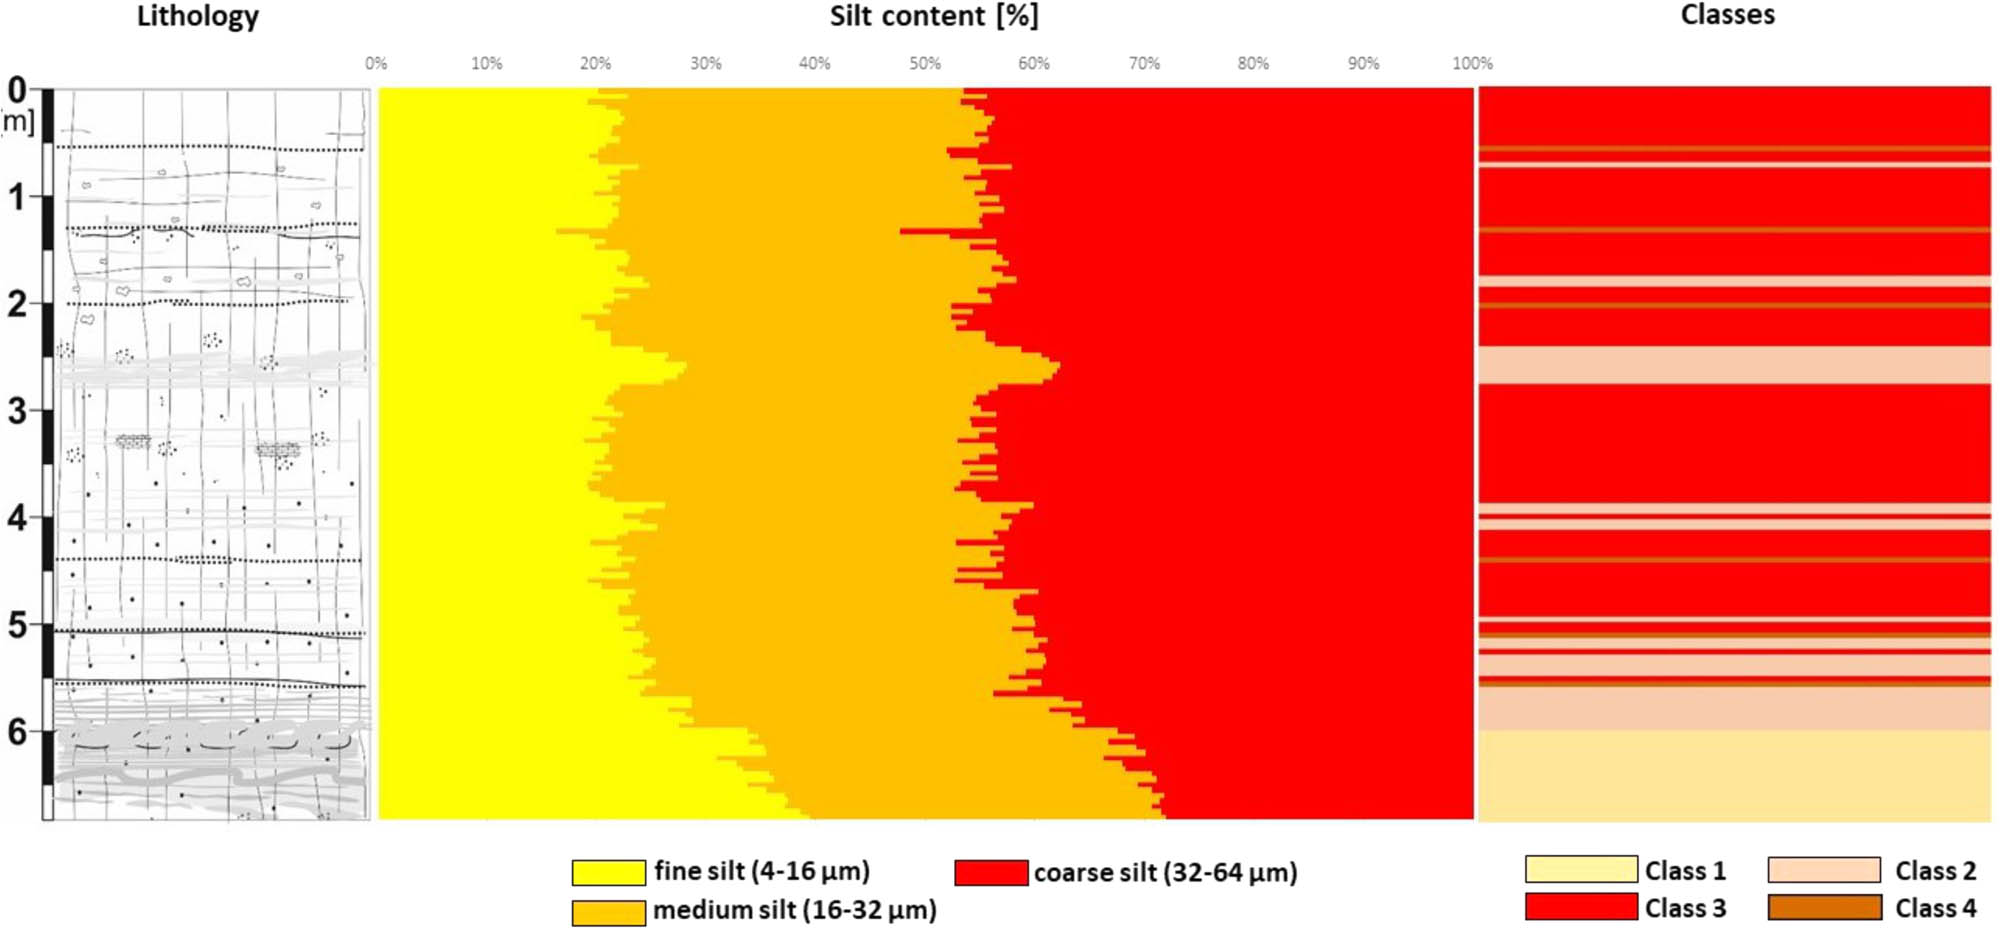
Lithology, k-median classes and silt subpopulation content of L1LL1 unit of Złota loess-soil sequence.
The loess-soil sequence in Tyszowce is characterized by the thickest L1LL1 unit (over 12 m) compared to other profiles. The results of the analysis are shown in Figure 8. The upper part of the L1LL1 unit consists mainly of sandy loess with clear, continuous sandy laminates (Figure 4). As a result of the algorithm, this part of the profile (up to approximatley 5.5 m) was mostly assigned to class 4, which almost entirely occurs only in this unit.
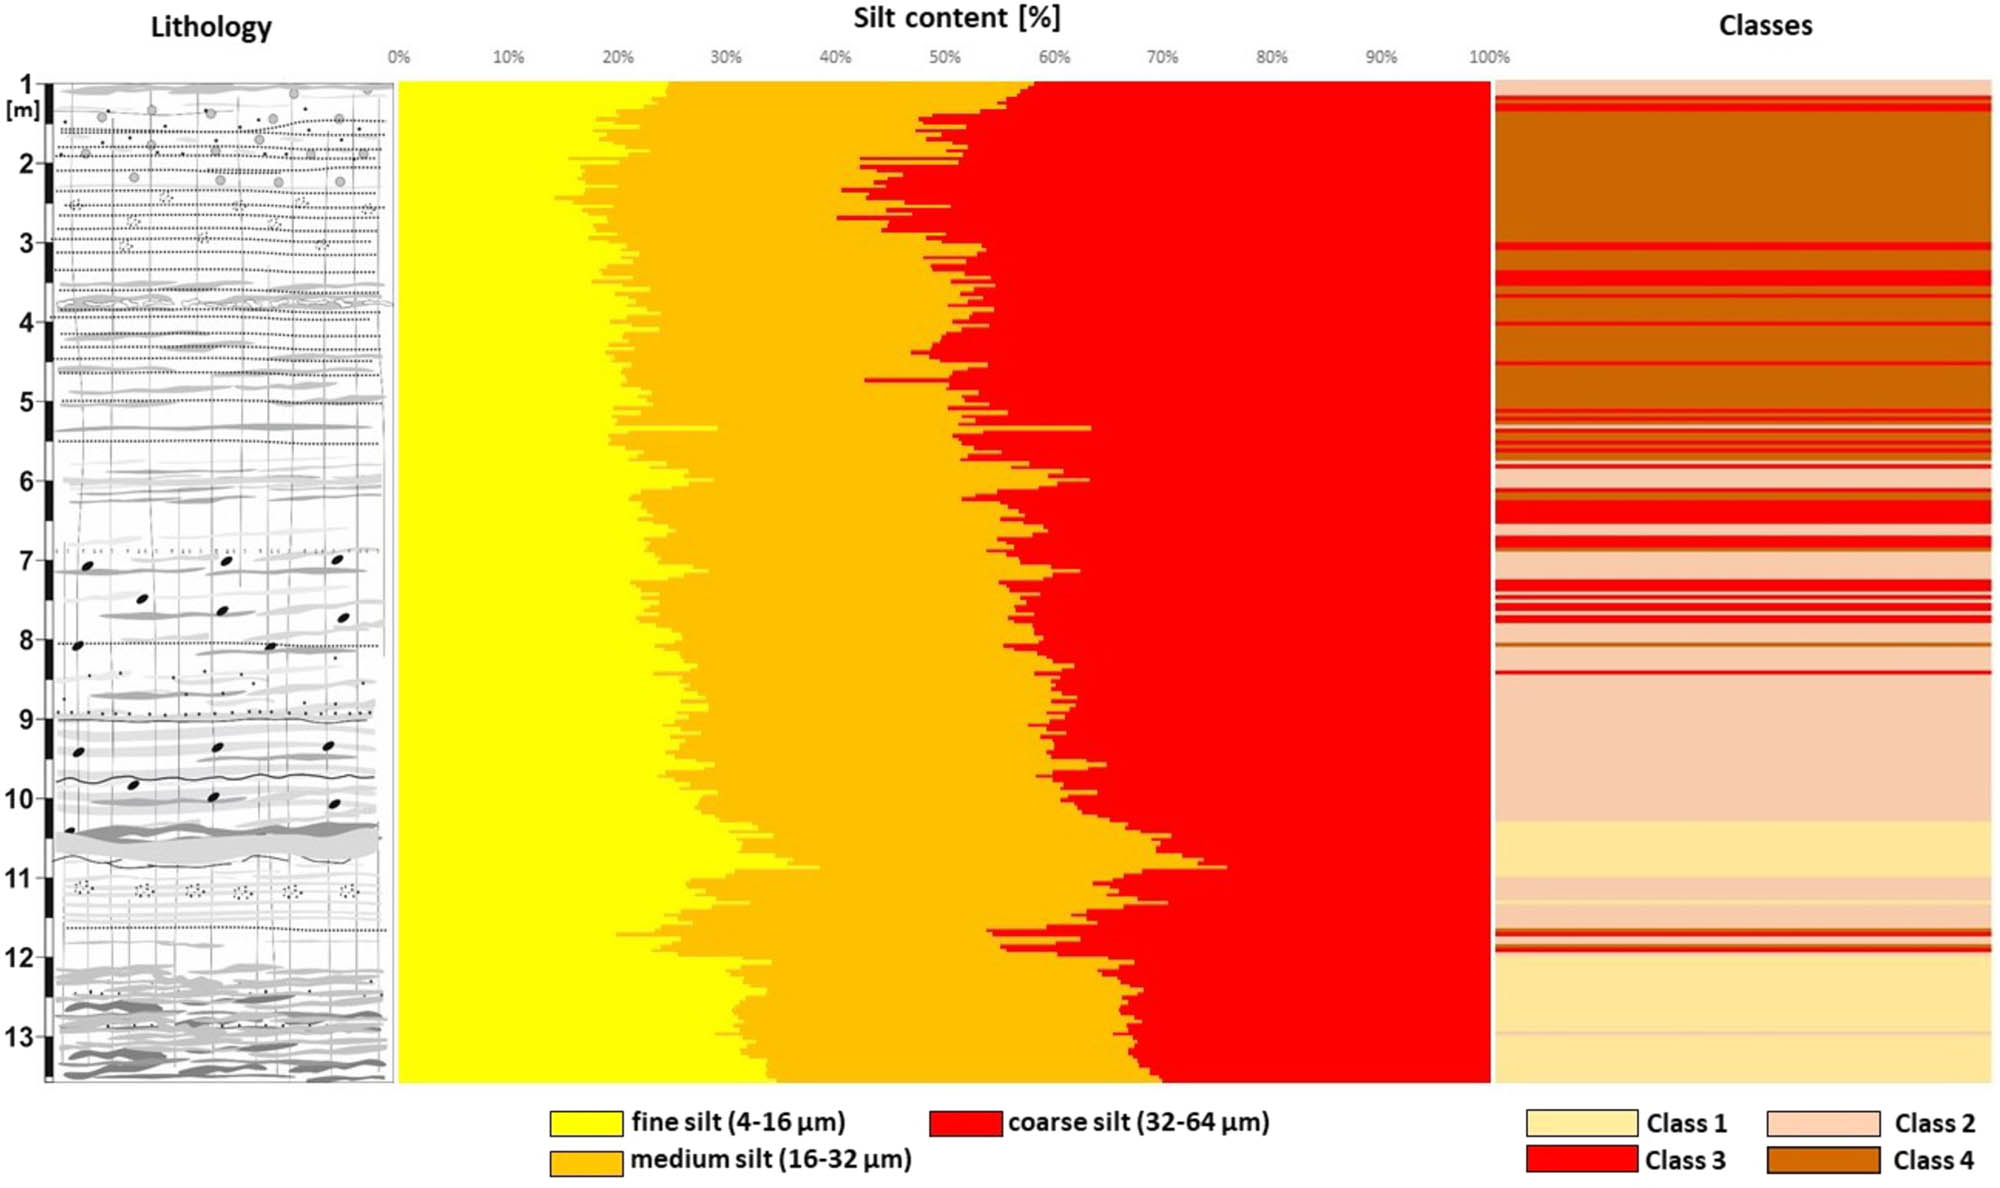
Lithology, k-median classes and silt subpopulation content of L1LL1 unit of Tyszowce loess-soil sequence.
The middle part of the unit (from 6 to 10.5 m) is classified mostly as class 2, with several levels qualified a class 3 in the upper part of the described level. During fieldwork in this part of the profile, the occurrence of streaked loess and several weak gley horizons (Figure 4) was distinguished. The two best-preserved tundra-gley horizons are described at a depth of 10.5 m and below 12 m. These are the levels with the highest content of fine silt fraction, a characteristic of this type of horizon. In both cases, the material analyzed was classified into class 1.
5 Summary and conclusion
The separated four classes correctly describe the sedimentological variability of loess units. Class 1 occurred primarily in places with the largest share of the finest fractions. At these levels of tundra, gley horizons have been distinguished. Class 2 was distinguished in places of gleyed or laminated loess. The fraction of fine siltis is significant here, which is lower than in class 1. Both classes are usually close together. They constitute a significant share in L1LL1 units in the Biały Kościół and Tyszowce (Table 3). They occur close to the L1SS1 (description of the unit accordint to Ref. [9]) fossil soil distinguished in both profiles correlated with MIS 3 [23,17]. This material had to be strongly transformed as a result of postdeposition processes, as indicated by earlier analyzes [10,18,23,24]. The result of these transformations is the specific internal grain structure represented by these classes. In places of homogeneous loess, class 3 has been indicated. It is the characteristic of loess units with the highest content of medium silt, and above all coarse silt. The best example is the L1LL1 unit in Złota (Figure 7), where this class is the clear majority. The upper part of the mentioned unit is described as an example of loess without a clearly marked structure as noted in the previous studies [11,14]. In its structure, there were often individual samples classified in class 4. In these places, levels with the highest proportion of coarse silt fraction were distinguished. Analyzing lithological figures and the description of the unit, these were often the places of occurrence of sandy laminas or levels of sandy loess. Such features characterize the unit of the late Pleni-Weichselian loess in Tyszowce. Its upper part is clearly enriched with material made of a sandy fraction [11,12,19]. Such a large supply of this fraction had to indicate rapid sedimentation from close sources of material [1] as indicated by the obtained dating results [17]. The common database and the algorithm allow even individual samples that were present in a larger structure of another class.
The database was created by combining the grain size results of three L1LL1 units treated comprehensively. The algorithm, not including the depth, allowed the designation of classes without fear of the impact of data neighborhood.
The advantage of the method used is the ability to analyze a multidimensional database regardless of the statistical distribution. It was possible to use the data divided into 16 subfractions instead of the classic division of the silt fraction. By increasing the resolution, the interpretation capabilities of the results have increased significantly.
The weakness of the classification method is the difficulty in choosing the appropriate number of classes that allow objective analysis and interpretability of the results. For the proper analysis, it is necessary to have specific knowledge about the analyzed area and material. This is not a fully deterministic method. It does not guarantee to obtain exactly the same division when you restart the algorithm. However, by running it multiple times and based on the maximum of between cluster sum of square, the separation error is negligible.
To sum up, the k-median method can be used to easily classify aeolian sediments such as loess. However, more tests are needed to minimize weaknesses. Further activities on the development of the method will assume taking into account the higher resolution of the database (sample interval from 5 to 1 cm). As mentioned earlier, the separated classes showed the sedimentological variability of the sediment well. Future research should focus on linking a given class to environmental conditions that shape the specific internal structure of the granulation.
References
[1] Vandenberghe J. Grain size of fine-grained windblown sediment: a powerful proxy for process identification. Earth Sci Rev. 2013;121:18–30. 10.1016/j.earscirev.2013.03.001.Suche in Google Scholar
[2] Wieczorek M. An influence of spatial range of input data set on terrain relief form classification homogeneity for glacial area. In: Ruas A, editor. Advances in Cartography and GIScience, Vol. 2 Selection from ICC. Paris: Springer; 2011. p. 357–69. 10.1007/978-3-642-19143-5.Suche in Google Scholar
[3] Wieczorek M, Migoń P. Automatic relief classification versus expert and field based classification for the medium altitude mountain range, the Sudetes, SW Poland. Geomorphology. 2014;206:133–46. 10.1016/j.geomorph.2013.10.005.Suche in Google Scholar
[4] Szypuła B, Wieczorek M. Geomorphometric relief classification with the k-median method in the Silesian Upland, southern Poland. Front Earth Sci. 2019;14:152–70. 10.1007/s11707-019-0765-9.Suche in Google Scholar
[5] Szymanowski M, Wieczorek M, Namyślak M, Kryza M, Migała K. Spatio-temporal changes in atmospheric precipitation over south-western Poland between the periods 1891–1930 and 1981–2010. Theor Appl Climatol. 2019;135(1–2):505–18. 10.1007/s00704-018-2376-x.Suche in Google Scholar
[6] Niedzielski T, Jurecka M, Stec M, Wieczorek M, Miziński B. The nested k-means method: a new approach for detecting lost persons in aerial images acquired by unmanned aerial vehicles. J Field Robot. 2017;34:1–12. 10.1002/rob.21720.Suche in Google Scholar
[7] Latocha A, Szymanowski M, Wieczorek M. Wyludnianie powiatu kłodzkiego – przestrzenne zróżnicowanie i uwarunkowania. Przegląd Geograficzny. 2018;90(2):241–66. 10.7163/PrzG.2018.2.3.Suche in Google Scholar
[8] Bhargavi P, Jyothi S. Fuzzy C-Means Classifier for Soil Data. Int J Comput Appl. 2010;6(4):1–5. Published By Foundation of Computer Science, 10.5120/1071-1400.Suche in Google Scholar
[9] Markovic SB, Stevens T, Kukla GJ, Hambach U, Fitzsimmons KE, Gibbard P, et al. Danube loess stratigraphy – towards a pan-European loess stratigraphic model. Quaternary Sci Rev. 2015;148:228–58. 10.1016/j.earscirev.2015.06.005.Suche in Google Scholar
[10] Jary Z. Zapis zmian klimatu w górnoplejstoceńskich sekwencjach lessowo-glebowych w Polsce i w zachodniej części Ukrainy, (Record of Climate Changes in Upper Pleistocene loess-soil sequences in Poland and western part of Ukraine). Wrocław: Rozprawy Naukowe Instytutu Geografii i Rozwoju Regionalnego Uniwersytetu Wrocławskiego; 2007. p. 136.Suche in Google Scholar
[11] Jary Z, Ciszek D. Late Pleistocene loess-palaeosol sequences in Poland and western Ukraine. Quaternary Int. 2013;296:37–50. 10.1016/j.quaint.2012.07.009.Suche in Google Scholar
[12] Cegła J. Sedymentacja lessów Polski [Loess Sedimentation in Poland], Acta Universitatis Wratislaviensis 168. Studia Geograficzne. 1972;17:72.Suche in Google Scholar
[13] Jersak J. Litologia i stratygrafia lessu wyżyn południowej Polski (Lithology and stratigraphy of the loess on the Southern Polish Uplands). Acta Geograph Lodziensia. 1973;32:139.Suche in Google Scholar
[14] Grygierczyk S, Waga JM. Plejstoceńskie osady w Samborcu koło Sandomierza (The Pleistocene sediments in Samborzec near Sandomierz). Geographia Studia et Disseitationes. 1993;18:49–62.Suche in Google Scholar
[15] Moska P, Adamiec G, Jary Z. High resolution dating of loess profile from Biały Kościół, south-west Poland. Quaternary Geochronol. 2012;10:87–93. 10.1016/j.quageo.2012.04.003.Suche in Google Scholar
[16] Moska P, Adamiec G, Jary Z. OSL dating and lithological characteristics of Loess deposits from Biały Kościół. Geochronometria. 2011;38(2):162–71. 10.2478/s13386-011-0013-x.Suche in Google Scholar
[17] Moska P, Adamiec G, Jary Z, Bluszcz A. OSL chronostratigraphy for loess deposits from Tyszowce – Poland. Geochronometria. 2017;44(1):307–18. 10.1515/geochr-2015-0074.Suche in Google Scholar
[18] Mroczek P. Recycled loesses a micromorphological approach to the determination of local source areas of Weichselian loess. Quaternary Int. 2013;296:241–50. 10.1016/j.quaint.2013.02.040.Suche in Google Scholar
[19] Skurzyński J, Jary Z, Raczyk J, Moska P, Korabiewski B, Ryzner K, et al. Geochemical characterization of the Late Pleistocene loess-palaeosol sequence in Tyszowce (Sokal Plateau-Ridge, SE Poland). Quaternary Int. 2019;502:108–18. 10.1016/j.quaint.2018.04.023.Suche in Google Scholar
[20] Ciszek D. Uwagi o sedymentacji lessów na Wzgórzach Niemczańskich i w Kotlinie Kłodzkiej (Notes on the loess sedimentation in the Niemczańskie Hillsand in the Kłodzko Basin). In: Krzyszkowski D, Przybylski B, editors. Problems of central polish glaciations in south-west Poland. Wrocław: Przewodnik IV Konferencji Stratygrafia Plejstocenu Polski; 1997. p. 161–2.Suche in Google Scholar
[21] Ciszek D, Jary Z, Kida J, Karamanski P. Profil lessowy w Białym Kościele (Wzgórza Niemczańsko-Strzelińskie). In: Jary Z, Kida J, editors. Osady plejstocenskie przedpola Sudetów. XI Seminarium “Korelacja stratygraficzna lessów i utworów lodowcowych Polski i Ukrainy”. Wrocław-Jarnołtówek 23-28.IX.2001: Instytut Geograficzny Uniwersytetu Wrocławskiego; 2001. p. 58–60.Suche in Google Scholar
[22] Jary Z. Loess-soil sequences as a source of climatic proxies: an example from SW Poland. Geologija. 2010;52:40–5. 10.2478/v10056-010-0004-2.Suche in Google Scholar
[23] Krawczyk M, Ryzner K, Skurzyński J, Jary Z. Lithological indicators of loess sedimentation of SW Poland. Contemp Trends Geosci. 2017;6(2):94–111. 10.1515/ctg-2017-0008.Suche in Google Scholar
[24] Skurzyński J, Jary Z, Raczyk J, Moska P, Krawczyk M. Stratygraficzne i przestrzenne aspekty zróżnicowania składu chemicznego późnoplejstoceńskich sekwencji lessowo-glebowych w Polsce – przykłady profili w Tyszowcach i Białym Kościele. (The stratigraphic and spatial aspects of the differentiation of the chemical composition of the late pleistocene loess-palaeosol sequences in Poland – a case study of the Tyszowce and Biały Kościół profiles). Acta Geograph Lodziensia. 2017;106:87–103. 10.26485/AGL/2017/106/7.Suche in Google Scholar
[25] Dolecki L, Łanczont M. Loesses and paleosols of the older part of the Wisla (Würm) glaciation in Poland. Geologija. 1998;25:31–8.Suche in Google Scholar
[26] Dolecki L, Łanczont M. Profil lessów młodszych w Polanówie Samborzeckim kolo Sandomierza (Loess section at Polanów Samborzecki near Sandomierz). In: Maruszczak H, editor. Podstawowe profile lessów w Polsce II. Lublin: Wyd. UMCS; 2001. p. 104–9.Suche in Google Scholar
[27] Konecka-Betley K, Czępińska-Kamińska D, Okołowicz M, Zagórski Z. Pedogenetic processes in palaeosols of the Polanów Samborzecki loesses exposure – vicinity of Sandomierz. Roczniki Gleboznawcze. 2006;57(3–4):151–73 (in Polish with English summary).Suche in Google Scholar
[28] Mroczek P. Interpretacja paleogeograficzna cech mikromorfologicznych neoplejstocenskich sekwencji lessowo-glebowych (The paleogegraphical interpretation of micromorphological features of the Neopleistocene Loess-Paleosol sequences). Lublin: Wydawnictwo UMCS; 2008.Suche in Google Scholar
[29] Moska P, Adamiec G, Jary Z, Bluszcz A, Poręba G, Piotrowska N, et al. Luminescence chronostratigraphy for the loess deposits in Złota, Poland. Geochronometria. 2018;45(1):44–55. 10.1515/geochr-2015-0073.Suche in Google Scholar
[30] Kondracki J. Geografia Regionalna Polsk. Warszawa: PWN; 2002 (In Polish).Suche in Google Scholar
[31] Jahn A. Geomorphology and quaternary history of Lublin Plateau, vol 7. Warszawa: Prace Instytutu Geograficznego PAN; 1956 (in Polish, with English Abstract).Suche in Google Scholar
[32] Wojtanowicz J, Buraczyński J. Materials to the absolute chronology of the loesses of Grzęda Sokalska. Ann Univ Mariae Curie-Skłodowska, Sec B. 1978;30/31(3):37–54 (in Polish, with English abstract).Suche in Google Scholar
[33] Maruszczak H. Fossil soils and the sokal range loess stratigraphy. Annales Universitatis Mariae Curie-Skłodowska, sec B. 1974;26:27–66 (in Polish, with English Abstract).Suche in Google Scholar
[34] Larose DT. Discovering knowledge in data: an introduction to data mininga. Hoboken, NJ: John Wiley & Sons, Inc.; 2005. p. 240.10.1002/0471687545Suche in Google Scholar
[35] Jain AK, Dubes RC. Algorithms for Clustering Data. Englewood Cliff, NJ: Prentice Hall; 1988.Suche in Google Scholar
[36] Pena JM, Lozano JA, Larranaga P. An empirical comparison of four initialization methods for the k-means algorithm. Pattern Recognit Lett. 1999;20:1027–40. 10.1016/S0167-8655(99)00069-0.Suche in Google Scholar
[37] Likas A, Vlassis N, Verbeek JJ. The global k-means clustering algorithm. Pattern Recognit. 2003;36:451–61. 10.1016/S0031-3203(02)00060-2.Suche in Google Scholar
© 2020 Marcin Krawczyk and Małgorzata Wieczorek, published by De Gruyter
This work is licensed under the Creative Commons Attribution 4.0 International License.
Artikel in diesem Heft
- Regular Articles
- The simulation approach to the interpretation of archival aerial photographs
- The application of137Cs and210Pbexmethods in soil erosion research of Titel loess plateau, Vojvodina, Northern Serbia
- Provenance and tectonic significance of the Zhongwunongshan Group from the Zhongwunongshan Structural Belt in China: insights from zircon geochronology
- Analysis, Assessment and Early Warning of Mudflow Disasters along the Shigatse Section of the China–Nepal Highway
- Sedimentary succession and recognition marks of lacustrine gravel beach-bars, a case study from the Qinghai Lake, China
- Predicting small water courses’ physico-chemical status from watershed characteristics with two multivariate statistical methods
- An Overview of the Carbonatites from the Indian Subcontinent
- A new statistical approach to the geochemical systematics of Italian alkaline igneous rocks
- The significance of karst areas in European national parks and geoparks
- Geochronology, trace elements and Hf isotopic geochemistry of zircons from Swat orthogneisses, Northern Pakistan
- Regional-scale drought monitor using synthesized index based on remote sensing in northeast China
- Application of combined electrical resistivity tomography and seismic reflection method to explore hidden active faults in Pingwu, Sichuan, China
- Impact of interpolation techniques on the accuracy of large-scale digital elevation model
- Natural and human-induced factors controlling the phreatic groundwater geochemistry of the Longgang River basin, South China
- Land use/land cover assessment as related to soil and irrigation water salinity over an oasis in arid environment
- Effect of tillage, slope, and rainfall on soil surface microtopography quantified by geostatistical and fractal indices during sheet erosion
- Validation of the number of tie vectors in post-processing using the method of frequency in a centric cube
- An integrated petrophysical-based wedge modeling and thin bed AVO analysis for improved reservoir characterization of Zhujiang Formation, Huizhou sub-basin, China: A case study
- A grain size auto-classification of Baikouquan Formation, Mahu Depression, Junggar Basin, China
- Dynamics of mid-channel bars in the Middle Vistula River in response to ferry crossing abutment construction
- Estimation of permeability and saturation based on imaginary component of complex resistivity spectra: A laboratory study
- Distribution characteristics of typical geological relics in the Western Sichuan Plateau
- Inconsistency distribution patterns of different remote sensing land-cover data from the perspective of ecological zoning
- A new methodological approach (QEMSCAN®) in the mineralogical study of Polish loess: Guidelines for further research
- Displacement and deformation study of engineering structures with the use of modern laser technologies
- Virtual resolution enhancement: A new enhancement tool for seismic data
- Aeromagnetic mapping of fault architecture along Lagos–Ore axis, southwestern Nigeria
- Deformation and failure mechanism of full seam chamber with extra-large section and its control technology
- Plastic failure zone characteristics and stability control technology of roadway in the fault area under non-uniformly high geostress: A case study from Yuandian Coal Mine in Northern Anhui Province, China
- Comparison of swarm intelligence algorithms for optimized band selection of hyperspectral remote sensing image
- Soil carbon stock and nutrient characteristics of Senna siamea grove in the semi-deciduous forest zone of Ghana
- Carbonatites from the Southern Brazilian platform: I
- Seismicity, focal mechanism, and stress tensor analysis of the Simav region, western Turkey
- Application of simulated annealing algorithm for 3D coordinate transformation problem solution
- Application of the terrestrial laser scanner in the monitoring of earth structures
- The Cretaceous igneous rocks in southeastern Guangxi and their implication for tectonic environment in southwestern South China Block
- Pore-scale gas–water flow in rock: Visualization experiment and simulation
- Assessment of surface parameters of VDW foundation piles using geodetic measurement techniques
- Spatial distribution and risk assessment of toxic metals in agricultural soils from endemic nasopharyngeal carcinoma region in South China
- An ABC-optimized fuzzy ELECTRE approach for assessing petroleum potential at the petroleum system level
- Microscopic mechanism of sandstone hydration in Yungang Grottoes, China
- Importance of traditional landscapes in Slovenia for conservation of endangered butterfly
- Landscape pattern and economic factors’ effect on prediction accuracy of cellular automata-Markov chain model on county scale
- The influence of river training on the location of erosion and accumulation zones (Kłodzko County, South West Poland)
- Multi-temporal survey of diaphragm wall with terrestrial laser scanning method
- Functionality and reliability of horizontal control net (Poland)
- Strata behavior and control strategy of backfilling collaborate with caving fully-mechanized mining
- The use of classical methods and neural networks in deformation studies of hydrotechnical objects
- Ice-crevasse sedimentation in the eastern part of the Głubczyce Plateau (S Poland) during the final stage of the Drenthian Glaciation
- Structure of end moraines and dynamics of the recession phase of the Warta Stadial ice sheet, Kłodawa Upland, Central Poland
- Mineralogy, mineral chemistry and thermobarometry of post-mineralization dykes of the Sungun Cu–Mo porphyry deposit (Northwest Iran)
- Main problems of the research on the Palaeolithic of Halych-Dnister region (Ukraine)
- Application of isometric transformation and robust estimation to compare the measurement results of steel pipe spools
- Hybrid machine learning hydrological model for flood forecast purpose
- Rainfall thresholds of shallow landslides in Wuyuan County of Jiangxi Province, China
- Dynamic simulation for the process of mining subsidence based on cellular automata model
- Developing large-scale international ecological networks based on least-cost path analysis – a case study of Altai mountains
- Seismic characteristics of polygonal fault systems in the Great South Basin, New Zealand
- New approach of clustering of late Pleni-Weichselian loess deposits (L1LL1) in Poland
- Implementation of virtual reference points in registering scanning images of tall structures
- Constraints of nonseismic geophysical data on the deep geological structure of the Benxi iron-ore district, Liaoning, China
- Mechanical analysis of basic roof fracture mechanism and feature in coal mining with partial gangue backfilling
- The violent ground motion before the Jiuzhaigou earthquake Ms7.0
- Landslide site delineation from geometric signatures derived with the Hilbert–Huang transform for cases in Southern Taiwan
- Hydrological process simulation in Manas River Basin using CMADS
- LA-ICP-MS U–Pb ages of detrital zircons from Middle Jurassic sedimentary rocks in southwestern Fujian: Sedimentary provenance and its geological significance
- Analysis of pore throat characteristics of tight sandstone reservoirs
- Effects of igneous intrusions on source rock in the early diagenetic stage: A case study on Beipiao Formation in Jinyang Basin, Northeast China
- Applying floodplain geomorphology to flood management (The Lower Vistula River upstream from Plock, Poland)
- Effect of photogrammetric RPAS flight parameters on plani-altimetric accuracy of DTM
- Morphodynamic conditions of heavy metal concentration in deposits of the Vistula River valley near Kępa Gostecka (central Poland)
- Accuracy and functional assessment of an original low-cost fibre-based inclinometer designed for structural monitoring
- The impacts of diagenetic facies on reservoir quality in tight sandstones
- Application of electrical resistivity imaging to detection of hidden geological structures in a single roadway
- Comparison between electrical resistivity tomography and tunnel seismic prediction 303 methods for detecting the water zone ahead of the tunnel face: A case study
- The genesis model of carbonate cementation in the tight oil reservoir: A case of Chang 6 oil layers of the Upper Triassic Yanchang Formation in the western Jiyuan area, Ordos Basin, China
- Disintegration characteristics in granite residual soil and their relationship with the collapsing gully in South China
- Analysis of surface deformation and driving forces in Lanzhou
- Geochemical characteristics of produced water from coalbed methane wells and its influence on productivity in Laochang Coalfield, China
- A combination of genetic inversion and seismic frequency attributes to delineate reservoir targets in offshore northern Orange Basin, South Africa
- Explore the application of high-resolution nighttime light remote sensing images in nighttime marine ship detection: A case study of LJ1-01 data
- DTM-based analysis of the spatial distribution of topolineaments
- Spatiotemporal variation and climatic response of water level of major lakes in China, Mongolia, and Russia
- The Cretaceous stratigraphy, Songliao Basin, Northeast China: Constrains from drillings and geophysics
- Canal of St. Bartholomew in Seča/Sezza: Social construction of the seascape
- A modelling resin material and its application in rock-failure study: Samples with two 3D internal fracture surfaces
- Utilization of marble piece wastes as base materials
- Slope stability evaluation using backpropagation neural networks and multivariate adaptive regression splines
- Rigidity of “Warsaw clay” from the Poznań Formation determined by in situ tests
- Numerical simulation for the effects of waves and grain size on deltaic processes and morphologies
- Impact of tourism activities on water pollution in the West Lake Basin (Hangzhou, China)
- Fracture characteristics from outcrops and its meaning to gas accumulation in the Jiyuan Basin, Henan Province, China
- Impact evaluation and driving type identification of human factors on rural human settlement environment: Taking Gansu Province, China as an example
- Identification of the spatial distributions, pollution levels, sources, and health risk of heavy metals in surface dusts from Korla, NW China
- Petrography and geochemistry of clastic sedimentary rocks as evidence for the provenance of the Jurassic stratum in the Daqingshan area
- Super-resolution reconstruction of a digital elevation model based on a deep residual network
- Seismic prediction of lithofacies heterogeneity in paleogene hetaoyuan shale play, Biyang depression, China
- Cultural landscape of the Gorica Hills in the nineteenth century: Franciscean land cadastre reports as the source for clarification of the classification of cultivable land types
- Analysis and prediction of LUCC change in Huang-Huai-Hai river basin
- Hydrochemical differences between river water and groundwater in Suzhou, Northern Anhui Province, China
- The relationship between heat flow and seismicity in global tectonically active zones
- Modeling of Landslide susceptibility in a part of Abay Basin, northwestern Ethiopia
- M-GAM method in function of tourism potential assessment: Case study of the Sokobanja basin in eastern Serbia
- Dehydration and stabilization of unconsolidated laminated lake sediments using gypsum for the preparation of thin sections
- Agriculture and land use in the North of Russia: Case study of Karelia and Yakutia
- Textural characteristics, mode of transportation and depositional environment of the Cretaceous sandstone in the Bredasdorp Basin, off the south coast of South Africa: Evidence from grain size analysis
- One-dimensional constrained inversion study of TEM and application in coal goafs’ detection
- The spatial distribution of retail outlets in Urumqi: The application of points of interest
- Aptian–Albian deposits of the Ait Ourir basin (High Atlas, Morocco): New additional data on their paleoenvironment, sedimentology, and palaeogeography
- Traditional agricultural landscapes in Uskopaljska valley (Bosnia and Herzegovina)
- A detection method for reservoir waterbodies vector data based on EGADS
- Modelling and mapping of the COVID-19 trajectory and pandemic paths at global scale: A geographer’s perspective
- Effect of organic maturity on shale gas genesis and pores development: A case study on marine shale in the upper Yangtze region, South China
- Gravel roundness quantitative analysis for sedimentary microfacies of fan delta deposition, Baikouquan Formation, Mahu Depression, Northwestern China
- Features of terraces and the incision rate along the lower reaches of the Yarlung Zangbo River east of Namche Barwa: Constraints on tectonic uplift
- Application of laser scanning technology for structure gauge measurement
- Calibration of the depth invariant algorithm to monitor the tidal action of Rabigh City at the Red Sea Coast, Saudi Arabia
- Evolution of the Bystrzyca River valley during Middle Pleistocene Interglacial (Sudetic Foreland, south-western Poland)
- A 3D numerical analysis of the compaction effects on the behavior of panel-type MSE walls
- Landscape dynamics at borderlands: analysing land use changes from Southern Slovenia
- Effects of oil viscosity on waterflooding: A case study of high water-cut sandstone oilfield in Kazakhstan
- Special Issue: Alkaline-Carbonatitic magmatism
- Carbonatites from the southern Brazilian Platform: A review. II: Isotopic evidences
- Review Article
- Technology and innovation: Changing concept of rural tourism – A systematic review