Sustainable Product Development and Production with AI and Knowledge Graphs
-
Svenja Hauck
Svenja Hauck, born 1998, studied Mechanical Engineering at the University of Applied Science in Kaiserslautern and completed her studies with a Master of Engineering degree in 2022. She joined the Institute for Information Management in Engineering at Karlsruhe Institute of Technology in Karlsruhe in the same year as a research assistant. Her research centers on process modelling and sustainability, emphasizing digital twins.
 and
Lucas Greif
and
Lucas Greif
Lucas Greif, born 1998, studied economics and chemistry at the University of Ulm and completed his studies with a Master of Science degree in 2022. Currently, he is working at the Institute for Information Management in Engineering at Karlsruhe Institute of Technology in Karlsruhe as a research assistant. He is researching how methods of artificial intelligence can be used to make production processes more sustainable.

Abstract
Knowledge graphs and AI enable rapid sustainability assessment in product development. Knowledge graphs structure interconnected semantic information, enhancing data interoperability and managing complex relationships. AI leverages this to automate analysis and aid decision-making. By embedding sustainability metrics, the environmental impacts of choices in product development can be compared. This article reviews knowledge graphs in sustainability assessment and AI’s role in enhancing these capabilities. It also presents a case study on carbon footprint analysis through knowledge graphs and AI.
Abstract
Die Nutzung von Wissensgraphen ermöglicht eine schnelle Nachhaltigkeitsbewertung in der Produktentwicklung, z. B.: können durch die Integration von CO₂-Indikatoren Umweltauswirkungen verschiedener Entwicklungsentscheidungen verglichen werden. Wissensgraphen strukturieren vernetzte, semantische Informationen und bieten Vorteile wie verbesserte Dateninteroperabilität und Flexibilität. KI nutzt diese Informationen zur Automatisierung von Analysen und Entscheidungsunterstützungen. Der Artikel beleuchtet den Stand von Wissensgraphen und KI in diesem Bereich sowie eine Fallstudie zur CO₂-Fußabdruckanalyse.
Tackling Challenges of Sustainability Assessment
In an era where environmental sustainability is not just a corporate responsibility but a global imperative, engineering teams are under increasing pressure to develop products that minimize environmental impact without compromising performance or profitability. Traditional sustainability assessments often lag behind modern product development, hindered by fragmented data sources, complex interdependencies, and time-consuming analysis methods [1]. These challenges underscore the need for more agile and integrated tools that can provide rapid and accurate insights into the environmental consequences of engineering decisions. Knowledge graphs have emerged as a powerful solution to address these complexities. By structuring information in an interconnected format enriched with semantic relationships, knowledge graphs enhance data interoperability and flexibility. They are adept at handling complex relationships between entities, making them ideal for modeling the multifaceted aspects of product development and sustainability metrics. Based on the knowledge graph foundation, AI algorithms can then use these structured data connections to infer potential outcomes, explore ‘what-if’ scenarios, and optimize for specific sustainability targets. Integrating sustainability assessment indicators, such as equivalents of carbon dioxide (CO2), into knowledge graphs allows a dynamic evaluation of environmental impacts associated with different materials, manufacturing processes, and design choices through AI -driven analyses [2]. This approach facilitates direct comparisons between various product options and even between different generations of a product as it evolves. The result is a more transparent and informed decision-making process that actively promotes the development of sustainable products. This paper explores the synergistic potential of combining knowledge graphs with AI to improve sustainability in engineering. We review the current landscape of knowledge graph technology, dis-cuss related works in sustainability assessment, and present a methodology for integrating AI with knowledge graphs. An initial application in 3D concrete printing is demonstrated, followed by a discussion of the challenges and future prospects of this approach.
Related Works for Knowledge Graphs in Sustainability Assessment
The introduction and integration of AI into the various areas of product development is still in its infancy [3]. One topic recently highlighted is the structured representation of engineering data through knowledge graphs [4, 5]. Knowledge graphs are structured networks of data that represent information through entities and their relationships. Based on semantic technologies, they enable data integration and interoperability across various sources. They provide advantages such as flexibility and scalability by being dynamically adjustable and expandable, and efficiency and reusability by creating a foundation for optimized data access, automated analysis, and data reuse [6].
There are mainly two types of knowledge graphs [7]. Firstly, Labeled Property Graphs, which are renowned for their efficient storage, rapid traversal capabilities, and flexibility, are characterized by edges utilized to connect nodes that contain embedded properties [8]. Secondly, Resource Description Frameworks, known for support of formal knowledge representations, such as ontologies, which allow automatic knowledge inference, employ a triplet structure consisting of a subject, a predicate, and an object, which facilitates the linking of data and its sharing [9]. Knowledge graphs can promote the topic of assessment in different ways, such as semantically integrating assessment data [10, 12], organizing and connecting these data [11], or powerfully integrating different data sources [10]. Schweitzer et al. [4] introduce knowledge graphs as so-called engineering graphs. These graphs facilitate the connection between complex data points across the product lifecycle, enabling improved decision-making and predictive analytics within engineering systems. The graphs help to visualize and analyze relationships within large datasets, emphasizing the native abilities of knowledge graphs. In the context of assessment, these graphs leverage existing data and include specialized databases and open and public data from the semantic web, supporting the assessment.
By incorporating AI, knowledge graphs can facilitate automated inference of environmental impacts, identify patterns and correlations within complex datasets, and support optimization of product designs for sustainability. This AI-driven reasoning is especially powerful because the graph structure provides clear semantic links that guide inferencing and predictive modeling, allow for more efficient processing of large volumes of data, and enhance the ability to make informed, sustainability-focused decisions [4].
Methodology
The methodology in Figure 1 illustrates the process for optimizing production processes through the integration of knowledge graphs and AI. The process begins with storing domain-specific knowledge in a database. The database contains essential information on the production domain, which can include materials, production, or environmental factors. From this foundational data, the system moves to semantic middleware. Here, the domain data undergoes a process known as “Semantic Uplift”, which enriches the raw data by adding contextual meaning and by structuring it into a knowledge graph. The knowledge graph establishes connections between relevant concepts and data points essential for optimizing the production process.
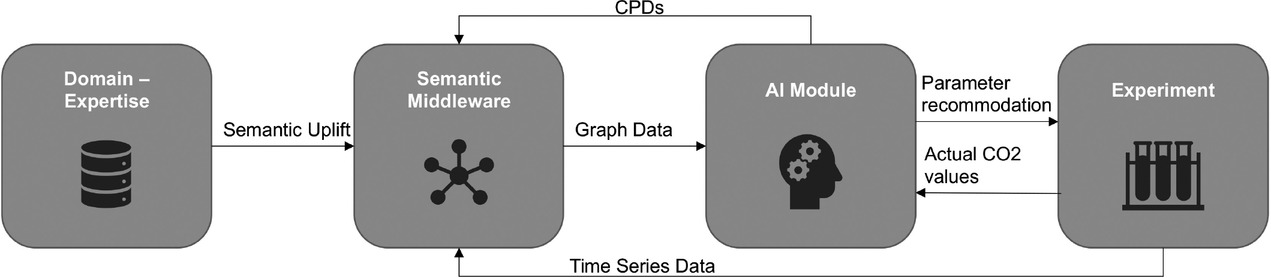
Methodology of optimizing production processes through the integration of knowledge graphs and artificial intelligence
Once the data is in graph form, it flows into the AI module, where advanced analysis is conducted. The AI module is where the main analytical processing occurs. In our context, a causal AI module is used, which leverages “Conditional Probability Distributions” to interpret and analyze the knowledge graph. The causal AI module is designed to understand cause-and-effect relationships within the data, and to identify factors that influence outcomes and enable precise recommendations. “Conditional Probability Distributions” play a critical role in this module. They allow the AI to handle probabilistic relationships within the data. Based on the analysis, parameter recommendations for the production process are generated. Alongside these recommendations, the actual CO₂ values are monitored to evaluate the environmental impact and ensure that the optimization aligns with sustainability goals.
The recommended parameters are then tested in an experimental setting. This experimentation phase validates the parameter recommendations under real-world conditions, ensuring that the theoretical optimizations are practical and effective.
Finally, the experimental results and time series data are fed back into the system. This feedback loop enables continuous improvement of both the AI module and the knowledge graph by incorporating up-to-date production data. By building the AI on top of the knowledge graph, the system is able to maintain context-aware models that adapt to new information, forming the basis for iterative and sustainable process optimization. This workflow demonstrates how domain-specific knowledge and AI can be combined to develop more efficient and sustainable production processes, leveraging insights from a dynamic knowledge graph and iterative feedback for ongoing enhancement.
Initial Application to the Use Case of 3D Printing of Concrete
To apply our methodology, we developed a simple knowledge graph for 3D concrete printing, as depicted in Figure 2. The graph is structured to represent relevant entities and their relationships within the context of the 3D printing process. A central feature of this knowledge graph is the ability to assess the CO₂ impact of specific production steps.

Knowledge graph representation of the 3D concrete printing process
As illustrated in Figure 3, by using the “Map CO₂” function within the graph, it is possible to click on entities that potentially carry a CO₂ factor. This allows for direct comparison of the names of the entities with the entries of an external database containing CO₂ emission factors. For each entity, specific emission factors can be found and selected to represent the actual environmental impact within the 3D printing process more accurately. This selection of CO₂ factors ensures realistic modeling of environmental effects, allowing for a differentiated assessment and optimization of process steps concerning their sustainability.
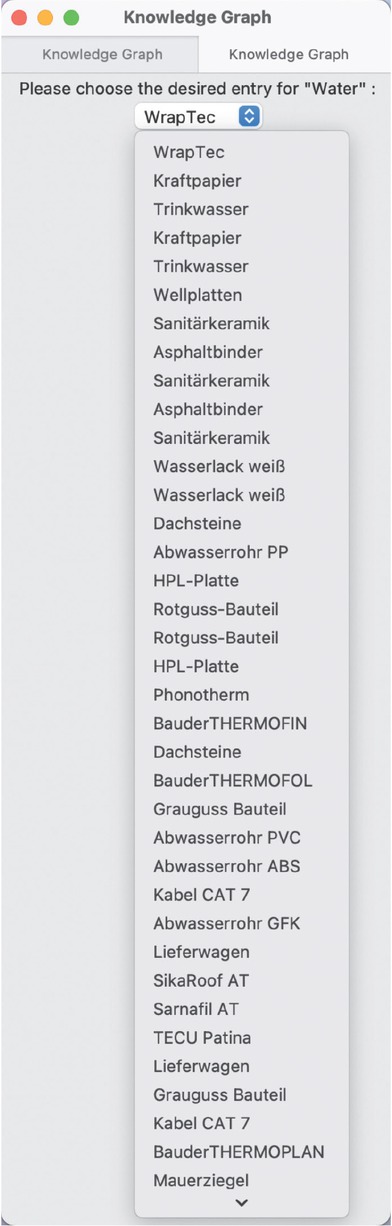
Excerpt of the „Map CO₂“ function within the knowledge graph, highlighting entities that potentially carry CO₂ emission factors
Leveraging this knowledge graph structure, the integrated causal AI then processes the semantic relationships to infer how specific parameters – such as temperature, material composition, or printing speed – affect not only product quality but also carbon emissions. In Figure 4, the “Conditional Probability Distributions” for temperature and part quality are displayed. By selecting the desired target quality for the printed part, we classified different temperature ranges and calculated the probabilities of achieving the aimed quality within each range. Such a classification allows us to identify those optimal temperature settings that maximize the likelihood of producing parts that meet the quality criteria. As new experimental data is incorporated into the model, the “Conditional Probability Distributions” dynamically adjust. This means that the probability distributions of part quality and relevant temperature parameters evolve based on real observations, enabling more precise and data-driven predictions. This iterative approach ensures continuous improvement of the model, thereby reflecting adaptations to actual production conditions in 3D printing. The result is more robust and validates predictions of part quality through the AI module, which aids in optimizing the printing process. Moreover, by leveraging the knowledge graph, carbon emissions for each new configuration can be calculated automatically. For every set of process parameters – such as temperature settings and material selections – the knowledge graph provides immediate access to corresponding CO₂ emission factors. This automatic calculation facilitates real-time assessment of the environmental impact associated with different production configurations. Consequently, it enables informed decision-making that balances both the desired product quality and sustainability objectives.

Conditional probability distributions illustrating the relationship between temperature and part quality
Challenges of the Application of the Methodology and Possible Solutions
Despite the promising potential of using knowledge graphs in sustainability contexts, several challenges must be addressed to fully realize their benefits. One of the primary challenges is data availability and quality. Knowledge graphs alone cannot solve issues related to incomplete or low-quality data [10, 12]. Data, structured in the graph, should be kept homogenic, because heterogeneity of semantics can lead to difficulty in connecting, understanding, and combing information from different sources [10, 11, 12], or even to misinterpretation [11]. Furthermore, the creation and utilization of knowledge graphs is usually a complex, manual and resource-consuming process [5, 14], highlighting the need of accessible and user-friendly tools [5, 11]. More-over, the lack of full standardization in knowledge graph methodologies can pose challenges for data exchange and collaboration [10]. Additionally, it can be difficult to dynamically expand or adapt knowledge graphs when the focus of the analysis or the availability of new information changes [10, 11]. Therefore, a careful consideration of the project‘s scope and collaboration requirements is essential at the outset. Modelling and managing comprehensive and detailed knowledge graphs that cover all aspects of a product lifecycle is another challenge, mainly concerning the scalability of the systems, and the increasing complexity of knowledge graphs [10].
However, when combined with artificial intelligence, knowledge graphs can become even more powerful tools, for example, with automated extensions of the graphs [5] or by integrating uncertainties into semantic models to enable more realistic assessments [12]. Additionally, developing tools capable of performing the various tasks required to build and publish a knowledge graph [14].
Summary
The initial application of our methodology demonstrates the practical benefits of integrating knowledge graphs with causal AI in a real-world manufacturing context. By modeling the 3D concrete printing process within a knowledge graph, we captured complex relationships between process parameters, material properties, and environmental impacts. Using causal AI allowed us to dynamically analyze these relationships, adjusting predictions as new experimental data became available. This approach improved the accuracy of production quality predictions and facilitated automatic calculation of CO₂ emissions for different configurations. Assessing quality and sustainability metrics in real-time supports more holistic decision-making in product development. It enables engineers to identify optimal process settings that achieve desired quality levels while minimizing environmental impact. Our case study underscores the potential of this methodology to be applied to other manufacturing processes and industries. Concurrently addressing quality optimization and sustainability assessment provides a framework for effectively balancing performance objectives with environmental considerations. This integrated approach can lead to more sustainable production practices and drive innovation in product development.
Note
This article is peer reviewed by the members of the ZWF Special Issue Advisory Board.
About the authors
Svenja Hauck, born 1998, studied Mechanical Engineering at the University of Applied Science in Kaiserslautern and completed her studies with a Master of Engineering degree in 2022. She joined the Institute for Information Management in Engineering at Karlsruhe Institute of Technology in Karlsruhe in the same year as a research assistant. Her research centers on process modelling and sustainability, emphasizing digital twins.
Lucas Greif, born 1998, studied economics and chemistry at the University of Ulm and completed his studies with a Master of Science degree in 2022. Currently, he is working at the Institute for Information Management in Engineering at Karlsruhe Institute of Technology in Karlsruhe as a research assistant. He is researching how methods of artificial intelligence can be used to make production processes more sustainable.
Acknowledgements
The research is funded by the German Federal Ministry for Economic Affairs and Climate Action (BMWK) in research project (No. 03LB2041E).
Disclosure of Interests. The author declare no competing interests.
Literature
1 Lacasa, E.; Santolaya, J.; Biedermann, A.: Obtaining Sustainable Production from the Product Design Analysis. Journal of Cleaner Production 139 (2016), pp. 706–716 DOI:10.1016/j.jclepro.2016.08.07810.1016/j.jclepro.2016.08.078Search in Google Scholar
2 Zheng, H.; Yang, S.; Lou, S. et al.: Knowledgebased Integrated Product Design Framework towards Sustainable Low-carbon Manufacturing. Advanced Engineering Informatics 48 (2021) DOI:10.1016/j.aei.2021.10125810.1016/j.aei.2021.101258Search in Google Scholar
3 Bitzer, M.; Eigner, M.; Faißt, K.-G. et al.: Framework of the Evolution in Virtual Product Modeling and Model Management towards Digitized Engineering. In: Proceedings of the 21st International Conference on Engineering Design (ICED 17) Vol. 6: Design Information and Knowledge, Vancouver, Canada 21.-25.08.2017, pp. 345–354Search in Google Scholar
4 Schweitzer, G. M.; Bitzer, M.; Vielhaber, M.: Produktentwicklung: KI-ready? Zeitschrift für wirtschaftlichen Fabrikbetrieb ZWF 115 (2020) 12, pp. 873–876 DOI:10.3139/104.11246410.3139/104.112464Search in Google Scholar
5 Schweitzer, G.; Mörsdorf, S.; Bitzer, M.; Vielhaber, M.: Detection of Cause-Effect Relationships in Life Cycle Sustainability Assessment Based on an Engineering Graph. In: Proceedings of the Design Society 2 (2022), pp. 1129–1138 DOI:10.1017/pds.2022.11510.1017/pds.2022.115Search in Google Scholar
6 Hogan, A.; Blomqvist, E.; Cochez, M. et al.: Knowledge Graphs. ACM Computing Surveys (CSUR) 54 (2021) 4, pp. 1–37 DOI:10.1145/344777210.1145/3447772Search in Google Scholar
7 Saad, M.; Zhang, Y.; Tian, J.; Jia, J.: A Graph Database for Life Cycle Inventory using Neo4j. Journal of Cleaner Production 393 (2023) DOI:10.1016/j.jclepro.2023.13634410.1016/j.jclepro.2023.136344Search in Google Scholar
8 Robinson, I.; Webber, J.; Eifrem, E.: Graph Databases: New Opportunities for Connected Data. O’Reilly, Boston 2015Search in Google Scholar
9 Purohit, S.; Van, N.; Chin, G.: Semantic Property Graph for Scalable Knowledge Graph Analytics. In: International Conference on Big Data, IEEE 2021, pp. 2672–2677 DOI:10.1109/BigData52589.2021.967154710.1109/BigData52589.2021.9671547Search in Google Scholar
10 Zhang, Y.; Luo, X.; Buis, J. J.; Sutherland, J.: LCA-oriented Semantic Representation for the Product Life Cycle. Journal of Cleaner Production 86 (2015) 1-2, pp. 146–162 DOI:10.1016/j.jclepro.2014.08.05310.1016/j.jclepro.2014.08.053Search in Google Scholar
11 Kuczenski, B.; Davis, C.; Rivela, B.; Janowicz, K.: Semantic Catalogs for Life Cycle Assessment Data. Journal of Cleaner Production 137 (2016) 3-4, pp. 1109–1117 DOI:10.1016/j.jclepro.2016.07.21610.1016/j.jclepro.2016.07.216Search in Google Scholar
12 Bertin, B.; Scuturici, V.-M.; Risler, E.; Pinon, J.-M.: A Semantic Approach to Life Cycle Assessment Applied on Energy Environmental Impact Data Management. In: Proceedings of the 2012 Joint EDBT/ICDT Workshops (2012), pp. 87–94 DOI:10.1145/2320765.232079610.1145/2320765.2320796Search in Google Scholar
13 Saad, M.; Zhang, Y.; Tian, J.; Jia, J.: A Graph Database for Life Cycle Inventory Using Neo4j. Journal of Cleaner Production 393 (2023) DOI:10.1016/j.jclepro.2023.13634410.1016/j.jclepro.2023.136344Search in Google Scholar
14 Cimmino, A.; García-Castro, R.: Helio: A Framework for Implementing the Life Cycle of Knowledge Graphs. Semantic Web 15 (2023) 3, pp. 1–27 DOI:10.3233/SW-23322410.3233/SW-233224Search in Google Scholar
© 2025 Svenja Hauck and Lucas Greif, publiziert von De Gruyter
Dieses Werk ist lizensiert unter einer Creative Commons Namensnennung 4.0 International Lizenz.
Articles in the same Issue
- Grußwort
- Grußwort
- Inhalt
- Künstliche Intelligenz
- Künstliche Intelligenz (KI)
- Menschzentrierte Einführung von Künstlicher Intelligenz in Produktion und Engineering
- Generative AI and Agentic Architecture in Engineering and Manufacturing
- Intelligent Industry
- Von Piloten zu skalierbaren Lösungen
- KI in Engineering
- KI-Anwendungen im Engineering
- KI-Adaption in der Produktentwicklung
- KI-Transformation im Engineering
- Code the Product – Vision für die Produktentstehung der Zukunft
- Machine Learning in Transmission Design
- AI Enables Data-Driven Product Design
- Optimierung von Entwicklungsprozessen durch KI-gestütztes Generatives Engineering und Design
- Human-AI Teaming in a Digital Twin Model for Virtual Product Development
- Kundenorientierte Innovationspotenziale durch KI
- Scheitert Systems Engineering an seiner eigenen Komplexität?
- AI-Augmented Model-Based Systems Engineering
- Prompt Engineering im Systems Engineering
- Sustainable Product Development and Production with AI and Knowledge Graphs
- AI-Driven ERP Systems
- Optimale Produktion dank Künstlicher Intelligenz
- KI in PLM-Systemen
- KI in Produktion
- Durchblick in der Produktion
- Production of the Future
- Der Use-Case-First-Ansatz zum Einsatz von Künstlicher Intelligenz in der Produktion
- Überwindung der Programmierkluft in der Produktion und Fertigung
- Lean Data – Anwendungsspezifische Reduktion großer Datenmengen im Produktionsumfeld
- KI-Zuverlässigkeit in der Produktion
- KI in der Smart Factory: Warum Standardanwendungen besser sind
- Data-Driven Decision-Making: Leveraging Digital Twins for Reprocessing in the Circular Factory
- Extended Intelligence for Rapid Cognitive Reconfiguration
- Erfahrungsbasierte Bahnoptimierung von Montagerobotern mittels KI und Digitalen Zwillingen
- Integration of Machine Learning Methods to Calculate the Remaining Useful Life of Mandrels
- AI-Driven Load Sensing for Wind Turbine Operations
- ChatPLC – Potenziale der Generativen KI für die Steuerungsentwicklung
- Developing and Qualifying an ML Application for MRO Assistance
- Applying AI in Supporting Additive Manufacturing Machine Maintenance
- Kollaboratives Modelltraining und Datensicherheit
- KI-basierte Partikelgrößenbestimmung in Suspensionen
- Intelligente Prozessüberwachung für die flexible Produktion
- Robuste Bauteilidentifikation mittels digitaler Fingerabdrücke
- Herausforderungen der Digitalisierung in der Klebetechnik
- Vom Webshop zum Shopfloor
- Scoring-Prozess mit Vorhersagemodell
- Automatisierte Optimierung von Metamaterialien im Leichtbau
- KI-gestützte Prozessoptimierung in der Massivumformung
- AI-Supported Process Monitoring in Machining
- Federated Learning in der Arbeitsplanung
- KI in der Kommissionierung
- KI-basiertes Assistenzsystem zur Qualitätskontrolle
- Qualitätssteigerung durch Digitalisierung
- Qualitative und wirtschaftliche Vorteile des KI-gestützten 8D-Prozesses
- KI-gestützte Prognose von Durchlauf- und Lieferzeiten in der Einzel- und Kleinserienfertigung