Analysis of the effect of DEK overexpression on the survival and proliferation of bone marrow stromal cells
-
Türkan Çakar


Abstract
Objective
DEK is ubiquitously expressed and encodes a nuclear protein, which is also released from some cells. Overexpression of DEK suppresses proliferation of some blood cell progenitors whereas it increases proliferation of epithelial tumors. We showed that DEK is overexpressed in BM cells of 12% of multiple myeloma (MM) patients. Here, we aimed to test if DEK overexpression effects the proliferation and viability of BM stromal cells or MM cells co-cultured with DEK-overexpressing stromal cells, mimicking the BM microenvironment.
Methods
DEK is stably overexpressed in the BM stromal cell line HS27A. Periodic growth curve and fluorescent activated cell sorting (FACS) analysis was performed to determine the effect of DEK overexpression on HS27A cells and MM cell lines (RPMI-8226 and U266) that are co-cultured with these HS27A cells.
Results
We showed that, on the contrary to blood progenitors or ephitelial cells, DEK overexpression doesn’t alter the viability or proliferation of the HS27A cells, or the MM cell lines which are co-cultured with DEK-overexpressing HS27A cells.
Conclusions
Our results suggest that effect of DEK overexpression on the proliferation is cell type and context dependent and increased DEK expression is tolerable by the stromal cells and the co-cultured MM cell lines without effecting proliferation and viability.
Öz
Amaç
DEK her hücrede ifade edilen bir hücre çekirdeği proteinidir ve bazı kan hücrelerinden de salgılanabilmektedir. Aşırı DEK ifadesi öncü kan hücrelerinin çoğalmasını baskılarken, epitel kökenli kanser hücrelerinin çoğalmasını arttırmaktadır. Daha önce, multiple miyelom (MM) hastalarının %12’sinin stromal hücreleri de içeren kemik iliği (Kİ) hücrelerinde DEK’in aşırı ifade edildiğini gösterdik. Bu çalışmada DEK aşırı ifadesinin, Kİ stroma hücrelerinin ve Kİ mikroçevresini taklit edecek şekilde bu hücrelerle birlikte kültür edilen MM hücrelerinin canlılığı ve çoğalmasına olan etkilerini test etmeyi amaçladık.
Yöntem
Kİ stroma hücre hattı HS27A’da kalıcı olacak şekilde DEK aşırı ifadesi sağlandı. DEK aşırı ifadesi sağlanan HS27A hücreleri ve bu hücrelerle birlikte kültür edilen MM hücre hatlarına (RPMI-8226 ve U266) periyodik olarak hücre çoğalma analizi ve FACS analizi uygulandı.
Bulgular
Çalışmamızda, öncü kan hücreleri ve epitel hücrelerinin aksine, DEK aşırı ifadesinin HS27A hücrelerinin, ya da bu hücrelerle birlikte kültür edilen MM hücrelerinin çoğalmasını etkilemediğini gösterdik.
Sonuç
Elde ettiğimiz veriler, aşırı DEK ifadesinin hücre çoğalmasını etkilemesinin, hücre tipi ve içeriğine bağlı olduğunu ve DEK aşırı ifadesinin Kİ stroma hücresi HS27A ve bu hücrelerle birlikte kültür edilen MM hücre hatlarında çoğalmayı etkilemeyecek şekilde tolere edildiğini göstermektedir.
Introduction
Bone marrow (BM) is the home of blood cell production (hematopoiesis) under the physiological conditions. In addition to blood (hematopoetic) cells, BM comprises stromal cells and mesenchymal cells, which generate a microenvironment playing an essential role in the development and maintenance of all blood cells, including myeloid and lymphoid lineages [1]. Interplay between BM microenvironment and hematopoetic cells is important for many other physiological and malignant processes, such as homing of transplanted blood cells to BM as well as development, maintenance and recurrence of leukemia [2], [3]. The chemokines and cytokines secreted by the BM microenvironment, such as CXCL12, interleukine 7 (IL-7), are indispensible for the development of lymphoid B cells, which generates antibody producing plasma cells. On the other hand, the factors including IL-6 and very late antigen-4 (VLA-4) are important for the homing and survival of plasma cells in the BM [4], [5]. Multiple myeloma (MM) is a plasma cell cancer. The viability and maintenance of MM cells and development of therapy resistance in patients with MM is also influenced by BM microenvironment [6], [7].
DEK is a nuclear oncoprotein [8] and its overexpression is associated with several solid tumors including but not limited to retinoblastoma [9], breast cancer [10], [11], glioblastoma [12], hepatocellular carcinoma [13] and melanoma [14], [15]. DEK is a versatile protein and involved in DNA repair [16], replication [17], mRNA splicing [18] and chromatin topology [19]. It is secreted from the immune cells under certain conditions such as pro-inflammation, playing a potential role in some otoimmune diseases [20]. Although DEK overexpression is correlated with enhanced proliferation of epithelial cells, its overexpression, or uptake of recombinant DEK decreases the proliferation of hematopoetic progenitors committed to myeloid lineage [21]. Despite growing data about DEK, it is unknown whether modified DEK expression affects the biology of human BM stromal cells and the hematopoetic cells that are grown together with these stromal cells.
Recently we showed that CD138negative BM cells isolated from patients with MM show increased level (over two-fold) of DEK expression in 12% of MM samples (5 out of 41) [22]. These data prompted us to investigate the potential effect of DEK overexpression in the BM stromal cells. Here we stably overexpressed DEK using retrovirus in human BM stromal cell line HS27A and analyzed how it influences the growth and viability of HS27A cells and the human MM cell lines using co-culture experiments.
Materials and methods
Cell culture
HS27A, U266 and RPMI-8226 cells were obtained from ATCC (Manassas, VA, USA) and cultured in humidified incubator at 37°C and 5% CO2. Growth medium for HS27A cells was RPMI-1640 that contains 10% fetal bovine serum and 1% penicillin and streptomycin (Gibco, Waltham, MA, USA). MM cell lines (RPMI 8226 and U266) were cultured with RPMI-1640 that contains 15% fetal bovine serum and 1% penicillin and streptomycin.
Virus preparation and transduction
Full length human DEK cDNA was generated from human CD34positive cells and cloned into the EcoRI site of MSCV-IRES-GFP (MIG) retroviral vector. DEK primers used for cDNA preparation were as followed: Forward primer 5′-ATGTCCGCCTCGGCC-3, reverse primer 5′-TCAAGAAATTAGCTCTTTTACAG-3′. Integrity of the cDNA was confirmed by sequencing. VSVg pseudotyped retroviruses were prepared using MIG and MSCV-DEK-IRES-GFP (MIG-DEK) constructs and the HS27A cells were transduced with these retroviruses as described before [23]. After the transduction, GFPpositive cells were sorted using fluorescent activated cell sorting (FACS) and sorted cells were used in further experiments.
Co-culture assays
HS27A cells were cultured until they reach to 80% confluency, the medium was aspirated and fresh serum free RPMI 1640 medium with 1% penicillin and streptomycin was added to the cells. After 18 h of culture, the medium on HS27A cells was collected, filtered by using 0.22 μm filter and mixed with the equal amount of growth medium of MM cell lines (RPMI 1640 with 15% FBS, 1% penicillin and streptomycin) to prepare the conditioned medium (CM). RPMI 8226 and U266 cells were seeded with CM as 5×10³ or 3×10⁴ cells per well of the 96-well plate, respectively. Proliferation of the cells was measured using WST-1 assay (Merck, Germany) for 5 consecutive days.
In a separate experiment, HS27A (5×10³ cells per well) cells were co-cultured with MM cells (RPMI 8226 or U266; 3×10⁴ cells per well) in a 96-well plate and proliferation was measured by using WST-1 assay for 5 consecutive days.
Finally, HS27A cells (2×10⁵ cells per well of six well plate) were seeded into a hanging insert (upper chamber) with 0.4 μm pore size (Merck) and 6×10⁵ MM cells were seeded into lower chamber of the same well. With this system MM cells and HS27A cells were physically separated from each other although they were co-cultured in the same wells. At the indicated time points, hanging inserts were discarded and proliferation of the MM cells was analyzed.
Annexin-5 analysis
RPMI 8226 cells were harvested and 3×10⁵ cells were centrifuged at 1000 rpm for 10 min. Cells were washed with cold PBS and resuspended in 100 μL of 1X Annexin Binding Buffer. Five microliter of APC Annexin V (BD Biosciences, San Jose, CA, USA) and 2 μL of 7-AAD (Biolegend, San Diego, CA, USA) was added to the cells and the mixture was vortexed gently. After incubation for 15 min at RT (25°C) in the dark, 300 μL of 1X Annexin Binding Buffer was added and each sample was analyzed by using FACS.
Western blot analysis
Western blotting was performed as previously described [22] and expression of DEK was analyzed by using a mouse anti-human DEK (1:5000) (BD Biosciences) and anti-mouse secondary antibodies (3:10,000) (CST, Leiden, The Netherlands). Equal loading of the proteins were confirmed by re-probing the same membrane with rabbit anti-human GAPDH (1:5000) (CST) and anti-rabbit secondary antibodies (3:10,000) (CST). Proteins were visualized by using the ECL reagent (ThermoFisher Scientific, Waltham, MA, USA) and the ChemiDoc imaging system (BIORAD, Hercules, CA, USA).
WST-1 assay
To measure the viability and proliferation of the cells, HS27A cells (5×10³; 10×103, or 20×103 cells per well), RPMI 8226 cells (5×10³ cells per well) or U266 cells (3×10⁴ cells per well) were seeded into 96-well plates in triplicates for each time points indicated in the figures. WST-1 reagent was added into each well and plates were incubated for 4h at 37°C. Absorbance (at 450 nm) was measured using a plate reader (Varioskan) (ThermoFisher Scientific).
Results
To determine the effect of DEK overexpression on proliferation, HS27A human BM stromal cell line was transduced with MIG (control; HS27A-GFP) or MIG-DEK (HS27A-DEK-GFP) retrovirus, which provides stable expression of the DEK, as well as a separate green fluorescent protein (GFP) allowing the identification of the cells that are transduced with the retrovirus. After the transduction, GFPpositive cells were sorted by FACS and DEK overexpression in the sorted cells was confirmed by RT-qPCR (Figure 1A) and Western blot analysis (Figure 1B), respectively. All of the following experiments were performed by using these FACS-sorted GFPpositive cells.
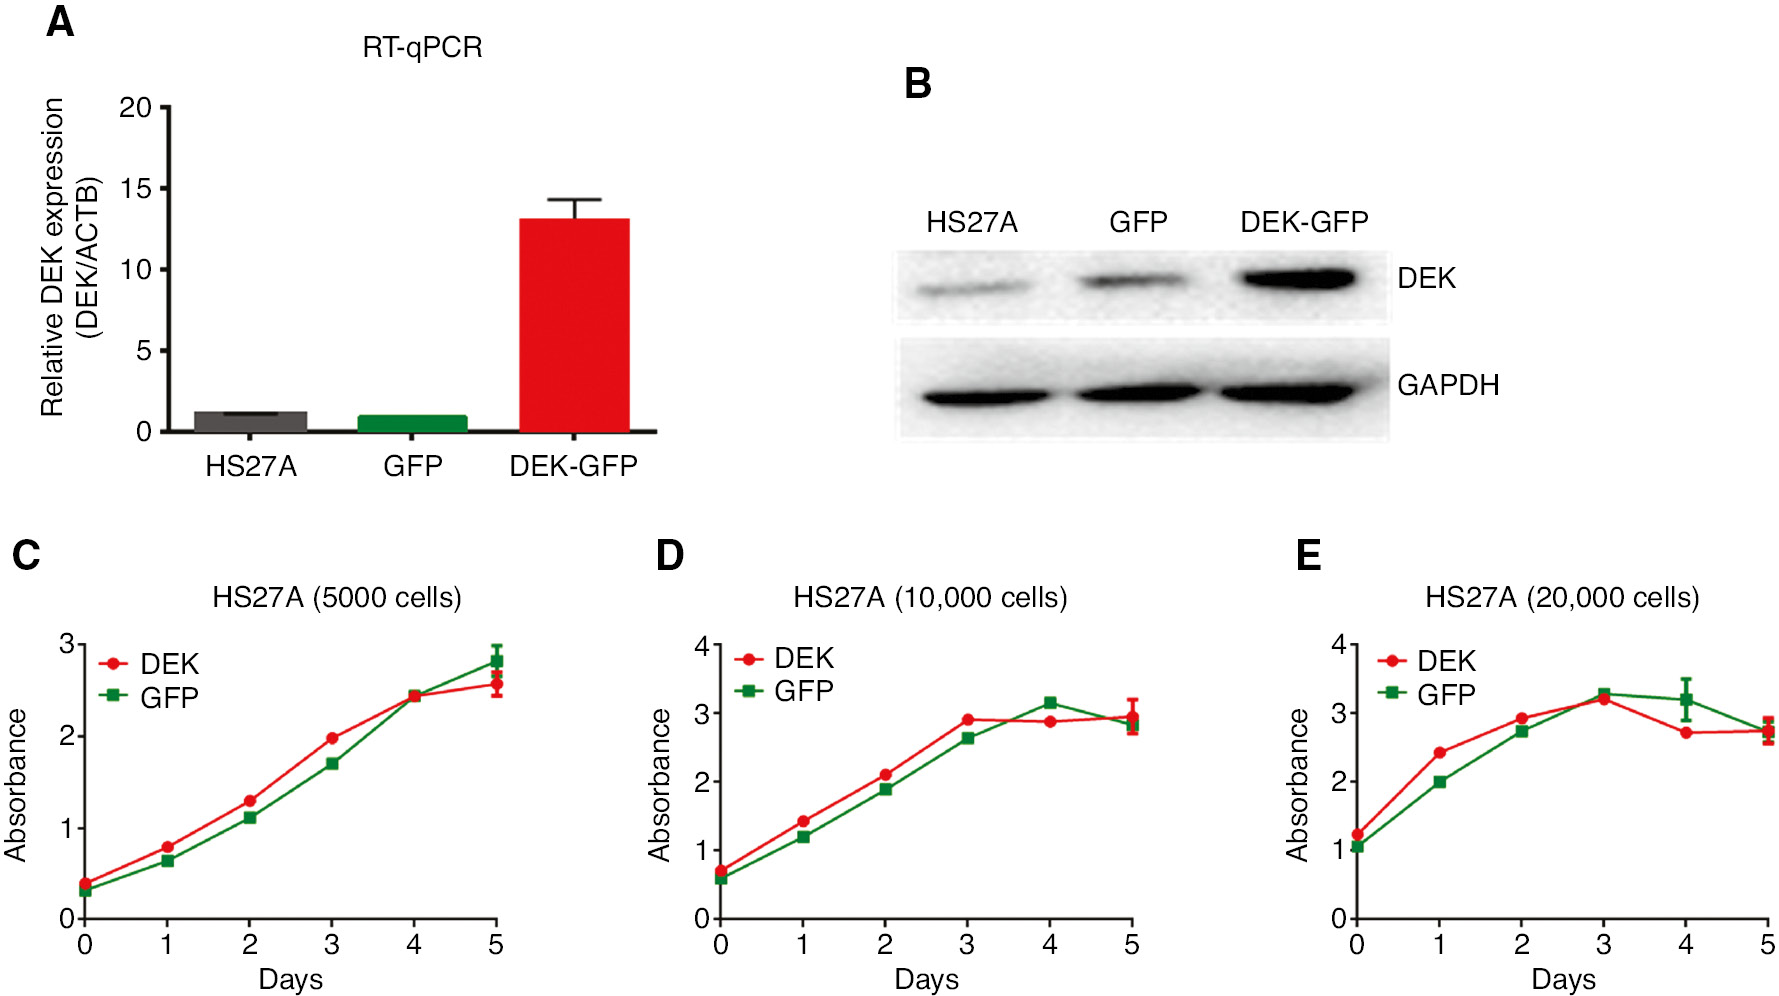
Analysis of proliferation of the HS27A cell lines that stably overexpress DEK.
(A) RNA and cDNA was prepared from the FACS-sorted GFPpositive cells and the overexpression of DEK in these cell lines was confirmed by using RT-qPCR as described in the text. (B) Cell lysates from the FACS-sorted GFPpositive cells were prepared and they were used in the Western blot analysis to confirm the overexpression of DEK as described in the methods. Figures in the (A) and (B) shows the expression level of DEK in the HS27A cells (Parental cells), HS27A-GFP cells (Control cells that are stably transduced by MIG retrovirus), and HS27A-DEK-GFP cells (Cells that are stably transduced by MIG-DEK-GFP retrovirus). (C–E) Growth curves show the proliferation of the HS27A-GFP (GFP; green lines) and HS27A-DEK-GFP (DEK; red lines) cells that are cultured in the growth medium at a concentration of 5000 cells/well (C) 10,000 cells/well (D) and 20,000 cells/well (E) of the 96 well plates in triplicate. Proliferation rate of the cells was analyzed by using WST-1 assay for five consecutive days. Error bars in each figure indicate ±SEM. Figures show one representative results of the minimum two independent experiments.
First, the proliferative capacity of the DEK- overexpressing HS27A cells was tested using WST-1 assay. Analysis of HS27A-GFP (control) and HS27A-DEK-GFP cells did not show any difference in their proliferation when the cells were seeded as 5000, 10,000 or 20,000 cells per well of the 96 well plate. These results showed that ectopic DEK does not influence the proliferation of HS27A cells (Figure 1C–E).
Next we wanted to detect if paracrine factors secreted from HS27A-DEK-GFP cells affects the proliferation of MM cell lines RPMI-8226 and U266 cells. For these experiments, RPMI-8226 and U266 cells were cultured using the conditioned medium (CM) that was obtained from the culture of HS27A-GFP or HS27A-DEK-GFP cells. Proliferation of the MM cell lines that are cultured with the CM was detected for 5 consecutive days using WST-1 proliferation assay. Results didn’t show any difference between proliferation capacity of RPMI-8226 or U266 cell lines cultured with the CM obtained from the DEK overexpressing HS27A cells compared with CM from the HS27A-GFP control cells (Figure 2A and B). Given these data, we hypothesized that induction of paracrine or autocrine factors from HS27A cells may require the factors released from the MM cell lines. To test this possibility, we placed hanging-inserts into the culture plates which separate two cell lines preventing direct cell contact but retaining reciprocal paracrine factor delivery between the co-cultured cells since the hanging-inserts contain pores. Similar to the assays performed by using the CM, both WST-1 proliferation assay and viable cell counts with the trypan blue dye did not show any difference suggesting that paracrine interactions provided by the modified HS27A cells, if there is any, don’t affect the proliferative activity and the survival of the co-cultured U266 cells (Figure 2C and D).
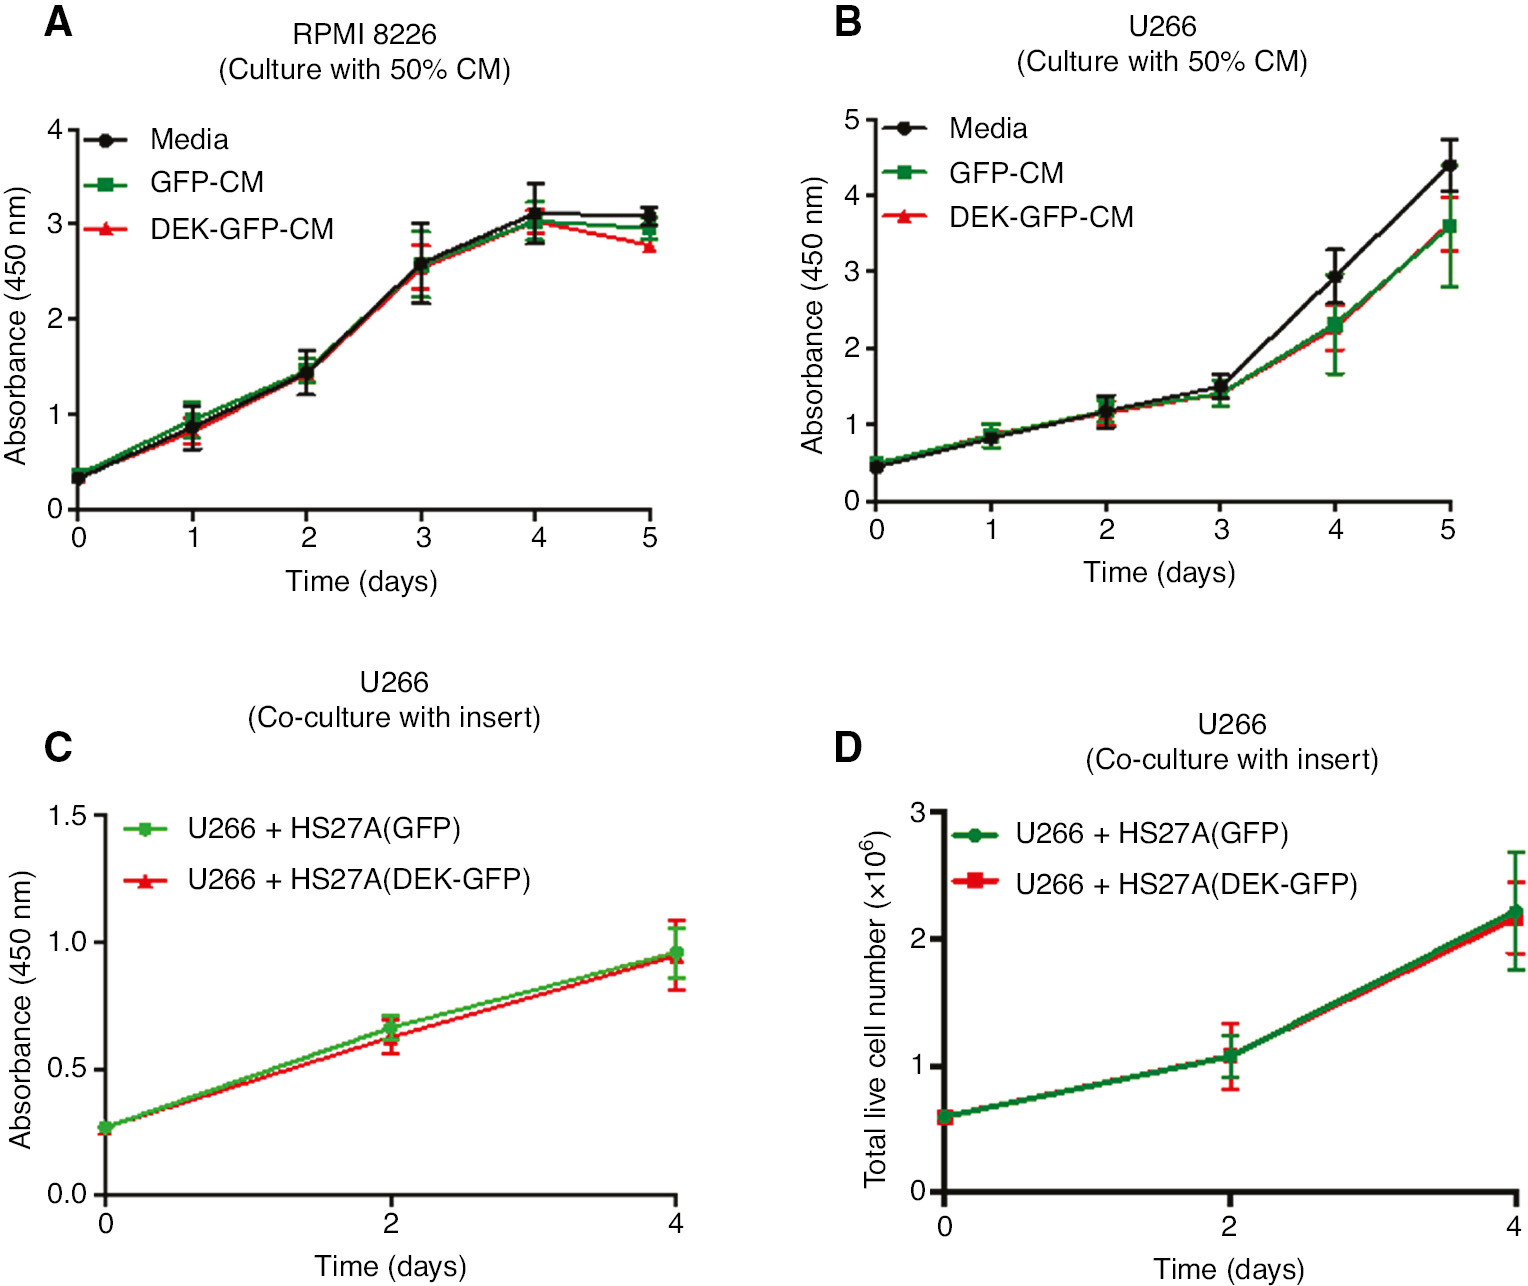
Analysis of the proliferation of MM cell lines cultured with conditioned medium (CM).
Graphs show the growth curve of RPMI-8226 (A) and U266 cells (B) that were cultured for the five days in triplicate with the growth medium (media; black line) or the CM that was obtained from the HS27A-GFP cells (GFP-CM; green lines) or from the HS27A-DEK-GFP cells (DEK-GFP-CM; red lines) (50% CM: CM 1:1 diluted with the growth medium) as described in the methods. Proliferation was measured in the each indicated day by using a WST-1 assay. (C, D) U266 cells were co-cultured in the growth medium in the six-well plates with the hanging inserts that contain HS27A-GFP cells (green lines) or HS27A-DEK-GFP cells (red lines) under the conditions described in the methods. Proliferation of the cells was analyzed by using a WST-1 assay (C) or a trypan blue dye and a hemocytometer (D) for the indicated time points. Data represent the average of two (A) or three independent experiments (B, C and D) that were performed in triplicate. Error bars indicate ±SEM.
Similarly, counting of the cells and the additional FACS analysis of the Annexin-V stained RPMI-8226 cells that are co-cultured with these HS27A cells under the same conditions described above did not show a profound difference in the proliferation and viability of the RPMI-8226 cells (Figure 3A and B).
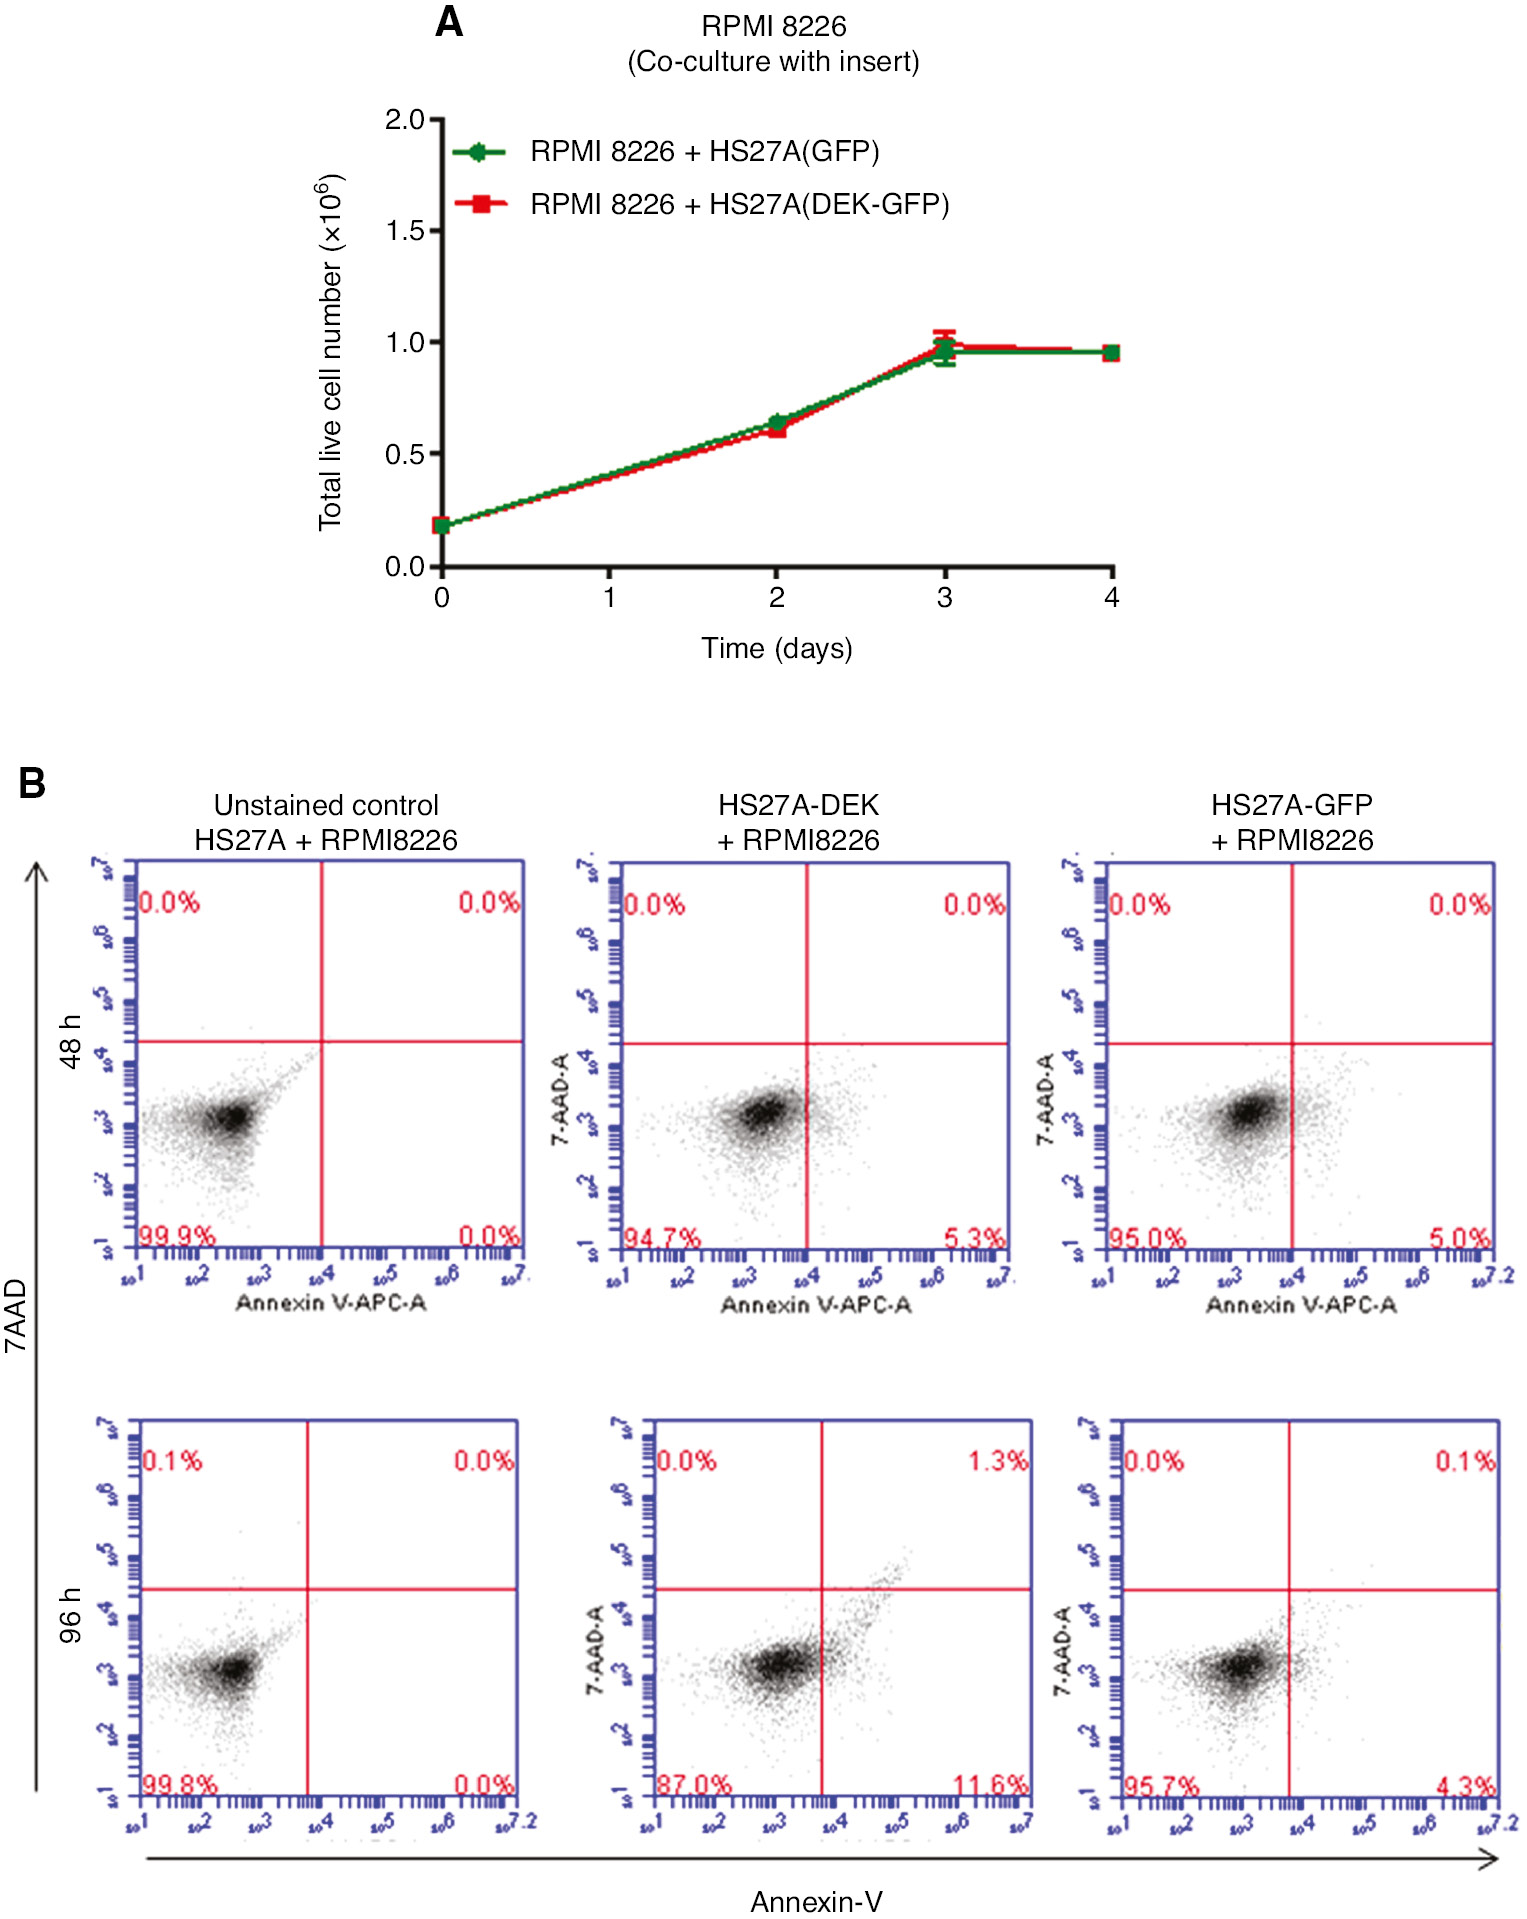
Growth curve and FACS analysis of the RPMI-8226 cells that are co-cultured with the DEK-overexpressing HS27A cells.
(A) RPMI-8226 cells were co-cultured in the six-well plates with the hanging inserts containing HS27A-GFP (green lines) or HS27A-DEK-GFP cells (red lines) as described in the methods. Graph shows the number of the live RPMI-8226 cells at the each indicated time point that was analyzed by using a trypan blue dye and a hemocytometer. (B) To determine the rate of apoptosis, RPMI-8226 cells were co-cultured with the HS27A-GFP cells or with the HS27A-DEK-GFP cells under the same conditions as described in (A) and the harvested cells (RPMI-8226) were stained with the annexin-5 and 7-AAD dye at the indicated time points and analyzed by using FACS as described in the methods. Each graph shows the one representative result of the two independent experiments.
Finally, to investigate the effects of cell contact, in addition to paracrine factors, HS27A-DEK-GFP cells and MM cell lines (U266 and RPMI-8226) were co-cultured directly without hanging inserts. These results also did not show any difference in the proliferation capacity of the co-cultured MM cell lines (Figure 4A and B).
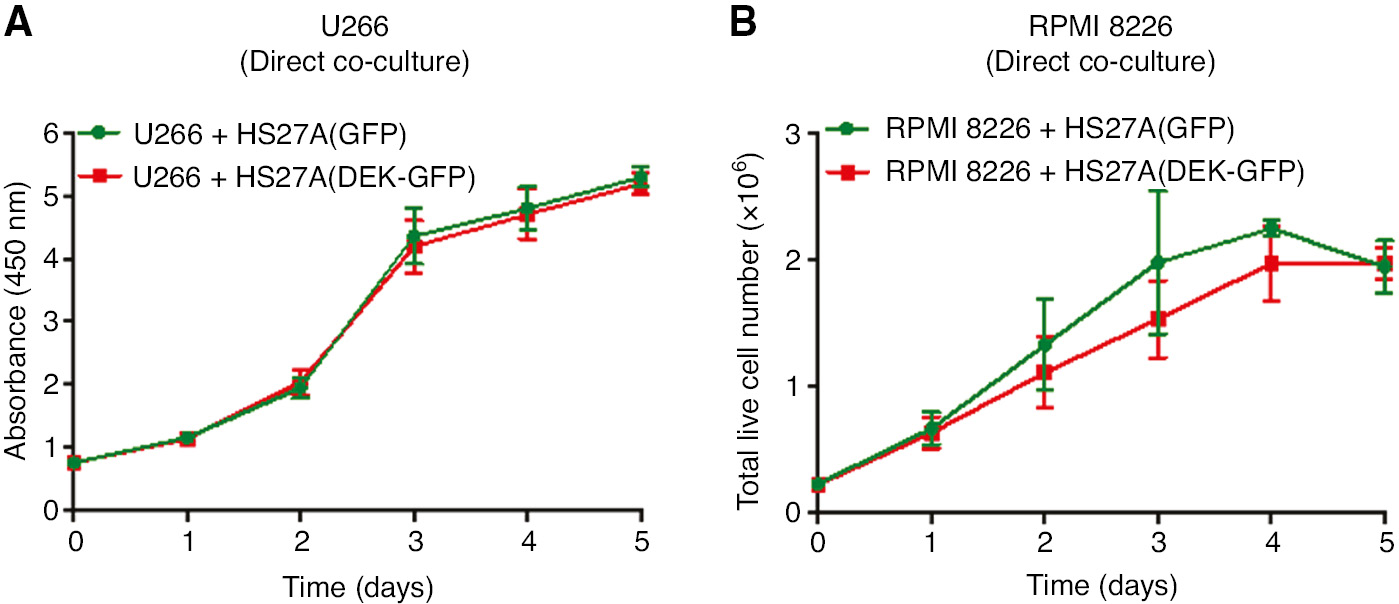
Analysis of the direct co-culture of the MM cells with the HS27A cells overexpressing DEK.
U266 cells (A) or RPMI-8226 cells (B) were co-cultured with the control HS27A-GFP cells (green lines) or with the HS27A-DEK-GFP cells in the same well of the six-well plates in the absence of the hanging inserts under the conditions described in the methods for five consecutive days. Proliferation rate of the U266 cells and the RPMI-8226 cells was analyzed by using a WST-1 assay or a trypan blue dye, respectively, at the each indicated time points. Graphs show the average of the two independent experiments performed in triplicate. Error bars indicate ±SEM.
Discussion
DEK is a nuclear oncoprotein and it is released from the activated macrophages, which is functional when it is taken by the neighbouring cells [20]. DEK expression in primary mouse embryonic fibroblast cells stimulates expression of Wnt ligands and these paracrine molecules stimulate invasion and growth of the breast cancer cells [11] and the MM cells [24].
All these data and our recent findings showing that DEK expression is increased in the BM cells (comprising the BM stromal cells) of some MM patients [22] formed the basis of the presented study. Since the recombinant DEK is functional in the hematopoetic cells [21], we believe that it is crucial to understand the effects of DEK on the human BM stromal cells and to reveal the molecular mechanisms governing these effects. It is intriguing to speculate that this knowledge may provide the basis for future therapy approaches that aim to express ectopic/recombinant DEK in the BM stromal cells to modify the biology of the cancerous hematopoietic cells. Therefore, here we analyzed if the high level of DEK expression is tolerable in the human BM stromal cells and if it interrupts with the survival or growth of the MM cells via the paracrine or cell-contact dependent signalling. We showed for the first time that increased level of DEK is not toxic to the immortalized human BM stromal cells (HS27A cell line) and it does not alter the proliferation rate or the viability of both HS27A cells and the MM cell lines which are co-cultured with these stromal cells.
Immortalized cell lines are usually the first choice in biomedical research because of their easy and cost-effective maintenance in the cell culture systems. Due to some limitations in the obtaining the primary human BM stromal cells, in our study we used immortalized cell lines in a co-culture assay system to test the effect of ectopic DEK expression. The HS27A and the MM cell lines are immortalized cells and they already have relatively higher proliferation rate in the tissue culture systems, similar to the many other cell lines. Therefore, it is likely that the effect of the increased DEK expression on the survival and/or proliferation of the primary human BM stromal and the primary MM cells might be different than those cell lines that are used in our study. We believe that analysis of the influence of ectopic DEK expression on the different biological processes by using the primary human BM stromal cells and MM cells as a model could provide additional information about the possible role of DEK in the BM microenvironment.
In summary, our findings are consistent with the literature showing that the overexpression of DEK has different effects on the epithelial and myeloid cells and our results provides additional data supporting the notion that action of DEK in the cells depends on the cell-context.
Acknowledgement
This study was supported by the Scientific and Technological Research Council of Turkey (TÜBİTAK) grant KBAG 212T108, Funder Id: http://dx.doi.org/10.13039/501100004410.
Conflict of interest: The authors declare that there is no conflict of interest regarding the publication of this article.
References
1. Anthony BA, Link DC. Regulation of hematopoietic stem cells by bone marrow stromal cells. Trends Immunol 2014;35:32–7.10.1016/j.it.2013.10.002Search in Google Scholar
2. Ning H, Yang F, Jiang M, Hu L, Feng K, Zhang J, et al. The correlation between cotransplantation of mesenchymal stem cells and higher recurrence rate in hematologic malignancy patients: outcome of a pilot clinical study. Leukemia 2008;22:593–9.10.1038/sj.leu.2405090Search in Google Scholar
3. Vianello F, Dazzi F. Mesenchymal stem cells for graft-versus-host disease: a double edged sword? Leukemia 2008;22:463–5.10.1038/leu.2008.25Search in Google Scholar
4. Tokoyoda K, Egawa T, Sugiyama T, Choi BI, Nagasawa T. Cellular niches controlling B lymphocyte behavior within bone marrow during development. Immunity 2004;20:707–18.10.1016/j.immuni.2004.05.001Search in Google Scholar
5. Zhao E, Xu H, Wang L, Kryczek I, Wu K, Hu Y, et al. Bone marrow and the control of immunity. Cell Mol Immunol 2012;9:11–9.10.1038/cmi.2011.47Search in Google Scholar
6. Burger JA, Ghia P, Rosenwald A, Caligaris-Cappio F. The microenvironment in mature B-cell malignancies: a target for new treatment strategies. Blood 2009;114:3367–75.10.1182/blood-2009-06-225326Search in Google Scholar
7. Mahindra A, Hideshima T, Anderson KC. Multiple myeloma: biology of the disease. Blood Rev 2010;24(Suppl 1):S5–11.10.1016/S0268-960X(10)70003-5Search in Google Scholar
8. Kappes F, Burger K, Baack M, Fackelmayer FO, Gruss C. Subcellular localization of the human proto-oncogene protein DEK. J Biol Chem 2001;276:26317–23.10.1074/jbc.M100162200Search in Google Scholar PubMed
9. Grasemann C, Gratias S, Stephan H, Schüler A, Schramm A, Klein-Hitpass L, et al. Gains and overexpression identify DEK and E2F3 as targets of chromosome 6p gains in retinoblastoma. Oncogene 2005;24:6441–9.10.1038/sj.onc.1208792Search in Google Scholar PubMed
10. Privette Vinnedge LM, Benight NM, Wagh PK, Pease NA, Nashu MA, Serrano-Lopez J, et al. The human DEK oncogene stimulates beta-catenin signaling, invasion and mammosphere formation in breast cancer. Oncogene 2011;30:2741–52.10.1038/onc.2011.2Search in Google Scholar PubMed PubMed Central
11. Privette Vinnedge LM, Benight NM, Wagh PK, Pease NA, Nashu MA, Serrano-Lopez J, et al. The DEK oncogene promotes cellular proliferation through paracrine Wnt signaling in Ron receptor-positive breast cancers. Oncogene 2015;34:2325–36.10.1038/onc.2014.173Search in Google Scholar
12. Kroes RA, Jastrow A, McLone MG, Yamamoto H, Colley P, Kersey DS, et al. The identification of novel therapeutic targets for the treatment of malignant brain tumors. Cancer Lett 2000;156:191–8.10.1016/S0304-3835(00)00462-6Search in Google Scholar
13. Kondoh N, Wakatsuki T, Ryo A, Hada A, Aihara T, Horiuchi S, et al. Identification and characterization of genes associated with human hepatocellular carcinogenesis. Cancer Res 1999;59:4990–6.Search in Google Scholar
14. Carro MS, Spiga FM, Quarto M, Di Ninni V, Volorio S, Alcalay M, et al. DEK Expression is controlled by E2F and deregulated in diverse tumor types. Cell Cycle 2006;5:1202–7.10.4161/cc.5.11.2801Search in Google Scholar PubMed
15. Khodadoust MS, Verhaegen M, Kappes F, Riveiro-Falkenbach E, Cigudosa JC, Kim DS, et al. Melanoma proliferation and chemoresistance controlled by the DEK oncogene. Cancer Res 2009;69:6405–13.10.1158/0008-5472.CAN-09-1063Search in Google Scholar PubMed PubMed Central
16. Kavanaugh GM, Wise-Draper TM, Morreale RJ, Morrison MA, Gole B, Schwemberger S, et al. The human DEK oncogene regulates DNA damage response signaling and repair. Nucleic Acids Res 2011;39:7465–76.10.1093/nar/gkr454Search in Google Scholar PubMed PubMed Central
17. Alexiadis V, Waldmann T, Andersen J, Mann M, Knippers R, Gruss C. The protein encoded by the proto-oncogene DEK changes the topology of chromatin and reduces the efficiency of DNA replication in a chromatin-specific manner. Genes Dev 2000;14:1308–12.10.1101/gad.14.11.1308Search in Google Scholar
18. McGarvey T, Rosonina E, McCracken S, Li Q, Arnaout R, Mientjes E, et al. The acute myeloid leukemia-associated protein, DEK, forms a splicing-dependent interaction with exon-product complexes. J Cell Biol 2000;150:309–20.10.1083/jcb.150.2.309Search in Google Scholar PubMed PubMed Central
19. Waldmann T, Eckerich C, Baack M, Gruss C. The ubiquitous chromatin protein DEK alters the structure of DNA by introducing positive supercoils. J Biol Chem 2002;277:24988–94.10.1074/jbc.M204045200Search in Google Scholar PubMed
20. Mor-Vaknin N, Punturieri A, Sitwala K, Faulkner N, Legendre M, Khodadoust MS, et al. The DEK nuclear autoantigen is a secreted chemotactic factor. Mol Cell Biol 2006;26:9484–96.10.1128/MCB.01030-06Search in Google Scholar PubMed PubMed Central
21. Broxmeyer HE, Kappes F, Mor-Vaknin N, Legendre M, Kinzfogl J, Cooper S, et al. DEK regulates hematopoietic stem engraftment and progenitor cell proliferation. Stem Cells Dev 2011;21:1449–54.10.1089/scd.2011.0451Search in Google Scholar PubMed PubMed Central
22. Çalışkaner ZO, Çakar T, Özçelik E, Özdilek A, Kim AS, Doğan Ö, et al. DEK protein level is a biomarker of CD138positive normal and malignant plasma cells. PLoS One 2017;12:e0178025.10.1371/journal.pone.0178025Search in Google Scholar PubMed PubMed Central
23. Kandilci A, Grosveld GC. Reintroduction of CEBPA in MN1-overexpressing hematopoietic cells prevents their hyperproliferation and restores myeloid differentiation. Blood 2009;114:1596–606.10.1182/blood-2009-02-205443Search in Google Scholar PubMed PubMed Central
24. Qiang YW, Walsh K, Yao L, Kedei N, Blumberg PM, Rubin JS, et al. Wnts induce migration and invasion of myeloma plasma cells. Blood 2005;106:1786–93.10.1182/blood-2005-01-0049Search in Google Scholar PubMed PubMed Central
©2019 Walter de Gruyter GmbH, Berlin/Boston
Articles in the same Issue
- Frontmatter
- Research Articles
- Investigating the impact of polysomy 17 in breast cancer patients with HER2 amplification through meta-analysis
- Diagnostic performance of microRNAs in the circulation in differential diagnosis of BPH, chronic prostatitis and prostate cancer
- Enhanced anticancer effect of cetuximab combined with stabilized silver ion solution in EGFR-positive lung cancer cells
- CA125, YKL-40, HE-4 and Mesothelin: a new serum biomarker combination in discrimination of benign and malign epithelial ovarian tumor
- Paricalcitol pretreatment attenuates renal ischemia/reperfusion injury by inhibiting p38 MAPK and activating PI3K/Akt signaling pathways
- Identification of cytoplasmic sialidase NEU2-associated proteins by LC-MS/MS
- Investigation of tyrosinase inhibition by some 1,2,4 triazole derivative compounds: in vitro and in silico mechanisms
- Investigation of alanine, propionylcarnitine (C3) and 3-hydroxyisovalerylcarnitine (C5-OH) levels in patients with partial biotinidase deficiency
- The expression levels of miR-655-3p, miR127-5p, miR-369-3p, miR-544a in gastric cancer
- Evaluation of the JAK2 V617F gene mutation in myeloproliferative neoplasms cases: a one-center study from Eastern Anatolia
- Effects of Rituximab on JAK-STAT and NF-κB signaling pathways in acute lymphoblastic leukemia and chronic lymphocytic leukemia
- Analysis of the effect of DEK overexpression on the survival and proliferation of bone marrow stromal cells
- Serum fetuin-A levels and association with hematological parameters in chronic kidney disease and hemodialysis patients
- Investigation of relaxation times in 5-fluorouracil and human serum albumin mixtures
- Oxydative stress markers and cytokine levels in rosuvastatin-medicated hypercholesterolemia patients
- The protective effects of urapidil on lung tissue after intestinal ischemia-reperfusion injury
- Effects of SR-BI rs5888 and rs4238001 variations on hypertension
- Antioxidant and cytotoxic activity of three Turkish marine-derived fungi
- Is spectrophotometric enzymatic method a cost-effective alternative to indirect Ion Selective Electrode based method to measure electrolytes in small clinical laboratories?
- Plasma presepsin in determining gastric leaks following bariatric surgery