The simulation of the warpage rule of the thin-walled part of polypropylene composite based on the coupling effect of mold deformation and injection molding process
-
Jixiang Zhang
 ,
Fengzhi Liu
,
Fengzhi Liu

Abstract
Aiming at the problem that a thin-walled plastic part easily produces warpage, an orthogonal experimental method was used for multiparameter coupling analysis, with mold structure parameters and injection molding process parameters considered synthetically. The plastic part deformation under different experiment schemes was comparatively studied, and the key factors affecting the plastic part warpage were analyzed. Then the injection molding process was optimized. The results showed that the important order of the influence factors for the plastic part warpage was packing pressure, packing time, cooling plan, mold temperature, and melt temperature. Among them, packing pressure was the most significant factor. The optimal injection molding process schemes reducing the plastic part warpage were melt temperature (260°C), mold temperature (60°C), packing pressure (150 MPa), packing time (2 s), and cooling plan 3. In this situation, the forming plate flatness was better.
1 Introduction
With the development of computer, home appliance, communication, and automotive industry, people are more and more inclining to pursuit thin-walled, complex plastic part. Injection molding can complete plastic part with complex shape and precise size at a time. The molding process is a result of complex, nonlinear interaction effects of multiparameter coupling, which easily results in various defects, such as short shot, warpage, burn, weld line, and sink mark. Among them, warpage has the most obvious influence on plastic part quality [1], [2], [3]. Therefore, the injection simulation computer aided engineering (CAE) technology is often used to quantitatively analyze the injection molding process in the mold design process, to research the effects of mold structure and process parameters on plastic part quality, and to predict the occurrence of the design and manufacturing defects of the plastic part, which will provide theoretical basis for obtaining high-quality products.
Xu [4] regarded part warpage as the optimization goal and used the orthogonal experimental method combined with the mold flow analysis software Moldflow to optimize the injection molding process parameters for the thin-walled plastic part. Dong et al. [5] quantitatively analyzed shrinkage and warpage using a simulation program and studied the significant influence of the injection molding process parameters on it. Liao and Liu [6] simulated the packing process of plastic part using the Moldflow software and studied the effect of packing pressure and packing way on the plastic part warpage. Dong et al. [7] simulated a phone shell using numerical simulation technology and obtained a set of optimal process parameters, which make warpage minimum. Tang et al. [8] analyzed the effects of various injection molding process parameters on plastic part warpage and sought the optimal process parameters for plastic part warpage using the Taguchi method. Mlekusch [9] proposed a method to control plastic part warpage and calculated residual stress in the injection molding process using a nonlinear viscoelastic model. Ozcelik and Sonat [10] studied the thin-walled plastic part warpage with different thicknesses, and the result showed that the packing pressure had the greatest effect on it. Erzurumlu and Ozcelik [11] studied simulative plastic part warpage with different materials and different structures using the Moldflow software and optimized the process parameters. Yena et al. [12] designed the orthogonal experiment using the Taguchi method, simulated it using the Moldflow software, optimized the gating system, and reduced the warpage. Huang and Tai [13] used the Taguchi experimental design method to optimize the injection molding process and simulated the molding process of plastic part using the C-MOLD software. Research results showed that mold temperature, packing time, melt temperature, and packing pressure were the major factors affecting the plastic part warpage, whereas gate size and filling time had little effect on it. Jansen et al. [14] selected seven kinds of thermoplastic plastics, namely, PS, ABS, PC, HIPS, PP, PBT-GF30, and HDPE, and studied their effects on material’s shrinkage and warpage under the condition of a change in injection speed, mold temperature, and packing pressure. Experimental results showed that packing pressure and melt temperature were the greatest factors affecting shrinkage and warpage, whereas mold temperature and injection speed had little effect on it. Zhang et al. [15] researched the influence of process parameters on plastic part warpage using the orthogonal experimental method together with the Moldflow software. Azaman et al. [16] studied and compared the deflection and warpage of the thin-walled parts under different injection materials; the important parameters reducing volumetric shrinkage and warpage using lignocellulosic polymer composites for molded thin-walled parts [17]; the optimum parameter ranges making in-cavity residual stresses of the thin-walled parts minimum [18]; the effect of process parameters on shrinkage and warpage of the thin-walled parts and the optimization of the shrinkage and warpage of the thin-walled parts [19]; and the relationship between the types of thin-walled molded parts and in-cavity residual stresses and warpage [20].
The previosuly mentioned injection studies for thin-walled parts have not considered plastic part warpage caused by mold deformation. However, because of the great packing pressure and the influence of nonuniform temperature in thin-walled parts due to the injection molding process, mold deformation is much larger than that of normal injection molding. In recent years, some scholars begin to pay attention to mold deformation for thin-walled injection molding. Chang et al. [21] proposed that nonuniform flow pressure and mold temperature in the injection molding process can cause cavity deformation. Chen and Huang [22] used Moldflow analysis results as boundary conditions for the ANSYS analysis of cavity deformation and researched mold deformation. Liu et al. [23] studied the stiffness analysis of mold cavity using ANSYS and Moldflow software. They divided cavity surface into different areas, selected the average value of cavity surface stress obtained from Moldflow simulation as surface load input into ANSYS, and simulated the mold cavity, making the results closer to the actual injection molding process.
In this paper, Moldflow and ANSYS software combined with the orthogonal experimental method were used for multiparameter coupling analysis, with mold structure parameters and injection molding process parameters considered synthetically. Then the key factors and influence rules affecting plastic part warpage were found. The optimal process parameter combination and the optimal mold structure were obtained, and the goal of reducing plastic part warpage was achieved.
2 Finite element modeling and research schemes
2.1 Finite element modeling
2.1.1 Finite element modeling of Moldflow
Plastic part is an air filter sheet of mobile air conditioner. It has length, width, and average wall thickness of 238, 230, and 1 mm, respectively, as shown in Figure 1. The mould layout form is one module and one cavity, and the pinpoint gate is applied to the injection simulation. A finite element model is created using a double-sided unit type mesh, as shown in Figure 2.
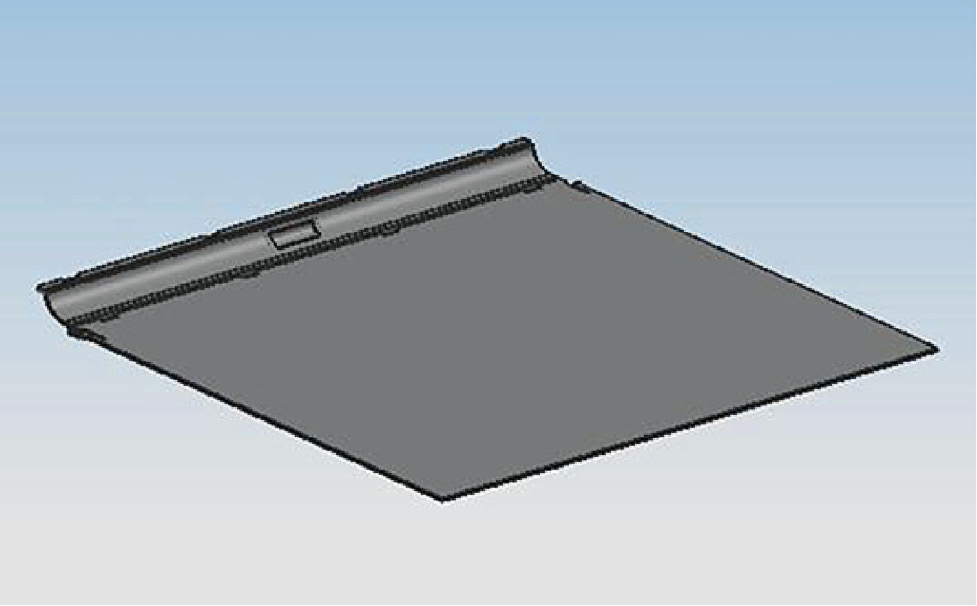
The thin-walled model.
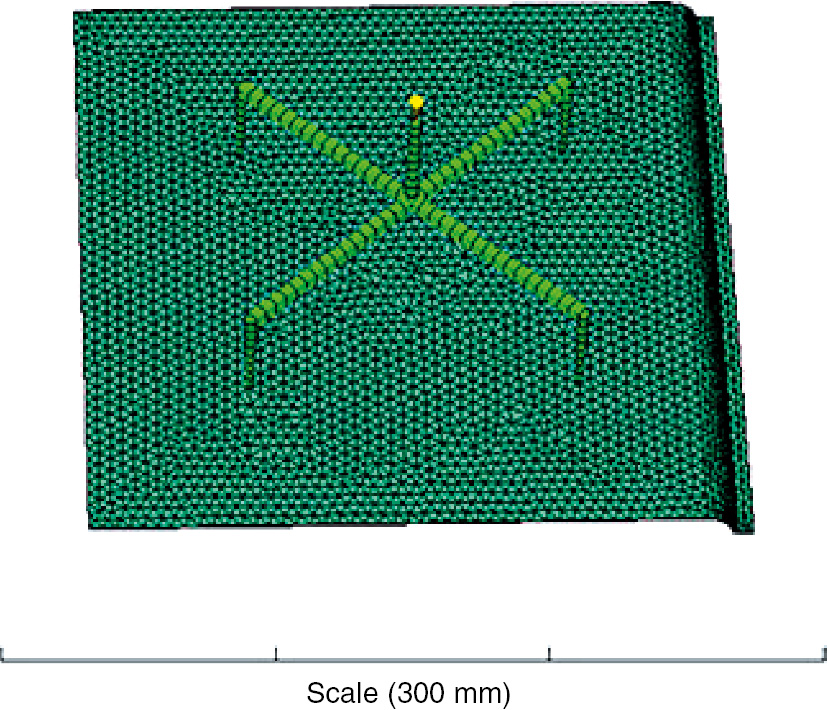
The finite element model of thin-walled part.
The crystalline polymer selected is polypropylene, and the melt fluidity of the material is good. Its basic performance parameters are shown in Table 1.
The basic performance parameters of material polypropylene.
| Material performance | Parameter value |
|---|---|
| Thermal conductivity (W/m °C) | 0.15 |
| Specific heat capacity (J/kg °C) | 3100 |
| Recommended injection temperature (°C) | 230 |
| Recommended top temperature (°C) | 93 |
| Recommended mold temperature (°C) | 50 |
2.1.2 Finite element modeling of ANSYS
First, the injection mold of the air filter sheet is created by the three-dimensional design software UG, as shown in Figure 3. Templates, top rods, and other institutions are simplified, then local holes and fillets are removed. The mold is meshed using the ANSYS software, and then a simplified finite element model is obtained, as shown in Figure 4. The part’s materials and the basic properties of the mold’s main force structure are shown in Tables 2 and 3, respectively.
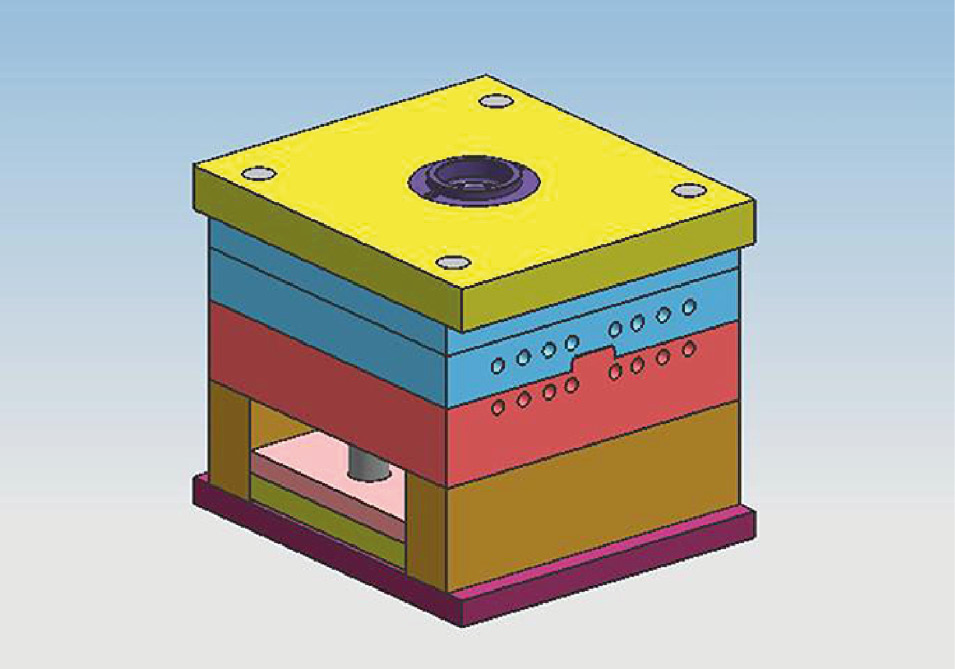
The mold structure.

The finite element model of mould.
Classification of the part’s mold materials.
| Material | Parts |
|---|---|
| P20 Steel | Fixed template, dynamic template, mold core, mold cavity |
| 45 Steel | Fixed clamping plate, moving clamping plate, square iron, shore |
Basic properties of the part’s mold materials.
| Mold material | P20 Steel | 45 Steel |
|---|---|---|
| Elasticity modulus (MPa) | 2.12E5 | 2.04E5 |
| Poisson’s ratio | 0.288 | 0.28 |
| Thermal conductivity (W/mK) | 35 | 49.8 |
| Yield strength (MPa) | 850 | 360 |
| Ultimate strength (MPa) | 1080 | 690 |
| Specific heat capacity (J/kg °C) | 460 | 468.2 |
| Coefficient of linear expansion (K) | 1.250E–5 | 1.232E–5 |
2.2 Research schemes
With minimum warpage as the optimization goal and with melt temperature, mold temperature, packing pressure, packing time, and mold structure (cooling plan) as variables, the research was conducted using the orthogonal experimental method.
According to the injection mold temperature field based on ANSYS analysis, four cooling plans are designed for the purpose of uniform temperature field, as shown in Table 4. The cooling pipes are symmetrically distributed and centered on the plastic part, as shown in Figure 5.
Cooling plan parameters.
| Cooling plan | Cooling circuit | Cooling pipe diameter/mm | Pipe distance from the center of the plastic part/mm |
|---|---|---|---|
| 1 | 4 | 8 | 18 |
| 2 | 8 | 8 | 18 |
| 3 | 8 | From the outer to the center 6 8 10 12 | 18 |
| 4 | 8 | From the outer to the center 6 8 10 12 | Respectively 12 18 24 30 |

The cooling plans: (A) cooling plan 1, (B) cooling plan 2, (C) cooling plan 3, and (D) cooling plan 4.
According to the characteristics of thin-walled injection molding, four levels for each factor are taken. An orthogonal experimental table with five factors and four levels is obtained, as shown in Table 5, and then the L16 orthogonal array is used, as shown in Table 6.
Orthogonal experimental table.
| Level | Melt temperature (A) (°C) | Mold temperature (B) (°C) | Packing pressure (C) (MPa) | Packing time (D) (s) | Cooling plan (E) |
|---|---|---|---|---|---|
| 1 | 230 | 20 | 30 | 2 | 1 |
| 2 | 245 | 40 | 70 | 6 | 2 |
| 3 | 260 | 60 | 110 | 10 | 3 |
| 4 | 275 | 80 | 150 | 14 | 4 |
L16 orthogonal array.
| Experiment no. | A | B | C | D | E |
|---|---|---|---|---|---|
| 1 | 230 | 20 | 30 | 2 | 1 |
| 2 | 230 | 40 | 70 | 6 | 2 |
| 3 | 230 | 60 | 110 | 10 | 3 |
| 4 | 230 | 80 | 150 | 14 | 4 |
| 5 | 245 | 20 | 70 | 10 | 4 |
| 6 | 245 | 40 | 30 | 14 | 3 |
| 7 | 245 | 60 | 150 | 2 | 2 |
| 8 | 245 | 80 | 110 | 6 | 1 |
| 9 | 260 | 20 | 110 | 14 | 2 |
| 10 | 260 | 40 | 150 | 10 | 1 |
| 11 | 260 | 60 | 30 | 6 | 4 |
| 12 | 260 | 80 | 70 | 2 | 3 |
| 13 | 275 | 20 | 150 | 6 | 3 |
| 14 | 275 | 40 | 110 | 2 | 4 |
| 15 | 275 | 60 | 70 | 14 | 1 |
| 16 | 275 | 80 | 30 | 10 | 2 |
3 Result analysis and discussion
3.1 Calculation of the plastic part deformation
The total deformation (deviation) ΔE of the plastic part in the Z direction includes deviation ΔEm caused by injection molding process and deviation ΔEa caused by mold deformation, and the formula is as follows:
Sixty-two data points are uniformly taken from the plastic part, as shown in Figure 6. The deviations ΔEm and ΔEa of each point of the plastic part in the Z direction after injection are calculated, and then the total deformation ΔE is calculated.

The distribution of data points.
3.2 Deformation analysis
Sixty-two data point deviations of every simulation experimental scheme are analyzed, and 16 groups of data normal distribution are obtained, as shown in Figure 7. It can be seen that the data obtained from 16 groups of schemes conform to normal distribution. The absolute deviation of data points reflects the local deformation degree of each point. Among them, some of the absolute deviations of scheme 2 data points are maximum, which reach 6.5 mm, indicating that the local deformation of the plastic part is maximum. Schemes 6, 8, 11, and 16 also have larger local deformation, whereas the absolute deviations of the data points of schemes 4, 7, 10, 12, and 13 are small, indicating that these plastic parts do not have prominent local deformation parts. Among them, the absolute deviation of scheme 13 is minimum, only 0.79 mm.
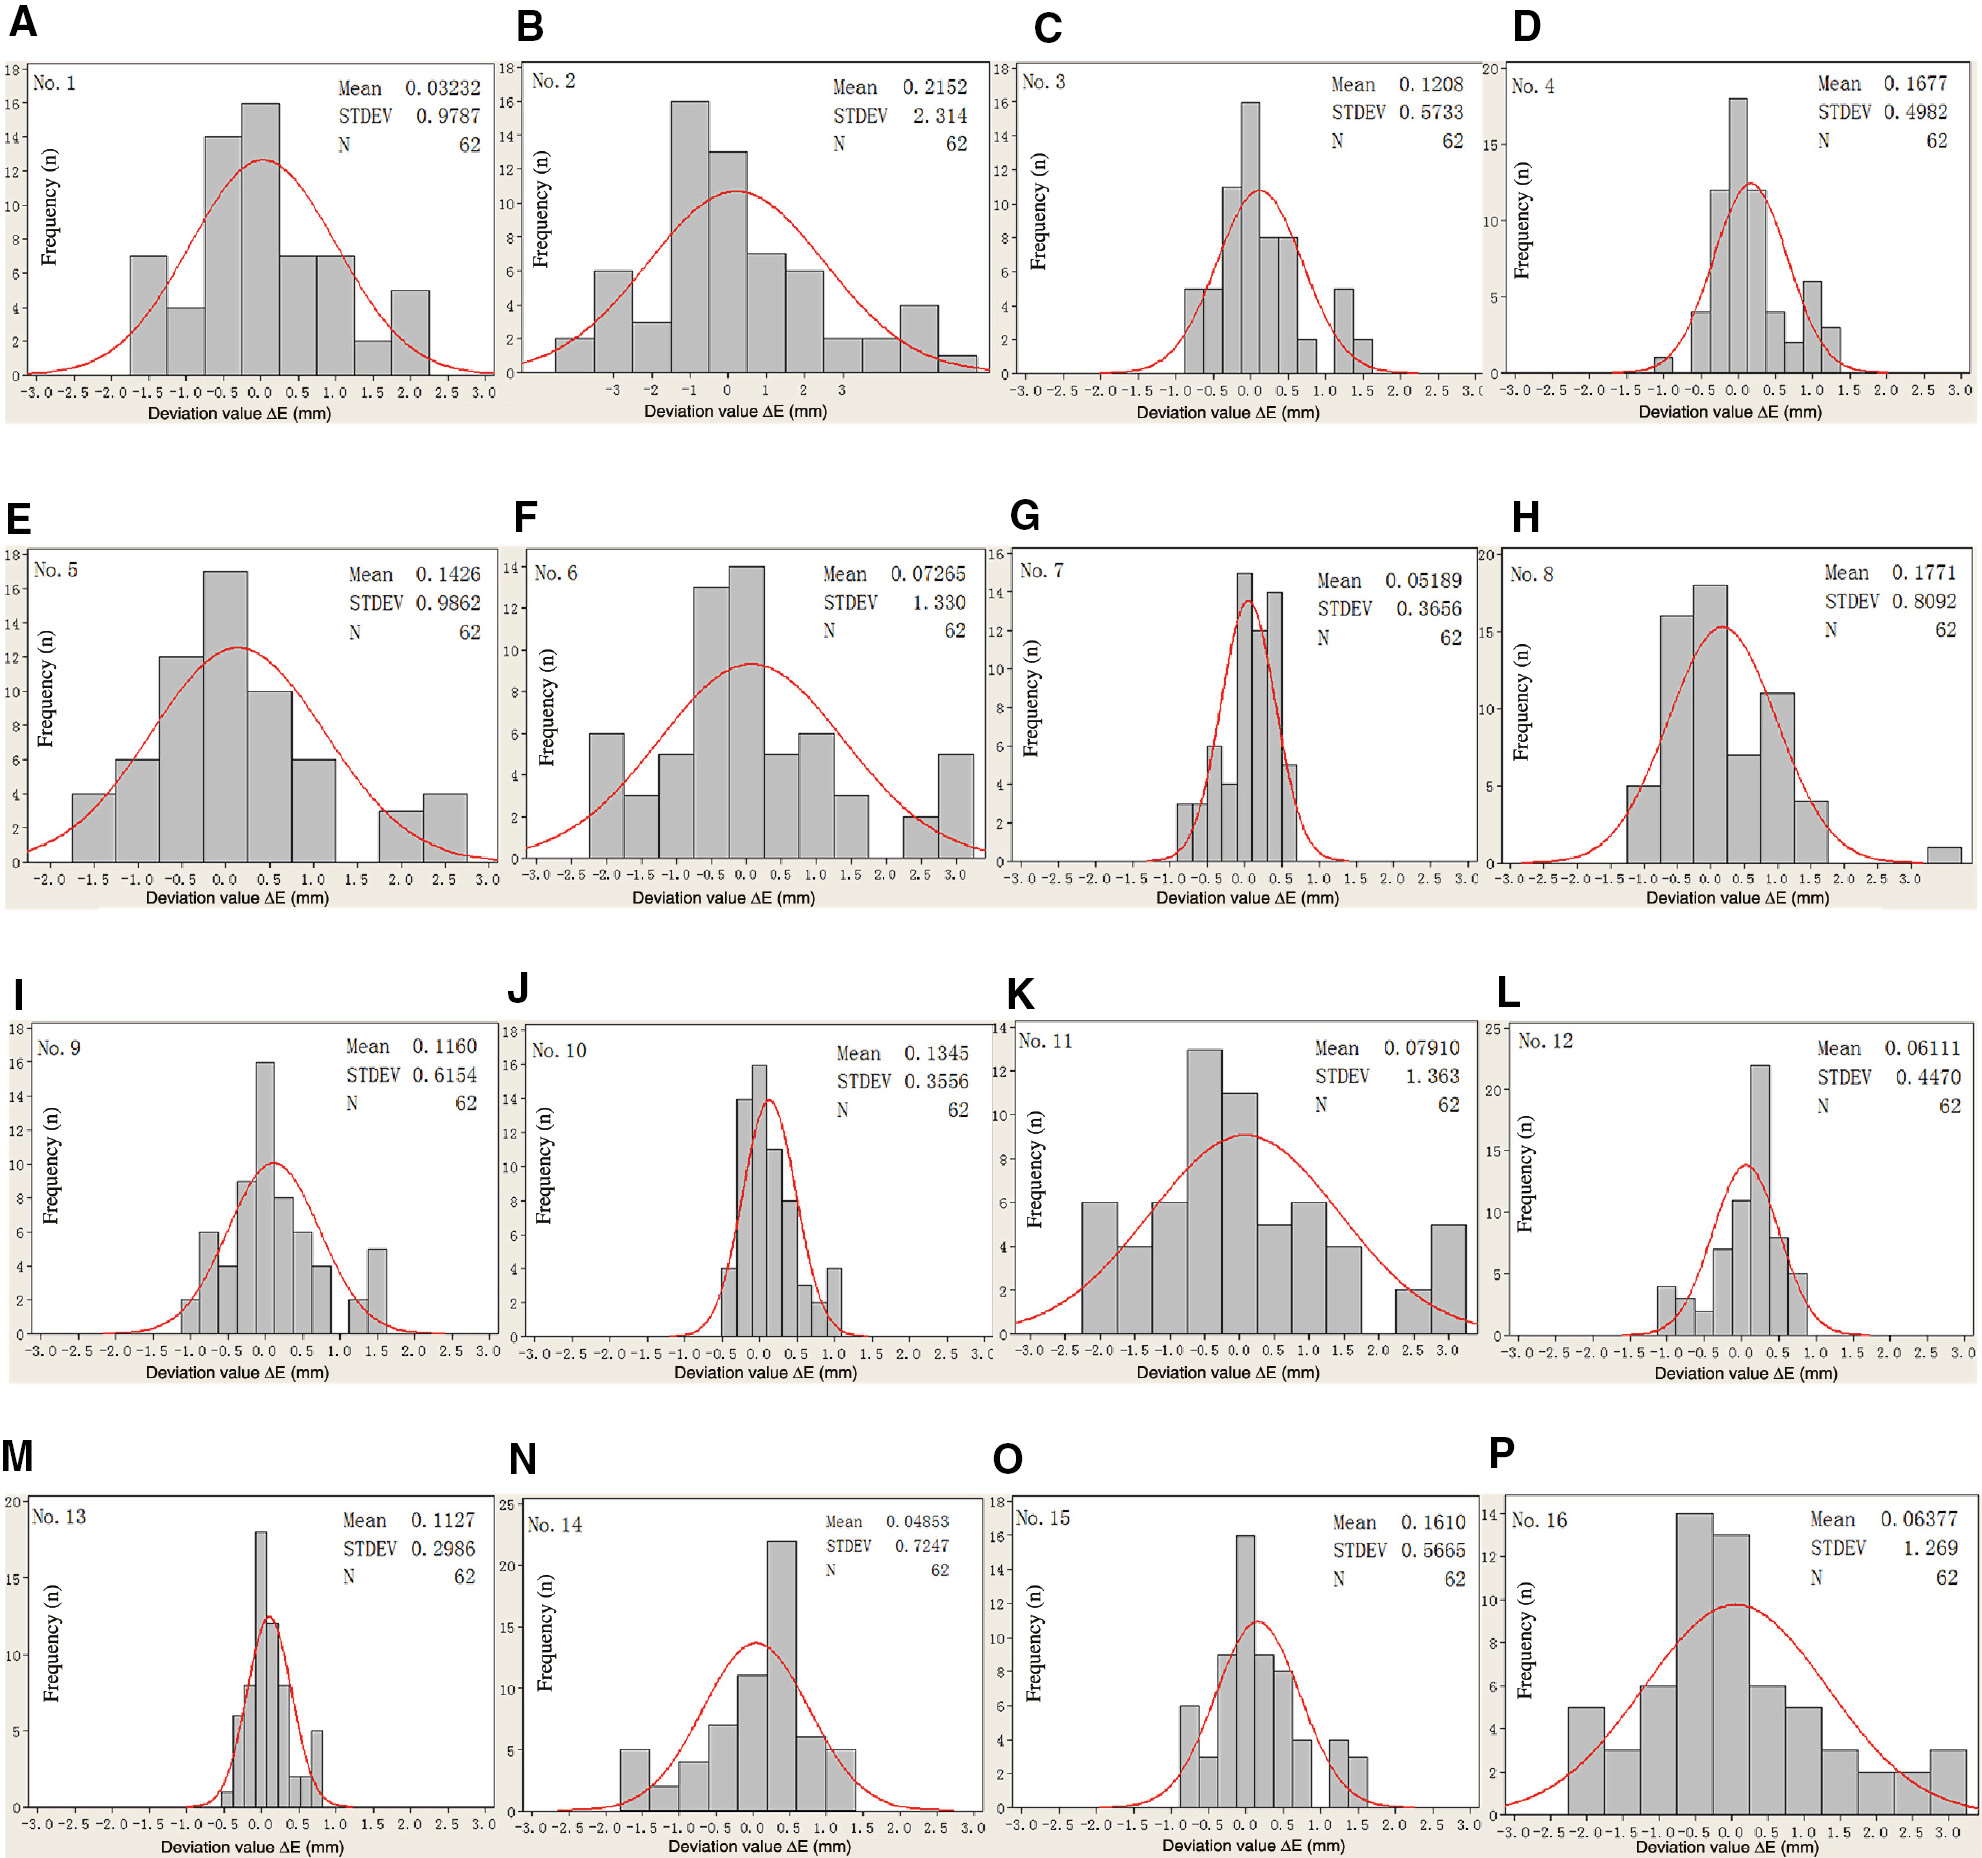
The normal distribution of 16 groups of experiment schemes data points: (A) scheme 1, (B) scheme 2, (C) scheme 3, (D) scheme 4, (E) scheme 5, (F) scheme 6, (G) scheme 7, (H) scheme 8, (I) scheme 9, (J) scheme 10, (K) scheme 11, (L) scheme 12, (M) scheme 13, (N) scheme 14, (O) scheme 15, (P), and scheme 16.
The standard deviation [24] is the cumulation of the local warpage of 62 points of plastic part and reflects the overall deformation degree of the plastic part. It can be seen from Figure 8 that the standard deviation of scheme 2 is up to 2.314 mm, indicating that the overall deformation of the plastic part is maximum. The standard deviation of schemes 6, 11, and 16 are also larger, so the overall deformation is also larger, whereas schemes 4, 7, 10, 12, and 13 are smaller, so the overall deformation is smaller. These results are consistent with the local deformation trend of the plastic part. The plastic part of scheme 2 is not only maximum local deformation but also maximum overall deformation, so scheme 2 is the worst. Schemes 6, 11, and 16 are also both larger deformation, so the three schemes are also poor, whereas schemes 4, 7, 10, 12, and 13 are better.

The standard deviation distribution of 16 schemes.
It can be seen from Table 6 that the better schemes 4, 7, 10, and 13 all need great packing pressure (150 MPa) in addition to scheme 12.
3.3 Significance analysis of the influence factors
K1, K2, K3, and K4 express the sum of simulation results of every experimental scheme, which have the same factor level, respectively, such as K1-A data, the sum of simulation results of four experiment schemes of factor A (melt temperature) level 1 (230°C), namely, the sum of the standard deviation of schemes 1–4. K3-C data are the sum of simulation results of four experiment schemes of factor C (packing pressure) level 3 (110 MPa), namely, the sum of the standard deviation of schemes 3, 8, 9, and 14, and other analogies. k1, k2, k3, and k4 are the average value of K, namely, K1/4, K2/4, K3/4, and K4/4. Range R describes the difference of the maximum and the minimum average values of experiment results of each parameter under different levels, namely,
Table 7 is the analysis results of range of the experiment data. Range R [25] reflects the effects of the corresponding factors on the index in the experiment. The levels of the factor that has a big range cause a big difference in the experiment results; thus, the factor is significant. However, the factor that has a small range is not significant. It can be analyzed from Table 7 that the important order of the significance of the influence factors is as follows: packing pressure, packing time, cooling plan, mold temperature, and melt temperature.
Analysis results of range of the experiment data.
| Factor | A | B | C | D | E |
|---|---|---|---|---|---|
| K1 | 4.364 | 2.879 | 4.940 | 2.516 | 2.710 |
| K2 | 3.491 | 4.724 | 4.314 | 4.785 | 4.564 |
| K3 | 2.781 | 2.868 | 2.723 | 3.184 | 2.649 |
| K4 | 2.859 | 3.024 | 1.518 | 3.010 | 3.572 |
| k1 | 1.091 | 0.720 | 1.235 | 0.629 | 0.678 |
| k2 | 0.873 | 1.181 | 1.079 | 1.196 | 1.141 |
| k3 | 0.695 | 0.717 | 0.681 | 0.796 | 0.662 |
| k4 | 0.715 | 0.756 | 0.380 | 0.753 | 0.893 |
| R | 0.396 | 0.464 | 0.855 | 0.567 | 0.479 |
Equation 3 is the sum of squared deviations. It quantitatively estimates the influence degree of each factor on the plastic part warpage, where q expresses the level number and y̅ is the average value of ki.
In Equation 4, f expresses freedom degree of each factor.
Variance F expresses a significant level of the influence of each factor.
Table 8 is the analysis results of variance of the experiment data. It can be seen that packing pressure is the significant factor affecting warpage, and F value is 0.601, followed by packing time, mold temperature, cooling plan, and melt temperature.
Analysis of variance table.
| Factor | Sum of squared deviations Si | Degree of freedom f | F | Significance |
|---|---|---|---|---|
| Melt temperature A (°C) | 0.403 | 3 | 0.134 | |
| Mold temperature B (°C) | 0.611 | 3 | 0.204 | |
| Packing pressure C (MPa) | 1.800 | 3 | 0.600 | Significant influence |
| Packing time D (s) | 0.723 | 3 | 0.241 | Significant influence |
| Cooling plan E | 0.605 | 3 | 0.202 | |
| Error | 0.004 | |||
| Sum | 4.146 | 15 |
3.4 Optimization of process parameters
Figure 9 shows the relationship of factor level and index K. For factor A, K1>K2>K4>K3. Hence, level 3 of factor A is the best, level 3 of factor B is the best, level 4 of factor C is the best, level 1 of factor D is the best, and level 3 of factor E is the best, namely, the optimal process scheme is A3B3C4D1E3. That is, the plastic part warpage is minimum using the injection molding process of melt temperature 260°C, mold temperature 60°C, packing pressure 150 MPa, packing time 2 s, and cooling plan 3.

The relationship of factor level and index.
3.5 Analysis of the optimization effect
The plastic part is the result of mold flow analysis by the Moldflow software and mold deformation analysis by the ANSYS software using the optimal process scheme A3B3C4D1E3. It can be known that the maximum deviation

The plastic part deformation caused by mold cavity.

The plastic part warpage.

The data points normal distribution under the optimal experiment scheme.

The comparison of standard deviation.

UG fitting graphs: (A) before optimization and (B) after optimization.
These results show that a comprehensive optimization effect is significant through the mold deformation and process parameters coupling in this paper, and it can reduce the thin-walled plastic part warpage obviously and improve the quality of the plastic part.
4 Conclusions
As to the local deformation of the plastic part, experiment scheme 2 is maximum; thus, it is the worst scheme. By contrast, the local deformation of schemes 4, 7, 10, 12, and 13 are small; thus, they are better. As to the overall deformation of the plastic part, scheme 2 is also the worst scheme, whereas schemes 4, 7, 10, 12, and 13 are better.
It can be known from the analysis of range of the orthogonal experiment data that the important order of the influence factors for the plastic part warpage is as follows: packing pressure, packing time, cooling plan, mold temperature, and melt temperature. It can be known from the analysis of variance of the experiment data that packing pressure is the significant factor affecting warpage, followed by packing time, mold temperature, cooling plan, and melt temperature.
It can be known from the optimization of process parameters that the optimal process scheme is A3B3C4D1E3 in the injection molding process, namely, the plastic part warpage is minimum using the injection molding process of melt temperature 260°C, mold temperature 60°C, packing pressure 150 MPa, packing time 2 s, and cooling plan 3.
The plastic part is the result of mold flow analysis by the Moldflow software and mold deformation analysis by the ANSYS software using the optimal process scheme. As a result, the warpage degree of the plastic part reduces significantly, and plate flatness is better. It indicates that a comprehensive optimization effect is significant through the mold deformation and process parameters coupling in this paper, and it can reduce the thin-walled plastic part warpage obviously and improve the quality of the plastic part.
This paper studied the effect of mold structure parameters and injection molding process parameters on the warpage of the thin-walled part. Previous works studied only the effect of injection molding process parameters on the warpage of the thin-walled part.
Acknowledgments
This work was supported by the Original Program of Chongqing Foundational and Frontier Research Plan (grant no. cstc2013jcyjA70015) and the Science and Technology Research Program of Education Council of Chongqing (grant no. KJ080407).
References
[1] Song M, Yan K. Plastics Sci. Technol. 2006, 34, 51–54.10.1016/S0034-3617(08)70132-2Search in Google Scholar
[2] Sun B, Chen Z, Wu Z, Gu B, Huang X. Machinery 2009, 47(544), 25–29.Search in Google Scholar
[3] Wang G, Zhao G, Li H, Guan Y. China Mech. Eng. 2009, 20(4), 488–492.10.1007/s11460-009-0002-5Search in Google Scholar
[4] Xu L. Die Mould. Technol. 2007, 25(2), 28–32.10.1007/s10550-007-0055-zSearch in Google Scholar
[5] Dong B, Shen C, Liu C. Polym. Mater. Sci. Eng. 2005, 21(4), 232–235.Search in Google Scholar
[6] Qiuhui Liao, Shumei Liu. Plastics Sci. Technol. 2009, 37(10), 67–69.Search in Google Scholar
[7] Dong J, Dong B, Zhang X, Li J, Shen C. Die Mould Ind. 2004, 283(9), 30–34.Search in Google Scholar
[8] Tang SH, Tan YJ, Sapuan SM, Sulaiman S, Ismail N, Samin R. J. Mater. Process. Technol. 2007, 182, 418–426.10.1016/j.jmatprotec.2006.08.025Search in Google Scholar
[9] Mlekusch BA. Mech Time-Depend. Mater. 2002, 2, 10–14.Search in Google Scholar
[10] Ozcelik B, Sonat I. Mater. Des. 2009, 367–375.10.1016/j.matdes.2008.04.053Search in Google Scholar
[11] Erzurumlu T, Ozcelik B. Mater. Des. 2006, 27, 853–861.10.1016/j.matdes.2005.03.017Search in Google Scholar
[12] Yen C, Lin JC, Li W, Huang MF. J. Mater. Process. Technol. 2006, 174, 22–28.10.1016/j.jmatprotec.2005.02.233Search in Google Scholar
[13] Huang M-C, Tai C-C. J. Mater. Process. Technol. 2001, 110, 1–9.10.1016/S0924-0136(00)00649-XSearch in Google Scholar
[14] Jansen KMB, Dijk DJV, Husselman MH. Polym. Eng. Sci. 1998, 38, 838–846.10.1002/pen.10249Search in Google Scholar
[15] Zhang J, Qin H, Gao B, Xu Y, Liu Z. Plast. Ind. 2013, 41, 64–67.Search in Google Scholar
[16] Azaman MD, Sapuan SM, Sulaiman S, Zainudin ES, Khalina A. Int. J. Polym. Sci. 2015, 52, 1018–1026.Search in Google Scholar
[17] Azaman MD, Sapuan SM, Sulaiman S, Zainudin ES, Khalina A. Polym. Eng. Sci. 2014, 55, 1082–1095.10.1002/pen.23979Search in Google Scholar
[18] Azaman MD, Sapuan SM, Sulaiman S, Zainudin ES, Khalina A. Mater. Des. 2014, 55, 381–386.10.1016/j.matdes.2013.09.041Search in Google Scholar
[19] Azaman MD, Sapuan SM, Sulaiman S, Zainudin ES, Khalina A. Mater. Des. 2013, 52, 1018–1026.10.1016/j.matdes.2013.06.047Search in Google Scholar
[20] MD Azaman, SM Sapuan, Sulaiman S, Zainudin ES, Abdan K. Mater. Des. 2013, 50, 451–456.10.1016/j.matdes.2013.03.036Search in Google Scholar
[21] Chang RY, PYeng AY, Yang W-H. Mold deformation effects on ultra-thin wall injection-molded parts. Annual Technical Conference-ANTEC. Conference Proceedings of the Society of Plastics Engineers Annual Technical Conference 2006, ANTEC2006-Conference Proceedings. 2006, 1304–1308.Search in Google Scholar
[22] Chen Z, Huang F. Mach. Des. Manuf. 2009, 246–248.Search in Google Scholar
[23] Liu B, Qin MR, Feng YH, Jin-Ping Q. Die Mould Ind. 2007, 33, 1–4.Search in Google Scholar
[24] Chen X. Optimization of Process Parameters for Thin Plastic Shell Injection Molding. Hang Zhou: Zhejiang University, 2005.Search in Google Scholar
[25] Yang H, Zhan M. The Experiment Modeling Method of Material Processing. Xi An: Northwestern Polytechnical University Press, 2008, 12.Search in Google Scholar
©2018 Walter de Gruyter GmbH, Berlin/Boston
This article is distributed under the terms of the Creative Commons Attribution Non-Commercial License, which permits unrestricted non-commercial use, distribution, and reproduction in any medium, provided the original work is properly cited.
Articles in the same Issue
- Frontmatter
- Original articles
- Review of the mechanical performance of variable stiffness design fiber-reinforced composites
- Exact solution for bending analysis of functionally graded micro-plates based on strain gradient theory
- Synthesis, microstructure, and mechanical properties of in situ TiB2/Al-4.5Cu composites
- Microstructure and properties of W-Cu/1Cr18Ni9 steel brazed joint with different Ni-based filler metals
- Drilling studies on the prepared aluminum metal matrix composite from wet grinder stone dust particles
- Studies on mechanical properties of thermoplastic composites prepared from flax-polypropylene needle punched nonwovens
- Design of and with thin-ply non-crimp fabric as building blocks for composites
- Effect of coir fiber reinforcement on mechanical properties of vulcanized natural rubber composites
- Investigation and analysis of glass fabric/PVC composite laminates processing parameters
- Abrasive wear behavior of silane treated nanoalumina filled dental composite under food slurry and distilled water condition
- Finite element study into the effects of fiber orientations and stacking sequence on drilling induced delamination in CFRP/Al stack
- Preparation of PAA/WO3 composite films with enhanced electrochromism via layer-by-layer method
- Effect of alkali treatment on hair fiber as reinforcement of HDPE composites: mechanical properties and water absorption behavior
- Integration of nano-Al with one-step synthesis of MoO3 nanobelts to realize high exothermic nanothermite
- A time-of-flight revising approach to improve the image quality of Lamb wave tomography for the detection of defects in composite panels
- The simulation of the warpage rule of the thin-walled part of polypropylene composite based on the coupling effect of mold deformation and injection molding process
- Novel preparation method and the characterization of polyurethane-acrylate/ nano-SiO2 emulsions
- Microwave properties of natural rubber based composites containing carbon black-magnetite hybrid fillers
- Simulation on impact response of FMLs: effect of fiber stacking sequence, thickness, and incident angle