A time-of-flight revising approach to improve the image quality of Lamb wave tomography for the detection of defects in composite panels
-
Liang Chen
 ,
Qiang Xiao
,
Qiang Xiao

Abstract
Lamb wave tomography can be used to evaluate structural integrity. The time-of-flight (TOF) data are usually recorded as input to the reconstruction algorithm. For composite materials, TOF estimation is complicated due to their anisotropy. To reduce the effects of anisotropy on image reconstruction, the TOF data of flawed plates are revised according to baseline data obtained from an unflawed plate. Tomographic images are reconstructed using the original and revised TOF data, respectively. Results show that images reconstructed using the revised TOF data have better visual quality and that TOF data revision can substantially reduce the artifacts resulting from anisotropy in defect detection of composite materials.
1 Introduction
Carbon fiber-reinforced polymer (CFRP) is one of the composite materials that are used extensively in many fields such as aerospace, marine, petrochemicals, energy, construction, and transport sectors for functional and economic reasons. To decrease the number of tragic accidents in composite structures, some efforts have been made to find the best nondestructive testing method for composite thin plate-like structures. Bruno et al. [1] applied holographic vibrometry to local delaminations revealed in sandwich-type composite plates. Renaldas et al. [2] detected flaws in CFRP rods with multiple delaminations using ultrasonic guided waves. Mahmoud et al. [3] used surface acoustic waves (SAWs) for the nondestructive structural health monitoring of concrete specimens externally bonded with CFRP composites. Palozotto et al. [4] used vibration NDE for estimating the impact damage of sandwich composite structures reinforced in the thickness direction. Ruzek et al. [5] tried to apply laser shearography to impact damage detection in aircraft wings made with a honeycomb sandwich structure. A wireless method was proposed recently by Matsuzaki and Todoroki [6] to detect damage in rotating composite structures using a small oscillating circuit.
Lamb waves represent one kind of guided waves with multimode and dispersion character [7], [8], [9], which makes them widely used for the nondestructive testing of plates and plate-like structures. X-ray computed tomography is a mature technique that uses X-rays to obtain 2D images [10]. Just like X-rays, Lamb waves have also been used for computed tomography because they have distinctive dispersion characteristics. Many research studies have been conducted for Lamb wave tomography in the past decades. Hutchins and colleagues [11], [12], [13], [14] carried out a great deal of early works on Lamb wave tomography, and Nagata et al. [15] and Degertekin et al. [16] also conducted investigations in the field. The velocity or attenuation of Lamb waves was the input for tomographic reconstruction with parallel-projection geometry. Hinders and colleagues [17], [18], [19] compared parallel projection to fan-beam technique in the defect detection of multilayer materials with algebraic reconstruction technique (ART).
For this work, choosing the appropriate input for the tomographic reconstruction is rather important. Time-of-flight (TOF) data of Lamb wave is a type of input data that contains useful information about the changes in the thickness of plate-like structures because the velocity of Lamb waves depends on frequency-thickness and the material properties of the specimen. However, when propagating in composite materials, the velocity of Lamb wave also depends on the direction of wave propagation due to their anisotropy. The study aims to reduce the effects of anisotropy on image reconstruction. This paper is organized as follows. In Section 2, the fundamentals of fan-beam technique and filtered back-projection (FBP) algorithm are presented. TOF data are obtained through finite element (FE) simulation and data revision is performed in Section 3. In Section 4, tomographic images are reconstructed using original and revised TOF data with a FBP algorithm, and then some parameters of images are calculated for image quality evaluation. Finally, conclusions are drawn in Section 5.
2 Fundamentals of fan-beam technique and FBP algorithm
Figure 1 shows the geometry of the fan-beam technique. The point source is at distance D from the origin. Each detector receives projection data qi(nγ). Then, the projection data is weighted and filtered to yield Qi(nγ), which is back-projected to reconstruct tomographic images by the FBP algorithm as shown in the following equation [20]:

Geometry of the fan-beam technique.
where L(x,y,βi) is the distance from the point source to the point (x,y), βi is the ith projection angle, and
where g(nγ) is given as follows:
3 FE simulation and TOF revision
In this section, three FE models are built by ABAQUS for plates made of material T300/QY8911. The material properties are provided in Table 1.
Material properties of T300/QY8911.
| E1 (GPa) | E2 (GPa) | E3 (GPa) | G12 (GPa) | G13 (GPa) | G23 (GPa) | v12 | v13 | v23 | ρ (kg/m3) |
|---|---|---|---|---|---|---|---|---|---|
| 126 | 8.8 | 8.8 | 4.47 | 4.47 | 3.0 | 0.3 | 0.3 | 0.3 | 1614 |
ρ=density; E=Young’s modulus; v=Poisson’s ratio; G=shear modulus.
Table 2 shows the characteristics of the three models. The first one is an unflawed plate, and the other two are flawed plates with a hole of Ø 10 mm×2 mm in coordinates (0,0) and (15,20). These are represented by models 1, 2, and 3, respectively.
Characteristics of the models.
| Number | Dimension | Size of hole | Coordinates of hole |
|---|---|---|---|
| 1 | Ø 200 mm×4 mm | – | – |
| 2 | Ø 200 mm×4 mm | φ 10 mm×2 mm | (0,0) |
| 3 | Ø 200 mm×4 mm | φ 10 mm×2 mm | (15,20) |
To obtain projection data, sensors are arranged as presented in Figure 2. The area is divided into two parts: area 1 is the detection area with a dimension of R=50 and the remaining area is the protection area that eliminates the effects of reflected wave from the boundary. Sixty-four sensors are arranged in the circle of area 1 in an equiangular manner. One of them is a point source that transmits an ultrasonic signal, and the remaining 63 sensors are detectors that receive signals from the point source along different paths. Considering the multimode and dispersion character of Lamb waves, a five-cycle Hanning-windowed pulse centered at 100 kHz is employed as the excitation signal of the point source.
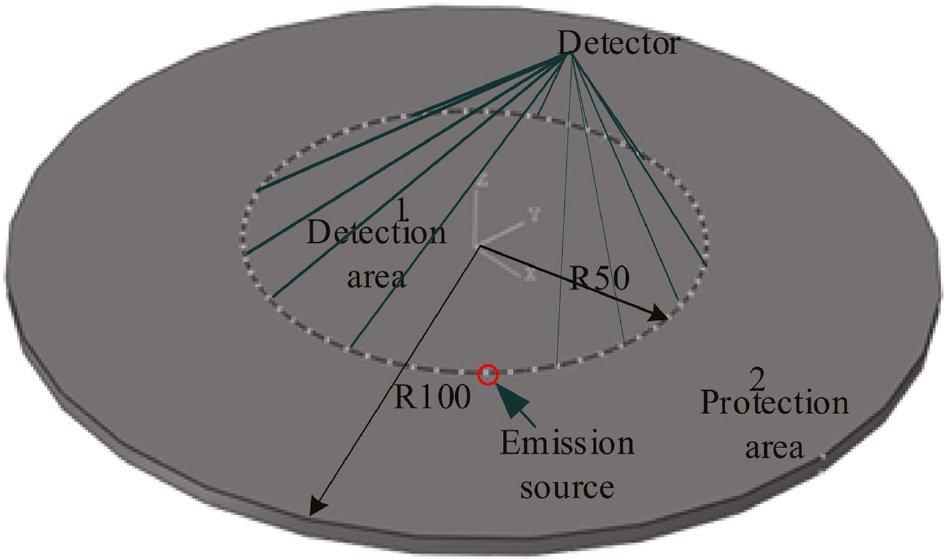
Sensor arrangement and region partition of the models.
Two snapshots of the Lamb waves (in the form of displacement contour) propagating in two different models are shown in Figure 3. In Figure 3A, we can see that the Lamb waves propagate around from the point source in the form of a wave package. When they reach the boundary of the plate, they will reflect back. The snapshot shown in Figure 3A clearly presents that the Lamb waves travel a longer distance along the x-direction (fiber direction) than the other directions. It shows that the Lamb waves travel fastest at the fiber direction. From the color depth of the wave packages, we can see that the direction of maximum energy flow in the plate coincides with the fiber direction. The snapshot in Figure 3B shows that, when the Lamb waves reach the defect, they will pass through it accompanied by phenomena of reflection and diffraction. It presents that the properties of Lamb waves will change when passing through the hole.

Propagation of Lamb wave in two different models: (A) an unflawed model and (B) the flawed model with a hole in the center.
TOF is a kind of parameter that contains useful information about the changes of Lamb wave properties. Therefore, TOF data of A0 mode wave are collected as input for image reconstruction. For each point source, 63 sets of signals can be received from detectors. The envelope extraction of these signals by Hilbert transform is used to obtain the TOF of the A0 mode wave. Therefore, 64×63 TOF data are obtained in total.
When propagating in composite materials, the velocity of Lamb waves depends not only on frequency-thickness and material properties but also on the direction of wave propagation of the specimen due to their anisotropy. The velocities of the A0 mode wave propagating in 64 different directions are calculated by scanning the unflawed model as shown in Figure 4. This quantifies how the velocity of the A0 mode wave propagating in the plate varies with the direction of propagation. θ is the angle between the propagating path and the fiber direction, and 0° is along the fiber direction. The directions of maximum and minimum velocities of the A0 mode wave propagating in the plate coincide with the direction parallel and perpendicular to the fiber direction, respectively. The velocities of other directions are obtained by interpolation. Then, the original TOF data are revised according to the baseline velocities of the A0 mode wave in different directions. The revised data are calculated as follows:

Velocities of the A0 mode wave of central frequency 100 kHz propagating in a 4 mm thick T300/QY8911 plate in different directions.
where TOForiginal is the original TOF data of flawed models, Lpath is the distance between the point source and a detector, vθ is velocity of A0 mode wave, and the angle is θ.
Figure 5 shows a set of the original normalized TOF data obtained from a flawed model with a hole in the center and the revised normalized TOF data profile through the flaw region. The part circled in red shows that the TOF values of the A0 mode wave have changed because the velocity of the A0 mode wave will decrease when passing through the defect according to its dispersion properties. In Figure 5, the changes in TOF values can be difficult to identify in the original TOF data profile due to the velocity changes caused by wave propagation directions in composite materials. However, these changes are easily identified in the revised TOF data profile due to the TOF revision.

A set of the original normalized TOF data obtained from the flawed model with a hole in the center and the revised TOF data profile through the flaw region.
4 Image reconstruction
A FBP algorithm based on the fan-beam technique is applied to image reconstruction. Figure 6 shows the tomographic images reconstructed using the original TOF data. Figure 6A–C presents the reconstruction images of models 1, 2, and 3, respectively. Some artifacts can be easily found in Figure 6A. It can be inferred that these artifacts are caused by the anisotropy of the composite material T300/QY8911 and errors of TOF data brought by reflection and diffraction. These same artifacts also occur as shown in Figure 6B and C. In Figure 6B, the part circled in red presents the reconstruction image of the defect in the center of model 2. The location, shape, and size of this part coincide with that of the defect in model 2. In Figure 6C, the part that presents the reconstruction image of the defect is also circled in red. The location of this part coincides with that of the defect in model 3, but the shape and size presented by this part have changed. It can be inferred that the short distance from the defect to the boundary of the detection area in model 3 makes it easier for received signals to be disturbed by the reflection and diffraction when compared to model 2, resulting in changes in the shape and size of the reconstruction image of the defect in model 3.

Tomographic images reconstructed using the original TOF data of the three models: (A) an unflawed model, (B) a flawed model with a hole in the center, and (C) a flawed model with a hole in coordinates (15,20).
Images reconstructed using the revised TOF data are presented in Figure 7. Images of defects can be clearly identified in Figure 7A and B. In Figure 7A, the part circled in red presents the reconstruction image of the defect in the center of model 2. The location, shape, and size of this part coincide with that of the defect in model 2. In Figure 7B, the part that presents the reconstruction image of the defect is also circled in red. The location of this part coincides with that of the defect in model 3, but the shape and size presented by this part have changed. Compared to images reconstructed using the original TOF data, the part that presents the reconstruction image of the defect can be more easily identified in images reconstructed using the revised TOF data. It shows that images reconstructed using the revised TOF data have fewer artifacts and higher quality.
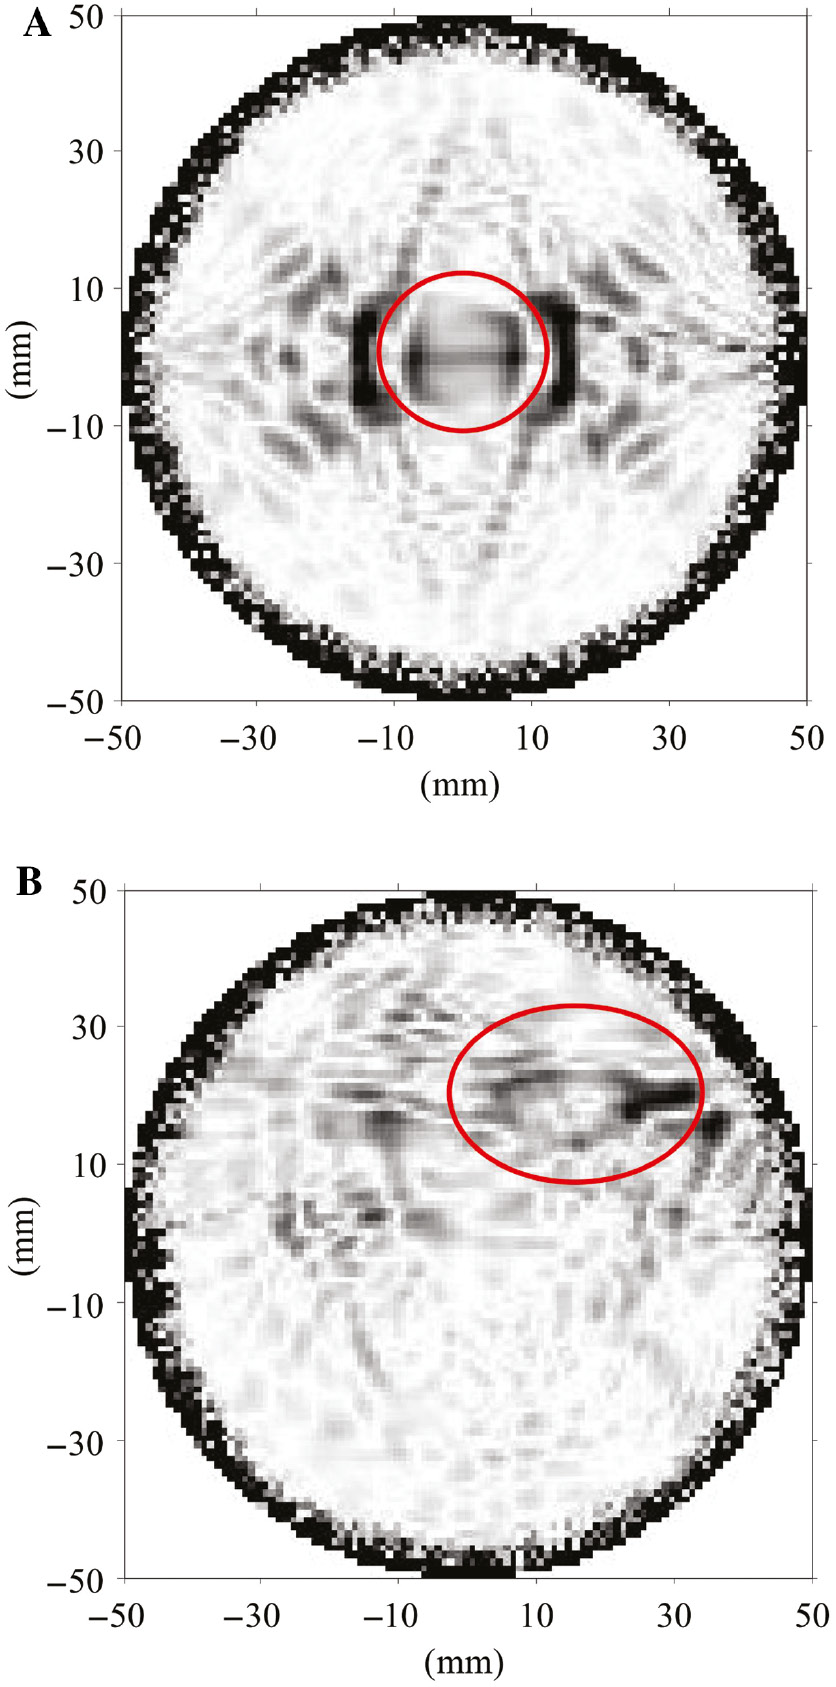
Tomographic images of flawed models reconstructed using the revised TOF data: (A) a flawed model with a hole in the center and (B) a flawed model with a hole in coordinates (15,20).
To evaluate the qualities of images reconstructed using the original TOF data and revised data, peak signal-to-noise ratio (PSNR), mean squared error (MSE), and mean gradient of Figures 6B and C and 7A and B are listed in Table 3. From the table, we can see that the PSNR values of Figure 7A and B are higher than those of Figure 6B and C, respectively. The MSE and mean gradient values of Figure 7A and B are lower than those of Figure 6B and C, respectively. The increase in PSNR values and the decrease in MSE indicate that TOF data revision has improved the signal-to-noise ratio in tomographic image reconstruction. The decrease in mean gradient values indicates that the artifacts in image reconstruction have been reduced significantly by revising the data. Thus, it can be concluded that tomographic images reconstructed using revised TOF data with a FBP algorithm have better visual quality.
5 Conclusions
This paper focuses on defect detection in thin plates made of composite materials using Lamb wave tomography. Three different models are built in ABAQUS for numerical simulation to obtain TOF data of the A0 mode wave. Then, TOF data revision has been done according to the baseline data obtained from the unflawed model. Tomographic images of flawed models are reconstructed using the original and revised TOF data, respectively. The results show that images reconstructed using the revised TOF data have better visual quality and the TOF data revision can substantially reduce the artifacts resulting from anisotropy in defect detection of composite materials.
Funding source: National Natural Science Foundation of China
Award Identifier / Grant number: 61472050
Funding statement: This work was supported by the National Natural Science Foundation of China (Grant No. 61472050), Applied Basic Research Programs of Sichuan Province (2014JY0257), and Postdoctoral Foundation of China (145067).
Acknowledgments
This work was supported by the National Natural Science Foundation of China (Grant No. 61472050), Applied Basic Research Programs of Sichuan Province (2014JY0257), and Postdoctoral Foundation of China (145067).
References
[1] Bruno F, Laurent J, Prada C, Lamboul B, Passilly B, Atlan M. J. Appl. Phys. 2014, 115, 154503.10.1063/1.4871178Search in Google Scholar
[2] Renaldas R, Rymantas K, Egidijus Z, Liudas M, Alfonsas V. NDT&E Int. 2010, 43, 416–424.10.1016/j.ndteint.2010.04.001Search in Google Scholar
[3] Mahmoud AM, Ammar HH, Mukdadi OM, Ray I, Imani S, Chen A, Davalos JF. NDT&E Int. 2010, 43, 635–641.10.1016/j.ndteint.2010.06.008Search in Google Scholar
[4] Palozotto AN, Gummadi LNB, Vaidya UK, Herrup FJ. Compos. Struct. 1999, 43, 275–288.10.1016/S0263-8223(98)00110-XSearch in Google Scholar
[5] Ruzek R, Lohonka R, Jironc J. NDT&E Int. 2006, 39, 132–142.10.1016/j.ndteint.2005.07.012Search in Google Scholar
[6] Matsuzaki R, Todoroki A. Compos. Sci. Technol. 2006, 66, 407–416.10.1016/j.compscitech.2005.07.016Search in Google Scholar
[7] Rose JL. Ultrasonic Waves in Solid Media. Cambridge University: Cambridge, 1999.Search in Google Scholar
[8] Kang L, Wang SJ, Jiang T, Zhai GF. Jpn. J. Appl. Phys. 2011, 50, 07HD01.10.7567/JJAP.50.07HD01Search in Google Scholar
[9] Kang L, Dixon S, Wang KC, Dai JM. NDT&E Int. 2013, 59, 11–17.10.1016/j.ndteint.2013.05.003Search in Google Scholar
[10] Seeram E. Computed Tomography – Physical Principles, Clinical Applications and Quality Control. 3rd ed. Saunders Elsevier: Missouri, 2009.Search in Google Scholar
[11] Wright W, Hutchins D, Jansen D, Schindel D. IEEE Trans. Ultrason. Ferroelectr. Freq. Control 1997, 44, 53–59.10.1109/58.585190Search in Google Scholar
[12] Jansen DP, Hutchins DA, Mottram JT. Ultrasonics 1994, 32, 83–89.10.1016/0041-624X(94)90015-9Search in Google Scholar
[13] Hutchins DA, Jansen DP, Edwards C. Ultrasonics 1993, 31, 97–103.10.1016/0041-624X(93)90039-3Search in Google Scholar
[14] Jansen DP, Hutchins DA. Ultrasonics 1992, 30, 245–254.10.1016/0041-624X(92)90084-YSearch in Google Scholar
[15] Nagata Y, Huang J, Achenbach JD, Krishnaswamy S. Rev. Prog. QNDE 1995, 14, 561–568.10.1007/978-1-4615-1987-4_68Search in Google Scholar
[16] Degertekin FL, Pei J, Khuri-Yakub BT, Saraswat KC. Appl. Phys. Lett. 1994, 64, 1338–1340.10.1063/1.111927Search in Google Scholar
[17] Hinders MK, Malyarenko EV, McKeon JCP. J. Acoust. Soc. Am. 1998, 104, 1790–1791.10.1121/1.423524Search in Google Scholar
[18] McKeon JCP, Hinders MK. J. Acoust. Soc. Am. 1999, 106, 2568–2577.10.1121/1.428088Search in Google Scholar
[19] Hinders MK, Malyarenko EV. J. Acoust. Soc. Am. 2000, 108, 1631–1639.10.1121/1.1289663Search in Google Scholar PubMed
[20] Kak AC, Slaney M. Principles of Computerized Tomographic Imaging. IEEE: New York, 1988.Search in Google Scholar
©2018 Walter de Gruyter GmbH, Berlin/Boston
This article is distributed under the terms of the Creative Commons Attribution Non-Commercial License, which permits unrestricted non-commercial use, distribution, and reproduction in any medium, provided the original work is properly cited.
Articles in the same Issue
- Frontmatter
- Original articles
- Review of the mechanical performance of variable stiffness design fiber-reinforced composites
- Exact solution for bending analysis of functionally graded micro-plates based on strain gradient theory
- Synthesis, microstructure, and mechanical properties of in situ TiB2/Al-4.5Cu composites
- Microstructure and properties of W-Cu/1Cr18Ni9 steel brazed joint with different Ni-based filler metals
- Drilling studies on the prepared aluminum metal matrix composite from wet grinder stone dust particles
- Studies on mechanical properties of thermoplastic composites prepared from flax-polypropylene needle punched nonwovens
- Design of and with thin-ply non-crimp fabric as building blocks for composites
- Effect of coir fiber reinforcement on mechanical properties of vulcanized natural rubber composites
- Investigation and analysis of glass fabric/PVC composite laminates processing parameters
- Abrasive wear behavior of silane treated nanoalumina filled dental composite under food slurry and distilled water condition
- Finite element study into the effects of fiber orientations and stacking sequence on drilling induced delamination in CFRP/Al stack
- Preparation of PAA/WO3 composite films with enhanced electrochromism via layer-by-layer method
- Effect of alkali treatment on hair fiber as reinforcement of HDPE composites: mechanical properties and water absorption behavior
- Integration of nano-Al with one-step synthesis of MoO3 nanobelts to realize high exothermic nanothermite
- A time-of-flight revising approach to improve the image quality of Lamb wave tomography for the detection of defects in composite panels
- The simulation of the warpage rule of the thin-walled part of polypropylene composite based on the coupling effect of mold deformation and injection molding process
- Novel preparation method and the characterization of polyurethane-acrylate/ nano-SiO2 emulsions
- Microwave properties of natural rubber based composites containing carbon black-magnetite hybrid fillers
- Simulation on impact response of FMLs: effect of fiber stacking sequence, thickness, and incident angle