Studies on mechanical properties of thermoplastic composites prepared from flax-polypropylene needle punched nonwovens
-
V.R. Giri Dev
 and
A.K.P. Dhanakodi
and
A.K.P. Dhanakodi

Abstract
Natural fiber reinforced thermoplastic composites using flax and polypropylene were prepared using compression molding process. Needle punched nonwovens were used as preforms for preparing the composites. Three variables namely fiber weight proportion, areal weight of the mat, and needling density were chosen for the study. Modified Taguchi L18 experimental design with dummy variable was chosen for the study and the effect of the above variables on tensile, flexural, and impact properties of the composites were studied. By altering the fiber weight proportion and areal weight of the mat, tensile and flexural properties improved. An increase in 34% of tensile strength and 40% of flexural strength has been observed. Impact properties of the composites were significantly altered by modifying the process variables. Increasing the needling density led to a decrease in overall mechanical properties of the composites.
1 Introduction
The usage of natural fiber reinforced thermoplastic composites has gained significant momentum in the last few decades due to its low cost, low density, high specific strength, and stiffness. Moreover, they are light in weight and offer good handleability [1]. The reinforcements used in the manufacturing of the composites are generally in the form of fiber, yarn, and fabrics. At present, the majority of fibers used as reinforcement in the fiber reinforced composites are aramid, carbon, glass fiber in the above-mentioned forms [2]. The environmental concern in the recent years has pushed the global scientific community to explore alternatives to man-made reinforcements [3]. Natural fibers such as jute, ramie, flax, sisal and other lignocellulosic materials are now extensively considered for reinforcement applications [4, 5]. Among the various lignocellulosic materials, flax fibers possess good mechanical properties compared to other natural fibers. The Young’s modulus and tensile strength of these natural fibers are around 27.6–80 GPa and 345–1500 MPa [6] and it is pertinent to note that the strength of the composites depends not only on the reinforcement but also on the type of the matrix deployed and its interface [7].
Polypropylene (PP) as the matrix is preferable for fiber reinforced plastics due to its low density and high toughness. The melting profile of the PP also makes it a suitable choice as matrix [8]. Numerous attempts have been made to produce flax/PP composites with flax reinforcement in the form of fibers, roving, yarn, unidirectional (UD) tapes, woven, and braided structures. The production of composites using woven and braided reinforcements is easy as the reinforcements can be handled effortlessly [9, 10]. Researchers have tried to produce flax fiber based thermoplastic composites by film stacking and commingling methods [11]. Researchers have reported studies on the usage of 100% flax needle punched nonwoven for composite manufacturing with PP pellet or film as a matrix [12]. Needle punched cottonized flax (100%) fibrous web of areal weight 200 g/m2 has been used to prepare composites with PP film as matrix [13]. However, the major challenge is processing of reinforcement and matrix in the fiber form. The uniform mixing of flax fiber and PP by hand is difficult and furthermore preparation of composites using them is also difficult. If the matrix and reinforcement can be blended uniformly and produced as a nonwoven, the difficulty in handling can be easily overcome. Needle punching is one of the facile ways of producing nonwovens by the opening of fibers, followed by preparation of web with needling [14]. Limited studies have been reported on the preparation of composites from flax/PP fiber based nonwoven preforms prepared from needle punching technique which is an alternative to the existing film stacking method [15]. In one of the studies, needle punched flax/PP web was prepared in the form of parallel laid and gilled mat with an areal weight of 600 g/m2. The effects of orientation of the web on the mechanical properties were reported [16]. The major focus of all the published work on needle punched nonwovens has been optimizing the process parameters like temperature, time, pressure, etc., for composite production. The major objective of the present work is studying the effect of nonwoven web process parameters involved in the preparation of needle punched nonwoven products, on the composite mechanical properties.
Hence in the present work, it is planned to produce a nonwoven form of flax fibers along with PP matrix by needle punching process. The idea of preparation of the composite from nonwoven is to ensure a proportionate distribution and to achieve good wetting of the reinforcing fibers during consolidation. The major factors that influence the quality of needle punched nonwoven characteristics are fiber weight proportion (%), areal weight (g/m2), and needling density (punches/cm2) [17, 18]. Taguchi experimental design was adopted to investigate the effect of the above process parameters on the mechanical properties of flax/PP fiber reinforced nonwoven mat composites.
2 Materials and methods
2.1 Raw materials
Polypropylene fibers and flax were procured from Zenith fibres, Vadodara, Gujarat, India and Aditya Birla Nuvo Ltd., West Bengal, India, respectively. The mechanical properties of fibers are given in Table 1.
The mechanical properties of polypropylene and flax fibres.
| Properties | Polypropylene fibre | Flax fibre |
|---|---|---|
| Density (g/cm3) | 0.92 | 1.4±0.7 |
| Fibre length (mm) | 51 | 300–800 |
| Tensile strength (MPa) | 32 | 945.12±87.5 |
| Young’s modulus (GPa) | 1.5 | 21.84±5.08 |
| Elongation (%) | 40 | 4.27±0.68 |
2.2 Nonwoven mat preparation
Needle punched nonwovens with varying proportions of flax and PP were prepared by Dilo needle punching machine, Germany. To obtain the nonwoven mat the fibers were opened and blended manually. The blended fibers were then fed to the needle punching line as shown in Figure 1.

Schematic diagram of needle punching nonwoven machine.
The needle punching line comprises feed lattice followed by opening roller and carding zone. The carded web was laid in cross direction for further needling. The depth of needle penetration is 8 mm. Table 2 provides the information pertaining to sample preparation as per experimental design. The photograph of the prepared samples with varying proportions of flax is given in Figure 2.
Levels for various control factors.
| Control factors | Levels | ||||
|---|---|---|---|---|---|
| 1 | 2 | 3 | 4 | 5 | |
| A – Polypropylene and flax fibre weight proportion (%) | 70:30 | 60:40 | 50:50 | 40:60 | 30:70 |
| B – Areal weight (g/m2) | 350 | 450 | 550 | ||
| C – Needling density (punches/cm2) | 100 | 200 | 300 | ||

Photographs of the prepared samples with varying proportions of pp in nonwoven.
(A) 70 Flax/30 PP – 350 gsm, (B) 70 flax/30 PP – 450 gsm, (C) 70 flax/30 PP – 550 gsm, (D) 50 flax/50 PP – 350 gsm, (E) 50 flax/50 PP – 450 gsm, (F) 50 flax/50 PP – 550 gsm, (G) 30 flax/70 PP – 350 gsm, (H) 30 flax/70 PP – 450 gsm, (I) 30 flax/70 PP – 550 gsm.
2.3 Taguchi approach for experimental design
Taguchi experimental design is a simple technique deployed for the optimization of process parameters and to improve the product reliability and quality. The major parameters influencing the response are located in different rows in a designed array. Compared to the conventional approach to experimentation, this method reduces drastically the number of experiments that are required to model the response functions. The experimental observations are transformed into a signal-to-noise (S/N) ratio. In the Taguchi method, three categories of S/N ratios are used: small is better, larger is better, and nominal is the best. The S/N ratio was calculated from the equation:
where y is the number of observation data and n is the number of factor level. Signal-to-noise ratio (S/N) is used for the analysis of the results and in this signal represents the desirable value (mean) and the noise represents the undesirable value (standard deviation from mean). In this study, “Larger is better” criterion was chosen for the calculation of S/N ratio. Analysis of variance (ANOVA) is used to test the significance and contribution of each of the processing parameters, towards the output characteristics [19, 20]. Modified orthogonal experimental design using dummy treatment was adopted for this study and the details are given in Table 3.
L18 modified orthogonal array experimental design.
| Level | Factors | ||
|---|---|---|---|
| A | B | C | |
| 1 | 1 (70) | 1 (350) | 1 (100) |
| 2 | 1 (70) | 2 (450) | 2 (200) |
| 3 | 1 (70) | 3 (550) | 3 (300) |
| 4 | 2 (60) | 1 (350) | 2 (200) |
| 5 | 2 (60) | 2 (450) | 3 (300) |
| 6 | 2 (60) | 3 (550) | 1 (100) |
| 7 | 3 (50) | 2 (450) | 1 (100) |
| 8 | 3 (50) | 3 (550) | 2 (200) |
| 9 | 3 (50) | 1 (350) | 3 (300) |
| 10 | 4 (40) | 3 (550) | 3 (300) |
| 11 | 4 (40) | 1 (350) | 1 (100) |
| 12 | 4 (40) | 2 (450) | 2 (200) |
| 13 | 5 (30) | 2 (450) | 3 (300) |
| 14 | 5 (30) | 3 (550) | 1 (100) |
| 15 | 5 (30) | 1 (350) | 2 (200) |
| 16 | 1′ (70) | 3 (550) | 2 (200) |
| 17 | 1′ (70) | 1 (350) | 3 (300) |
| 18 | 1′ (70) | 2 (450) | 1 (100) |
1′ Indicates dummy level adopted for the study. Actual values in indicate actual factors.
The selections of the design facilitate to carry only 18 runs compared to 54 runs required for full factorial design. Dummy treatment involves modification of existing orthogonal design by downgrading the standard column and by changing the highest level to one of the other levels. The analysis of the results was carried out using Minitab 14 software (USA).
2.4 Composite preparation
Composites were prepared by compression molding process (Flowmech Engineers (p) Ltd., New Delhi, India). Six layers of the completely dried cross laid nonwoven mat of dimensions of 25×25 cm2 were used for the preparation of the composites. The mat was further placed in a spacer of thickness 4 mm between the two platens and was of compression molded at a temperature of 180°C. The pressure for consolidation was maintained at 7.8 MPa. The samples were cooled under pressure for 10 min.
3 Mechanical testing
3.1 Tensile test
The tensile test was carried out on Instron 3369, USA tester according to ASTM standard test procedure D638-10. The tensile test specimen dimension was 165×13×4 mm3 and the machine speed was set at 5 mm/min. The average tensile strength (MPa) was determined from five specimen results based on the formula given below.
3.2 Flexural test
The flexural test was carried out on the specimens as per ASTM D790-10 standard using Instron 3369. The flexural test specimen dimension was 125×13×4 mm3 and the machine speed was set at 2 mm/min. The average flexural strength (MPa) was determined from five specimen results based on the formula given below.
where P is the maximum load, b width of the specimen, t thickness of the specimen, and L span length of the specimen.
3.3 Impact test
Izod “notched” impact testing was carried out on Tinius Olsen model test machine according to ASTM D 256. The impact test specimen was 64×12.7×4 mm3. The average impact strength based on five test specimens was tested and reported in kJ/m2.
4 Result and discussion
4.1 Tensile properties
Figure 3 gives the effect of this process parameters on tensile modulus and tensile strength of the composites prepared from cross laid in the nonwoven mat. The tensile properties of the composites depend on the wetting of flax fiber by molten PP during consolidation. The wettability of the flax fiber with PP can be improved by altering either the material parameters or process parameters during the consolidation. The alterations of process parameters during consolidation offer a narrow window of opportunities, in terms of temperature, pressure, and holding time due to degradation problems. However, the strength of composites can be improved by increasing the amount of PP fiber available in the mat to achieve better wetting. This can be achieved by altering the PP fiber weight proportion in the mat or by altering the areal weight of the mat. Moreover, needling of the mat also influences on the output nonwoven quality. Hence in the present study, the above three variables were chosen to study its influence on mechanical properties. The responses graphs for a mean of S/N ratio show that the areal weight of mat and fiber weight proportion have a significant influence on the tensile modulus and tensile strength. The ANOVA table for the results obtained is given as Table 4.

Tensile properties of composites.
ANOVA table for tensile properties of composites.
| Source | Tensile strength (MPa) | Tensile modulus (GPa) | ||||||
|---|---|---|---|---|---|---|---|---|
| DF | SS | MS | F | DF | SS | MS | F | |
| A | 4 | 1802.55 | 450.64 | 6.16a | 4 | 0.77 | 0.19 | 1.27 |
| B | 2 | 2850.78 | 1425.39 | 19.48a | 2 | 4.24 | 2.12 | 14.13a |
| C | 2 | 431.20 | 215.60 | 2.95 | 2 | 0.81 | 0.41 | 2.73 |
| eA (Dummy) | 1 | 607.69 | 1 | 0.22 | ||||
| Error | 8 | 585.33 | 73.17 | 8 | 1.19 | 0.15 | ||
| epooled | 11 | 1624.23 | 11 | 2.99 | ||||
| Total | 17 | 6277.55 | 17 | 7.23 | ||||
aPooled into error; F5%, 4, 11=3.36, F5%, 2, 11=3.89.
With the increase in PP fiber content from 30% to 70% in the nonwovens, an increase in tensile strength of the composite from 30 to 35 MPa was observed. Similar results were also observed with previous studies where improvement in strength of the composites was observed [21]. It is well documented in the literature that stress transfer efficiency is a crucial concern in lignocellulosic-based PP composites. With the increase in PP content, better consolidation can be achieved. This further ensures that better stress transfer occurs from the matrix to the flax fiber. The increase in areal weight of the mat (B) also led to increase in tensile strength of the composites. The modulus values range from 6 to 9 GPa for varying proportion of PP content in the composite. At 50% PP content in the mat, a modulus value of 9 GPa was observed. Figure 3 shows that combination of A5 B3 C1 resulted in maximum tensile strength for the composite.
Figure 4 shows a typical fracture surface of thermoplastic composites and it can be seen that there is a significant amount of fiber pull-outs and poor consolidation of fiber with the matrix at low proportions of PP in the reinforcement. Moreover, a lot of cavities exist between the reinforcement and matrix leading to poor stress transfer. However, at higher PP fiber proportion in the nonwoven, good adhesion between the fibers and matrix can be seen. This can be confirmed from the SEM images, which show that the PP has uniformly embedded the flax reinforcement. The optical microscope image of the prepared composites along with the schematic sketch is presented in Figure 5. The optical micrograph images also confirm that better consolidation is observed at higher PP fiber proportions.

SEM images of the tensile fracture surface.
(A) 30 PP/70 flax, (B) 50 PP/50 flax, (C) 70 PP/30 flax.

Optical microscope images of the prepared composites along with schematic sketch (20× magnification).
It is interesting to note that increasing the needling density led to the decrease in tensile strength of the composites. The optical micrographs of the nonwovens prepared with varying needling density are given in Figure 6 and the holes created by the needles during punching can be seen clearly.

Optical microscope images of the nonwovens mats (20× magnification).
(A) 70 Flax/30 PP – 350 gsm, (B) 70 flax/30 PP – 450 gsm, (C) 70 flax/30 PP – 550 gsm, (D) 50 flax/50 PP – 350 gsm, (E) 50 flax/50 PP – 450 gsm, (F) 50 flax/50 PP – 550 gsm, (G) 30 flax/70 PP – 350 gsm, (H) 30 flax/70 PP – 450 gsm, (I) 30 flax/70 PP – 550 gsm.
At higher needling density, a lot of empty spaces are created due to punching and these voids are partly filled with PP matrix during consolidation. The results of voids calculated according to ASTM D2734 – 09 standards are given in Figure 7. It can be seen that, at higher needling density, an increase in the void (7.8%) is observed. Moreover, with an increase in needling density fiber damage may occur leading to complete fiber breakage and fiber weakening as reported in the literature [22]. The schematic diagram along with the SEM micrograph of the specimen is presented in Figure 8. Hence, at higher needling density, poor tensile properties were observed.

Void content of the composites.
(A) PP fibre content (%), (B) areal weight (g/m2), (C) needle density (punches/cm2).
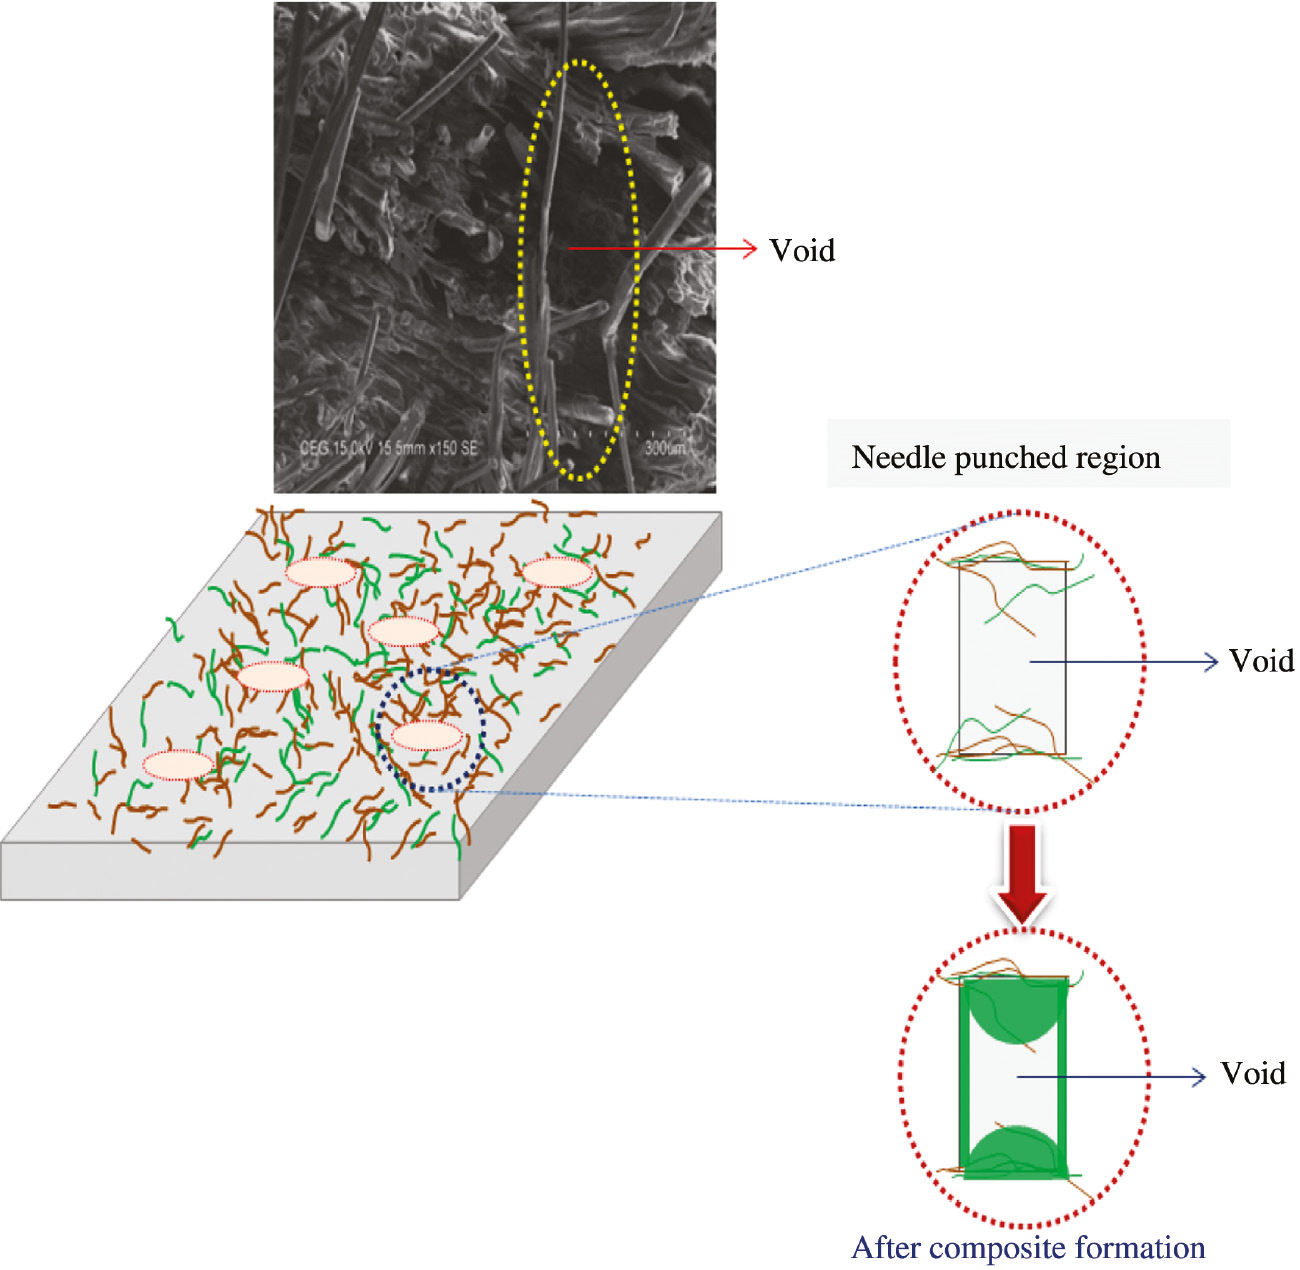
Schematic diagrams along with the SEM micrograph of the specimen of void formation with respect to needling density.
4.2 Flexural properties
Flexural strength is a reflection of both tensile strength and compressive strength. During the flexural testing combination of forces such as tension, shear, and compression acts simultaneously and is a good measure of bonding of PP with flax fibers. With the increase in the proportion of PP content in the nonwoven mat, the flexural strength of the composites showed an increasing trend. The flexural strength varied in the range of 25–31 MPa. Moreover, an increase in the areal weight also led to increase in the flexural strength from 23 to 32 MPa. However, the increase in needling density led to decrease in flexural strength. The increase in flexural strength values due to change in the proportion of PP fiber content and the areal weight of the nonwoven mat could be attributed to a better embodiment of the reinforcement by the matrix. In case of flexural modulus, both areal weight and needling density showed a distinct trend similar to that of flexural strength. However, no definite trend was observed in flexural modulus values with the change in the proportion of PP content in the nonwoven mat. From Figure 9 it can be seen that fiber weight proportion and areal weight of the nonwoven mat play a significant role on the flexural strength of composites. The ANOVA results are given in Table 5 which is inline with the results obtained.

Flexural properties of composites.
ANOVA table for the flexural properties of composite.
| Source | Flexural strength (MPa) | Flexural modulus (GPa) | ||||||
|---|---|---|---|---|---|---|---|---|
| DF | SS | MS | F | DF | SS | MS | F | |
| A | 4 | 1130.00 | 282.50 | 8.49a | 4 | 2.32 | 0.58 | 2.15 |
| B | 2 | 2159.70 | 1079.85 | 32.47a | 2 | 11.51 | 5.76 | 21.33a |
| C | 2 | 56.58 | 28.29 | 0.85 | 2 | 0.62 | 0.31 | 1.15 |
| eA (Dummy) | 1 | 269.47 | 1 | 0.89 | ||||
| Error | 8 | 266.15 | 33.26 | 8 | 2.14 | 0.27 | ||
| epooled | 11 | 592.20 | 11 | 3.65 | ||||
| Total | 17 | 3881.90 | 17 | 17.48 | ||||
aPooled into error; F5%, 4, 11=3.36, F5%, 2, 11=3.89.
The increase in needling density led to the decrease in flexural modulus and strength similar to tensile properties. The sample A5 B3 C1 exhibited good flexural properties.
4.3 Impact properties
The impact strength of the composite is the resistance to absorbing shock load in shorter duration. The impact strength is different from the tensile and flexural properties because the force acts on the composite in shorter time scale. The impact performance depends on various factors such as type of reinforcement, matrix, and fiber/matrix interface. Better impact property is exhibited by composites that present more reinforcement fibers in the fracture plane. The application of the impact force leads to plastic deformation of the thermoplastic matrix followed by delamination between fiber and the matrix. As soon as the crack is formed in the composites, the major load bearing element is the number of fibers bridging the fracture plane as suggested earlier.
The S/N ratio graph for the present study is given in Figure 10. From the figure, it can be seen that the fiber weight fraction has a significant influence on the impact properties. The highest impact strength of the composite is achieved at higher flax proportion in the composites. This may be due to the presence of a large amount of flax fibers in the fracture place. The impact energy mean value ranges from 33.57 to 38.30 kJ/m2 and was found to be significant in ANOVA test as given in Table 6. With the increase in areal weight of the mat, only slight improvement in impact properties is observed. The increase in needling density led to decrease in impact properties and the results were significant. The decrease in impact properties with increasing needling density can be attributed to fiber breakage and fiber weakening properties.

Impact properties of composites.
ANOVA table for the impact properties of composites.
| Source | Impact strength (kJ/m2) | |||
|---|---|---|---|---|
| DF | SS | MS | F | |
| A | 4 | 47.48 | 11.87 | 6.10a |
| B | 2 | 2.90 | 1.45 | 0.75 |
| C | 2 | 38.01 | 19.01 | 9.77a |
| eA | 1 | 0.19 | ||
| Error | 8 | 15.57 | 1.95 | |
| epooled | 11 | 18.65 | ||
| Total | 17 | 104.14 | ||
aPooled into error; F5%, 4, 11=3.36, F5%, 2, 11=3.89.
The SEM micrographs of the impact specimens are shown in Figure 11. From the figure, it can be seen that at low proportion of PP, the major contribution to the impact force has come from the reinforcements with a lot of fiber pull out and a poor support from the matrix can be observed. However, as the proportion of the PP increases, the plasticization of the matrix with stress whitening occurred, followed by transfer of load to the fibers. The combination of A1 B3 C1 yielded good impact properties.

SEM images of impact fracture surface.
(A) 30 PP/70 flax, (B) 50 PP/50 flax, (C) 70 PP/30 flax.
5 Conclusions
Flax fiber reinforced PP composites using needle punched nonwoven mats were prepared. Higher PP proportion in the nonwoven mat led to superior consolidation and it is reflected in the mechanical properties. The increase in areal weight of the nonwoven mat also led to the increase in mechanical properties. The increase in needling density led to the deterioration of mechanical properties of composites due to fiber breakage and voids. The developed composites are light in weight and can be deployed for various domestic applications. Further studies have to be initiated to improve the consolidation of flax and PP fibers in the composites.
Funding source: Anna University
Award Identifier / Grant number: CR/ACRF/2013/31
Funding statement: The authors would like to give their thanks to the Anna University for the funding support through the Anna Centenary Research Fellowship [CR/ACRF/2013/31], Chennai, Tamil Nadu, and India.
Acknowledgments
The authors would like to give their thanks to the Anna University for the funding support through the Anna Centenary Research Fellowship [CR/ACRF/2013/31], Chennai, Tamil Nadu, and India.
References
[1] Soleimani M, Tabil L, Panigrahi S, Opoku A. J. Polym. Environ. 2008, 16, 74–82.10.1007/s10924-008-0102-ySearch in Google Scholar
[2] Wambua P, Ivens J, Verpoest I. Compos. Sci. Technol. 2003, 63, 1259–1264.10.1016/S0266-3538(03)00096-4Search in Google Scholar
[3] Oksman K. Appl. Compos. Mater. 2000, 7, 403–414.10.1023/A:1026546426764Search in Google Scholar
[4] Manchado L, Arroyo M, Biagiotti J, Kenny JM. J. Appl. Polym. Sci. 2003, 90, 2170–2178.10.1002/app.12866Search in Google Scholar
[5] Herrera-Franco PJ, Valadez-González A. Compos. Part B Eng. 2005, 36, 597–608.10.1016/j.compositesb.2005.04.001Search in Google Scholar
[6] Li X, Tabil LG, Panigrahi S. J. Polym. Environ. 2007, 15, 25–33.10.1007/s10924-006-0042-3Search in Google Scholar
[7] Cantero G, Arbelaiz A, Llano-Ponte R, Mondragon I. Compos. Sci. Technol. 2003, 63, 1247–1254.10.1016/S0266-3538(03)00094-0Search in Google Scholar
[8] Shubhra QT, Alam A, Quaiyyum M. J. Thermoplast Compos. Mater. 2013, 26, 362–391.10.1177/0892705711428659Search in Google Scholar
[9] Das D, Pradhan AK, Chattopadhyay R, Singh SN. Text Prog. 2012, 44, 1–84.10.1080/00405167.2012.670014Search in Google Scholar
[10] Bledzki AK, Gassan J. Prog. Polym. Sci. 1999, 24, 221–274.10.1016/S0079-6700(98)00018-5Search in Google Scholar
[11] Yan L, Chouw N, Jayaraman K. Compos. Part B Eng. 2014, 56, 296–317.10.1016/j.compositesb.2013.08.014Search in Google Scholar
[12] Mieck K-P, Lützkendorf R, Reussmann T. Polym. Compos. 1996, 17, 873–878.10.1002/pc.10680Search in Google Scholar
[13] John MJ, Anandjiwala RD. Compos. Part Appl. Sci. Manuf. 2009, 40, 442–448.10.1016/j.compositesa.2009.01.007Search in Google Scholar
[14] Chen Y, Sun L, Chiparus O, Negulescu I, Yachmenev V, Warnock M. J. Polym. Environ. 2005, 13, 107–114.10.1007/s10924-005-2942-zSearch in Google Scholar
[15] Garkhail SK, Heijenrath RWH, Peijs T. Appl. Compos. Mater. 2000, 7, 351–372.10.1023/A:1026590124038Search in Google Scholar
[16] Miao M, Shan M. Compos. Sci. Technol. 2011, 71, 1713–1718.10.1016/j.compscitech.2011.08.001Search in Google Scholar
[17] Wu T-M, Lee C-B. J. Appl. Polym. Sci. 1999, 73, 2169–2176.10.1002/(SICI)1097-4628(19990912)73:11<2169::AID-APP13>3.0.CO;2-KSearch in Google Scholar
[18] Rozman HD, Shannon-Ong SH, Azizah AB, Tay GS. J. Polym. Environ. 2013, 21, 1032–1039.10.1007/s10924-013-0599-6Search in Google Scholar
[19] Rozman HD, Tay GS, Kumar RN, Abusamah A, Ismail H, Ishak ZM. Eur. Polym. J. 2001, 37, 1283–1291.10.1016/S0014-3057(00)00243-3Search in Google Scholar
[20] Patnaik A, Tejyan S. J. Ind. Text 2014, 43, 458–480.10.1177/1528083712460264Search in Google Scholar
[21] Rozman HD, Tay GS, Kumar RN, Abusamah A, Ismail H, Mohd. Ishak ZA. Polym. Plast. Technol. Eng. 2001, 40, 103–115.10.1081/PPT-100000058Search in Google Scholar
[22] Miao M, Glassey HE, Rastogi M. Text Res. J. 2004, 74, 485–490.10.1177/004051750407400604Search in Google Scholar
©2018 Walter de Gruyter GmbH, Berlin/Boston
This article is distributed under the terms of the Creative Commons Attribution Non-Commercial License, which permits unrestricted non-commercial use, distribution, and reproduction in any medium, provided the original work is properly cited.
Articles in the same Issue
- Frontmatter
- Original articles
- Review of the mechanical performance of variable stiffness design fiber-reinforced composites
- Exact solution for bending analysis of functionally graded micro-plates based on strain gradient theory
- Synthesis, microstructure, and mechanical properties of in situ TiB2/Al-4.5Cu composites
- Microstructure and properties of W-Cu/1Cr18Ni9 steel brazed joint with different Ni-based filler metals
- Drilling studies on the prepared aluminum metal matrix composite from wet grinder stone dust particles
- Studies on mechanical properties of thermoplastic composites prepared from flax-polypropylene needle punched nonwovens
- Design of and with thin-ply non-crimp fabric as building blocks for composites
- Effect of coir fiber reinforcement on mechanical properties of vulcanized natural rubber composites
- Investigation and analysis of glass fabric/PVC composite laminates processing parameters
- Abrasive wear behavior of silane treated nanoalumina filled dental composite under food slurry and distilled water condition
- Finite element study into the effects of fiber orientations and stacking sequence on drilling induced delamination in CFRP/Al stack
- Preparation of PAA/WO3 composite films with enhanced electrochromism via layer-by-layer method
- Effect of alkali treatment on hair fiber as reinforcement of HDPE composites: mechanical properties and water absorption behavior
- Integration of nano-Al with one-step synthesis of MoO3 nanobelts to realize high exothermic nanothermite
- A time-of-flight revising approach to improve the image quality of Lamb wave tomography for the detection of defects in composite panels
- The simulation of the warpage rule of the thin-walled part of polypropylene composite based on the coupling effect of mold deformation and injection molding process
- Novel preparation method and the characterization of polyurethane-acrylate/ nano-SiO2 emulsions
- Microwave properties of natural rubber based composites containing carbon black-magnetite hybrid fillers
- Simulation on impact response of FMLs: effect of fiber stacking sequence, thickness, and incident angle