Comparison of important quality components of red-flesh kiwifruit (Actinidia chinensis) in different locations
-
Mojdeh Asadi
 ,
Mahmood Ghasemnezhad
,
Mahmood Ghasemnezhad
 ,
Jamalali Olfati
,
Adel Bakhshipour
,
Mohammad Hossein Mirjalili
and
Arif Atak
,
Jamalali Olfati
,
Adel Bakhshipour
,
Mohammad Hossein Mirjalili
and
Arif Atak

Abstract
Important quality components of red-fleshed kiwifruit which was grown in three different regions in North of Iran were investigated in this research. Fruits produced in the region with higher altitude and cool summer temperatures showed higher ascorbic acid content (AAC), total phenolic content, and antioxidant activity than the two other regions both at harvest time and storage. It was observed that the 1,1-diphenyl-2-picrylhydrazyl was positively correlated with the AAC (r = 0.98), total phenolic content (r = 0.94), and the ferric reducing antioxidant power was positively correlated with the AAC (r = 0.98), TPC (r = 0.93). Fruits harvested in region 2 with cool environments, presented dark red flesh color with the highest values of anthocyanin content at harvest (2.78 mg CGE/100 g), with a gradually increasing trend during storage to reach 3.47 mg CGE/100 g at the end of storage. Total anthocyanin content correlated positively with soluble solids content (SSC; r = 0.82), total Soluble sugars (TSS; r = 0.94), pH (r = 0.94), SSC/titratable acidity (TA; r = 0.83) and negatively with TA (r = −0.77). Fruits grown in region 2 received the highest SCC and TSS scores after sensory test evaluations made by the panelists. During storage fruits firmness and total acidity of kiwifruit decreased while SSC, TSS, and anthocyanin content increased. Additionally, antioxidant compounds and taste-related quality of kiwifruit had a positive relationship with the product region. Results showed that the growing region and storage duration considerably influenced the antioxidant compounds and nutritional quality of red flesh kiwifruit.
1 Introduction
Kiwifruit, the edible berry of vertical woody vines in the genus Actinidia, has a high nutritional value and is a good source of vitamins A, C, E and K, folate, carbohydrates, sugars, minerals, amino acids, proteins, carotenoids, and fatty acids such as linoleic acid [1]. The genus Actinidia is distributed worldwide due to its high nutritional potential, high levels of ascorbic acid, excellent organoleptic qualities, and adaptability to temperate and subtropical climates [2]
There is a diversity of flesh color in kiwifruit cultivars. Traditionally, kiwifruit have either green or yellow flesh color, or colors in between. In recent years, new kiwifruit cultivars with red flesh color have been selected in China [3] and New Zealand [4]. These cultivars are characterized by red coloration in the inner pericarp region of the fruit, surrounding the central core. Red-fleshed kiwifruit has drawn broad attention for its novelty and high quality. The fruit has an attractive color pattern of yellow or green in the outer pericarp, red in the inner pericarp, and white in the central core. Moreover, the red-fleshed kiwifruit usually has good taste, with high soluble solids content (SSC) and sweetness, and low acidity. These new cultivars have become available either as selections from wild populations or from specific breeding programs [3]. The most important red-fleshed cultivars including “Hongyang”, “Donghong,” “Hongshi,” and “Qihong” are mainly cultivated in China, New Zealand, the United States, Greece, Italy, Chile, France, Japan, and Korea [4]
The cultivation of red-fleshed kiwifruit is considerably increased in Iran due to its high commercial value and nutritional quality. In recent years, consumer preference for red-fleshed kiwifruit has increased due to its novelty, attractive color, overall liking score, sweetness, and rich content of phenolic and flavonoid compounds compared to green- and yellow-fleshed kiwifruit. Consequently, many growers have turned to cultivate red-fleshed cultivars to increase their profits and at the same time and improve consumer nutrition [5]. The main red-fleshed kiwifruit that recent years introduced to Iranian kiwifruit growers is known as “Khoni,” which has a deep red color around the core.
It is well known that the chemical composition of kiwifruit can change due to a large number of factors. In red-fleshed kiwifruit, the intensity of the red color can be quite variable from inconsiderable to an intense deep red color. Several factors have been found to affect the red color expression nutritional value of kiwifruit, such as altitude, plant age, and use of CPPU [1-(2-chloro-4-pyridyl)-3-phenylurea] [3]. Previous studies showed that fruit compositions such as proteins, vitamins, sugars, acids, elements as well as aroma compounds are influenced by special geographical climate conditions of producing area, which are responsible for the quality difference in agricultural products from different regions [6,7] Climatic conditions, including light and average temperature, have a great influence on the chemical composition of horticultural crops. For all fruits, postharvest performance is dependent on both the physiological state of the fruit at harvest and the postharvest management applied. The physiological changes are influenced by a complex interaction of developmental, hormonal, and environmental influences [8]. The differences in the content and number of bioactive compounds in the fruits depend on a sum of elements such as genotype, environmental conditions, maturity, as well as geographical location [9]. Several studies have focused on the effects of geographic origin and environmental conditions on the nutrient and phytochemical contents of fruits [6,7,8,9,10]. Henwood et al. [10] indicated that the variation between orchards and regions was larger than within orchards but no clear regional patterns existed. The regional effect cannot be explained by variation in altitude or by regional temperatures alone: in two cases, red-fleshed kiwifruit color intensity was significantly different between two orchards found in the same region with very similar altitudes. Thus, orchard practices and microclimate differences between orchards are likely to be important.
Kiwifruit is widely accepted as a functional food, and most consumers are interested in knowing more about the quantity variations of bioactive components across diverse batches of kiwifruit available in the market. Therefore, the current study aimed to collect data on the possible relation between the geographic location of red-fleshed kiwifruit orchards on the functional and nutritional values of kiwifruit. This study also noted the specific geographic conditions that contribute positively to the quality of kiwifruits which grown in the north of Iran. This information could be valuable for growers and stakeholders to make a good decision about site selection before planting to optimize the nutritional content and organoleptic features of red-fleshed kiwifruits.
2 Materials and methods
2.1 Materials
2.1.1 The trial site and climatic characteristic
The red-fleshed kiwifruit was obtained from commercial vineyards in three different production regions of Talesh (west Guilan, latitude 37° 47ʹ N, longitude 48° 56ʹ E, altitude 6 m), Langarud (east Guilan, latitude 37° 8ʹ N, longitude 50° 3ʹ E, and altitude 121 m) and Rasht (center Guilan, latitude 37° 11ʹ N, longitude 49° 38ʹ E, and altitude 27 m). The average monthly temperature, rainfall, and relative humidity values of these three growing locations for the season 2022 are presented in Figure 1. In general, the average monthly temperature in Rasht was reported to be higher than in Talesh and Langarud. The weather tends to be colder in Langarud during September and October which coincides with the kiwifruit harvest season. The mean monthly rainfall is higher in Rasht than in other regions. Also, all regions are characterized by high relative humidity, especially in winter.
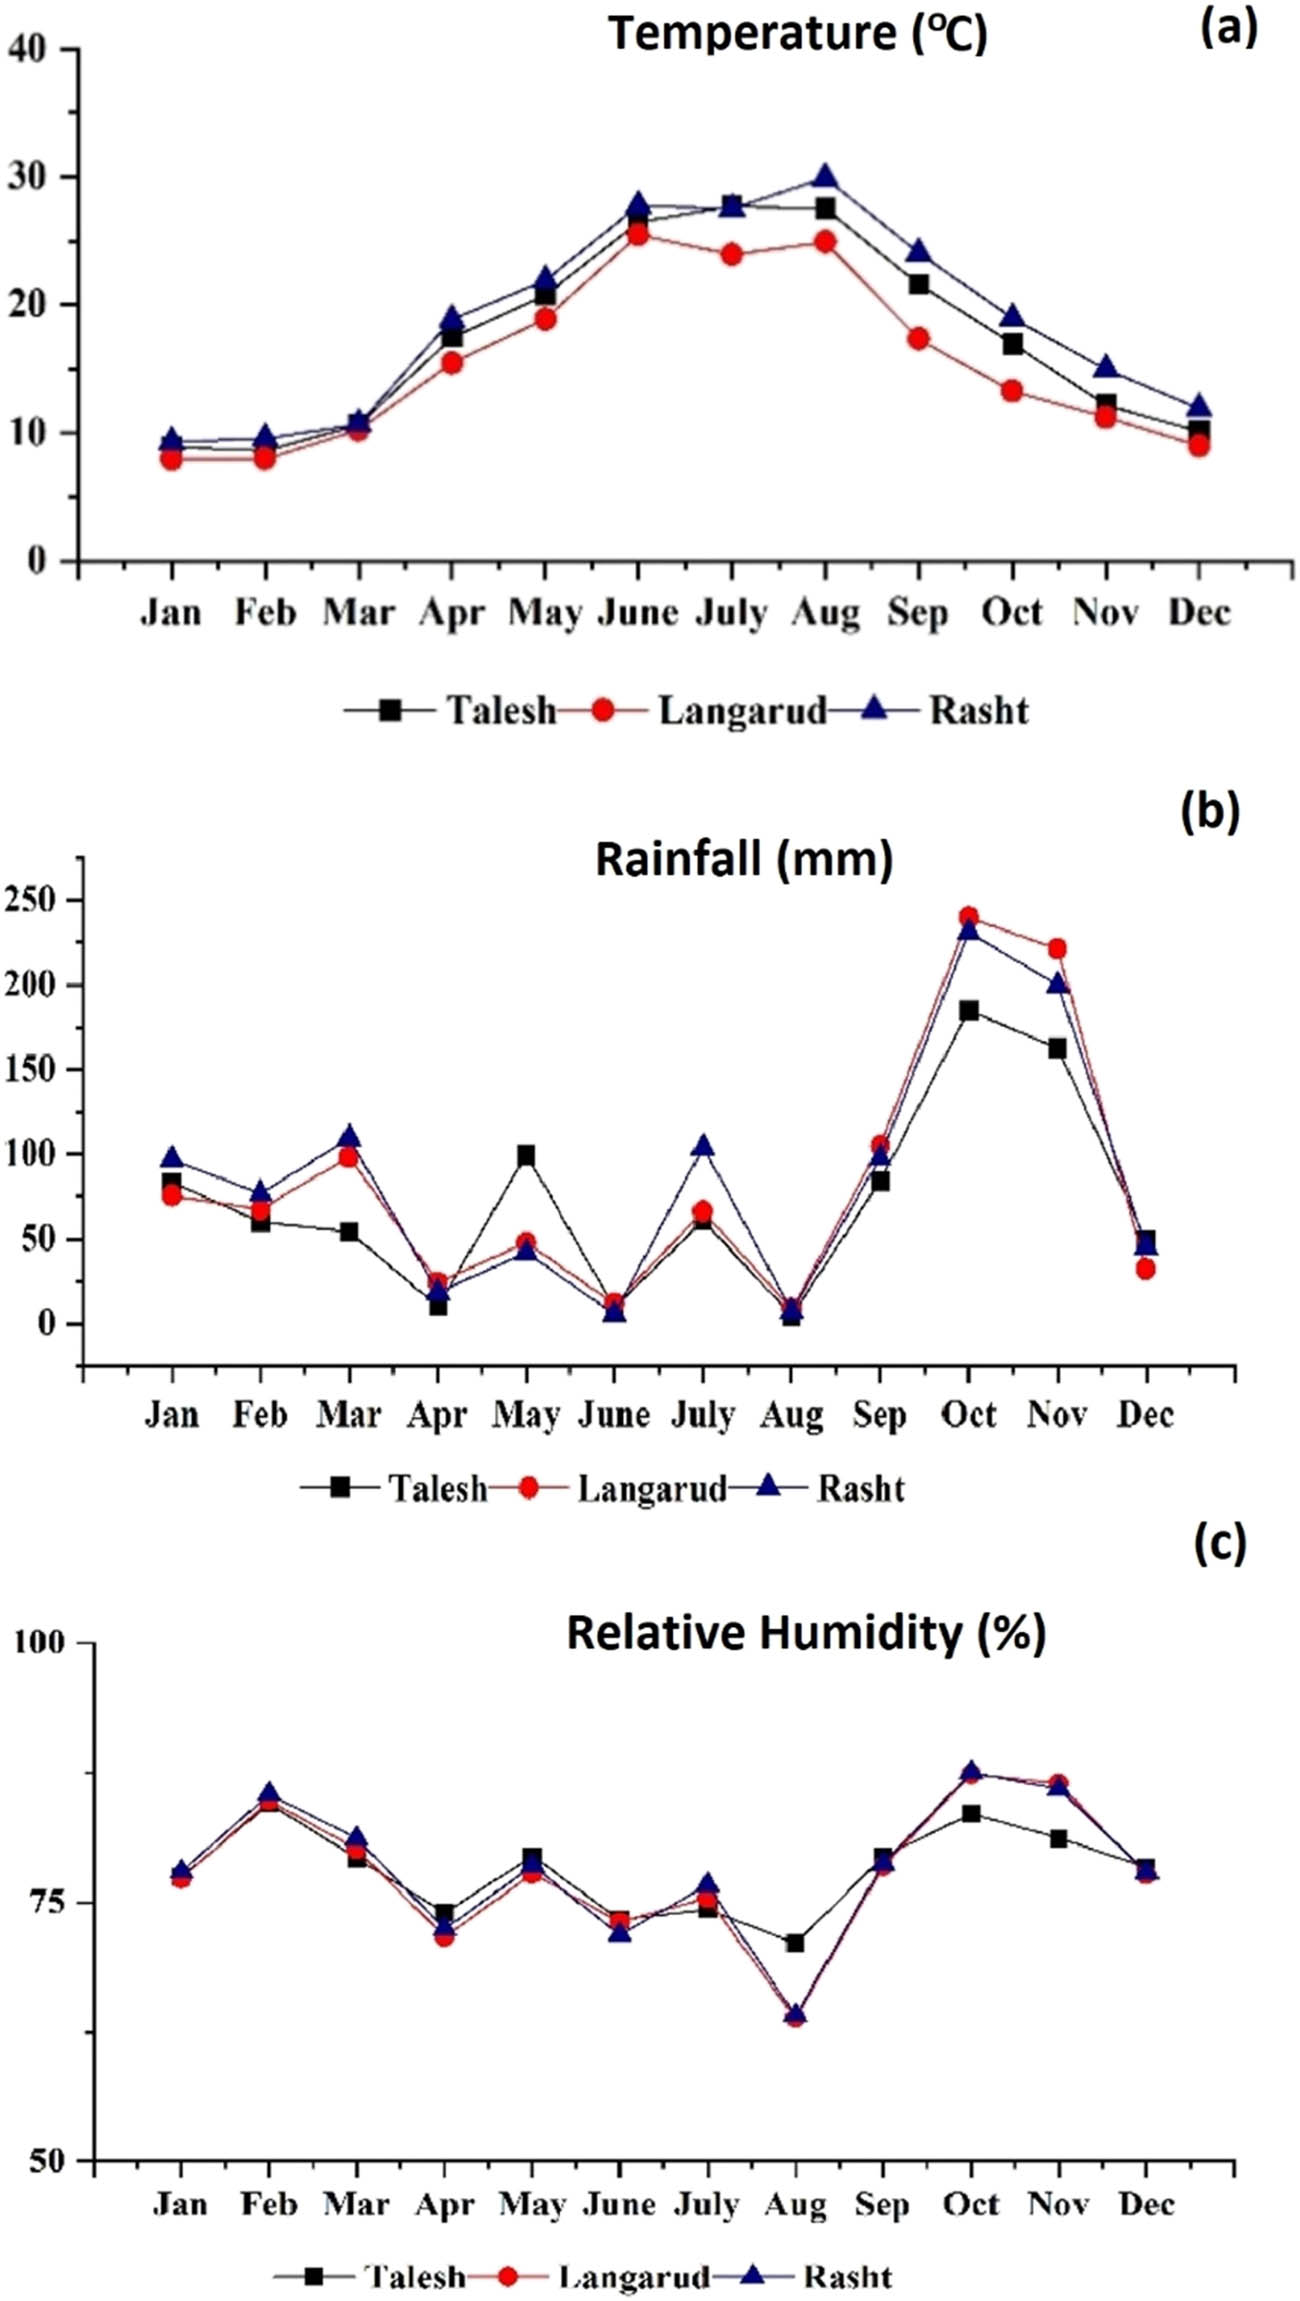
Climatic data of the three studied regions: (a) temperature, (b) rainfall, and (c) relative humidity (Iran Meteorological Organization).
2.1.2 Plant material
The red-fleshed kiwifruit (Actinidia chinensis cv. Khoni) from commercial vineyards harvested from the uniform vines with the same irrigation regime, pruning, and fertilization. Pollination was performed during anthesis in late April to early May 2022 when flower buds open completely. The date on which 5% of flowers opened in the canopy was recorded in Rasht (April 17), Talesh (April 20), and Langarud (April 27). According to the previous study by Choi et al. [11], red “Hongyang” kiwifruit cultivars were harvested at 160 days after full bloom (DAFB), and stored for up to 4 months without affecting major quality indices during storage. However, overall sensory quality evaluation showed that kiwifruits harvested at 160 DAFB attained good eating quality after 3 months of storage in red kiwi cultivars [11]. Pre-experiment data showed that the optimum harvest time for red flesh kiwifruits in the north of Iran was when fruits were harvested after 170 DAFB. Therefore, 90 red-fleshed kiwifruits were randomly harvested after 170 DAFB from different commercial vineyards in October 2022. Immediately, fruits were transported to the postharvest laboratory at the university of Guilan, Iran. Fruits were uniform in size (average weight of 75–80 g), and free of physical injuries, sunburn, blemishes, bruises, and pathogen and insect attacks.
2.2 Methods
2.2.1 Experiment design
The experiment was designed as a split-plot design structure with three replicates. Then, 90 red-fleshed kiwifruits were randomly selected from commercial vineyards located in each region, packed in corrugated fiberboard boxes, and stored at 0.5°C with 90–95% relative humidity for a duration of 2 months. The weight loss, flesh firmness, SSC, total soluble sugars (TSS), titratable acidity (TA), pH, ascorbic acid Content (AAC), total phenolic content (TPC), total antioxidant capacity as 1,1-diphenyl-2- picrylhydrazyl (DPPH) and ferric reducing antioxidant power (FRAP) and total anthocyanin content (TAC) of fruits were measured at harvest time and every 15 days during storage.
2.2.2 Determination of physical attributes
A total of five kiwifruits in each replicate were randomly selected and weighed at the beginning of the experiment, and at 15-day intervals during the storage period. Weight loss was calculated as follows:
Weight loss (%) = [(W 0 − W 1)/W 0] × 100,
where W 0 is the initial weight and W 1 is the weight measured during storage [12], and fruit firmness was measured using a penetrometer (Model FT 011, USA) with an 8 mm probe. Measurements were taken at the equator of the fruit, and the results were expressed in kg/cm2.
2.2.3 Determination of SSC, TA, pH, and TSS
The SSC of kiwifruit juice was measured by a digital refractometer (Euromex RD 635, Holland) for five fruits from each location at 15-day intervals over the storage period at 22°C and expressed as % Brix [13]. In order to determine the TA of each fruit, diluted kiwifruit juice (1 mL fruit juice added to 19 mL distilled water) was titrated against NaOH, 0.1 N using phenolphthalein as a pH indicator, and expressed as Citric acid percentage [13]. Also, the Brix-acid ratio (SSC/TA) was determined simply by dividing SSC by TA [14]. The pH values of fruit juices were measured using a digital pH meter (Hanna HI 8519, Italy) at 25°C [15]. The TSS was measured based on the improved anthrone colorimetric method. For this purpose, 5 mL distilled water was added to 1 g ground kiwifruit from the frozen sample and bathed in a water bath at 100°C for 20 min. Samples were centrifuged at 4,000 rpm for 5 min. The supernatant was transferred to a 1,000 mL volumetric flask, and the previous step was repeated. About 1 mL of the obtained solution was brought to a final volume of 25 mL, and finally, 1 mL of the prepared extract was added to 0.5 mL anthrone ethyl acetate and 5 mL sulfuric acid. The solution was fully oscillated and placed in a boiling water bath (100°C, 10 min). After cooling the samples, a spectrophotometer (PG Instruments T80 +, Leicester, UK) was used to measure absorbance at 620 nm in three replicates. Glucose was used to achieve the calibration curve [16].
2.2.4 Determination of AAC
The AAC was determined by following the method stated by Oliveira et al. [17] with little modification. A 5 g sample was weighed, and the volume was made up to 100 mL with 3% metaphosphoric acid and filtered. An aliquot of 10 mL was taken in a titration flask and titrated against 2, 6-dichlorophenol indophenol until light pink color appeared and the result was expressed by mg ascorbic acid/100 g FW.
2.2.5 Determination of TPC, TAC and antioxidant activity
For preparing extracts to measure TPC, TAC, and antioxidant capacity, 5 grams of the homogenate for fruits harvested from each cultivation region with 5 replications on 15-day intervals during the storage (skin removed) was mixed with 20 mL of ethanol: acetone (7:3) solution and ultrasonicated for 15 min and centrifuged at 4°C 8,000 rpm for 10 min to obtain the supernatant. The supernatant was used as a base extract to measure TPC, TAC, and antioxidant capacity. The TPC was determined by the Folin–Ciocalteu colorimetric method. For each sample, 25 µL of the extract was added into 125 µL diluted Folin–Ciocalteu solution and 100 µL of 7.5% sodium carbonate solution, then mixed, and placed in the dark for 1 h. The absorbance of solutions was measured at 760 nm using a Power Wave HT microplate spectrophotometer. The results were expressed as mg gallic acid (GAE)/100 g FW [18]. The differential pH method was applied to the measurement of existing TAC. According to the method, the pH value of 0.5 mL of extract was added to 2.5 mL of 0.025 M potassium chloride (KCl) buffer (pH = 1) and 2.5 mL of 0.4 M sodium acetate (C2H3NaO2·3H2O) buffer (pH = 4.5). Then, the absorption of total anthocyanin from each sample in both pH values was determined at 520 nm and 700 nm by UV/Vis spectrophotometer. TAC was calculated as mg cyanidin-3-glucoside equivalents (CGE)/100 g FW using equation (1) [19].
where ε is the molar extinction coefficient of cyanidin-3-glucoside (26900 L/mol/cm), l is spectrophotometer cell length (1 cm), and MW is the molecular weight of cyanidin-3-glucoside (449.2 g/mol). The A value was calculated using equation (2).
Antioxidant activity was measured by two different methods; DPPH and FRAP [4,19]. For the DPPH assay, 250 µL of the supernatant was mixed with 4 mL of DPPH solution. After 30 min of reaction, the absorbance was measured at 517 nm. Regarding the FRAP assay, 0.25 mL of extract and 8 mL of TPTZ (Tripyridyltriazine) solution were allowed to react for 10 min in a 37°C water bath, and absorption was read at 593 nm. The results of the DPHH test were expressed as a percentage, and the FRAP test as μmol ascorbic acid/g FW.
2.2.6 Sensory evaluation
At the end of storage, 30 fruits from each site were stored for 7 additional days at 25°C to be examined for sensory evaluation. For sensory analysis, a panel of eight women and 10 men aged 28–60 years were randomly selected from professors, students, producers, exporters, and members of the Kiwifruit Association of Iran. Considered attributes for sensory evaluation were based on Nunes-Damaceno et al. [20], including hairiness, external aroma intensity, firmness (endpoints: an anti-stress ball and a tennis ball), internal aroma intensity, flesh color (endpoints: Pantone colors 085 to 032°C), flavor intensity, sweetness (endpoints: 7.2 and 24.0 g/L saccharose solutions), tartness (endpoints: 0.38 and 1.40 g/L citric acid solutions), juiciness (midpoint: a Granny Smith apple), fibrosity (endpoints: canned peach and canned pineapple), and astringency (endpoints: 0.25 and 0.40 g/L tannic acid solutions). Questionnaires were prepared based on a seven-point scale and given a score of 1–7 from very negative to very positive.
2.2.7 Statistical analysis
Statistical analyses were performed using one-way analysis of variance (ANOVA), to determine the significance of differences between region and storage time at p < 0.05 using SAS statistical software (SAS/STAT® 9.4; SAS Institute Inc., Cary, NC, USA). The Pearson correlation test was used to correlate the collected parameters. All figures were drawn using the 2022 edition of Origin Pro software (OriginLab Corporation, USA).
3 Results
The results of ANOVA are summarized in Tables 1 and 2. As the results showed, the storage time, growing region, and the interaction between storage and region had significant effects on firmness, SSC, TA, SSC/TA, ascorbic acid, DPPH, and FRAP (p < 0.01). Interaction effect of region × storage on fruit weight loss and TAC are shown in Figures 2 and 5, respectively. However, no significant difference was found in the interaction between storage and region on the pH and TPC.
Variation of fruit firmness and taste related compounds in red kiwifruit according to region and storage time
| Location | Storage (days) | Firmness (kg/cm2) | SSC (°Brix) | TSS (%) | TA (%) | pH | SSC/TA |
|---|---|---|---|---|---|---|---|
| Talesh | 0 | 7.50 ± 0.10b | 10.12 ± 0.37h | 7.21 ± 0.72h | 1.41 ± 0.02c | 3.63 ± 0.03h | 7.14 ± 0.24k |
| 15 | 6.26 ± 0.21d | 12.47 ± 0.27f | 8.42 ± 0.62fg | 1.12 ± 0.04f | 3.69 ± 0.02e–g | 11.08 ± 0.61h | |
| 30 | 4.60 ± 0.10g | 14.18 ± 0.45e | 8.96 ± 0.59d–f | 0.91 ± 0.02h | 3.72 ± 0.01ef | 15.58 ± 0.17f | |
| 45 | 3.46 ± 0.15h | 17.27 ± 0.54c | 9.85 ± 0.30cd | 0.86 ± 0.04i | 3.77 ± 0.04cd | 20.10 ± 0.75d | |
| 60 | 1.96 ± 0.21j | 18.30 ± 0.26b | 10.12 ± 0.35c | 0.72 ± 0.02k | 3.82 ± 0.04ab | 25.19 ± 0.64b | |
| Langarud | 0 | 6.96 ± 0.25c | 11.66 ± 0.25g | 9.46 ± 0.45c–e | 1.35 ± 0.02d | 3.69 ± 0.02e–g | 8.62 ± 0.23j |
| 15 | 5.83 ± 0.31e | 12.90 ± 0.56f | 9.78 ± 0.20cd | 1.23 ± 0.01e | 3.72 ± 0.02ef | 10.48 ± 0.43hi | |
| 30 | 5.36 ± 0.21f | 15.40 ± 0.36d | 11.40 ± 0.81b | 0.90 ± 0.02h | 3.78 ± 0.02bc | 16.99 ± 0.66e | |
| 45 | 3.43 ± 0.12h | 18.73 ± 0.40b | 12.19 ± 0.70b | 0.77 ± 0.02j | 3.81 ± 0.02a–c | 24.22 ± 0.17c | |
| 60 | 2.10 ± 0.17j | 19.97 ± 0.45a | 13.33 ± 0.95a | 0.61 ± 0.01l | 3.85 ± 0.03a | 32.37 ± 0.48a | |
| Rasht | 0 | 8.66 ± 0.21a | 8.83 ± 0.45i | 6.85 ± 0.47h | 1.57 ± 0.04a | 3.60 ± 0.03h | 5.60 ± 0.43l |
| 15 | 7.70 ± 0.17b | 11.13 ± 0.67g | 8.24 ± 0.66g | 1.47 ± 0.01b | 3.63 ± 0.03h | 7.53 ± 0.39k | |
| 30 | 5.60 ± 0.10ef | 12.43 ± 0.42f | 8.74 ± 0.57e–g | 1.22 ± 0.01e | 3.65 ± 0.04gh | 10.19 ± 0.41i | |
| 45 | 3.66 ± 0.15h | 14.53 ± 0.55e | 8.70 ± 0.39e–g | 1.02 ± 0.03g | 3.68 ± 0.04fg | 14.26 ± 0.93g | |
| 60 | 2.87 ± 0.21i | 17.13 ± 0.31c | 9.27 ± 0.12c–f | 0.82 ± 0.02i | 3.73 ± 0.04de | 20.73 ± 0.65d | |
| Significance levels (p) | |||||||
| Storage (B) | ** | ** | * | ** | * | ** | |
| Region (A) | ** | ** | ** | ** | ** | ** | |
| A × B | ** | ** | * | ** | n.s | ** |
n.s, *, ** indicate non-significant and significant differences at p < 0.05 and 0.01, respectively. Means with different letters within the same column are significantly different (p < 0.01). Different letters, for each method, indicate significant differences among regions and storage times at p < 0.01.
Variation of fruit antioxidant compounds in red kiwifruit according to region and storage time
| Location | Storage (days) | AAC (mg/100 g) | TPC (mg GAE/100 g) | DPPH (%) | FRAP (μmol/g) |
|---|---|---|---|---|---|
| Talesh | 0 | 87.91 ± 1.14de | 98.78 ± 1.63cd | 70.22 ± 1.53cd | 10.12 ± 0.09cd |
| 15 | 84.42 ± 1.47f | 96.97 ± 0.68ed | 67.39 ± 1.84e–f | 9.67 ± 0.12de | |
| 30 | 80.21 ± 1.36g | 94.52 ± 1.30f | 66.14 ± 1.57f | 9.19 ± 0.33ef | |
| 45 | 77.32 ± 1.42h | 90.68 ± 1.79g | 61.49 ± 1.53gh | 8.78 ± 0.75fg | |
| 60 | 73.49 ± 1.18h | 86.54 ± 1.17h | 60.12 ± 1.49hi | 7.32 ± 0.15ij | |
| Langrud | 0 | 97.59 ± 1.88a | 111.52 ± 0.73a | 77.26 ± 1.45a | 11.62 ± 0.46a |
| 15 | 95.14 ± 1.13b | 109.67 ± 1.71a | 73.60 ± 1.23b | 10.85 ± 0.28b | |
| 30 | 92.98 ± 1.17c | 105.83 ± 0.77b | 70.66 ± 1.61c | 10.60 ± 0.13bc | |
| 45 | 89.11 ± 1.01d | 104.28 ± 1.57b | 69.65 ± 1.09c–e | 9.84 ± 0.26d | |
| 60 | 86.39 ± 1.08ef | 100.52 ± 1.59c | 67.96 ± 1.37d–f | 9.75 ± 0.49de | |
| Rasht | 0 | 82.17 ± 1.44g | 97.3 ± 0.80d | 68.87 ± 1.35c–e | 9.20 ± 0.16ef |
| 15 | 76.66 ± 1.14h | 94.98 ± 1.23ef | 63.10 ± 0.79g | 8.22 ± 0.15gh | |
| 30 | 73.51 ± 0.90i | 93.85 ± 1.85f | 59.17 ± 1.72i | 7.74 ± 0.44hi | |
| 45 | 67.33 ± 1.74j | 89.33 ± 1.28g | 56.54 ± 1.45j | 6.96 ± 0.34j | |
| 60 | 64.40 ± 1.15k | 83.48 ± 1.58i | 52.55 ± 1.14k | 6.88 ± 0.33j | |
| Significance levels (p) | |||||
| Storage (B) | * | * | * | ** | |
| Region (A) | ** | ** | ** | ** | |
| A × B | ** | n.s | ** | * |
n.s, *, ** indicate non-significant and significant differences at p < 0.05 and 0.01, respectively. Means with different letters within the same column are significantly different (p < 0.01). Different letters, for each method, indicate significant differences among regions and storage time at p < 0.01.
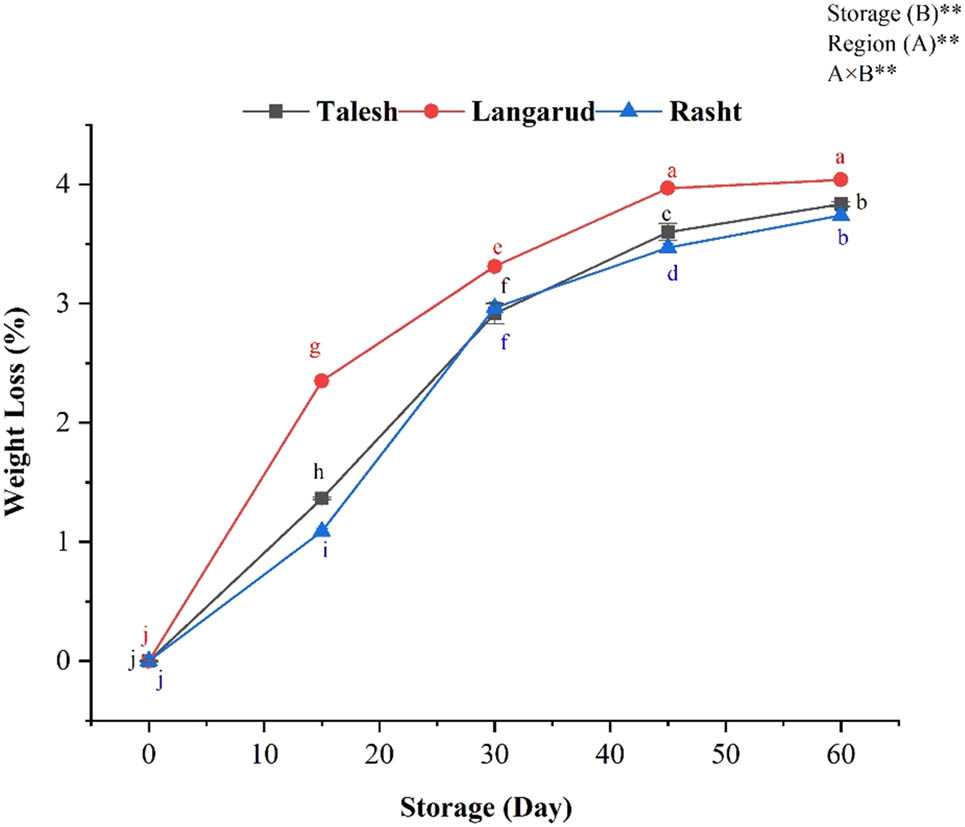
Variation of weight loss percentage in red kiwifruit. According to different lowercase letters show significant differences (p < 0.01) among treatments for each sampling date. *The results are expressed as mean ± standard deviation and the (n) number of replicates in each experimental parameter determined.
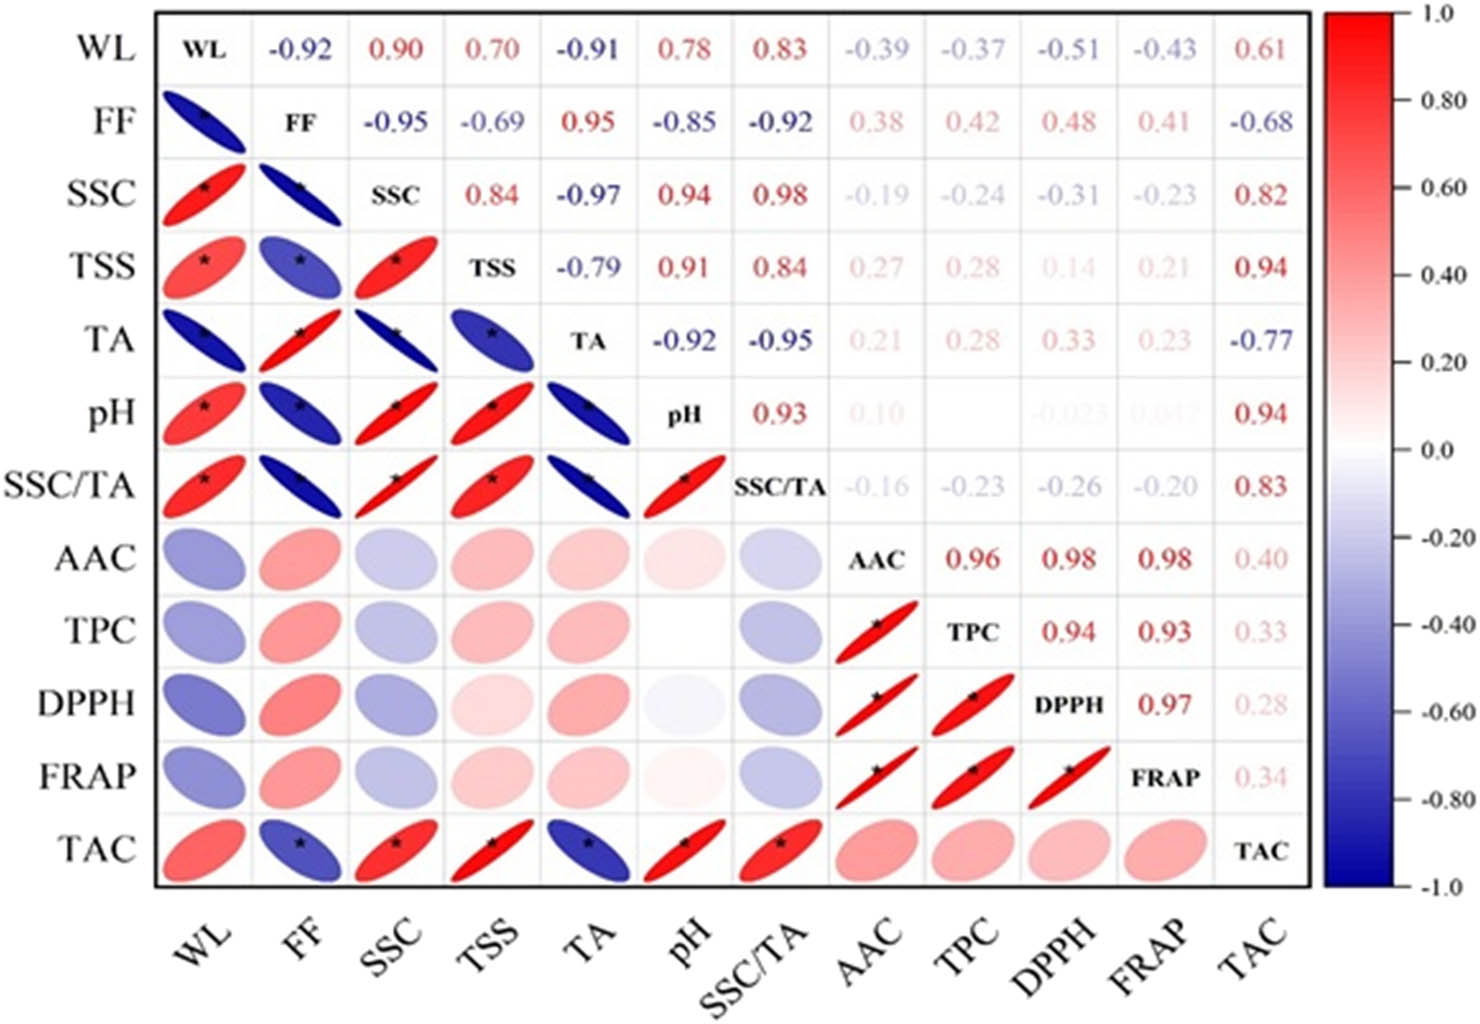
Correlation heat map (*p < 0.01); WL, weight loss percentage; FF, flesh firmness; SSC, soluble solids content; TSS, total soluble sugars; TA, titratable acidity; SSC/TA, soluble solids content ratio to titratable acidity; pH: acidity; AAC, ascorbic acid content; TPC, total phenol content; DPPH, antioxidant capacity; FRAP, antioxidant capacity; TAC, total anthocyanin content.
3.1 Fruit weight loss
The fruit weight loss increased progressively over 2 months of storage depending on growing locations (Figure 2). The values were significantly higher in Langarud than in Talesh and Rasht (Figure 2). The lower weight loss was found in the Rasht region in the center of Guilan province (Figure 2).
3.2 Fruit firmness
The fruit firmness at harvest time varied significantly according to geographical origin. The fruits grown in Rasht (center from Guilan) were firmer (8.66 kg/cm2) than those from Talesh and Langarud. Furthermore, fruit firmness decreased at low-temperature storage. The rate of softening in fruit harvested from Rasht was faster than those of Langarud and Talesh (Table 1). According to the results of simple correlation analysis (Figure 3), a negative correlation was observed between weight loss percentage and flesh firmness (r = −0.90).
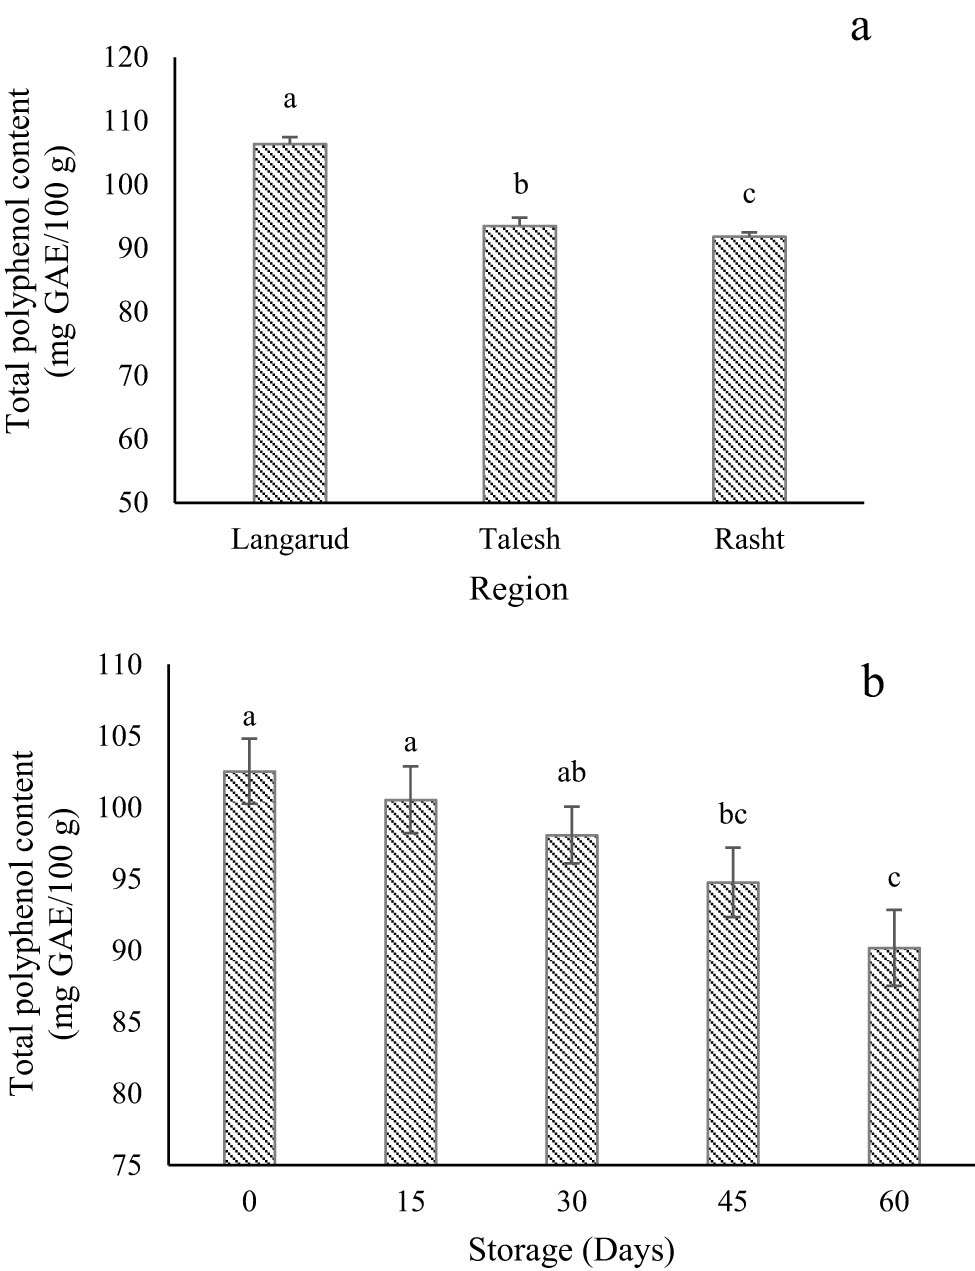
Variation of TPC according to (a) regions and (b) storage time. Different letters, for each determination, indicate significant differences among regions at p < 0.01 level. *The results are expressed as mean ± standard deviation and the (n) number of replicates in each experimental parameter determined.
3.3 SSC and TSS
The SSC is an important criterion in fruit taste and quality. It revealed a significant variation from one region to another (Table 1). Its content increased dramatically over storage time. The fruits from Langarud were characterized by the highest SSC (19.97% Brix), while the lowest SSC (17.3% Brix) was recorded in kiwifruit produced in Rasht. The results also showed a positive correlation between both weight loss and SSC (r = 0.90) and weight loss and TSS (r = 0.84; Figure 3).
The TSS varied significantly according to geographical origin. Kiwifruit produced in Langarud (9.46%) showed the highest TSS than two other regions at harvest time, while the lowest value (9.27%) was recorded in kiwifruit from Rasht (Table 1). With increased storage time, the TSS value of the samples of all regions increased and fruits harvested from Langarud (13.33%) showed the highest TSS after 60 days of storage (Table 1).
3.4 TA and pH
The fruit TA is a taste-related attribute. The geographical origin had a significant effect on the fruit TA. The highest TA (1.57%) was found in fruits harvested from the Rasht region. However, the lowest value was observed in fruits produced in Langarud (Table 1). The results also showed that the TA percentage declined over storage time independence on growing location. In this study, with increasing SSC and TSS, the amount of TA decreased simultaneously in fruits harvested from all three regions during cold storage (Table 1). According to the results of this study, TA correlates positively with flesh firmness (r = 0.95) and negatively with weight loss percentage (r = −0.91), pH (r = −92), SSC (r = −0.97), and TSS (r = −0.79; Figure 3).
Fruit juice pH is another parameter that is significantly affected by growing location. The highest and lowest pH levels were observed in fruits harvested from Langarud and Rasht, respectively (Table 1). During storage, the fruit pH of all fruits harvested from all three locations increased. No significant difference was observed either between different storage times or interaction between harvest location and storage period (Table 1). This value correlates negatively with TA (r = −0.92; Figure 3).
3.5 Maturity index
The growing location had a significant effect on the SSC to TA ratio (maturity index). The SSC/TA value ranged between 5.60 and 8.62 at harvest, where the samples from the Langarud region had the highest content. This difference was also observed after 60 days of cold storage. Fruits harvested from Rasht and Talesh had an SSC/TA value of 20.73 and 25.19, respectively; this amount in Langarud was 32.37. According to the results of simple correlation analysis (Figure 3), a negative correlation was observed between SSC/TA and both flesh firmness (r = −0.92) and TA (r = −0.95), while a positive correlation was observed between SSC/TA and weight loss percentage (r = 0.83), SSC (r = 0.98), TSS (r = 0.84), and pH (r = 0.93).
3.6 TPC
No significant difference was found between the interaction effect of growing locations and storage period (Table 2). Therefore, the simple effects of different storage periods and cultivation regions were investigated separately. According to Figure 4a, the highest TPC at harvest time (106.36 mg GAE/100 g) was observed in kiwifruit grown in Langarud, while the fruits from Rasht (center of Guilan) showed the lowest TPC (91.79 mg GAE/100 g). As shown in Figure 4b, TPC decreased significantly during low-temperature storage. The highest TPC (102.53 mg GAE/100 g) was observed at harvest time (0 days), while the fruits at the end of storage (60 days) showed the lowest TPC (90.18 mg GAE/100 g).
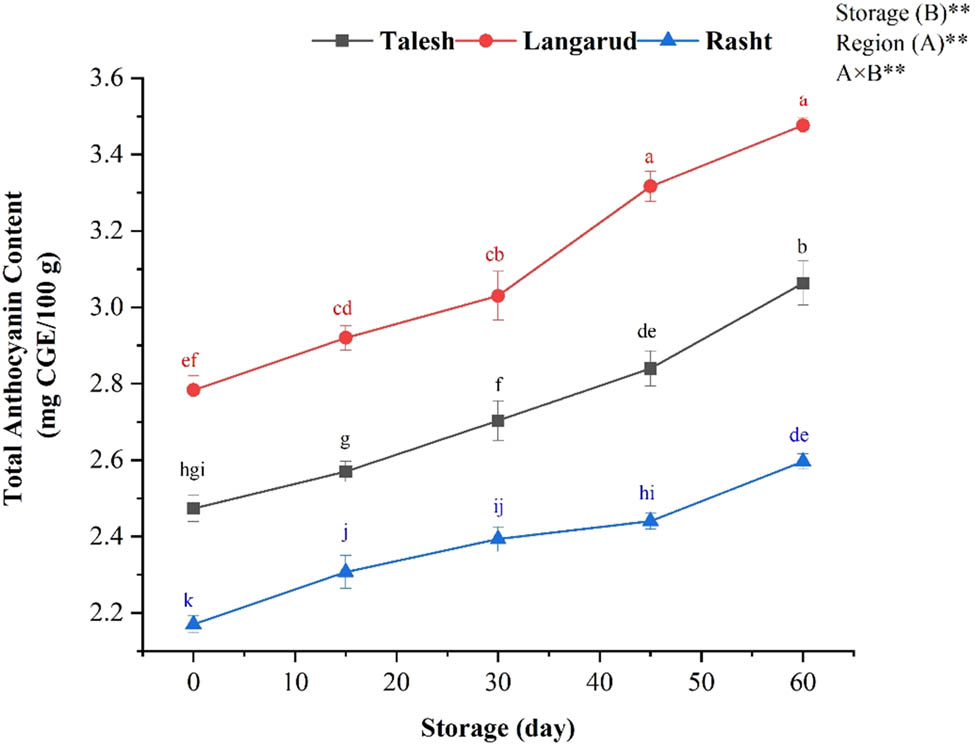
The change of TAC of red kiwifruit in relation growing location and storage times. Different lowercase letters show significant differences (p < 0.01) among treatments for each sampling date. *The results are expressed as mean ± standard deviation and the (n) number of replicates in each experimental parameter determined.
3.7 AAC
The AAC changed significantly among regions (Table 2). The AAC was higher in red flesh kiwifruit from the Langarud region (97.59 mg/100 g fresh weight) than that recorded in the Talesh and Rasht regions. The lowest AAC was observed at harvest time in Rasht (64.60 mg/100 g FW). The AAC in kiwifruit from Talesh and Rasht regions was proved statistically similar despite the extreme difference in average temperature, rainfall, and relative humidity during fruit development. Furthermore, AAC decreased over 60 storages without considering growing regions.
3.8 TAC
Anthocyanins are water-soluble pigments responsible for the blue, purple, and red colors of many fruits. The growing location had a significant effect on TAC (Figure 5). The TAC ranged between 2.78 and 3.47 mg CGE/100 g, among which the fruits harvested from Langarud regions had the highest content. The TAC value correlated positively with SSC (r = 0.82), TSS (r = 0.94), pH (r = 0.94), and SSC/TA (r = 0.83), and negatively with TA (r = −0.77). The TAC measure increased during cold storage in red flesh kiwifruit.
3.9 Antioxidant activity
Antioxidants are important bioactive compounds due to their high health benefits. The antioxidant activity evaluated by DPPH and FRAP assays was found significantly different among regions (Table 2). The DPPH scavenging activity was higher in red kiwifruit from Langarud (77.26%), while the fruits grown in Rasht had the lowest DPPH scavenging activity (66.21%). Regarding the FRAP assay, the fruits produced in Langarud exhibited the highest activity (11.96 μmol ascorbic acid/g). On the other hand, the lowest FRAP (9.20 μmol ascorbic acid/g) was observed in fruits from Rasht. During 2 months of storage, the antioxidant activity of fruits significantly decreased independently in growing locations (Table 2). DPPH correlated positively with AAC (r = 0.98), TPC (r = 0.94), and FRAP with AAC (r = 0.98), and TPC (r = 0.93).
3.10 Sensory evaluations
In this study, in addition to evaluating some physicochemical characteristics through laboratory methods, attention was also paid to sensory and taste aspects of kiwifruit by consumers with different taste preferences. As shown in Figure 6, fruits harvested from Langarud with higher SSC (11.73°Bx) than the other two sites showed a higher liking score by consumers in terms of external appearance, flesh color, juiciness, internal aroma intensity, sweetness, external aroma intensity, flavor intensity, and overall liking. Furthermore, tartness, firmness, fibrosity (texture), and astringency of fruits harvested from Rasht with SSC of 9.13°Bx were the highest. In conclusion, fruit harvested from Langarud, which had the highest soluble solids and sugar contents, were sensorially sweeter and juicier than others and were judged more palatable by consumers.
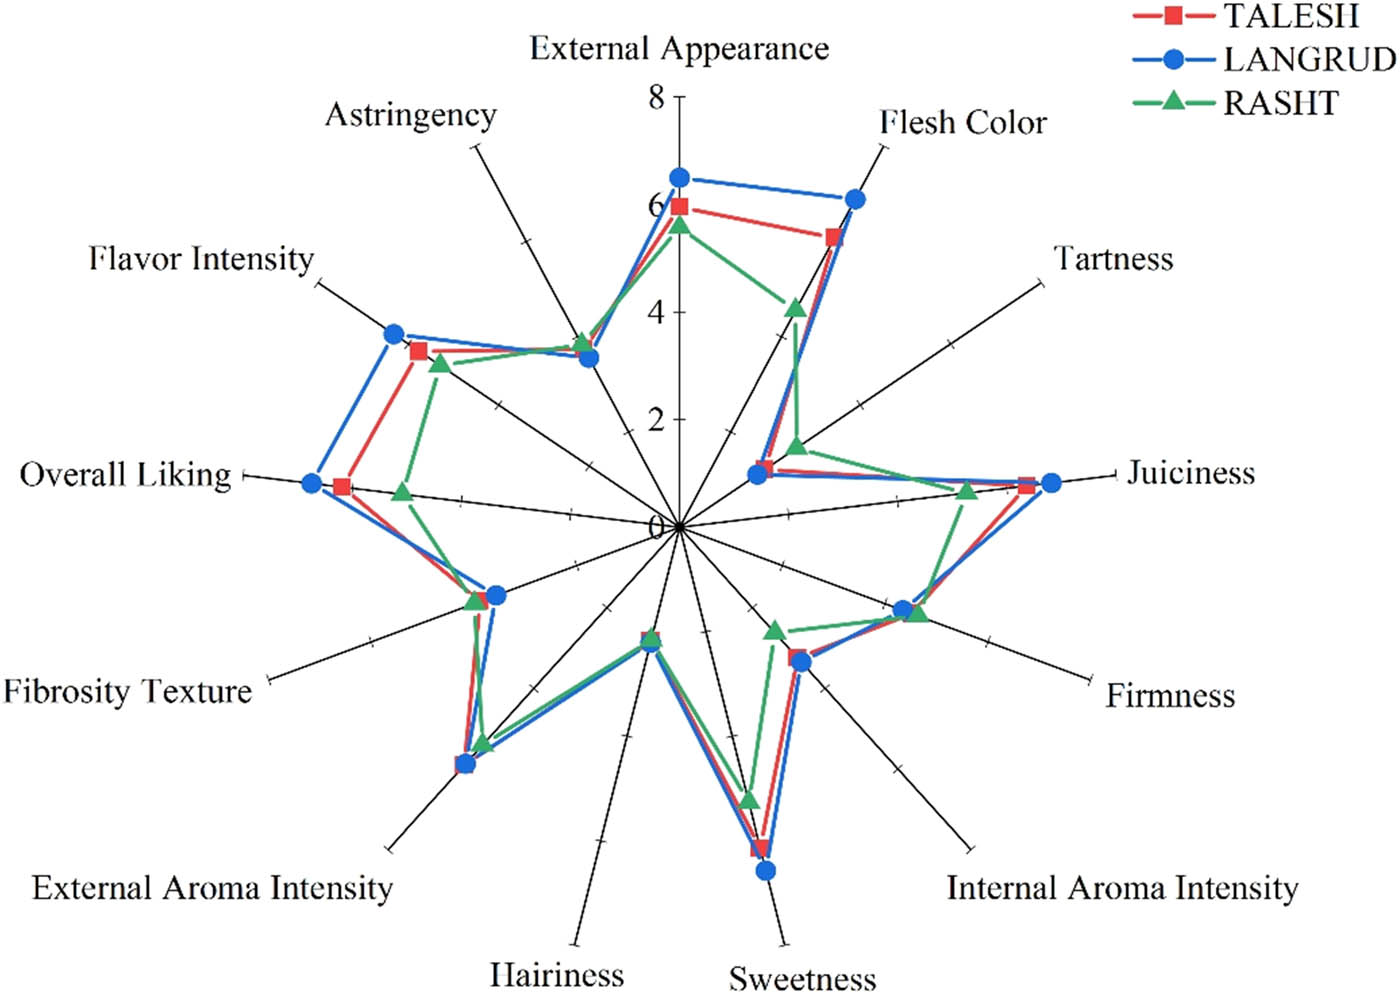
Sensory profiles of red-fleshed kiwifruit harvested from Rasht (▲), Talesh (■), and Langarud (●). For each variable, the possible range of values was 0–7.
4 Discussion
The average water content of kiwifruit at harvesting time is reported to be approximately 80 to 90% of the fresh weight [21]. Kiwifruit is sensitive to shrinkage due to water loss and this phenomenon is reported to be the most important factor in shortening storage life and increasing waste of kiwifruit. Maturity stage, concentration of minerals, and fruit size are all considered important variables affecting the weight loss rate in kiwifruit [22]. Reducing fruit water loss during storage and ripening helps maintain fruit quality and guarantees a longer storage life [21]. In this study, the geographical conditions in which fruits are produced could be an important factor that affected fruit weight loss and postharvest performance of kiwifruits. A negative correlation was found between weight loss and flesh firmness (r = −0.90; Figure 6). Fruit water loss in the postharvest phase depends on several factors related to production, harvest, postharvest handling, storage, and marketing [23]. Kiwifruits harvested from Langarod showed higher water loss and lower firmness than two other sites over 60 days’ storage.
Firmness is a key parameter that reflects fruit quality and influences consumer acceptability. Also, the rate of firmness decrease during cold storage is effective on storage life and market supply [24]. Results of this study are consistent with the findings of Tavarini et al. [24], and Chiaramonti and Barboni [25] which reported a decreasing fruit firmness and increasing SSC in Hayward kiwifruit during cold storage. Previous reports showed that fruits harvested with high SSC had a longer shelf life and maintained better firmness over storage time [26]. The SSC includes compounds in water-soluble sugar, acids, vitamins, and some minerals. It is also considered one of the important indicators for evaluating fruit and vegetable quality [27]. Previous studies also showed that SSC increased during storage in kiwifruit due to the breakdown of starches and increased activity of sucrose phosphate synthase enzyme [24,25]. Amodio et al. [28] reported that SSC increase during storage is not only related to an increase in sugar levels but also related to other soluble solids such as soluble pectin and phenolic compounds. By examining the relationship between SSC and postharvest quality, it is pointed out that fruits harvested with high sugar levels had a longer shelf life [24]. The dominant sugars in kiwifruit include glucose and fructose, and when the fruit is ripe and ready to eat, there is also a small amount of sucrose present in fruits. Total sugars and the proportion of these sugars vary not only as a function of maturity but also according to the type of kiwifruit, e.g., species, genotype, cultivar, etc. [29]. Barboni et al. [30] reported that kiwifruit flavors are associated with the balance between the most prominent sugars (glucose, fructose, and sucrose) and non-volatile organic acids.
A previous study showed that the TA content decreased in kiwifruit during 42 days of cold storage from 1.26% to less than 1% [31]. The conversion of organic acids into sugars and their derivatives or their use in respiration processes may be the reason for the acidity decrease during prolonged cold storage [14]. Results of this study suggest that the fruits retain their firmness during the cold storage and have more TA at the time of harvest, which is consistent with the findings of Harker and Hallett [32]. The metabolism of total acids during the ripening process reduces the total acidity and increases fruit juice pH. According to Fisk [31], as the TA of fruits continuously decreased from 1.26% to less than 1% after 42 days of storage, and the pH continuously increased from 3.61 to 3.75.
The low temperature and high rainfall average could be responsible for the increase in the maturity index of kiwifruit samples from Langarud. During storage, SSC/TA in fruits increased as a result of TA decrease and SSC increase [26]. Although Rossiter et al. [33] reported that the flavor quality of kiwifruit increased with increasing Brix value and was not affected by acidity, Harker et al. [34] found that overall consumer preference for kiwifruit was primarily influenced by sugar–acid balance and secondarily by firmness and volatile content. Sensory preference for fruits is often better described by the SSC/TA ratio compared to sugar or acid content alone [35].
The polyphenolic profile is greatly dependent on environmental conditions. Light, radiation, temperature, as well as water and nutritional status, are the most influential factors of which phenolic synthesis [36]. Our results revealed that lower temperatures especially in September and October (17.32 and 13.24°C, respectively) and higher precipitations in September and October (104.91 and 239.7 mm, respectively) resulted in higher phenol content in kiwifruit from Langarud (east from Guilan). These findings support those reported by Mditshwa et al. [37] who found that a cool climate induces higher TPC in pomegranate juice. Furthermore, the results revealed that the TPC of fruits decreased over 60 days of storage independently of growing location. The main phenolic compounds in kiwifruit include phenolic acids, flavonols, flavanols, and anthocyanins [4]. The composition of phenolic compounds in kiwifruit also depends on variety [38], genotype [39], accumulation sites inside the fruit [27], and stage of maturity [40]. Among these factors, different cultivars and genotypes of kiwifruit can be significantly different from each other in both the type of phenolic compounds and the TPC [38,39,40]. A previous study also confirmed that TPC in kiwifruit decreases with prolonged cold storage [41]. However, Tavarini et al. [24] reported that the TPC in kiwifruits with delayed harvest and higher SSC was higher at the end of 6 months of storage. Most studies have been conducted on green or yellow-fleshed kiwifruit cultivars, and there is little information on the phenolic compounds found in red-fleshed kiwifruit cultivars.
AAC is a key factor for quality evaluation in many fruits [39]. Esti et al. [42] observed that the AAC of kiwifruit depends on genotypes, ripeness, storage, and the analysis method used to measure it. In previous reports, genotype was one of the key factors determining kiwifruit AAC [18,24,29]. In addition to genotype, factors such as region and cultivation conditions, use of fertilizers, maturity stage at harvest, harvesting time, and ripening can cause variation in kiwifruit AAC [43]. During storage, fruits face post-harvest stress in which ascorbate peroxidase enzymes reduce oxidative metabolism by consuming ascorbic acid as an electron donor [28]. Kiwifruit ascorbic acid decrease at the end of storage was also reported by Tavarini et al. [44] and Amodio et al. [28].
The TAC measure increased during cold storage in red flesh kiwifruit. This is in agreement with previous findings showed that the TAC increased as kiwifruit ripened and was exposed to prolonged low temperatures [45,46]. The low temperature and high rainfall average could be responsible for the increase of TAC in kiwifruit from Langarud. As Figure 7 shows, there is a deep difference in inner pericarp color intensity between fruits harvested from Rasht, Langarud, and Talesh. Fruits produced in Langarud, with an average temperature in September and October (17.32 and 13.24°C, respectively) and an altitude of 121 meters above sea level, had the highest anthocyanin concentration at the time of harvest, as well as during and at the end of storage. The importance of orchard location and planting site is unsurprising, given previous reports emphasizing variation between orchards [47,48]. The red color of current commercial cultivars, both in New Zealand and in China, is often reported to be heterogeneous or paler than expected. This variation, which often occurs between orchards and different planting sites, has also been observed between the vines themselves [47,48,49]. However, environmental conditions have been found to play an important role in determining anthocyanin concentrations in many types of plants, including red-fleshed kiwifruit. The relationship between temperature and anthocyanin concentration has been demonstrated in a wide variety of plants. High temperatures in apples [50], grapes [51], and sweet potatoes [52] decrease the anthocyanin concentration, while low temperatures cause it to increase. Similar relationships between temperature and anthocyanin content have been discovered in red-fleshed kiwifruit. In several studies in China, fruits harvested from higher altitudes with lower summer temperatures had a more intense flesh color [47,48]. Higher temperatures, particularly temperatures above 35°C, are associated with anthocyanin degradation or inhibited anthocyanin expression. The variation between orchards in previous studies is thought to be related to variation in altitude and temperature.
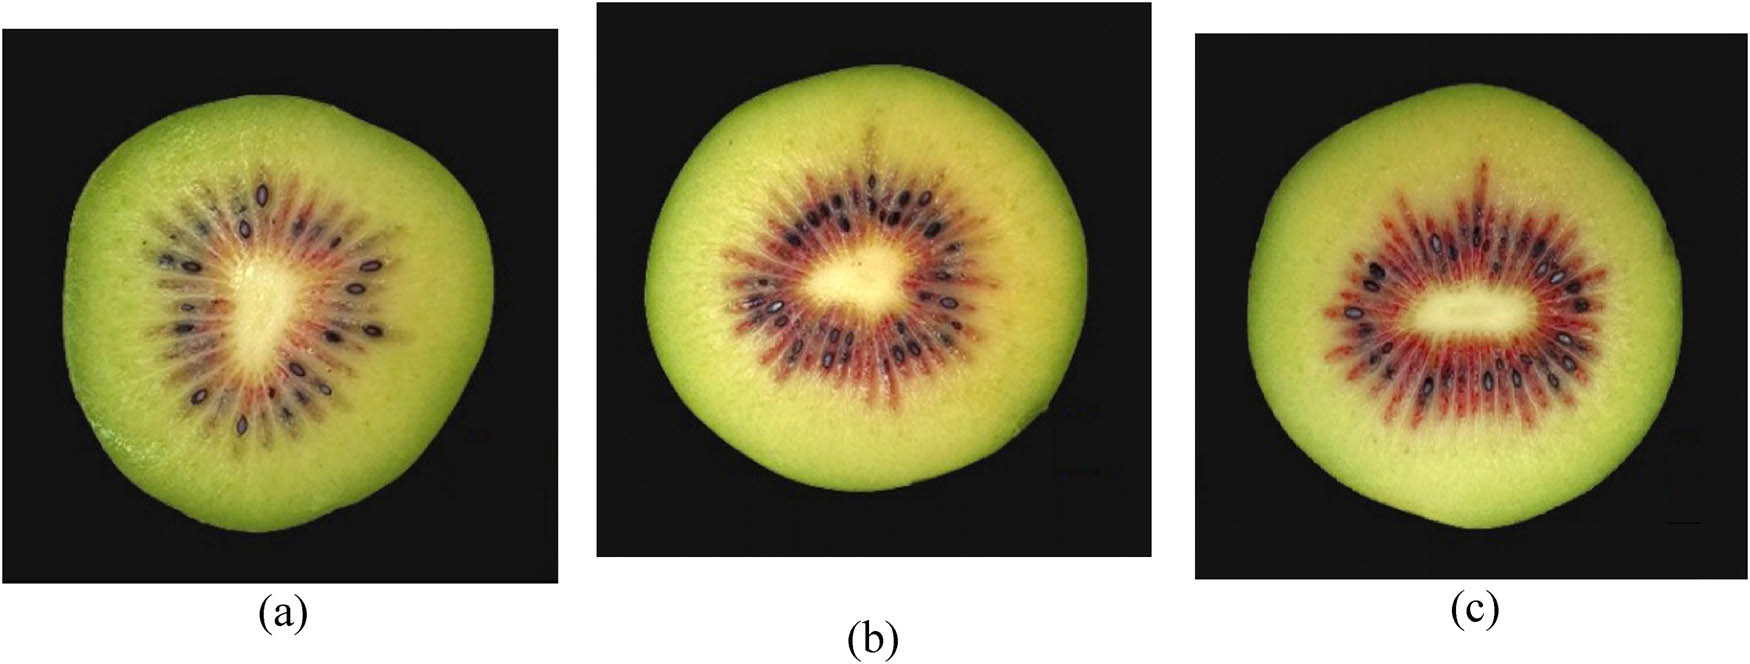
Comparison of inner pericarp color intensity in fruits from (a) Rasht, (b) Talash and (c) Langarud at harvest.
During 2 months of storage, the antioxidant activity of fruits decreased. In agreement with these findings, Tavarini et al. [24] reported that the antioxidant activity of kiwifruit was the highest at harvest time and thereafter decreased to the end of the 6th month. Kiwifruit has a high antioxidant capacity which is due to high levels of TPC and AAC. In addition, researchers have shown that during storage, the antioxidant capacity of fruits harvested with a Brix degree of 8 and above was higher than fruits harvested with a Brix degree of less than 8 [53]. Ferreyra et al. [54] showed that the reduction of antioxidant activity in strawberries during storage is due to ACC, flavonoids, and phenolic compounds deterioration. In general, products with a higher antioxidant activity show better resistance against different environmental stresses and also have better nutritional quality and storage properties [55]. In a study conducted in Italy, the geographical location of orchards did not significantly affect ascorbic acid or polyphenol contents [6]. In grapes and apples, antioxidant activity is measured by the content of polyphenols [56]. Therefore, based on previous reports, the correlation between bioactive components (TAC, AAC, TA, and TPC) and antioxidant activity in kiwifruit was evaluated to determine the main factors affecting antioxidant activity. In particular, ACC showed a higher correlation with antioxidant activity than other fruits such as grapes and apples, which is probably due to the high content of ascorbic acid in kiwifruit. In grapes and its products (juice and wine), the TA index showed a high correlation (approximately 1) with antioxidant activity and was one of the main factors of antioxidant activity [57]. In another report, a correlation index of approximately 0.9268 was reported [58], but this high correlation was not observed in kiwifruit. This result may be because the content of TA in kiwifruit is very low as compared to other fruits such as grapes.
Morphometric, colorimetric, textural, and organoleptic characteristics due to genotypic variations, have a great effect on consumer preferences. Consumer preference or acceptability of novel kiwifruit cultivars will depend on sensory attributes [59]. Fruit harvested from Langarud which had the highest SSC and TSS, were sensorially sweeter and juicier than others and were judged more palatable by consumers. It is perhaps not surprising that DM or SSC only accounted for a small degree of the variability in flavor, while other factors including sugars, acids, and volatiles played a more prominent role. In addition, other factors such as cultivation practices, maturity, storage, and ripening conditions may also influence flavor [60]. Harker et al. [34] demonstrated that most consumers provided their highest satisfaction scores after tasting samples with the highest SSC. The maturity index (SSC/TA), which plays an important role in fruit taste, is highly dependent on cultivars, horticultural practices, and weather conditions [61]. This index was higher in fruits harvested from Langarud compared to Rasht and Talesh. Generally, fruits harvested with a higher SSC maintain their organoleptic characteristics better during cold storage. In order to improve sensory quality, we suggest higher SSC at harvest to meet consumer preferences.
5 Conclusion and recommendation
A significant regional effect was observed on the bioactive compounds and antioxidant activity of “Khoni” kiwifruit. Although cultivar type is the main factor affecting the nutritional quality of kiwifruit, environmental conditions can also significantly impact fruit characteristics, especially on nutritional and bioactive compounds. The results of this study show that the orchard location as a pre-harvesting factor, has an important effect on both the nutritional and functional values of kiwifruit. The characteristics such as flesh firmness, SSC, TSS, TA, antioxidant capacity, total phenols, ascorbic acid, and TAC, which are important indicators for evaluating the internal quality of kiwifruit, were significantly influenced by orchard location, altitude, and average temperature over growing season. During storage, the firmness and total acidity of kiwifruit decreased while SSC, TSS, and anthocyanin content increased. These results will provide a better understanding of the effect of environmental conditions on physical properties and synthesis of bioactive compounds in order to obtain kiwifruits with better appearance and nutritional quality. According to these results, we also found that in red-fleshed kiwifruit cultivars, color development, stability, and intensity, along with storability are more dependent on maturity stage and environmental conditions (e.g., temperature, altitude, rainfall, relative humidity, etc.).
Acknowledgments
The authors appreciate University of Guilan for financial support.
-
Funding information: This research was funded by University of Guilan.
-
Author contributions: Methodology, M.A and M.Gh; data curation; M.A.; writing–original draft preparation, M.A, M.Gh, A.A.; Conceptualization, M.Gh; Investigation, M.Gh; resources, M.Gh; writing – review & editing, M.Gh, A.A; supervision, M.Gh; project administration; M.Gh; investigation; A.A.; writing – review & editing; A.A.; software, M.H.M and AB; formal analysis, J.O. All authors have read and agreed to the published version of the manuscript.
-
Conflict of interest: The authors state no conflict of interest.
-
Data availability statement: The authors will make the results available if requested.
References
[1] Pinto T, Vilela A. Kiwifruit, a botany, chemical and sensory approach a review. Adv Plants Agric Res. 2018;8(3):383–90. 10.15406/apar.2018.08.00355.Search in Google Scholar
[2] Richardson DP, Ansell J, Drummond LN. The nutritional and health attributes of kiwifruit: a review. Eur J Nutr. 2018;57:2659–76. 10.1007/s00394-018-1627-z.Search in Google Scholar PubMed PubMed Central
[3] Wang Z. Stability of red flesh color in kiwifruit: from breeding to postharvest. Acta Hortic. 2010;913:117–22. 10.17660/ActaHortic.2011.913.13.Search in Google Scholar
[4] Ma T, Sun X, Zhao J, You Y, Lei Y, Gao G, et al. Nutrient compositions and antioxidant capacity of kiwifruit (Actinidia) and their relationship with flesh color and commercial value. Food Chem. 2017;218:294–304. 10.1016/j.foodchem.2016.09.081.Search in Google Scholar PubMed
[5] Jhalegar MJ, Sharma RR, Pal RK, Rana V. Effect of postharvest treatments with polyamines on physiological and biochemical attributes of kiwifruit (Actinidia deliciosa) cv. Allison. Fruits. 2012;67(1):13–22. 10.1051/fruits/2011062.Search in Google Scholar
[6] Giangrieco I, Proietti S, Moscatello S, Tuppo L, Battistelli A, La Cara F, et al. Influence of geographical location of orchards on green kiwifruit bioactive components. J Agric Food Chem. 2016;64(46):9172–9. 10.1021/acs.jafc.6b03930.Search in Google Scholar PubMed
[7] Xia Y, Jia L, Zhang K, Xie J, Yu E, Tian J, et al. Geographical origin traceability of Procambarus clarkii based on mineral elements and stable isotopes. Foods. 2022;11(9):3060. 10.3390/foods11193060.Search in Google Scholar PubMed PubMed Central
[8] McAtee P, Karim S, Schaffer R, David K. A dynamic interplay between phytohormones is required for fruit development, maturation, and ripening. Front Plant Sci. 2013;4:79. 10.3389/fpls.2013.00079.Search in Google Scholar PubMed PubMed Central
[9] Paśko P, Tyszka-Czochara M, Trojan S, Bobis-Wozowicz S, Zagrodzki P, Namieśnik J, et al. Glycolytic genes expression, proapoptotic potential in relation to the total content of bioactive compounds in durian fruits. Food Res Int. 2019;125:108563. 10.1016/j.foodres.2019.108563.Search in Google Scholar PubMed
[10] Henwood RJ, Wargent JJ, Black M, Heyes JA. Environmental and management factors contributing to variability in flesh colour of a red kiwifruit cultivar in New Zealand. Sci Hortic. 2018;235:21–31. 10.1016/j.scienta.2017.12.009.Search in Google Scholar
[11] Choi HR, Tilahun S, Park DS, Lee YM, Choi JH, Baek, et al. Harvest time affects quality and storability of kiwifruit (Actinidia spp.): Cultivars during long-term cool storage. Sci Hortic. 2019;256:108523. 10.1016/j.scienta.2019.05.050.Search in Google Scholar
[12] Zhao Y, Zhu X, Hou Y, Pan Y, Shi L, Li X. Effects of harvest maturity stage on postharvest quality of winter jujube (Zizyphus jujuba Mill. cv. Dongzao) fruit during cold storage. Sci Hortic. 2021;277:109778. 10.1016/j.scienta.2020.109778.Search in Google Scholar
[13] Asiche WO, Mitalo OW, Kasahara Y, Tosa Y, Mworia EG, Willis OO, et al. Comparative transcriptome analysis reveals distinct ethylene–independent regulation of ripening in response to low temperature in kiwifruit. BMC Plant Biol. 2018;18:1–8. 10.1186/s12870-018-1264-y.Search in Google Scholar PubMed PubMed Central
[14] Tilahun S, Park DS, Taye AM, Jeong CS. Effect of ripening conditions on the physicochemical and antioxidant properties of tomato (Lycopersicon esculentum Mill.). Food Sci Biotechnol. 2017;26(2):473–9. 10.1007/s10068-017-0065-7.Search in Google Scholar PubMed PubMed Central
[15] Zhang H, Zhao Q, Lan T, Geng T, Gao C, Yuan Q, et al. Comparative analysis of physicochemical characteristics, nutritional and functional components and antioxidant capacity of fifteen kiwifruit (Actinidia) cultivars—comparative analysis of fifteen kiwifruit (Actinidia) cultivars. Foods. 2020;9(9):1267. 10.3390/foods9091267.Search in Google Scholar PubMed PubMed Central
[16] Liao G, HeY LiX, Zhong M, Huang C, Shuyao Y, et al. Effects of bagging on fruit flavor quality and related gene expression of AsA synthesis in Actinidia eriantha. Sci Horticulturae. 2019;256:108511. 10.1016/j.scienta.2019.05.038.Search in Google Scholar
[17] Oliveira DD, Lobato AL, Ribeiro SM, Santana AM, Chaves JB, Pinheiro-Sant’Ana HM. Carotenoids and vitamin C during handling and distribution of guava (Psidium guajava L.), mango (Mangifera indica L.), and papaya (Carica papaya L.) at commercial restaurants. J Agric Food Chem. 2010 26;58(10):6166–72. 10.1021/jf903734x.Search in Google Scholar PubMed
[18] Du G, Li M, Ma F, Liang D. Antioxidant capacity and the relationship with polyphenol and vitamin C in Actinidia fruits. Food Chem. 2009;113(2):557–62. 10.1016/j.foodchem.2008.08.025.Search in Google Scholar
[19] Sun X, Ma T, Han L, Huang W, Zhan J. Effects of copper pollution on the phenolic compound content, color, and antioxidant activity of wine. Molecules. 2017;22(5):726. 10.3390/molecules22050726.Search in Google Scholar PubMed PubMed Central
[20] Nunes-Damaceno M, Muñoz-Ferreiro N, Romero-Rodríguez MA, Vázquez-Odériz ML. A comparison of kiwi fruit from conventional, integrated and organic production systems. LWT-Food Sci Technol. 2013;54(1):291–7. 10.1016/j.lwt.2013.05.002.Search in Google Scholar
[21] Burdon J, Clark C. Effect of postharvest water loss on ‘Hayward’ kiwifruit water status. Postharvest Biol Technol. 2001;2(3):215–25. 10.1016/S0925-5214(01)00095-3.Search in Google Scholar
[22] Lester GE, Manthey JA, Buslig BS. Organic vs conventionally grown Rio Red whole grapefruit and juice: comparison of production inputs, market quality, consumer acceptance, and human health-bioactive compounds. J Agric Food Chem. 2007;55(14):4474–80. 10.1021/jf070901s.Search in Google Scholar PubMed
[23] Lufu R, Ambaw A, Opara UL. Water loss of fresh fruit: Influencing pre-harvest, harvest and postharvest factors. Sci Hortic. 2020;272:109519. 10.1016/j.scienta.2020.109519.Search in Google Scholar
[24] Tavarini S, Degl’Innocenti E, Remorini D, Massai R, Guidi L. Antioxidant capacity, ascorbic acid, total phenols and carotenoids changes during harvest and after storage of Hayward kiwifruit. Food Chem. 2008;107(1):282–8. 10.1016/j.foodchem.2007.08.015.Search in Google Scholar
[25] Chiaramonti N, Barboni T. Relationship between the physicochemical parameters and the ethylene emission during cold storage of kiwifruits. Int J Food Sci Technol. 2010;45(7):1513–6. 10.1111/j.1365-2621.2010.02297.x.Search in Google Scholar
[26] Feng J, Maguire KM, MacKay BR. Discriminating batches of ‘Hayward’ kiwifruit for storage potential. Postharvest Biol Technol. 2006;41(2):128–34. 10.1016/j.postharvbio.2006.03.010.Search in Google Scholar
[27] Ma TT, Sun XY, Gao GT, Wang XY, Liu XY, Du GR, et al. Phenolic characterization and antioxidant capacity of young wines made from different grape varieties grown in Helanshan Donglu wine zone (China). South Afr J Enol Vitic. 2014;35(3):321–31. 10.21548/35-2-1020.Search in Google Scholar
[28] Amodio ML, Colelli G, Hasey JK, Kader AA. A comparative study of composition and postharvest performance of organically and conventionally grown kiwifruits. J Sci Food Agric. 2007;87(7):1228–36. 10.1002/jsfa.2820.Search in Google Scholar
[29] Nishiyama I. Fruits of the Actinidia genus. Adv Food Nutr Res. 2007;52:293–324. 10.1016/S1043-4526(06)52006-6.Search in Google Scholar PubMed
[30] Barboni T, Cannac M, Chiaramonti N. Effect of cold storage and ozone treatment on physicochemical parameters, soluble sugars and organic acids in Actinidia deliciosa. Food Chem. 2010;121(4):946–51. 10.1016/j.foodchem.2010.01.024.Search in Google Scholar
[31] Fisk CL. Investigation of postharvest quality and storability of hardy kiwifruit (Actinidia argute ‘Ananasnaya’). HortTechnology. 2006;16(3):437–42. 10.21273/horttech.16.3.0437.Search in Google Scholar
[32] Harker FR, Hallett IC. Physiological and mechanical properties of kiwifruit tissue associated with texture change during cool storage. J Am Soc Hortic Sci. 1994;119(5):987–93. 10.21273/JASHS.119.5.987.Search in Google Scholar
[33] Rossiter KL, Young H, Walker SB, Miller M, Dawson DM. The effects of sugars and acids on consumer acceptability of kiwifruit. J Sens Stud. 2000;15(2):241–50. 10.1111/j.1745-459X.2000.tb00269.x.Search in Google Scholar
[34] Harker FR, Carr BT, Lenjo M, MacRae EA, Wismer WW, Marsh M, et al. Consumer liking for kiwifruit flavour: A meta-analysis of five studies on fruit quality. Food Qual Pref. 2009;20(1):30–41. 10.1016/j.foodqual.2008.07.001.Search in Google Scholar
[35] Babu KD, Singh NV, Gaikwad N, Maity A, Suryavanshi SK, Pal RK, et al. Determination of maturity indices for harvesting of pomegranate (Punica granatum). Indian J Agric Sci. 2017;7(9):1225–30. 10.56093/ijas.v87i9.74209.Search in Google Scholar
[36] De Orduna RM. Climate change associated effects on grape and wine quality and production. Food Res Int. 2010;43(7):1844–55. 10.1016/j.foodres.2010.05.001.Search in Google Scholar
[37] Mditshwa A, Fawole OA, Opara UL, Al-Said F, Al-Yahyai R. Phytochemical content, antioxidant capacity and physicochemical properties of pomegranate grown in different microclimates in South Africa. South Afr J Plant Soil. 2013;30(2):81–90, https://hdl.handle.net/10520/EJC138065.10.1080/02571862.2013.802033Search in Google Scholar
[38] Park YS, Leontowicz H, Leontowicz M, Namiesnik J, Suhaj MM, Cvikrová M, et al. Comparison of the contents of bioactive compounds and the level of antioxidant activity in different kiwifruit cultivars. J Food Composition Anal. 2011;24(7):963–70. 10.1016/j.jfca.2010.08.010.Search in Google Scholar
[39] Lim YJ, Oh CS, Park YD, Eom SH, Kim DO, Kim UJ, et al. Physiological components of kiwifruits with in vitro antioxidant and acetylcholinesterase inhibitory activities. Food Sci Biotechnol. 2014;23(3):943–9. 10.1007/s10068-014-0127-z.Search in Google Scholar
[40] Lee SK, Kader AA. Preharvest and postharvest factors influencing vitamin C content of horticultural crops. Postharvest Biol Technol. 2000;20(3):207–20. 10.1016/S0925-5214(00)00133-2.Search in Google Scholar
[41] Jhalegar SR, Rossiter KL, Wismer WV, Harker FR. Consumer-driven product development in the kiwifruit industry. Food Qual Pref. 2003;14:187–98. 10.1016/S0950-3293(02)00053-8.Search in Google Scholar
[42] Esti M, Messia MC, Bertocchi P, Sinesio F, Moneta E, Nicotra A, et al. Chemical compounds and sensory assessment of kiwifruit (Actinidia chinensis (Planch.) var. chinensis): electrochemical and multivariate analyses. Food Chem. 1998;61(3):293–300. 10.1016/S0308-8146(97)00052-6.Search in Google Scholar
[43] Lee I, Im S, Jin CR, Heo HJ, Cho YS, Baik MY, et al. Effect of maturity stage at harvest on antioxidant capacity and total phenolics in kiwifruits (Actinidia spp.) grown in Korea. Hortic Environ Biotechnol. 2015;56(6):841–8. 10.1007/s13580-015-1085-y.Search in Google Scholar
[44] Tavarini S, Degl’Innocenti E, Pardossi A, Guidi L. Biochemical aspects in two minimally processed lettuce upon storage. Int J Food Sci Technol. 2007;42:214–9. 10.1111/j.1365-2621.2006.01223.x.Search in Google Scholar
[45] LiB XY, Wang Y, Qin G, Tian S. Characterization of genes encoding key enzymes involved in anthocyanin metabolism of kiwifruit during storage period. Front Plant Sci. 2017;8:341. 10.3389/fpls.2017.00341.Search in Google Scholar PubMed PubMed Central
[46] Peng Y, Cordiner SB, Sawyer GM, McGhie TK, Espley RV, Allan AC, et al. Kiwifruit with high anthocyanin content modulates NF-κB activation and reduces CCL11 secretion in human alveolar epithelial cells. J Funct Foods. 2020;65:103734. 10.1016/j.jff.2019.103734.Search in Google Scholar
[47] Zhong C, Wang Z, Peng D, Bu F. Selection of a new red-fleshed kiwifruit cultivar ‘Chuhong. Acta Hortic. 2007;753:235–43. 10.17660/ActaHortic.2007.753.27.Search in Google Scholar
[48] Man YP, Wang YC, Li ZZ, Jiang ZW, Yang HL, Gong JJ, et al. High-temperature inhibition of biosynthesis and transportation of anthocyanins results in the poor red coloration in red-fleshed Actinidia chinensis. Physiol Plant. 2015;153(3):565–83. 10.1111/ppl.12263.Search in Google Scholar PubMed
[49] Wang M, Li M, Meng A. Selection of a new red-fleshed kiwifruit cultivar ‘Hongyang’. Acta Horticulturae. 2002;610:115–7. 10.17660/ActaHortic.2003.610.13.Search in Google Scholar
[50] Xie XB, Li S, Zhang RF, Zhao J, Chen YC, Zhao Q, et al. The bHLH transcription factor MdbHLH3 promotes anthocyanin accumulation and fruit colouration in response to low temperature in apples. Plant, Cell Environ. 2012;35(11):1884–97. 10.1111/j.1365-3040.2012.02523.x.Search in Google Scholar PubMed
[51] Mori K, Goto-Yamamoto N, Kitayama M, Hashizume K. Effect of high temperature on anthocyanin composition and transcription of flavonoid hydroxylase genes in ‘Pinot noir’ grapes (Vitis vinifera). J Hortic Sci Biotechnol. 2007;82(2):199–206. 10.1080/14620316.2007.11512220.Search in Google Scholar
[52] Villavicencio LE, Blankenship SM, Yencho GC, Thomas JF, Raper CD. Temperature effect on skin adhesion, cell wall enzyme activity, lignin content, anthocyanins, growth parameters, and periderm histochemistry of sweetpotato. J Am Soc Hortic Sci. 2007;132(5):729–38.10.21273/JASHS.132.5.729Search in Google Scholar
[53] Zoffoli JP, Gil GF, Crisosto CH. Determination of harvest period of Chilean kiwifruit in relation to fruit quality and temperature during maturation. Acta Hortic. 1999;498:247–54. 10.17660/ActaHortic.1999.498.28.Search in Google Scholar
[54] Ferreyra RM, Viña SZ, Mugridge A, Chaves AR. Growth and ripening season effects on antioxidant capacity of strawberry cultivar Selva. Sci Hortic. 2007;112(1):27–32. 10.1016/j.scienta.2006.12.001.Search in Google Scholar
[55] Łata B. Apple peel antioxidant status in relation to genotype, storage type and time. Sci Horticulturae. 2008;117(1):45–52. 10.1016/j.scienta.2008.03.011.Search in Google Scholar
[56] Eberhardt MV, Lee CY, Liu RH. Antioxidant activity of fresh apples. Nature. 2000;405(6789):903–4. 10.1038/35016151.Search in Google Scholar PubMed
[57] Meng JF, Fang YL, Qin MY, Zhuang XF, Zhang ZW. Varietal differences among the phenolic profiles and antioxidant properties of four cultivars of spine grape (Vitis davidii Foex) in Chongyi County (China). Food Chem. 2012;134(4):2049–56. 10.1016/j.foodchem.2012.04.005.Search in Google Scholar PubMed
[58] Paixao N, Perestrelo R, Marques JC, Câmara JS. Relationship between antioxidant capacity and total phenolic content of red, rosé and white wines. Food Chem. 2007;105(1):204–14. 10.1016/j.foodchem.2007.04.017.Search in Google Scholar
[59] Xia H, Wang X, Su W, Jiang L, Lin L, Deng Q, et al. Changes in the carotenoids profile of two yellow-fleshed kiwifruit cultivars during storage. Postharvest Biol Technol. 2020;164:111162. 10.1016/j.postharvbio.2020.111162.Search in Google Scholar
[60] MacRae EA, Stec MG, Triggs CM. Effects of postharvest treatment on the sensory qualities of kiwifruit harvested at different maturities. J Sci Food Agric. 1990;50(4):533–46. 10.1002/jsfa.2740500411.Search in Google Scholar
[61] Shwartz E, Glazer I, Bar-Ya’akov I, Matityahu I, Bar-Ilan I, Hollland D, et al. Changes in chemical constituents during the maturation and ripening of two commercially important pomegranate accessions. Food Chem. 2009;11(3):965–73. 10.1016/j.foodchem.2009.01.036.Search in Google Scholar
© 2024 the author(s), published by De Gruyter
This work is licensed under the Creative Commons Attribution 4.0 International License.
Articles in the same Issue
- Regular Articles
- Supplementation of P-solubilizing purple nonsulfur bacteria, Rhodopseudomonas palustris improved soil fertility, P nutrient, growth, and yield of Cucumis melo L.
- Yield gap variation in rice cultivation in Indonesia
- Effects of co-inoculation of indole-3-acetic acid- and ammonia-producing bacteria on plant growth and nutrition, soil elements, and the relationships of soil microbiomes with soil physicochemical parameters
- Impact of mulching and planting time on spring-wheat (Triticum aestivum) growth: A combined field experiment and empirical modeling approach
- Morphological diversity, correlation studies, and multiple-traits selection for yield and yield components of local cowpea varieties
- Participatory on-farm evaluation of new orange-fleshed sweetpotato varieties in Southern Ethiopia
- Yield performance and stability analysis of three cultivars of Gayo Arabica coffee across six different environments
- Biology of Spodoptera frugiperda (Lepidoptera: Noctuidae) on different types of plants feeds: Potency as a pest on various agricultural plants
- Antidiabetic activity of methanolic extract of Hibiscus sabdariffa Linn. fruit in alloxan-induced Swiss albino diabetic mice
- Bioinformatics investigation of the effect of volatile and non-volatile compounds of rhizobacteria in inhibiting late embryogenesis abundant protein that induces drought tolerance
- Nicotinamide as a biostimulant improves soybean growth and yield
- Farmer’s willingness to accept the sustainable zoning-based organic farming development plan: A lesson from Sleman District, Indonesia
- Uncovering hidden determinants of millennial farmers’ intentions in running conservation agriculture: An application of the Norm Activation Model
- Mediating role of leadership and group capital between human capital component and sustainability of horticultural agribusiness institutions in Indonesia
- Biochar technology to increase cassava crop productivity: A study of sustainable agriculture on degraded land
- Effect of struvite on the growth of green beans on Mars and Moon regolith simulants
- UrbanAgriKG: A knowledge graph on urban agriculture and its embeddings
- Provision of loans and credit by cocoa buyers under non-price competition: Cocoa beans market in Ghana
- Effectiveness of micro-dosing of lime on selected chemical properties of soil in Banja District, North West, Ethiopia
- Effect of weather, nitrogen fertilizer, and biostimulators on the root size and yield components of Hordeum vulgare
- Effects of selected biostimulants on qualitative and quantitative parameters of nine cultivars of the genus Capsicum spp.
- Growth, yield, and secondary metabolite responses of three shallot cultivars at different watering intervals
- Design of drainage channel for effective use of land on fully mechanized sugarcane plantations: A case study at Bone Sugarcane Plantation
- Technical feasibility and economic benefit of combined shallot seedlings techniques in Indonesia
- Control of Meloidogyne javanica in banana by endophytic bacteria
- Comparison of important quality components of red-flesh kiwifruit (Actinidia chinensis) in different locations
- Efficiency of rice farming in flood-prone areas of East Java, Indonesia
- Comparative analysis of alpine agritourism in Trentino, Tyrol, and South Tyrol: Regional variations and prospects
- Detection of Fusarium spp. infection in potato (Solanum tuberosum L.) during postharvest storage through visible–near-infrared and shortwave–near-infrared reflectance spectroscopy
- Forage yield, seed, and forage qualitative traits evaluation by determining the optimal forage harvesting stage in dual-purpose cultivation in safflower varieties (Carthamus tinctorius L.)
- The influence of tourism on the development of urban space: Comparison in Hanoi, Danang, and Ho Chi Minh City
- Optimum intra-row spacing and clove size for the economical production of garlic (Allium sativum L.) in Northwestern Highlands of Ethiopia
- The role of organic rice farm income on farmer household welfare: Evidence from Yogyakarta, Indonesia
- Exploring innovative food in a developing country: Edible insects as a sustainable option
- Genotype by environment interaction and performance stability of common bean (Phaseolus vulgaris L.) cultivars grown in Dawuro zone, Southwestern Ethiopia
- Factors influencing green, environmentally-friendly consumer behaviour
- Factors affecting coffee farmers’ access to financial institutions: The case of Bandung Regency, Indonesia
- Morphological and yield trait-based evaluation and selection of chili (Capsicum annuum L.) genotypes suitable for both summer and winter seasons
- Sustainability analysis and decision-making strategy for swamp buffalo (Bubalus bubalis carabauesis) conservation in Jambi Province, Indonesia
- Understanding factors affecting rice purchasing decisions in Indonesia: Does rice brand matter?
- An implementation of an extended theory of planned behavior to investigate consumer behavior on hygiene sanitation-certified livestock food products
- Information technology adoption in Indonesia’s small-scale dairy farms
- Draft genome of a biological control agent against Bipolaris sorokiniana, the causal phytopathogen of spot blotch in wheat (Triticum turgidum L. subsp. durum): Bacillus inaquosorum TSO22
- Assessment of the recurrent mutagenesis efficacy of sesame crosses followed by isolation and evaluation of promising genetic resources for use in future breeding programs
- Fostering cocoa industry resilience: A collaborative approach to managing farm gate price fluctuations in West Sulawesi, Indonesia
- Field investigation of component failures for selected farm machinery used in small rice farming operations
- Near-infrared technology in agriculture: Rapid, simultaneous, and non-destructive determination of inner quality parameters on intact coffee beans
- The synergistic application of sucrose and various LED light exposures to enhance the in vitro growth of Stevia rebaudiana (Bertoni)
- Weather index-based agricultural insurance for flower farmers: Willingness to pay, sales, and profitability perspectives
- Meta-analysis of dietary Bacillus spp. on serum biochemical and antioxidant status and egg quality of laying hens
- Biochemical characterization of trypsin from Indonesian skipjack tuna (Katsuwonus pelamis) viscera
- Determination of C-factor for conventional cultivation and soil conservation technique used in hop gardens
- Empowering farmers: Unveiling the economic impacts of contract farming on red chilli farmers’ income in Magelang District, Indonesia
- Evaluating salt tolerance in fodder crops: A field experiment in the dry land
- Labor productivity of lowland rice (Oryza sativa L.) farmers in Central Java Province, Indonesia
- Cropping systems and production assessment in southern Myanmar: Informing strategic interventions
- The effect of biostimulants and red mud on the growth and yield of shallots in post-unlicensed gold mining soil
- Effects of dietary Adansonia digitata L. (baobab) seed meal on growth performance and carcass characteristics of broiler chickens: A systematic review and meta-analysis
- Analysis and structural characterization of the vid-pisco market
- Pseudomonas fluorescens SP007s enhances defense responses against the soybean bacterial pustule caused by Xanthomonas axonopodis pv. glycines
- A brief investigation on the prospective of co-composted biochar as a fertilizer for Zucchini plants cultivated in arid sandy soil
- Supply chain efficiency of red chilies in the production center of Sleman Indonesia based on performance measurement system
- Investment development path for developed economies: Is agriculture different?
- Power relations among actors in laying hen business in Indonesia: A MACTOR analysis
- High-throughput digital imaging and detection of morpho-physiological traits in tomato plants under drought
- Converting compression ignition engine to dual-fuel (diesel + CNG) engine and experimentally investigating its performance and emissions
- Structuration, risk management, and institutional dynamics in resolving palm oil conflicts
- Spacing strategies for enhancing drought resilience and yield in maize agriculture
- Composition and quality of winter annual agrestal and ruderal herbages of two different land-use types
- Investigating Spodoptera spp. diversity, percentage of attack, and control strategies in the West Java, Indonesia, corn cultivation
- Yield stability of biofertilizer treatments to soybean in the rainy season based on the GGE biplot
- Evaluating agricultural yield and economic implications of varied irrigation depths on maize yield in semi-arid environments, at Birfarm, Upper Blue Nile, Ethiopia
- Chemometrics for mapping the spatial nitrate distribution on the leaf lamina of fenugreek grown under varying nitrogenous fertilizer doses
- Pomegranate peel ethanolic extract: A promising natural antioxidant, antimicrobial agent, and novel approach to mitigate rancidity in used edible oils
- Transformative learning and engagement with organic farming: Lessons learned from Indonesia
- Tourism in rural areas as a broader concept: Some insights from the Portuguese reality
- Assessment enhancing drought tolerance in henna (Lawsonia inermis L.) ecotypes through sodium nitroprusside foliar application
- Edible insects: A survey about perceptions regarding possible beneficial health effects and safety concerns among adult citizens from Portugal and Romania
- Phenological stages analysis in peach trees using electronic nose
- Harvest date and salicylic acid impact on peanut (Arachis hypogaea L.) properties under different humidity conditions
- Hibiscus sabdariffa L. petal biomass: A green source of nanoparticles of multifarious potential
- Use of different vegetation indices for the evaluation of the kinetics of the cherry tomato (Solanum lycopersicum var. cerasiforme) growth based on multispectral images by UAV
- First evidence of microplastic pollution in mangrove sediments and its ingestion by coral reef fish: Case study in Biawak Island, Indonesia
- Physical and textural properties and sensory acceptability of wheat bread partially incorporated with unripe non-commercial banana cultivars
- Cereibacter sphaeroides ST16 and ST26 were used to solubilize insoluble P forms to improve P uptake, growth, and yield of rice in acidic and extreme saline soil
- Avocado peel by-product in cattle diets and supplementation with oregano oil and effects on production, carcass, and meat quality
- Optimizing inorganic blended fertilizer application for the maximum grain yield and profitability of bread wheat and food barley in Dawuro Zone, Southwest Ethiopia
- The acceptance of social media as a channel of communication and livestock information for sheep farmers
- Adaptation of rice farmers to aging in Thailand
- Combined use of improved maize hybrids and nitrogen application increases grain yield of maize, under natural Striga hermonthica infestation
- From aquatic to terrestrial: An examination of plant diversity and ecological shifts
- Statistical modelling of a tractor tractive performance during ploughing operation on a tropical Alfisol
- Participation in artisanal diamond mining and food security: A case study of Kasai Oriental in DR Congo
- Assessment and multi-scenario simulation of ecosystem service values in Southwest China’s mountainous and hilly region
- Analysis of agricultural emissions and economic growth in Europe in search of ecological balance
- Bacillus thuringiensis strains with high insecticidal activity against insect larvae of the orders Coleoptera and Lepidoptera
- Technical efficiency of sugarcane farming in East Java, Indonesia: A bootstrap data envelopment analysis
- Comparison between mycobiota diversity and fungi and mycotoxin contamination of maize and wheat
- Evaluation of cultivation technology package and corn variety based on agronomy characters and leaf green indices
- Exploring the association between the consumption of beverages, fast foods, sweets, fats, and oils and the risk of gastric and pancreatic cancers: Findings from case–control study
- Phytochemical composition and insecticidal activity of Acokanthera oblongifolia (Hochst.) Benth & Hook.f. ex B.D.Jacks. extract on life span and biological aspects of Spodoptera littoralis (Biosd.)
- Land use management solutions in response to climate change: Case study in the central coastal areas of Vietnam
- Evaluation of coffee pulp as a feed ingredient for ruminants: A meta-analysis
- Interannual variations of normalized difference vegetation index and potential evapotranspiration and their relationship in the Baghdad area
- Harnessing synthetic microbial communities with nitrogen-fixing activity to promote rice growth
- Agronomic and economic benefits of rice–sweetpotato rotation in lowland rice cropping systems in Uganda
- Response of potato tuber as an effect of the N-fertilizer and paclobutrazol application in medium altitude
- Bridging the gap: The role of geographic proximity in enhancing seed sustainability in Bandung District
- Evaluation of Abrams curve in agricultural sector using the NARDL approach
- Challenges and opportunities for young farmers in the implementation of the Rural Development Program 2014–2020 of the Republic of Croatia
- Yield stability of ten common bean (Phaseolus vulgaris L.) genotypes at different sowing dates in Lubumbashi, South-East of DR Congo
- Effects of encapsulation and combining probiotics with different nitrate forms on methane emission and in vitro rumen fermentation characteristics
- Phytochemical analysis of Bienertia sinuspersici extract and its antioxidant and antimicrobial activities
- Evaluation of relative drought tolerance of grapevines by leaf fluorescence parameters
- Yield assessment of new streak-resistant topcross maize hybrids in Benin
- Improvement of cocoa powder properties through ultrasonic- and microwave-assisted alkalization
- Potential of ecoenzymes made from nutmeg (Myristica fragrans) leaf and pulp waste as bioinsecticides for Periplaneta americana
- Analysis of farm performance to realize the sustainability of organic cabbage vegetable farming in Getasan Semarang, Indonesia
- Revealing the influences of organic amendment-derived dissolved organic matter on growth and nutrient accumulation in lettuce seedlings (Lactuca sativa L.)
- Identification of viruses infecting sweetpotato (Ipomoea batatas Lam.) in Benin
- Assessing the soil physical and chemical properties of long-term pomelo orchard based on tree growth
- Investigating access and use of digital tools for agriculture among rural farmers: A case study of Nkomazi Municipality, South Africa
- Does sex influence the impact of dietary vitD3 and UVB light on performance parameters and welfare indicators of broilers?
- Design of intelligent sprayer control for an autonomous farming drone using a multiclass support vector machine
- Deciphering salt-responsive NB-ARC genes in rice transcriptomic data: A bioinformatics approach with gene expression validation
- Review Articles
- Impact of nematode infestation in livestock production and the role of natural feed additives – A review
- Role of dietary fats in reproductive, health, and nutritional benefits in farm animals: A review
- Climate change and adaptive strategies on viticulture (Vitis spp.)
- The false tiger of almond, Monosteira unicostata (Hemiptera: Tingidae): Biology, ecology, and control methods
- A systematic review on potential analogy of phytobiomass and soil carbon evaluation methods: Ethiopia insights
- A review of storage temperature and relative humidity effects on shelf life and quality of mango (Mangifera indica L.) fruit and implications for nutrition insecurity in Ethiopia
- Green extraction of nutmeg (Myristica fragrans) phytochemicals: Prospective strategies and roadblocks
- Potential influence of nitrogen fertilizer rates on yield and yield components of carrot (Dacus carota L.) in Ethiopia: Systematic review
- Corn silk: A promising source of antimicrobial compounds for health and wellness
- State and contours of research on roselle (Hibiscus sabdariffa L.) in Africa
- The potential of phosphorus-solubilizing purple nonsulfur bacteria in agriculture: Present and future perspectives
- Minor millets: Processing techniques and their nutritional and health benefits
- Meta-analysis of reproductive performance of improved dairy cattle under Ethiopian environmental conditions
- Review on enhancing the efficiency of fertilizer utilization: Strategies for optimal nutrient management
- The nutritional, phytochemical composition, and utilisation of different parts of maize: A comparative analysis
- Motivations for farmers’ participation in agri-environmental scheme in the EU, literature review
- Evolution of climate-smart agriculture research: A science mapping exploration and network analysis
- Short Communications
- Music enrichment improves the behavior and leukocyte profile of dairy cattle
- Effect of pruning height and organic fertilization on the morphological and productive characteristics of Moringa oleifera Lam. in the Peruvian dry tropics
- Corrigendum
- Corrigendum to “Bioinformatics investigation of the effect of volatile and non-volatile compounds of rhizobacteria in inhibiting late embryogenesis abundant protein that induces drought tolerance”
- Corrigendum to “Composition and quality of winter annual agrestal and ruderal herbages of two different land-use types”
- Special issue: Smart Agriculture System for Sustainable Development: Methods and Practices
- Construction of a sustainable model to predict the moisture content of porang powder (Amorphophallus oncophyllus) based on pointed-scan visible near-infrared spectroscopy
- FruitVision: A deep learning based automatic fruit grading system
- Energy harvesting and ANFIS modeling of a PVDF/GO-ZNO piezoelectric nanogenerator on a UAV
- Effects of stress hormones on digestibility and performance in cattle: A review
- Special Issue of The 4th International Conference on Food Science and Engineering (ICFSE) 2022 - Part II
- Assessment of omega-3 and omega-6 fatty acid profiles and ratio of omega-6/omega-3 of white eggs produced by laying hens fed diets enriched with omega-3 rich vegetable oil
- Special Issue on FCEM - International Web Conference on Food Choice & Eating Motivation - Part II
- Special Issue on FCEM – International Web Conference on Food Choice & Eating Motivation: Message from the editor
- Fruit and vegetable consumption: Study involving Portuguese and French consumers
- Knowledge about consumption of milk: Study involving consumers from two European Countries – France and Portugal