Urban black and odorous water body mapping from Gaofen-2 images
-
Yang Ying
 ,
Zhou Chao
,
Wu Shihong
,
Zhou Chao
,
Wu Shihong

Abstract
Remote sensing technology has shown its irreplaceable advantages in the identification of urban black and odorous water body. However, the universality of the remote sensing recognition algorithm for the black and odorous water body is not clear in different regions. Thus, two typical cities, Shenyang and Nanjing, were selected from northern and southern China as the study areas. Four forms of recognition models of the black and odorous water body are built based on Gaofen-2 images, including the single-band model, difference model, ratio model, and water quality parameter model. Combined with the remote sensing interpretation marks of black and odorous water body, the recognition precision of black and odorous water body is analyzed by the methods of the confusion matrix and Kappa coefficient. The results show that the overall accuracy of the normalized difference black-odorous water index (NDBWI) model is higher than 80% in the northern and southern cities of China, with good consistency of spatial distribution. The accuracy of the black and odorous water index model and G model is higher than 75% only in the special areas of Nanjing or Shenyang. The accuracy of other models is generally low. Research show that the NDBWI model has better universality in the identification of urban black and odorous water body, and it is suitable for promotion and application. The remote sensing interpretation marks of black and odorous water body have shown a good auxiliary identification function. The research provides a technical foundation for large-scale and rapid identification of urban black and odorous water body.
1 Introduction
The urban water body is called “the kidney of the city,” which has the functions of freshwater supply and environmental purification. With the increasing urban scale in China, the discharge of production and domestic sewage has increased exponentially. The urban environmental infrastructure is overwhelmed, resulting in the significant “black odorous” of urban water [1]. The survey results show that more than 70% of Chinese cities have a large number of black and odorous water bodies. Black and odorous water bodies cause severe imbalances in urban ecosystems and affect the physical and mental health and living quality of residents. As the most prominent urban problem, it is urgent to remediate the black and odorous water bodies. Conducting studies on the monitoring and controlling technology of urban black and odorous water bodies is necessary. At present, most of the identification and characterization of black and odorous water bodies in China and other countries are conducted by chemical test methods after fixed-point water quality sampling [2,3]. However, the black and odorous water bodies in Chinese cities have wide distribution, large numbers, small volumes, complex distribution, multiple types, and great variations. Moreover, the black and odorous phenomenon has seasonal and regional characteristics. On-site sampling is difficult to meet the needs of large-area and dynamic monitoring. Nowadays, the treatment methods for black and odorous water bodies are becoming more and more sophisticated [4,5,6,7], and the accurate identification of the scope of black and odorous areas becomes urgent. Compared with ground-based monitoring, remote sensing technology has dynamic continuity in space and time. In combination with its unique optical diagnosis characteristics, remote sensing provides a new technical means for the large-scale identification of urban black and odorous water bodies.
Compared with the studies on mature remote sensing monitoring technology of inland lakes [8], the studies on remote sensing monitoring of urban black and odorous water bodies started late. There is a lack of international studies, and only a few Chinese scholars have conducted studies. Based on the differences in apparent or inherent optical characteristics between black and odorous water bodies and healthy water bodies, scholars extracted optical characteristic parameters and established a threshold model to identify black and odorous water bodies [9,10,11,12,13]. For example, the colored dissolved organic matter absorption coefficient of black and odorous water at 440 nm is about 1.7 times higher than that of normal water. In the band range of 500–700 nm, due to the presence of chlorophyll-a, the normal water has an obvious fluorescence peak near 550 and 700 nm and an obvious absorption valley near 670 nm. However, the low content of dissolved oxygen in the black and odorous water leads to insufficient pigment characteristics of algae. In this band range, the fluorescence peak valley of the reflectance of black and odorous water is not obvious, which shows that the peak is gentler and the value is lower [10,12,14]. These characteristics are important optical characteristics for the identification of black and odorous water.
Many specific applications of the Gaofen data have been attempted in various fields in recent years [15,16], and better results have been achieved, such as object segmentation [17] and object recognition [18,19]. For the identification of black and odorous water bodies, the researchers combined the unique apparent optical characteristics of black and odorous water bodies and the band setting of remote sensing images. They established the discrimination model of black and odorous water bodies using the combined operation forms of difference, ratio, and normalization between bands [20,21]. Based on this model, Chinese scholars have identified black and odorous water bodies in Shenyang, Changchun, Nanjing, Hangzhou, and other cities in the north and south. Besides, the discrimination model and threshold range suitable for the city studied were determined, with an accuracy of 50–90% [14]. In addition, some scholars indirectly identify black and odorous water bodies by estimating the concentration of water quality indicators (e.g., chlorophyll and suspended solids) [22]. However, the estimated water quality indicators and black odor generation mechanisms are not clear, and there are some errors in the estimated water quality indicators, which may lead to insufficient identification accuracy [9,10,11,13]. Some scholars have also performed black and odorous water identification by focusing only on the color of the water body [23], lacking the use of spectral information of the water body. Most importantly, the latitude span of China is about 50° from north to south. The types of black and odorous water bodies in southern cities with developed water systems are very different from those in northern cities with water shortages. The applicability of the identification model based on a single city cannot be guaranteed in cities with significant regional differences between the north and the south. Therefore, it is important to find a more suitable remote sensing identification model for black and odorous water bodies in northern and southern cities. In this way, the operational promotion and application of the remote sensing identification method of black and odorous water bodies can be realized.
Therefore, in order to verify the universality of the existing black and odorous water bodies identification algorithms, Nanjing and Shenyang of China were selected as the study regions. The optical characteristics of black and odorous water bodies were analyzed based on the field-measured data. The recognition models of black and odorous water bodies were established, combined with Gaofen-2 image bands, and the thresholds of models were determined. The identification accuracy and consistency of each model were verified by the field investigation and the remote sensing image characteristics of black and odorous water. Figure 1 shows the structure of this article. In this work, an algorithm was explored to identify the black and odorous water bodies of different regions in northern and southern China, and the remote sensing image interpretation mark was introduced to assist the optical algorithm to obtain a better identification result of the black and odorous water body.
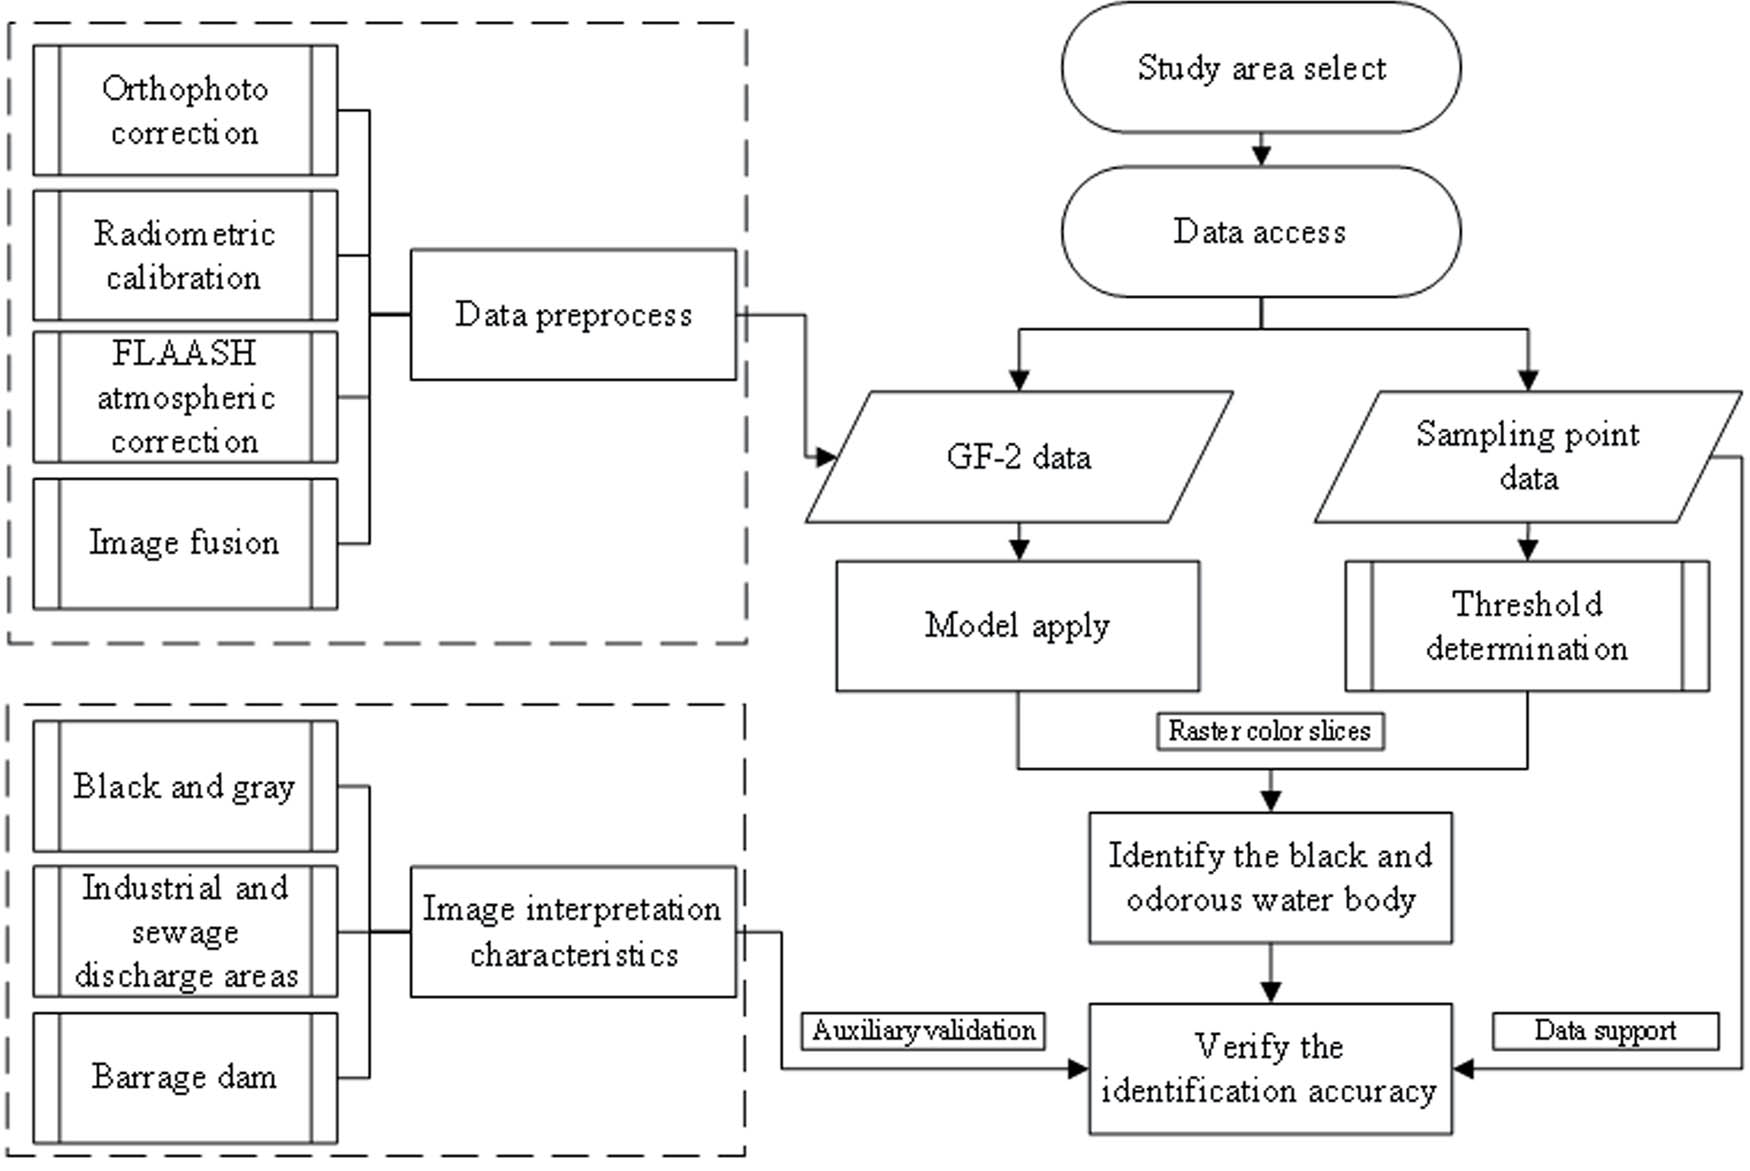
Structure of this article.
2 Study area and data
2.1 Study area
In order to reflect the regional applicability of each algorithm, two cities (Nanjing and Shenyang) with typical river black and odorous phenomena in southern and northern China are selected to verify the accuracy of the black and odorous water body identification algorithm. The urban built-up areas of the two cities are mainly selected. An urban administrative region that has been practically developed and constructed, and where municipal public facilities and public facilities are basically in place, which are characterized by forest of buildings, dense residence and dense factories.
Nanjing is located in the southwest of Jiangsu Province (latitude 31°14′–32°37′ N, longitude 118°22′–119°14′ E) at the downstream of the Yangtze River, with a total area of 6,587 km2. It is the capital of Jiangsu Province. The water area accounts for more than 11% of the total area. Among the rivers in Nanjing, the inner city rivers have serious black and odorous phenomena. In 2017, 109 black and odorous rivers were mainly remediated by the Nanjing Municipal Government, and 10 special treatment projects for black and odorous rivers were implemented by the Municipal Urban Construction Group. According to the data from the national urban black and odorous water body remediation and supervision platform, many internal rivers in Nanjing were marked as black and odorous water bodies around 2016. Among those rivers, the Friendship River, Honghua River, Mingyu River, the north section of Inner Qinhuai River, Qingjiang Donggou, and Bald Tail River were heavily black and odorous [10]. Due to the mature economic development, the drainage systems in the old city of Nanjing are mostly rainwater sewage confluence systems, with sewage directly discharged into the river along the outfall. The lag in the construction of the underground pipe network project and the sewage collection pipe network [24] has led to a serious problem of black and odorous inland rivers in the Nanjing urban area. The study area is shown in Figure 2.

The study area in Nanjing.
Shenyang is one of the 15 sub-provincial cities in China and the largest central city in northeast China. There are 26 large and small rivers in Shenyang, which belong to two major water systems, the Liao River and the Hun River. The total amount of water resources is 3.17 billion cubic meters, for more than 7 million people. Therefore, the urban water bodies in Shenyang have a strong impact on residents and economic development. However, the Liao River Basin is a serious pollution area in China. In the list released by the government, Shenyang has a total length of 89.5 km of black and odorous rivers, ranking in the top 10 among 295 prefecture-level cities. According to the data from the national urban black and odorous water body remediation and supervision platform, Shenyang also has several internal rivers marked as black and odorous. Among these rivers, Mantang River, Huishan open channel, Xinkai River, and Sanitary open channel are heavily black and odorous. Although Shenyang ranks first in northeast China in terms of sewage treatment capacity, a quarter of industrial and agricultural wastewater and domestic sewage are still discharged directly into nearby water bodies without treatment. The discharge of untreated sewage and wastewater exacerbates the frequent occurrence of black and odorous water bodies [25]. The study area in Shenyang is shown in Figure 3.
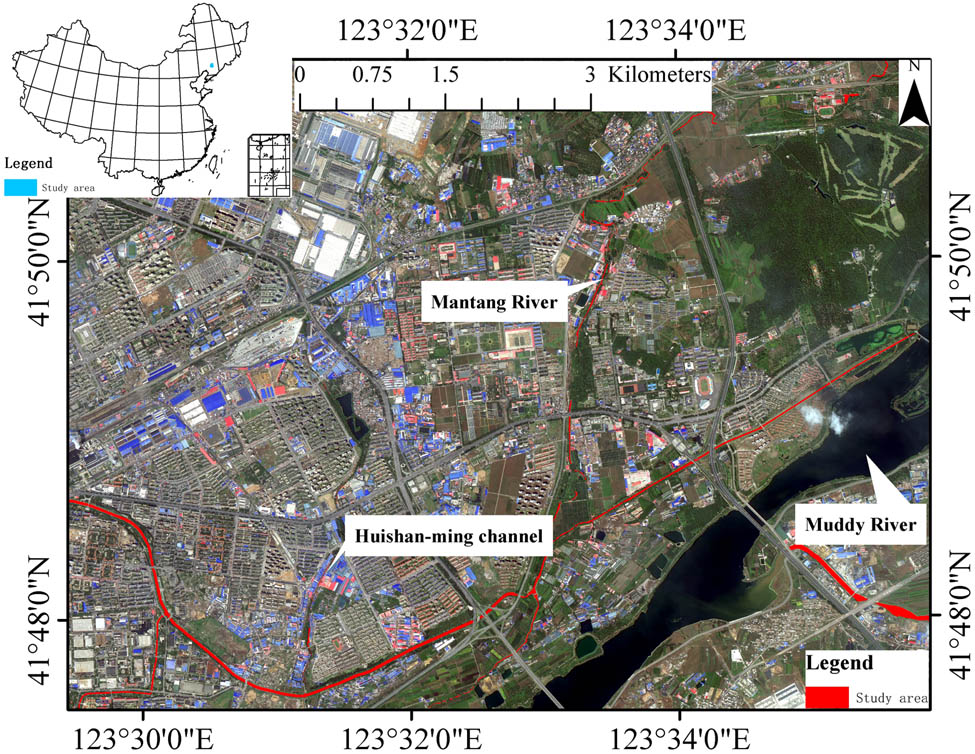
The study area in Shenyang.
2.2 Data and Pretreatment
In order to verify the applicability and accuracy of the existing black and odorous water body identification algorithm in southern and northern China, the Gaofen-2 data were used as the algorithm verification images. Based on the obtained data, it was found that typical black odorous phenomena occurred in Nanjing on November 3, 2016, and in Shenyang on June 12, 2016. Gaofen-2 data can be obtained from the website “http://www.gscloud.cn/home#page1/4.”
Gaofen-2 is the first civil optical high-resolution satellite with a spatial resolution better than 1 m in China. It is equipped with two panchromatic/multispectral. The total width of the left and right cameras is 45 km. The payload parameters of the Gaofen-2 satellite are shown in Table 1.
Payload parameters of the Gaofen-2 satellite
| Payload | Spectral segment number | Spectral segment range (μm) | Spatial resolution (m) | Breadth (km) | Lateral swing capacity |
|---|---|---|---|---|---|
| Panchromatic/multispectral camera | 1 | 0.45–0.90 | 1 | 45 (combination of two cameras) | ±35° |
| 2 | 0.45–0.52 | 4 | |||
| 3 | 0.52–0.59 | ||||
| 4 | 0.63–0.69 | ||||
| 5 | 0.77–0.89 |
In this study, the GF data were preprocessed by orthophoto correction, radiometric calibration, fast line-of-sight atmospheric analysis of spectral hypercubes atmospheric correction, and image fusion [26,27]. The normalized difference water index (NDWI) was used to extract the water body. The NDWI index model is shown in the following equation:
where R G is the reflectivity of the green light band; R INR is the reflectivity of the near-infrared band. The water body extracted by NDWI normalized water body index required manual intervention to eliminate the obvious mixed pixels on both sides of the river banks and to supplement the smaller rivers.
3 Principles and methods
3.1 Principles
The different components or concentrations of dissolved or suspended pollutants in black and odorous water bodies lead to different degrees of influence on the reflection, absorption, and refraction of sunlight. This influence makes the color of black and odorous water bodies different from that of normal water bodies [28,29,30]. Normal water bodies usually present light green or light yellow, while some black and odorous water bodies not only present the typical black color but also present gray, grayish-green, or dark green. Similarly, in the spectral dimension, there are differences between black and odorous water bodies and normal water bodies.
The visual reflectance of the black and odorous water body is low, and the trend of the spectral curve is relatively flat. In the range of 400–500 nm, the reflectance of the black and odorous water body increases slowly. Due to chlorophyll-a, the normal water body has a distinct fluorescence peak near 550 and 700 nm and an obvious absorption valley near 670 nm. However, the characteristics of algal pigment are insufficient due to the low dissolved oxygen content in the black and odorous water body. In the range of 500–700 nm, the fluorescence peaks and valleys of the reflectance of the black and odorous water body are not obvious, characterized by large peak width and low value [10,12]. This phenomenon can be used as a sign to distinguish black and odorous water from normal water. In the range of 750–900 nm, the spectral reflectance of black and odorous water is significantly higher than that of normal water [10,11,13]. The measured remote sensing reflectance spectra of the black and odorous water body and the normal water body are shown in Figure 4. From Figure 5, it can be seen that the spectral mean of Gaofen-2 data for the black and odorous water body is significantly smaller than that of the normal water body. In addition, the slope of the blue light to the green light band of the black and odorous water body is significantly smoother than that of the normal water body. Most of the black odor models are concentrated on the visible and near-infrared bands.
![Figure 4
Measured remote sensing reflectance spectra of the black and odorous water body and the normal water body [10,11].](/document/doi/10.1515/geo-2022-0412/asset/graphic/j_geo-2022-0412_fig_004.jpg)
![Figure 5
The spectral mean of Gaofen-2 data of the black and odorous water body and the normal water body [10,11].](/document/doi/10.1515/geo-2022-0412/asset/graphic/j_geo-2022-0412_fig_005.jpg)
3.2 Spectral recognition model
The difference between the spectra of the black and odorous water body and the normal water body is mainly reflected in the visible and near-infrared bands. In the blue–green band, the reflectance of black and odorous water body increases slowly and is significantly lower than that of other water bodies. In the green to red light band, the reflectance of the black and odorous water body changes more smoothly than that of the normal water body. In the red band and near-infrared band, the reflectance of the black and odorous water body is slightly higher than that of the normal water body. Based on the above optical characteristics, the algorithms of single-band, difference, ratio, and water quality parameter identification were selected for accuracy verification. The purpose was to find the best universal black and odorous water body identification model.
This study mainly consists of the existing algorithms of single-band, difference, ratio, and water quality parameter identification. The first three algorithms are established based on the difference in spectral information between the black and odorous water body and the normal water body in Gaofen data. The water quality parameter identification algorithm is established based on the correlation between the black and odorous water body and the concentration of water quality parameters.
3.2.1 Single-band threshold model
The single-band threshold model is established mainly based on the feature that the remote sensing reflectance of the urban black and odorous water body is lower than that of other water bodies, while the reflectance of the black and odorous water body near the green light band (550 nm) of Gaofen-2 data is significantly lower than that of the normal water body (Figure 5). Moreover, the measured reflectance spectrum information (Figure 4) is combined to set the threshold range for the identification of the black and odorous water body [10]. The algorithm is shown in the following equation:
where R G is the green band reflectance of Gaofen-2 data and T 1 and T 2 are constant thresholds.
3.2.2 Difference of black-odorous water index (DBWI)
The DBWI is established based on the feature that the reflectance spectrum of black and odorous water bodies has a slow increase from 480 to 550 nm, and the minimum value of the gentle peak appears near 550 nm (Figure 4). In combination with the blue–green band range of Gaofen-2 data, the urban black odorous water body shows the lowest spectral slope (Figure 5). The threshold setting method for the blue–green band difference can be applied to identify black and odorous water bodies [31]. The algorithm is shown as follows:
where R G and R B are the green and blue band reflectances of Gaofen-2 data, respectively; T 1 and T 2 are constant thresholds.
3.2.3 Normalized difference black-odorous water index (NDBWI)
The NDBWI is established based on the characteristic that the spectral curve of urban black-odorous water bodies has the flattest change and the lowest slope in the range of 550–700 nm. The Gaofen-2 image corresponds to the green and red bands of this spectral range with a central wavelength of 546 and 656 nm, respectively, reflecting the spectral characteristics of the urban black and odorous water body. At the same time, considering the high overall reflectance of the normal water body, the ratio of difference and sum of two bands are established to identify urban black and odorous water bodies [32]. The algorithm is expressed in equation (4). The normalized ratio model black and odorous water index (BOI) is improved according to the characteristic that the reflectance spectrum of black and odorous water changes more gently in the green and red band than that of normal water. Meanwhile, considering the reflectance characteristics of different kinds of black and odorous water bodies, the reflectance value of the blue light band is added to the denominator [11]. The algorithm is shown in equation (5):
where R G, R R, and R B are the reflectance of the green, red, and blue bands of the Gaofen-2 data, respectively; T 1, T 2, T 3, and T 4 are constant thresholds.
3.2.4 Black and odorous water body identification model group—heichou index (HCI)
The HCI (1–4) is used to find the bands with the strongest and the weakest reflectance between black and odorous water bodies and normal water bodies based on the band setting of Gaofen series satellites. Afterward, various linear combinations are performed according to the spectral characteristic law to further increase the discrimination index gap between black and odorous water bodies and normal water bodies. Moreover, the algorithms of difference and ratio are established [12]. The discriminant model group is shown in the following equation:
where R G, R R, R N, and R B are the reflectance in green, red, near-infrared, and blue bands of the Gaofen-2 data, respectively; T 1, T 2, T 3, T 4, T 5, T 6, T 7, and T 8 are constant thresholds.
3.2.5 Black and odorous water classification index (BOCI)
The BOCI is established based on the difference in reflectance spectra between heavy black and odorous water bodies, light black and odorous water bodies, and normal water bodies. The function of this index is to increase the gap between the three water bodies using the ratio of the baseline difference between green band reflectance and red band reflectance [33]. The algorithm is expressed in equation (7):
where R G, R R, and R B are the reflectance in green, red, and blue bands of the Gaofen-2 data, respectively; T 1 and T 2 are constant thresholds; λ R, λ G, and λ B are the central wavelengths of red, green, and blue light, respectively.
3.2.6 Water cleanliness index (WCI)
According to the GF series data, WCI shows that the reflectance of black odor water bodies rises slowly from blue light band to green light band, and the slope is smaller compared to that of non-black odorous water bodies. From green light band to red light band, the reflectivity of black and odorous water bodies decreases greatly and has a larger slope than that of non-black and odorous water bodies. It increased the spectral feature difference between black and odorous water bodies and non-black and odorous water bodies by using the spectral curve slope ratio of blue–green band and green–red band. Therefore, the slope ratio of three bands is used as the spectral water body index for remote sensing identification of black and odorous water bodies [34]. The algorithm is expressed in equation (9). However, to the slope of the black odorous water index (SBWI), the product of the spectral curve slope of blue–green band and green–red band is used to increase the spectral feature difference [31]. The algorithm is expressed in equation (10):
where R
G, R
R, and R
B are the reflectance of green, red, and blue bands of the Gaofen-2 data, respectively; T
1, T
2, T
3, and T
4 are constant thresholds; Δλ
BG and Δλ
GR are the difference between the central wavelengths of blue–green and green–red bands, respectively.
3.2.7 Water quality parameter identification method
The water quality parameter identification method generally shows that the severe eutrophication of the water body is an important cause of the black and odorous body. The decrease in transparency caused by the crazy growth of phytoplankton is an important index to calibrate the black and odorous water body. The trophic state index method is a comprehensive index combining chlorophyll, suspended solids concentration, transparency, and other water quality parameters to reflect the eutrophication degree of water bodies and determine the black and odorous degree of the water body [35]. The inversion models of chlorophyll-a concentration and transparency are as follows.
Chlorophyll-α concentration inversion model:
(11)where C chl-α represents the concentration of chlorophyll-α (mg/m3); b3 and b4 are the pixel brightness values of the third and fourth bands after atmospheric correction and radiation correction, respectively.
Inversion model of suspended solids concentration:
(12)where C TSS is the concentration of total suspended solids (mg/L); b2 and b3 are the pixel brightness values of the second and third bands after atmospheric correction and radiation correction, respectively.
Transparency inversion model:
(13)where Z sd is the transparency (cm).
Based on the inversion results of chlorophyll-α concentration and transparency, the nutritional state index model was established. The algorithm is shown in the following equation:
where I TLI(chl-a) and I TLI(sd) are trophic state indices based on chlorophyll-α concentration and transparency; T 1 and T 2 are constant thresholds.
3.3 Threshold determination
According to the established models, the functional relationships of the model described in Section 3.2 are still used in this part. The threshold is modified to adapt to the extraction of black and odorous water bodies in different regions. In this study, 21 black odor and 20 normal sampling points were used to extract the arithmetic results of the model. The black odor threshold was determined according to the distribution pattern of the arithmetic results of the black odor and normal point algorithms, which was illustrated by the Nanjing single-band model. Figure 6 shows the reflectance value distribution of single-band black odor and normal points in Nanjing as the basis for determining the threshold of the single-band model.

Single-band black and odorous threshold.
According to the value range distribution characteristics shown in Figure 6, the black and odorous point range fluctuates between 0.012 and 0.016, and the normal point range fluctuates greatly and is greater than 0.014. After statistics, the single-band values of Nanjing Gaofen-2 data water body range from 0.0029 to 0.0255, with only a few values less than 0.012. The black and odorous point range and the normal point range have a small overlap. In order to reduce the black and odorous water misclassification phenomenon, the single-band black and odorous threshold range of Nanjing is determined to be 0.012–0.014.
The thresholds for other models were determined according to this method. The specific models and threshold ranges are shown in Table 2.
Model and the threshold range
| Model | Threshold range | ||
|---|---|---|---|
| Nanjing | Shenyang | ||
| Single-band | G | 0.012–0.014 | 0.003–0.01 |
| Blue–green band | DBWI | −0.012 to −0.006 | −0.013 to 0.007 |
| Red–green band | NDBWI | 0.085–0.115 | 0–0.125 |
| BOI | 0.057–0.08 | ≤0.065 | |
| Discrimination model group | HCI1 | 0.032–0.05 | ≥0.05 |
| HCI2 | 0.046–0.06 | ≥0.07 | |
| HCI3 | 0.14–0.18 | 0.23–0.6 | |
| HCI4 | 0.2–0.22 | 0.275–0.53 | |
| Grading, cleaning, and slope index | BOCI | 0.12–0.14 | 0.05–1 |
| WCI | 5.5–10 | 0.2–1 | |
| SBWI | 0.0004–0.0007 | 0.0001–0.0005 | |
| Water quality parameter identification method | 0.19–0.28 | ≥0.28 | |
4 Results and discussion
In order to verify the applicability of the model, the Gaofen-2 data are preprocessed to extract the urban water body areas in Shenyang and Nanjing, and the black and odorous water body identification algorithm is used to identify the black and odorous water body areas. Moreover, to obtain the identification and extraction accuracy of each algorithm, the spatial consistency and confusion matrix are used to verify the identification accuracy of each model.
4.1 Result analysis
Based on the data of Gaofen-2, the identification and extraction of black and odorous water bodies in urban built-up areas of Nanjing and Shenyang are studied. Single-band, difference, ratio, and water quality parameter identification models are employed in this study. The identification results are shown in Figures 7 and 8.

Extraction results and sampling location of black and odorous waters in Nanjing (big map: NDBWI extraction result and sampling location; small maps: All models extraction results, which show the difference between the extracted results).

Extraction results and sampling location of black and odorous waters in Shenyang (big map: NDBWI extraction result and sampling location; small maps: all models' extraction results, which show the difference between the extracted results).
Based on the field investigation of the black and odorous water bodies in the built-up area of Nanjing (Figure 2) and the extraction results of each model (Figure 7), the extraction results of the water body index, SBWI, WCI, BOCI, and HCI 1–4 models have obvious misclassification and significant errors in large clean waters of the Yangtze River and Xuanwu Lake. The extraction results of the BOI, DBWI, G, and NDBWI models are consistent in location distribution, and the extraction results are good.
Based on the field investigation of the black and odorous water bodies in the built-up area of Shenyang (Figure 3) and the extraction results of each model (Figure 8), the extraction results of the water body index, SBWI, WCI, BOCI, HCI 1–4, BOI, and G models have obvious misclassification and significant errors in the large clean waters of the Muddy River. The extraction results of DBWI and NDBWI models are relatively consistent in the location distribution of the Huishan-ming channel, Mantang River, and two typical black and odorous rivers. The extraction results are relatively good.
4.2 Accuracy evaluation
In this study, 52 independent measurement sites in Nanjing and 48 independent measurement sites in Shenyang are used to evaluate the accuracy of each model, as shown in Figures 7 and 8. The evaluation process is based on the confusion matrix [36], as shown in Table 3. The evaluation parameters mainly include Kappa coefficient (K value), overall accuracy rate, black and odorous water body misclassification rate, black and odorous water missed rate, normal water misclassification rate, and normal water missed rate. The identification accuracies of Nanjing and Shenyang are shown in Tables 4 and 5, respectively.
Black odor water division confusion matrix
| Distinguish | Actual | |
|---|---|---|
| Normal water body | Black and odorous water body | |
| Normal water body | a | B |
| Black and odorous water body | c | D |
Note: letters represent the number of identified water types corresponding to the actual water types.
Identification accuracy of each model in Nanjing
| Model | K-value | Overall accuracy rate (%) | Black and odorous | Normal | ||
|---|---|---|---|---|---|---|
| Misclassification rate (%) | Missed rate (%) | Misclassification rate (%) | Missed rate (%) | |||
| G | 0.20 | 71.74 | 60.00 | 63.64 | 19.44 | 17.14 |
| DBWI | 0.17 | 65.64 | 72.25 | 75.32 | 29.81 | 26.59 |
| NDBWI | 0.68 | 82.19 | 20.31 | 18.65 | 15.22 | 14.72 |
| BOI | 0.53 | 75.69 | 24.36 | 34.56 | 17.45 | 14.20 |
| HCI1 | 0.31 | 71.24 | 64.25 | 54.19 | 35.18 | 17.26 |
| HCI2 | −0.35 | 40.18 | 83.12 | 70.23 | 46.23 | 30.12 |
| HCI3 | −0.02 | 56.35 | 42.38 | 57.16 | 28.39 | 34.20 |
| HCI4 | −0.36 | 33.28 | 83.24 | 70.25 | 48.19 | 28.26 |
| BOCI | −0.05 | 63.04 | 80.00 | 81.82 | 32.14 | 22.86 |
| WCI | −0.01 | 56.52 | 85.71 | 90.91 | 27.03 | 18.18 |
| SBWI | 0.19 | 54.35 | 66.67 | 27.27 | 15.00 | 48.48 |
| Water quality parameters | 0.21 | 70.24 | 56.26 | 64.38 | 21.43 | 16.21 |
Identification accuracy of each model in Shenyang
| Model | K-value | Overall accuracy rate (%) | Black and odorous | Normal | ||
|---|---|---|---|---|---|---|
| Misclassification rate (%) | Missed rate (%) | Misclassification rate (%) | Missed rate (%) | |||
| G | 0.56 | 80.77 | 25.00 | 33.33 | 16.67 | 11.76 |
| DBWI | 0.37 | 78.26 | 23.51 | 58.24 | 20.57 | 4.59 |
| NDBWI | 0.73 | 86.33 | 18.25 | 16.43 | 13.28 | 10.52 |
| BOI | 0.23 | 70.89 | 55.87 | 62.15 | 20.13 | 15.46 |
| HCI1 | −0.04 | 65.73 | 70.26 | 74.29 | 28.67 | 20.43 |
| HCI2 | −0.07 | 64.03 | 78.19 | 68.68 | 31.86 | 17.29 |
| HCI3 | −0.01 | 60.28 | 81.53 | 79.36 | 31.26 | 24.10 |
| HCI4 | −0.05 | 61.59 | 69.28 | 79.34 | 30.27 | 16.25 |
| BOCI | 0.29 | 69.23 | 42.86 | 55.56 | 26.32 | 17.65 |
| WCI | −0.32 | 30.77 | 80.00 | 66.67 | 54.54 | 29.41 |
| SBWI | 0.32 | 73.08 | 25.00 | 66.67 | 27.27 | 5.89 |
| Water quality parameters | 0.18 | 67.29 | 70.53 | 71.06 | 28.19 | 17.26 |
The overall accuracy rate refers to the ratio of all correctly classified samples to the total number of samples
where A is the sum result of all categories, which is the product of the total number of real pixels in A category and the total number of classified pixels in the category; B is the sum of the elements of the whole confusion matrix; C is the sum of the diagonal elements.
K-value and consistency
| K-value | Consistency |
|---|---|
| <0.00 | Very bad |
| 0.00–0.20 | Bad |
| 0.20–0.40 | General |
| 0.40–0.60 | Good |
| 0.60–0.80 | Very good |
| 0.80–1.00 | Excellent |
According to the evaluation results of the models in Tables 4–6, five models in Nanjing and Shenyang have an overall accuracy rate of over 70%, but only two models have a good consistency status. In Nanjing, the two models with an overall accuracy of over 70% and good consistency are NDBWI and BOI. In Shenyang, the two models with an overall identification rate of over 70% and good consistency are G and NDBWI. The results indicate that NDBWI has high accuracy in identifying and extracting black and odorous water bodies in northern and southern China and is suitable for operational promotion and application. By analyzing the basis of spectral characteristics established by this model, it can be found that the NDBWI model has high accuracy and makes full use of the difference in the slope of blue and green bands between black and odorous water bodies and normal water bodies. The spectral characteristics of black and odorous water bodies or normal water bodies are fully considered in this model. Although the identification accuracy of the BOI model and G model is high in the south and north, respectively, the identification accuracy in another corresponding city is low, and the adaptability between the south and the north is poor, which is not suitable for promotion and application. The accuracy of other models in the north and south is low, and the consistency is weak, which is not suitable for promotion and application. Based on the spatial distribution results of black and odorous water in Section 4.1, it can be confirmed that the NDBWI model has good spatial consistency in extracting black and odorous water bodies in northern and southern cities of China with the highest extraction accuracy, making it suitable for operational promotion and application.
4.3 Analysis of spatial distribution and image interpretation characteristics
Based on the inversion results of the algorithm, the extraction results of the NDBWI model with high applicability were used as the spatial distribution analysis data of black and odorous water bodies. The analysis shows that the spatial distribution of black and odorous water bodies in the built-up areas of Nanjing and Shenyang is consistent, and most of the black and odorous water bodies in both places are distributed in narrow areas with poor water flow.

Color contrast of the water body (blue box: normal water body and red box: black and odorous water body).

Wastewater discharge triangle of factories and residential areas.

Sewage discharge from abandoned factories.
After extracting the black and odorous river sections, the remote sensing interpretation and analysis of surrounding environmental factors are performed. The results are as follows.
The water body is black and gray
According to the spatial distribution of black and odorous water in Nanjing and Shenyang identified by the algorithm, the black and gray color of black and odorous water can be clearly seen in the high-resolution images. In Figure 9, the color of the black and odorous water (red box) is clearly different from that of the clean water (blue box). The black and odorous water is black and gray, while the clean water is dark blue. The color of the water is a prominent symbol for the identification of black and odorous water bodies.
Riparian industrial, residential, and abandoned industrial sewage discharge areas
Some factories and residential areas are located around the black and odorous river, creating a sewage discharge triangle (Figure 10). Such sewage can flow into rivers, making the water muddy, black, and odorous. There are also abandoned factories (Figure 11) that discharge large amounts of sewage into rivers during reconstruction or dismantling, resulting in abnormal water color and a pungent odor.
Retention of river water in barrage dam
At the end of the black and odorous river, there is usually a retaining dam (Figure 12a) that restricts water flow. Due to the lack of hydrodynamic force, the retaining dam reduces the outflow of pollutants and the self-purification capacity of the water body. As a result, it is unable to form an unimpeded ecological circulation system, and a large number of duckweed deaths (Figure 12b) cause the water bodies black and odorous.
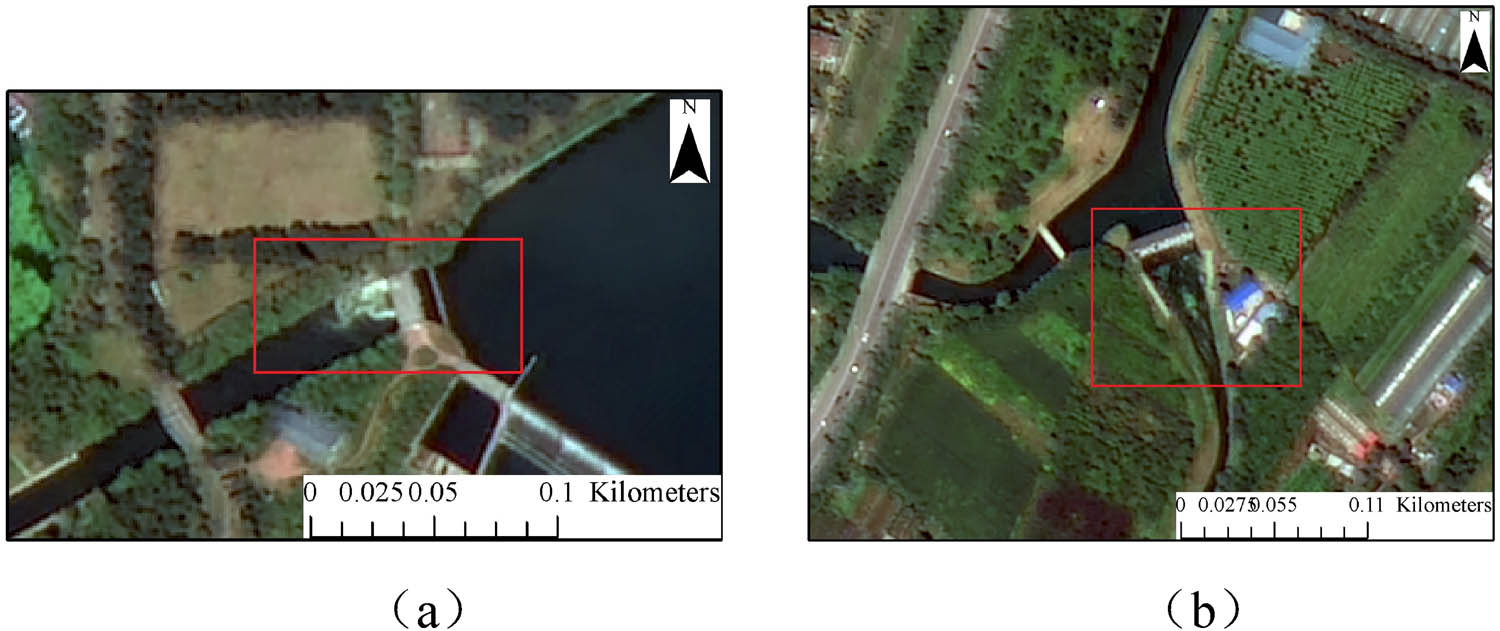
Barrage dam and secondary environment.
5 Conclusion
Based on Gaofen-2 data, cities in southern and northern China were selected to verify the accuracy of the black and odorous identification model. The single-band, difference, ratio, and water quality parameter models are verified. In addition, regional consistency and a confusion matrix are used to verify the accuracy of each model. It is concluded that the identification accuracy of the NDBWI model can reach 82.19 and 86.33% in northern and southern Chinese cities, respectively. The K-value can reach 0.68 and 0.73 in northern and southern Chinese cities, respectively. The model has good consistency and is suitable for operational promotion and application. According to NDBWI model identification results and high-resolution data image characteristics, the main symbols for remote sensing identification of black and odorous water bodies are color, sewage discharge zone, and retaining dam. However, the model described in this work is based on data with Gaofen-2 similar band settings, and there is a limitation in the application of data without similar band settings. And only Nanjing and Shenyang were selected for model verification, which lacked regional universality. In the future, we will find more cities and images for further research, and the algorithms will be optimized to increase the universality of other band-setting data and improve its operational processing ability for wide promotion and application.
Acknowledgments
Thanks to the China Natural Resources Aero-geophysical Remote Sensing Center for the data provided.
-
Funding information: This research was funded by Projects supported by scientific research and Innovation Fund of Tianjin Research Institute for Water Transport Engineering, Ministry of Transport, grant number TKS180401, Study on identification and traceability mechanism of black and odorous water in rural areas of Northeast China based on Hyperspectral, grant number 4217011915, North China University of Science and Technology, provincial universities basic research funds, grant number JQN2022006.
-
Conflict of interest: Authors state no conflict of interest.
References
[1] Xu W, Gang WY, Hong SC, Tao P. Formation mechanism and assessment method for urban black and odorous water body: A review – in Chinese with English summary. Chin J Appl Ecol. 2016;27(4):1331–40.Search in Google Scholar
[2] Knop E. Design studies for the Emscher mouth treatment plant. J Water Pollut Control Federation. 1966;38:1194–207.Search in Google Scholar
[3] Li XL, Cheng ZP, Cun YH. Analysis on black color and odor of Weigong River in Shenyang – in Chinese with English summary. Environ Prot Sci. 2003;29:27–8.10.1360/03tb9005Search in Google Scholar
[4] Yan WX, Xuan DS, Chao SW, Wei LH, Hui ZY, Na RW, et al. A collaborative effect of algae-bacteria symbiotic and biological activated carbon system on black odorous water pretreated by UV photolysis. Biochem Eng J. 2021;169:107983.10.1016/j.bej.2021.107983Search in Google Scholar
[5] Nan R, Zhou LW, Yu ZC, Shu WY, Liang ZJ, Qiang ZW, et al. In situ high-resolution measurement of phosphorus, iron and sulfur by diffusive gradients in thin films in sediments of black-odorous rivers in the Pearl River Delta region, South China. Environ Res. 2020;189:109918.10.1016/j.envres.2020.109918Search in Google Scholar PubMed
[6] Jun ELY, Chen LX, Hong HC, Hong ZY, Quan LQ, Wang S, et al. Legacy and alternative plasticizers in surface sediment of black-odorous urban rivers across China: Occurrence, spatial distribution, and ecological risk assessment. Chemosphere. 2021;1:131206.10.1016/j.chemosphere.2021.131206Search in Google Scholar
[7] Quan Z, Qiang YY, Rong CF, Ling ZL, Jun RJ, Jun WS, et al. Effects of hydraulic loading rate and substrate on ammonium removal in tidal flow constructed wetlands treating black and odorous water bodies. Bioresour Technol. 2021;321:124468.10.1016/j.biortech.2020.124468Search in Google Scholar PubMed
[8] Tao DH, Hua MR, Arthur LS, Shi SQ, Bin YH, Chao ZY. Optical characterization of black water blooms in eutrophic waters. Sci Total Environ. 2014;482–483:174–83.10.1016/j.scitotenv.2014.02.113Search in Google Scholar PubMed
[9] Lei DX, Mei LY, Heng L, Li Z, Shuang W, Hua LS. Analysis of absorption characteristics of urban black-odor water – in Chinese with English summary. Environ Sci. 2018;39:129–39.Search in Google Scholar
[10] Shuang W, Qiao W, Mei LY, Li Z, Heng L, Hua LS, et al. Remote sensing identification of urban black-odor water bodies based on high-resolution images: a case study in Nanjing – in Chinese with English summary. Environ Sci. 2018;39:57–67.Search in Google Scholar
[11] Yue Y, Qian S, Li Z, Jie GH, Ye CH, Hui H, et al. Remote sensing identification of urban black-odor water bodies in Shenyang city based on GF-2 image – in Chinese with English summary. J Remote Sens. 2019;23:230–42.Search in Google Scholar
[12] Gang J. Research and application on black and odorous water body by remote sensing – in Chinese with English summary. Master’s degree thesis. Lanzhou: Lanzhou Jiaotong University; 2017.Search in Google Scholar
[13] Ye CH. Study on analysis of optical properties and remote sensing identifiable models of black and malodorous water in typical cities in China – in Chinese with English summary. Master’s degree thesis. Cheng Du: Southwest Jiaotong University; 2017.Search in Google Scholar
[14] Hong WS. Research progress of remote sensing monitoring key technologies for urban black and odorous water bodies – in Chinese with English summary. Chin J Environ Eng. 2019;13:1261–71.Search in Google Scholar
[15] Yu ZE, Jin HQ, Xia GC. Surface temperature retrieval from Gaofen-5 observation and its validation. IEEE Access. 2021;9:9403–10.10.1109/ACCESS.2020.3047951Search in Google Scholar
[16] Xuan SM, Jun YL, Ping Z, Qiang SQ, Xin J, Feng SD, et al. Coastal water bathymetry for critical zone management using regression tree models from Gaofen-6 imagery. Ocean Coast Manag. 2021;204:1–11.10.1016/j.ocecoaman.2021.105522Search in Google Scholar
[17] Masouleh MK, Hosseini RS. A deep learning method for near-real-time cloud and cloud shadow segmentation from Gaofen-1 images. Comput Intell Neurosci. 2020;2020:1–13.10.1155/2020/8811630Search in Google Scholar
[18] Tao C, Xun HN, Qing NR, Na Z, Antonio P. Object-oriented open-pit mine mapping using Gaofen-2 satellite image and convolutional neural network, for the Yuzhou City, China. Remote Sens. 2020;12:1–20.10.1109/TGRS.2020.2990920Search in Google Scholar
[19] Rui SJ, Qian S, Yue Y, Sheng LJ, Fu C, Ru W, et al. Estimation of chlorophyll-a concentrations in small water bodies: comparison of fused Gaofen-6 and Sentinel-2 sensors. Remote Sens. 2022;14:1–22.10.3390/rs14010229Search in Google Scholar
[20] SarigaiYang, J, Alicia Z, Sheng HL, Yong L, Chun XY. Monitoring urban black-odorous water by using hyperspectral data and machine learning. Environ Pollut. 2021;269:116166.10.1016/j.envpol.2020.116166Search in Google Scholar PubMed
[21] Lei Z, Bing Z, Sheng LJ, Qian S, Lin WG. A study on retrieval algorithm of black water aggregation in Taihu lake based on HJ-1 satellite images. IOP Conf Ser Earth Environ Sci. 2014;17:012100.10.1088/1755-1315/17/1/012100Search in Google Scholar
[22] Tiit K, Birgot P, Charles V, Martin L, Tuuli S, Kaire T, et al. Remote sensing of black lakes and using 810 nm reflectance peak for retrieving water quality parameters of optically complex waters. Remote Sens. 2016;8:1–15.10.3390/rs8060497Search in Google Scholar
[23] Qian S, Yue Y, Sheng LJ, Fang ZF, Lei WS, Hong WY, et al. A CIE color purity algorithm to detect black and odorous water in urban rivers using high-resolution multispectral remote sensing images. IEEE Trans Geosci Remote Sens. 2019;57:6577–90.10.1109/TGRS.2019.2907283Search in Google Scholar
[24] Chun Z, Yuan HX, Lin ZH, Jun X, Yang LH, Sheng WY. Analysis on the current situation and Regulation Countermeasures of black and odorous water bodies in Xuanwu District of Nanjing – in Chinese with English summary. Hydro Sci Cold Zone Eng. 2018;1:47–9.Search in Google Scholar
[25] Jie LX. Pollutant characteristics and remote sensing identification of typical black and odorous water bodies in Shenyang – in Chinese with English summary. Master’s degree thesis. Xian: Chang’ An University; 2018.Search in Google Scholar
[26] Xiao MF, Bo CS, Liang ZG. Image fusion quality assessment of GF-2 satellite based on full reference – in Chinese with English summary. Spacecr Recov Remote Sens. 2016;37:85–94.Search in Google Scholar
[27] Pei CY, Min SK, Ting B, Jun PY. Quality assessment on image fusion methods for GF-2 data – in Chinese with English summary. Survey Mapp. 2017;42:35–40.Search in Google Scholar
[28] Jun C, Ping X, Mei MZ, Yuan N, Min T, Wei DX, et al. A systematic study on spatial and seasonal patterns of eight taste and odor compounds with relation to various biotic and abiotic parameters in Gonghu Bay of Lake Taihu, China. Sci Total Environ. 2010;409:314–25.10.1016/j.scitotenv.2010.10.010Search in Google Scholar PubMed
[29] Xin L, Yan FZ, Ge SJ, Xin FC, Cai DJ. Black water bloom induced by different types of organic matters and forming mechanisms of major odorous compounds – in Chinese with English summary. Environ Sci. 2012;33:3152–9.Search in Google Scholar
[30] Parinet J, Rodriguez MJ, Serodes J. Influence of water quality on the presence of off-flavour compounds (geosmin and 2-methylisoborneol). Water Res. 2010;44:5847–56.10.1016/j.watres.2010.06.070Search in Google Scholar PubMed
[31] Shuang W. Remote sensing recognition of urban black and odorous water bodies based on GF-2 images – a case study in Nanjing – in Chinese with English summary. Master’s degree thesis. Nanjing: Nanjing Normal University; 2018.Search in Google Scholar
[32] Wen JY, Ning Z, Yan ZY, Juan HR, Zhe Z. Research on remote sensing monitoring of urban black and odorous water – in Chinese with English summary. Bull Survey Mapp. 2019;S1:98–104.Search in Google Scholar
[33] Ke QK, Qian S, Jun LX, Guo LJ, Yue Y, Chong Y. Remote sensing classification and recognition of black and odorous water in Shenyang based on GF-2 image – in Chinese with English summary). Remote Sens Technol Application. 2020;35:424–34.Search in Google Scholar
[34] Qi LJ, Guo LJ, Li Z, Qian S, Yang DH, Fang ZY. Remote sensing identification and validation of urban black and odorous water in Taiyuan city – in Chinese with English summary. J Remote Sens. 2019;23:773–84.Search in Google Scholar
[35] Xia JH, Jian P. Urban black-odor water body remote sensing monitoring based on GF-2 satellite data fusion – in Chinese with English summary. Sci Technol Manag Resour. 2017;34:107–17.Search in Google Scholar
[36] Ling LL, Mei LY, Heng L, Jie X, Qian YZ, Shun B, et al. Remote sensing classification of urban black-odor water based on decision tree-in Chinese with English summary). Environ Sci. 2020;41:5060–72.Search in Google Scholar
© 2022 Yang Ying et al., published by De Gruyter
This work is licensed under the Creative Commons Attribution 4.0 International License.
Articles in the same Issue
- Regular Articles
- Study on observation system of seismic forward prospecting in tunnel: A case on tailrace tunnel of Wudongde hydropower station
- The behaviour of stress variation in sandy soil
- Research on the current situation of rural tourism in southern Fujian in China after the COVID-19 epidemic
- Late Triassic–Early Jurassic paleogeomorphic characteristics and hydrocarbon potential of the Ordos Basin, China, a case of study of the Jiyuan area
- Application of X-ray fluorescence mapping in turbiditic sandstones, Huai Bo Khong Formation of Nam Pat Group, Thailand
- Fractal expression of soil particle-size distribution at the basin scale
- Study on the changes in vegetation structural coverage and its response mechanism to hydrology
- Spatial distribution analysis of seismic activity based on GMI, LMI, and LISA in China
- Rock mass structural surface trace extraction based on transfer learning
- Hydrochemical characteristics and D–O–Sr isotopes of groundwater and surface water in the northern Longzi county of southern Tibet (southwestern China)
- Insights into origins of the natural gas in the Lower Paleozoic of Ordos basin, China
- Research on comprehensive benefits and reasonable selection of marine resources development types
- Embedded deformation of the rubble-mound foundation of gravity-type quay walls and influence factors
- Activation of Ad Damm shear zone, western Saudi Arabian margin, and its relation to the Red Sea rift system
- A mathematical conjecture associates Martian TARs with sand ripples
- Study on spatio-temporal characteristics of earthquakes in southwest China based on z-value
- Sedimentary facies characterization of forced regression in the Pearl River Mouth basin
- High-precision remote sensing mapping of aeolian sand landforms based on deep learning algorithms
- Experimental study on reservoir characteristics and oil-bearing properties of Chang 7 lacustrine oil shale in Yan’an area, China
- Estimating the volume of the 1978 Rissa quick clay landslide in Central Norway using historical aerial imagery
- Spatial accessibility between commercial and ecological spaces: A case study in Beijing, China
- Curve number estimation using rainfall and runoff data from five catchments in Sudan
- Urban green service equity in Xiamen based on network analysis and concentration degree of resources
- Spatio-temporal analysis of East Asian seismic zones based on multifractal theory
- Delineation of structural lineaments of Southeast Nigeria using high resolution aeromagnetic data
- 3D marine controlled-source electromagnetic modeling using an edge-based finite element method with a block Krylov iterative solver
- A comprehensive evaluation method for topographic correction model of remote sensing image based on entropy weight method
- Quantitative discrimination of the influences of climate change and human activity on rocky desertification based on a novel feature space model
- Assessment of climatic conditions for tourism in Xinjiang, China
- Attractiveness index of national marine parks: A study on national marine parks in coastal areas of East China Sea
- Effect of brackish water irrigation on the movement of water and salt in salinized soil
- Mapping paddy rice and rice phenology with Sentinel-1 SAR time series using a unified dynamic programming framework
- Analyzing the characteristics of land use distribution in typical village transects at Chinese Loess Plateau based on topographical factors
- Management status and policy direction of submerged marine debris for improvement of port environment in Korea
- Influence of Three Gorges Dam on earthquakes based on GRACE gravity field
- Comparative study of estimating the Curie point depth and heat flow using potential magnetic data
- The spatial prediction and optimization of production-living-ecological space based on Markov–PLUS model: A case study of Yunnan Province
- Major, trace and platinum-group element geochemistry of harzburgites and chromitites from Fuchuan, China, and its geological significance
- Vertical distribution of STN and STP in watershed of loess hilly region
- Hyperspectral denoising based on the principal component low-rank tensor decomposition
- Evaluation of fractures using conventional and FMI logs, and 3D seismic interpretation in continental tight sandstone reservoir
- U–Pb zircon dating of the Paleoproterozoic khondalite series in the northeastern Helanshan region and its geological significance
- Quantitatively determine the dominant driving factors of the spatial-temporal changes of vegetation-impacts of global change and human activity
- Can cultural tourism resources become a development feature helping rural areas to revitalize the local economy under the epidemic? An exploration of the perspective of attractiveness, satisfaction, and willingness by the revisit of Hakka cultural tourism
- A 3D empirical model of standard compaction curve for Thailand shales: Porosity in function of burial depth and geological time
- Attribution identification of terrestrial ecosystem evolution in the Yellow River Basin
- An intelligent approach for reservoir quality evaluation in tight sandstone reservoir using gradient boosting decision tree algorithm
- Detection of sub-surface fractures based on filtering, modeling, and interpreting aeromagnetic data in the Deng Deng – Garga Sarali area, Eastern Cameroon
- Influence of heterogeneity on fluid property variations in carbonate reservoirs with multistage hydrocarbon accumulation: A case study of the Khasib formation, Cretaceous, AB oilfield, southern Iraq
- Designing teaching materials with disaster maps and evaluating its effectiveness for primary students
- Assessment of the bender element sensors to measure seismic wave velocity of soils in the physical model
- Appropriated protection time and region for Qinghai–Tibet Plateau grassland
- Identification of high-temperature targets in remote sensing based on correspondence analysis
- Influence of differential diagenesis on pore evolution of the sandy conglomerate reservoir in different structural units: A case study of the Upper Permian Wutonggou Formation in eastern Junggar Basin, NW China
- Planting in ecologically solidified soil and its use
- National and regional-scale landslide indicators and indexes: Applications in Italy
- Occurrence of yttrium in the Zhijin phosphorus deposit in Guizhou Province, China
- The response of Chudao’s beach to typhoon “Lekima” (No. 1909)
- Soil wind erosion resistance analysis for soft rock and sand compound soil: A case study for the Mu Us Sandy Land, China
- Investigation into the pore structures and CH4 adsorption capacities of clay minerals in coal reservoirs in the Yangquan Mining District, North China
- Overview of eco-environmental impact of Xiaolangdi Water Conservancy Hub on the Yellow River
- Response of extreme precipitation to climatic warming in the Weihe river basin, China and its mechanism
- Analysis of land use change on urban landscape patterns in Northwest China: A case study of Xi’an city
- Optimization of interpolation parameters based on statistical experiment
- Late Cretaceous adakitic intrusive rocks in the Laimailang area, Gangdese batholith: Implications for the Neo-Tethyan Ocean subduction
- Tectonic evolution of the Eocene–Oligocene Lushi Basin in the eastern Qinling belt, Central China: Insights from paleomagnetic constraints
- Geographic and cartographic inconsistency factors among different cropland classification datasets: A field validation case in Cambodia
- Distribution of large- and medium-scale loess landslides induced by the Haiyuan Earthquake in 1920 based on field investigation and interpretation of satellite images
- Numerical simulation of impact and entrainment behaviors of debris flow by using SPH–DEM–FEM coupling method
- Study on the evaluation method and application of logging irreducible water saturation in tight sandstone reservoirs
- Geochemical characteristics and genesis of natural gas in the Upper Triassic Xujiahe Formation in the Sichuan Basin
- Wehrlite xenoliths and petrogenetic implications, Hosséré Do Guessa volcano, Adamawa plateau, Cameroon
- Changes in landscape pattern and ecological service value as land use evolves in the Manas River Basin
- Spatial structure-preserving and conflict-avoiding methods for point settlement selection
- Fission characteristics of heavy metal intrusion into rocks based on hydrolysis
- Sequence stratigraphic filling model of the Cretaceous in the western Tabei Uplift, Tarim Basin, NW China
- Fractal analysis of structural characteristics and prospecting of the Luanchuan polymetallic mining district, China
- Spatial and temporal variations of vegetation coverage and their driving factors following gully control and land consolidation in Loess Plateau, China
- Assessing the tourist potential of cultural–historical spatial units of Serbia using comparative application of AHP and mathematical method
- Urban black and odorous water body mapping from Gaofen-2 images
- Geochronology and geochemistry of Early Cretaceous granitic plutons in northern Great Xing’an Range, NE China, and implications for geodynamic setting
- Spatial planning concept for flood prevention in the Kedurus River watershed
- Geophysical exploration and geological appraisal of the Siah Diq porphyry Cu–Au prospect: A recent discovery in the Chagai volcano magmatic arc, SW Pakistan
- Possibility of using the DInSAR method in the development of vertical crustal movements with Sentinel-1 data
- Using modified inverse distance weight and principal component analysis for spatial interpolation of foundation settlement based on geodetic observations
- Geochemical properties and heavy metal contents of carbonaceous rocks in the Pliocene siliciclastic rock sequence from southeastern Denizli-Turkey
- Study on water regime assessment and prediction of stream flow based on an improved RVA
- A new method to explore the abnormal space of urban hidden dangers under epidemic outbreak and its prevention and control: A case study of Jinan City
- Milankovitch cycles and the astronomical time scale of the Zhujiang Formation in the Baiyun Sag, Pearl River Mouth Basin, China
- Shear strength and meso-pore characteristic of saturated compacted loess
- Key point extraction method for spatial objects in high-resolution remote sensing images based on multi-hot cross-entropy loss
- Identifying driving factors of the runoff coefficient based on the geographic detector model in the upper reaches of Huaihe River Basin
- Study on rainfall early warning model for Xiangmi Lake slope based on unsaturated soil mechanics
- Extraction of mineralized indicator minerals using ensemble learning model optimized by SSA based on hyperspectral image
- Lithofacies discrimination using seismic anisotropic attributes from logging data in Muglad Basin, South Sudan
- Three-dimensional modeling of loose layers based on stratum development law
- Occurrence, sources, and potential risk of polycyclic aromatic hydrocarbons in southern Xinjiang, China
- Attribution analysis of different driving forces on vegetation and streamflow variation in the Jialing River Basin, China
- Slope characteristics of urban construction land and its correlation with ground slope in China
- Limitations of the Yang’s breaking wave force formula and its improvement under a wider range of breaker conditions
- The spatial-temporal pattern evolution and influencing factors of county-scale tourism efficiency in Xinjiang, China
- Evaluation and analysis of observed soil temperature data over Northwest China
- Agriculture and aquaculture land-use change prediction in five central coastal provinces of Vietnam using ANN, SVR, and SARIMA models
- Leaf color attributes of urban colored-leaf plants
- Application of statistical and machine learning techniques for landslide susceptibility mapping in the Himalayan road corridors
- Sediment provenance in the Northern South China Sea since the Late Miocene
- Drones applications for smart cities: Monitoring palm trees and street lights
- Double rupture event in the Tianshan Mountains: A case study of the 2021 Mw 5.3 Baicheng earthquake, NW China
- Review Article
- Mobile phone indoor scene features recognition localization method based on semantic constraint of building map location anchor
- Technical Note
- Experimental analysis on creep mechanics of unsaturated soil based on empirical model
- Rapid Communications
- A protocol for canopy cover monitoring on forest restoration projects using low-cost drones
- Landscape tree species recognition using RedEdge-MX: Suitability analysis of two different texture extraction forms under MLC and RF supervision
- Special Issue: Geoethics 2022 - Part I
- Geomorphological and hydrological heritage of Mt. Stara Planina in SE Serbia: From river protection initiative to potential geotouristic destination
- Geotourism and geoethics as support for rural development in the Knjaževac municipality, Serbia
- Modeling spa destination choice for leveraging hydrogeothermal potentials in Serbia