Comparison between electrical resistivity tomography and tunnel seismic prediction 303 methods for detecting the water zone ahead of the tunnel face: A case study
-
Nima Dastanboo
 ,
Xiao-Qing Li
und
Hamed Gharibdoost
,
Xiao-Qing Li
und
Hamed Gharibdoost

Abstract
In deep tunnels with hydro-geological conditions, it is paramount to investigate the geological structure of the region before excavating a tunnel; otherwise, unanticipated accidents may cause serious damage and delay the project. The purpose of this study is to investigate the geological properties ahead of a tunnel face using electrical resistivity tomography (ERT) and tunnel seismic prediction (TSP) methods. During construction of the Nosoud Tunnel located in western Iran, ERT and TSP 303 methods were employed to predict geological conditions ahead of the tunnel face. In this article, the results of applying these methods are discussed. In this case, we have compared the results of the ERT method with those of the TSP 303 method. This work utilizes seismic methods and electrical tomography as two geophysical techniques are able to detect rock properties ahead of a tunnel face. This study shows that although the results of these two methods are in good agreement with each other, the results of TSP 303 are more accurate and higher quality. Also, we believe that using another geophysical method, in addition to TSP 303, could be helpful in making decisions in support of excavation, especially in complicated geological conditions.
1 Introduction
During excavation, prediction of geological features ahead of a tunnel face, such as a fault or fracture zone as well as potential water sources, is very important. Both destructive methods and nondestructive methods can be used for this purpose [1]. Destructive methods such as percussion drilling and core drilling methods, because of the direct access to rock samples, can be used to calculate geotechnical properties of rock with high accuracy; however, these methods can be expensive and time consuming [2]. On the other hand, there are nondestructive methods with good speed-up prediction that are more economical. Because they do not access the rock wall directly, the accuracy is generally lower than that for destructive methods. To achieve a good prediction, the first step is to drill a few boreholes in advance of the tunnel and then apply a nondestructive method to increase the accuracy of exploration points [3]. In addition, nowadays, the quality of logging evaluation data can be improved by deep learning [4,5] and machine learning [6] methods.
Electrical resistivity tomography (ERT) is a nondestructive method commonly used to evaluate rock properties, with applications in many different geological conditions such as groundwater resources [7,8], fault imaging [9], and geotechnical applications [10]. Given the number of parameters influencing electrical resistivity, such as saturation, rock or soil type, porosity, and fluid electrical conductivity, the ERT method has a wide range of applications. ERT surveys are timesaving and relatively cost-effective due to the simplicity of operation, requiring only 1–2 h of staff time and using multichannel and automated switching systems to decrease acquisition time [11]. Using ERT between boreholes provides valuable information about the various geological structures and rock types surrounding the tunnel.
The TSP 303 method is another nondestructive evaluation method, which is relatively a new technology for tunnel exploration [12]. TSP 303 is based on propagation and reflection of seismic waves through rock layers ahead of an excavation face along the tunnel’s route.
Amberg Technologies® developed one seismic prediction method for use in tunnel construction called the TSP 303 method. This method is similar to the seismic reflection method, but uses an advanced migration imaging technique in the data processing, one that makes full use of both kinetic and dynamic characteristics of seismic waves, that is, both travel time and amplitude. Also, in the processing, the signal-to-noise ratio can be increased by new methods that cause to improve the quality of data [13]. The TSP 303 method has been widely applied in Europe and Asia [14,15]. Simple operational high-speed data acquisition shot points and good accuracy in detecting geological structures ahead of the tunnel face are some of the advantages of the TSP303 method. In the process of separating P and S waves, the Poisson’s ratio and Young’s modulus of the wall rock can be determined.
The parameters involved in seismic and electrical methods are sensitive to different types of rock properties and anomalies that exist at the tunnel location, for instance, the ERT method is sensitive to clay content and pore fluid, while the seismic methods such as TSP 303 are sensitive to cementation, bulk properties, and so on.
In this study, the basic principle of ERT and TSP 303 methods are introduced and applied. Based on the engineering background of the Nosoud Tunnel, the characteristics of the seismic wave reflections in the tunnel were interpreted. All important information for guiding tunnel construction was collected, and the application effect of prediction techniques is discussed. The feasibility and the accuracy of the TSP 303 technology are proved through comparison between ERT and TSP 303.
2 Site location and geology
The study area is located in the Zagros Mountains in Kermanshah Province, Western Iran. The tunnel is located at a distance of approximately 50 km from Javanrud city and designed to transfer water from Sirvan River to the Zahab plain. This area, in terms of geology, consists of simple structures with reverse faults and symmetrical anticlines and synclines [16]. As shown in Figure 1, the geology at the location between the seismic receiver reference location at km 19 + 835 and its face location at km 19 + 908 is defined as a massive to cliff-forming dark gray limestone. The average overburden at the site is about 315 m. The cross-section of the tunnel is characterized by layers of subsurface that they have a high slope and their orientation is also along the route of the tunnel (Figure 1). Because of the sloping layers is ≤82°, the slope values must be considered in the design, due to reflecting the rays of the steep layers are received by the recipients.
![Figure 1 Longitudinal extract of geological forecast between km 16 + 200 and 20 + 300 with face location at TSP campaign No. 2 at km 19 + 908 [17].](/document/doi/10.1515/geo-2020-0193/asset/graphic/j_geo-2020-0193_fig_001.jpg)
Longitudinal extract of geological forecast between km 16 + 200 and 20 + 300 with face location at TSP campaign No. 2 at km 19 + 908 [17].
3 Methodology
3.1 Electrical resistivity tomography
The electrical resistivity method is based on sending the constant direct current into the ground between two electrodes and measuring the resulting voltage at two potential electrodes. This method is based on the multielectrode and multicable system. The geometry of the electrode array is very important; it specifies the position of current and potential electrodes during the measurement. Pole–dipole, dipole–dipole, Wenner, and Schlumberger are four different arrays commonly used [18].
This methodology is based on the following principle: a current is introduced into the material through a pair of electrodes AB (input dipole), and the resulting potential difference is measured through another pair of electrodes MN (receiving dipole). A voltmeter measures the potential difference.
The apparent resistivity ρs (Ωm) can be defined as follows:
where IAB is the intensity of the throughput current between A and B, which is inserted on the surface by a pair of current electrodes; ∆VMN is the difference potential measured between M and N (by a second set of electrodes); and K is the dimensionless geometric factor that depends on the arrangement of current and potential electrodes by the following equation:
where AM, AN, BM, and BN stand for the distances between two electrodes.
In ERT, current electrodes are placed as sources in one borehole and potential electrodes are placed as receivers in other boreholes or vice versa [19]. The ERT method can be performed in more than two boreholes, and it can be performed when the tunnel boring machine (TBM) is working.
ERT, due to its sensitivity to water and clay content, is known as an efficient tool for revealing fractures and karstified zones characterized by low electrical resistivity values.
Some important advantages of ERT are as follows: various working models, use a variety of electrode arrangements, abundant information, and more detailed structural information; function of data preprocessing, profile shapes to visual display, and abstract data for visualization; and a survey completed the 2D data acquisition at low cost realizes the high-efficiency work and obtains the result of rich information, which will greatly enhance the capacity for exploration.
Practical applications of ERT, suitable for deep buried especially for tunnel surveys, using the apparent resistivity difference, relative thickness of the overburden layer and weathered layer, and hierarchical classification of the surrounding rock are carried out to realize qualitative distinctions and utilize low apparent-resistivity anomalies to identify faults, fracture zones, karst soil cave development, and deep water conditions [20].
3.2 Tunnel seismic prediction 303
The TSP 303 method developed by Amberg Technologies detects changes in rock mass such as irregular bodies, discontinuities, faults, and fracture zones ahead of the tunnel face by evaluating and comparing longitudinal and shear wave velocities in the surrounding rock. This method is commonly employed as a predictive method during excavation of both drill-and-blast and TBM headings; access to the face of tunnel is not required to perform the measurements, which are taken during tunneling production breaks. When blasting occurs, the seismic waves travel through the geological structures ahead of the tunnel (such as fault, fracture zones, and underground water anomalies). Structural features encountered in the rock are recorded by the receivers and later revealed through computer processing of the seismic data.
The velocity of a P wave VP can be calculated using equation (3):
where T1 and L1 are the first arrival time and the distance between the seismic source and the receiver, respectively.
T2 is the transmission time of the reflected wave, obtained with equation (4):
where L2 and L3 are the distances from the blasting hole and sensor to the reflector, respectively. During exploration, if Vp decreases, it means that cracks are developing or porosity is increasing.
The calculation of Poisson’s ratio (equation (5)) and Young’s modulus (equation (6)) for the prediction of unfavorable geology ahead of the tunnel is done as follows:
where VP and VS are the longitudinal and shear wave velocities, respectively, and
The acoustic signals were produced by a series of 24 shots (usually 50–100 g of detonation cord) aligned along one wall. An additional shot line along the opposite side, in cases of more complex geology, can be very useful. Four highly sensitive triaxial receivers, which are protected by tubes whose tips are firmly cemented into boreholes, are of 45–50 mm in both sidewalls. The receivers pick up the seismic signals reflected from beyond the tunnel face. Highly sophisticated processing and evaluation software has been devised for ease of operation [23]. The capability of the system to record the full wave field of compressional and shear waves in conjunction with intelligent processing software enables the determination of rock mechanical properties such as Poisson’s ratio and Young’s modulus. Figure 2 shows the case recording unit, receiver units, multifunctional trigger box, cabels, and TSP 303 receiver located at a depth of 2 m inside the tunnel wall.
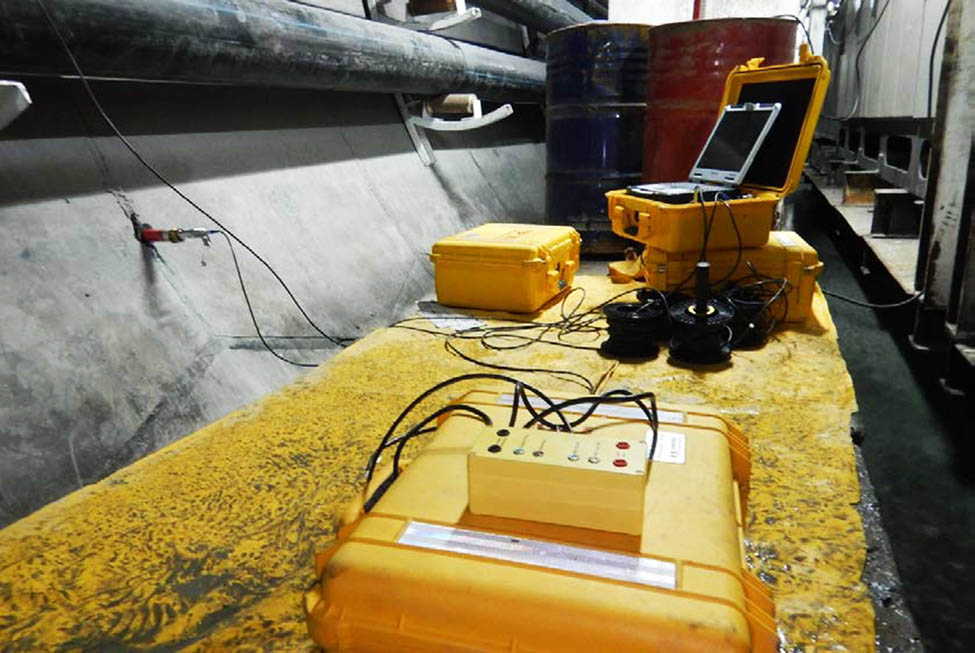
TSP 303 recording unit and accessories; (left side of the picture) TSP 303 receiver already set 2 m deep into side wall.
4 Operation
4.1 ERT operation
Geoelectrical surveys involve the use of a number of wooden stakes connected to a multipolar shielded cable. Each stake was coupled to an electrode that contains the control electronics connected to the central unit. The central unit performed a sequence of measurements according to the walk-away technique. The Wenner array was used for the data collection. The Wenner array has one of the strongest signal strengths, maintaining a high signal-to-noise ratio, especially when working in areas of low resistivity. In our array, electrodes were equally spaced. The automation of the acquisition procedure using an intelligent switch controller improved the speed of operation.
The signal used depends on the type of measurements desired. Each signal has a defined number and duration of square wave cycles, the amplitude of the current entered (mV), and the stack number (which is a repetition of measures used to reduce background noise). The data used in this study were acquired by a Multi-Electrode System Abem Terrameter LS with passive electrodes. The survey also included the use of multipolar shielded cable connections between the acquisition unit and 21 electrode cables.
The evaluation of the geomechanics and hydrogeologic characteristics was based on the use of boreholes realized in the niche. It was performed at four boreholes as shown in Figure 3 and allowed definition of a regular net from which geoelectrical sections were acquired and used to process the data according to the 3D model. The azimuth of the tunnel axis is 215°, and the azimuth of each borehole is shown in Figure 3. With this geometry, the vertical distance between the boreholes position was very low, and the space between boreholes was limited and similar to a slab. Another geometrical limit was given from the remarkable divergence between holes (Table 1).
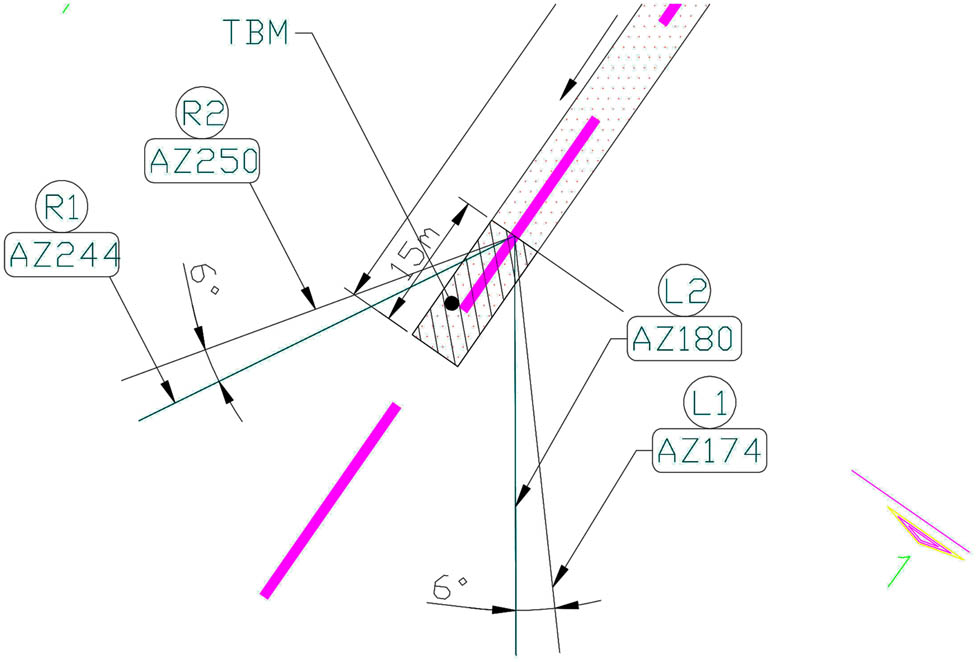
Geometry of four boreholes used for ERT method.
Properties of boreholes using the ERT method
| Borehole | Depth (m) | Position | Sidewall position | Azimuth | Vertical angle | Distance from workface | Seepage (l/s) |
|---|---|---|---|---|---|---|---|
| L1 | 18 | h9 (a little bit below h9) | Left | 41° | 90° | 14.5 | 20 |
| L2 | 11 | h10 (a little bit below h10) | Left | 35° | 90° | 14.5 | 20 |
| R1 | 40 | h3 (a little bit below h3) | Right | 29° | 90° | 14.5 | 2 |
| R2 | 42 | h2 (a little bit below h2) | Right | 35° | 90° | 14.5 | 2 |
Data processing was carried out using the following software: EarthImager 2D and 3D data analysis and tomographic inversion, Res2DInv 2D and 3D data analysis and tomographic inversion, Mathlab routines, and Voxler 3: 3D geometric analysis.
4.2 TSP303 operation
Operation of the TSP 303 system, such as installation of the receivers and system setup, is simple and can be done in 30 min. Figure 4 shows the seismic geometry of the acoustic source and receiver positions. Twenty-four sources, all of them charges of 100 g dynamite, were close to the tunnel face – the first one about 73 m from the face. Four triaxial receivers were located after shot points in boreholes about 50 mm deep in both sidewalls. The use of high-frequency waves is very helpful in processing because the resolution of seismic waves attenuates rapidly away from the source (near the tunnel face).
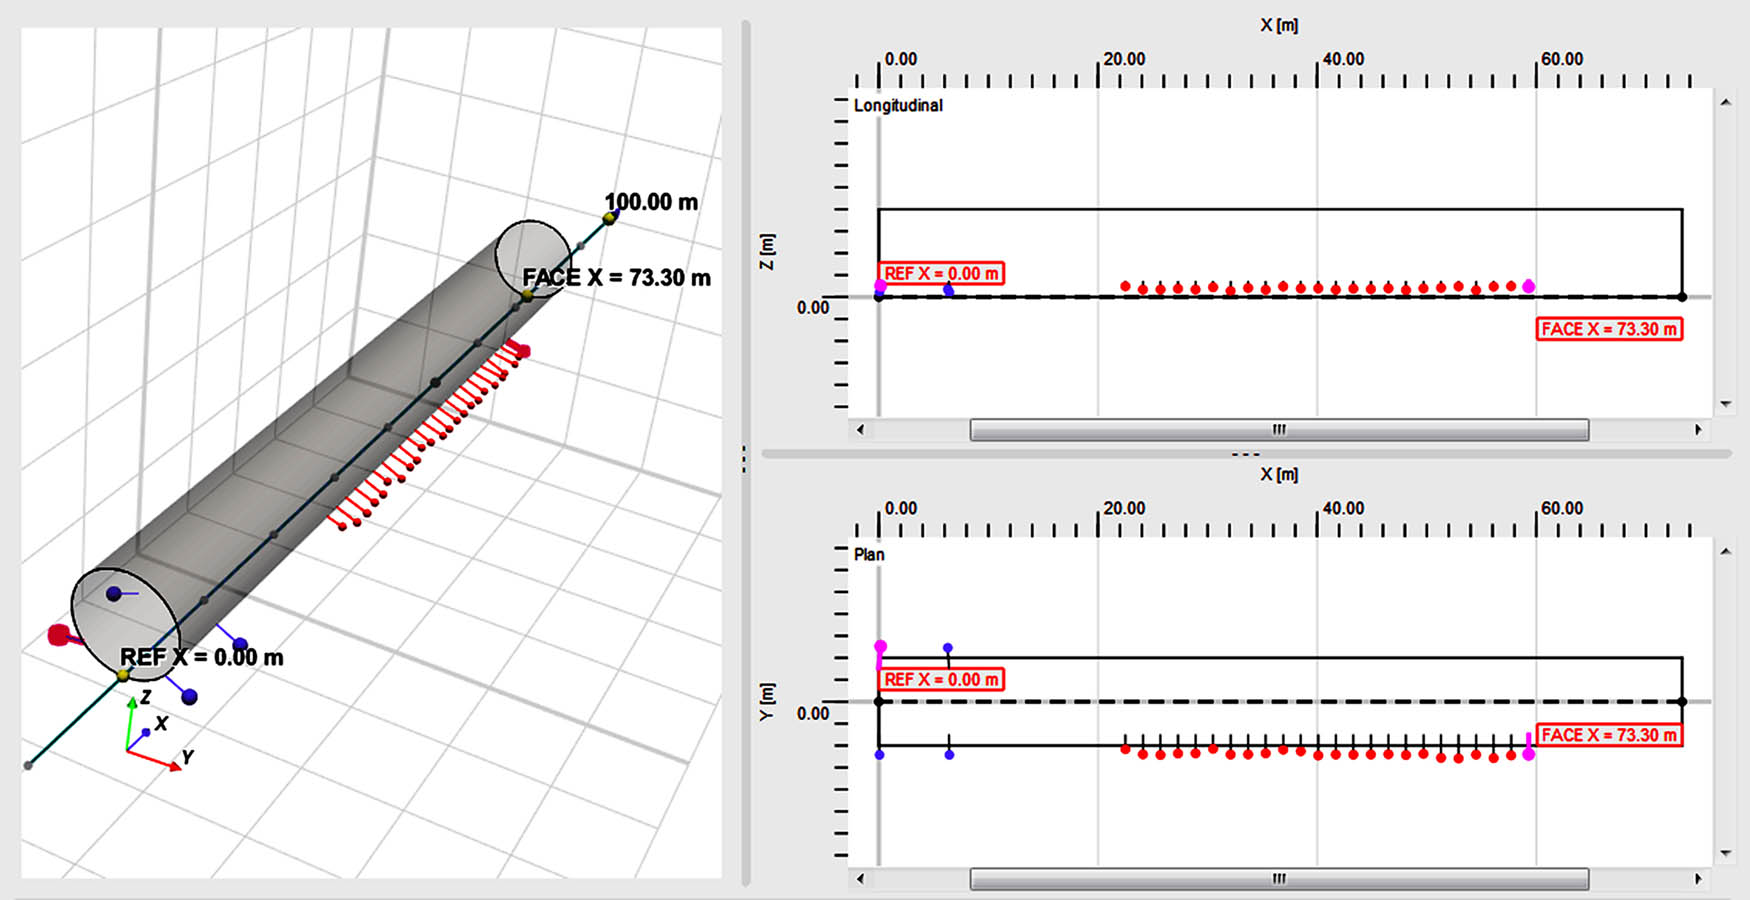
Actual TSP layout at campaign: receivers, red dots: shots
Quality data processing software is necessary to make accurate seismic predictions ahead of the tunnel. To achieve high-quality 3D results, it is important to maximize the number of data acquisition points. Using four receivers, two in each sidewall, and using a second source line along the opposite wall of the tunnel can provide meaningful information when the geological structure is complex in terms of alternating strike angles or irregular obstacles such as cavities or karst features.
The TSP 303 3D data processing software, along with 3D-VMR technology, exploits the information in the seismic wave field by separating compression (P) and shear (S) wave analysis. The 3D-VMR technology provides an adequate and detailed 3D image of the rock body, leading to a more reliable interpretation compared to conventional 2D approaches [24].
5 Result and discussion
5.1 ERT results
Determination of the geological structures in front of tunnel, particularly the fracture zones or faults, is so crucial for groundwater evaluation in the hard rock with highly heterogeneous areas. Studding the fracture density, orientation, and connectivity can detect the fracture or fault zones that contain the water buildup.
The EarthImager software was used to evaluate the root-mean-square values (RMS), data filtering, signal analysis and editing of the electrodes, and noisy reading points, to obtain a high quality dataset. At this point, the data were corrected on the basis of planimetric coordinates and elevation values associated with each station. The graphical representation of the measured data as a 2D section allowed us to identify and delete outliers, so individual resistivity values, corresponding to a single measurement point strongly higher or lower than the surrounding materials, are linked to a system disturbance and not to a real abnormality in the subsurface. An iteration analysis was performed to obtain a reliable high-resolution geological model via tomographic inversion. The resistivity values calculated were represented by 2D contouring using Surfer software. Figures 5 and 6 illustrate the horizontal section at depths 616 and 619 m, respectively; four different units are seen in front of the tunnel.
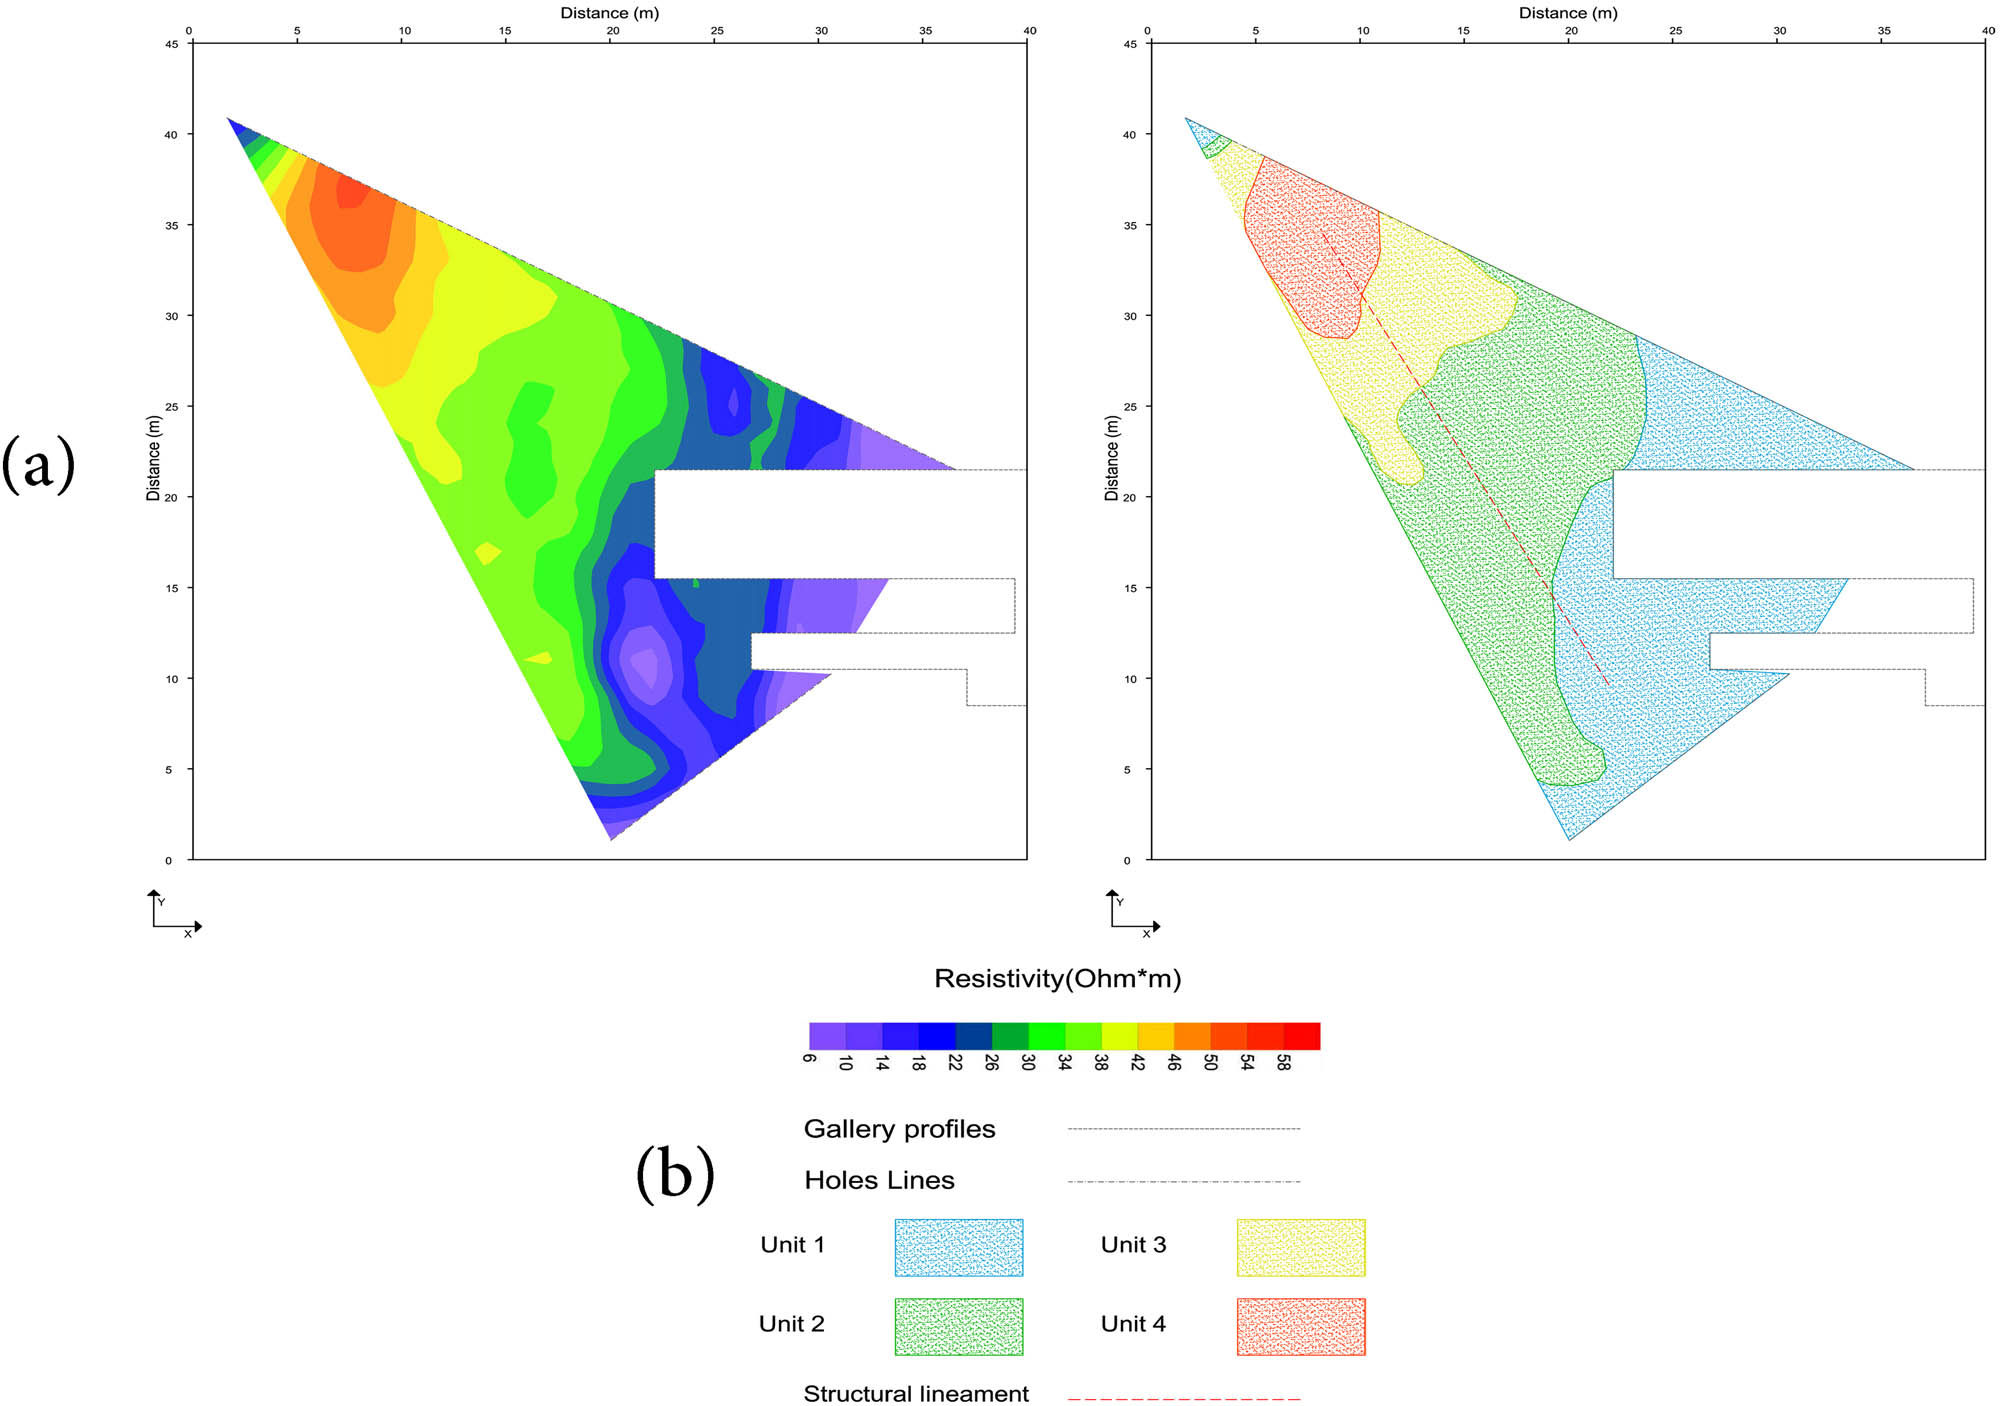
Geoelectrical survey result at (a) depth 616 m and (b) legend.
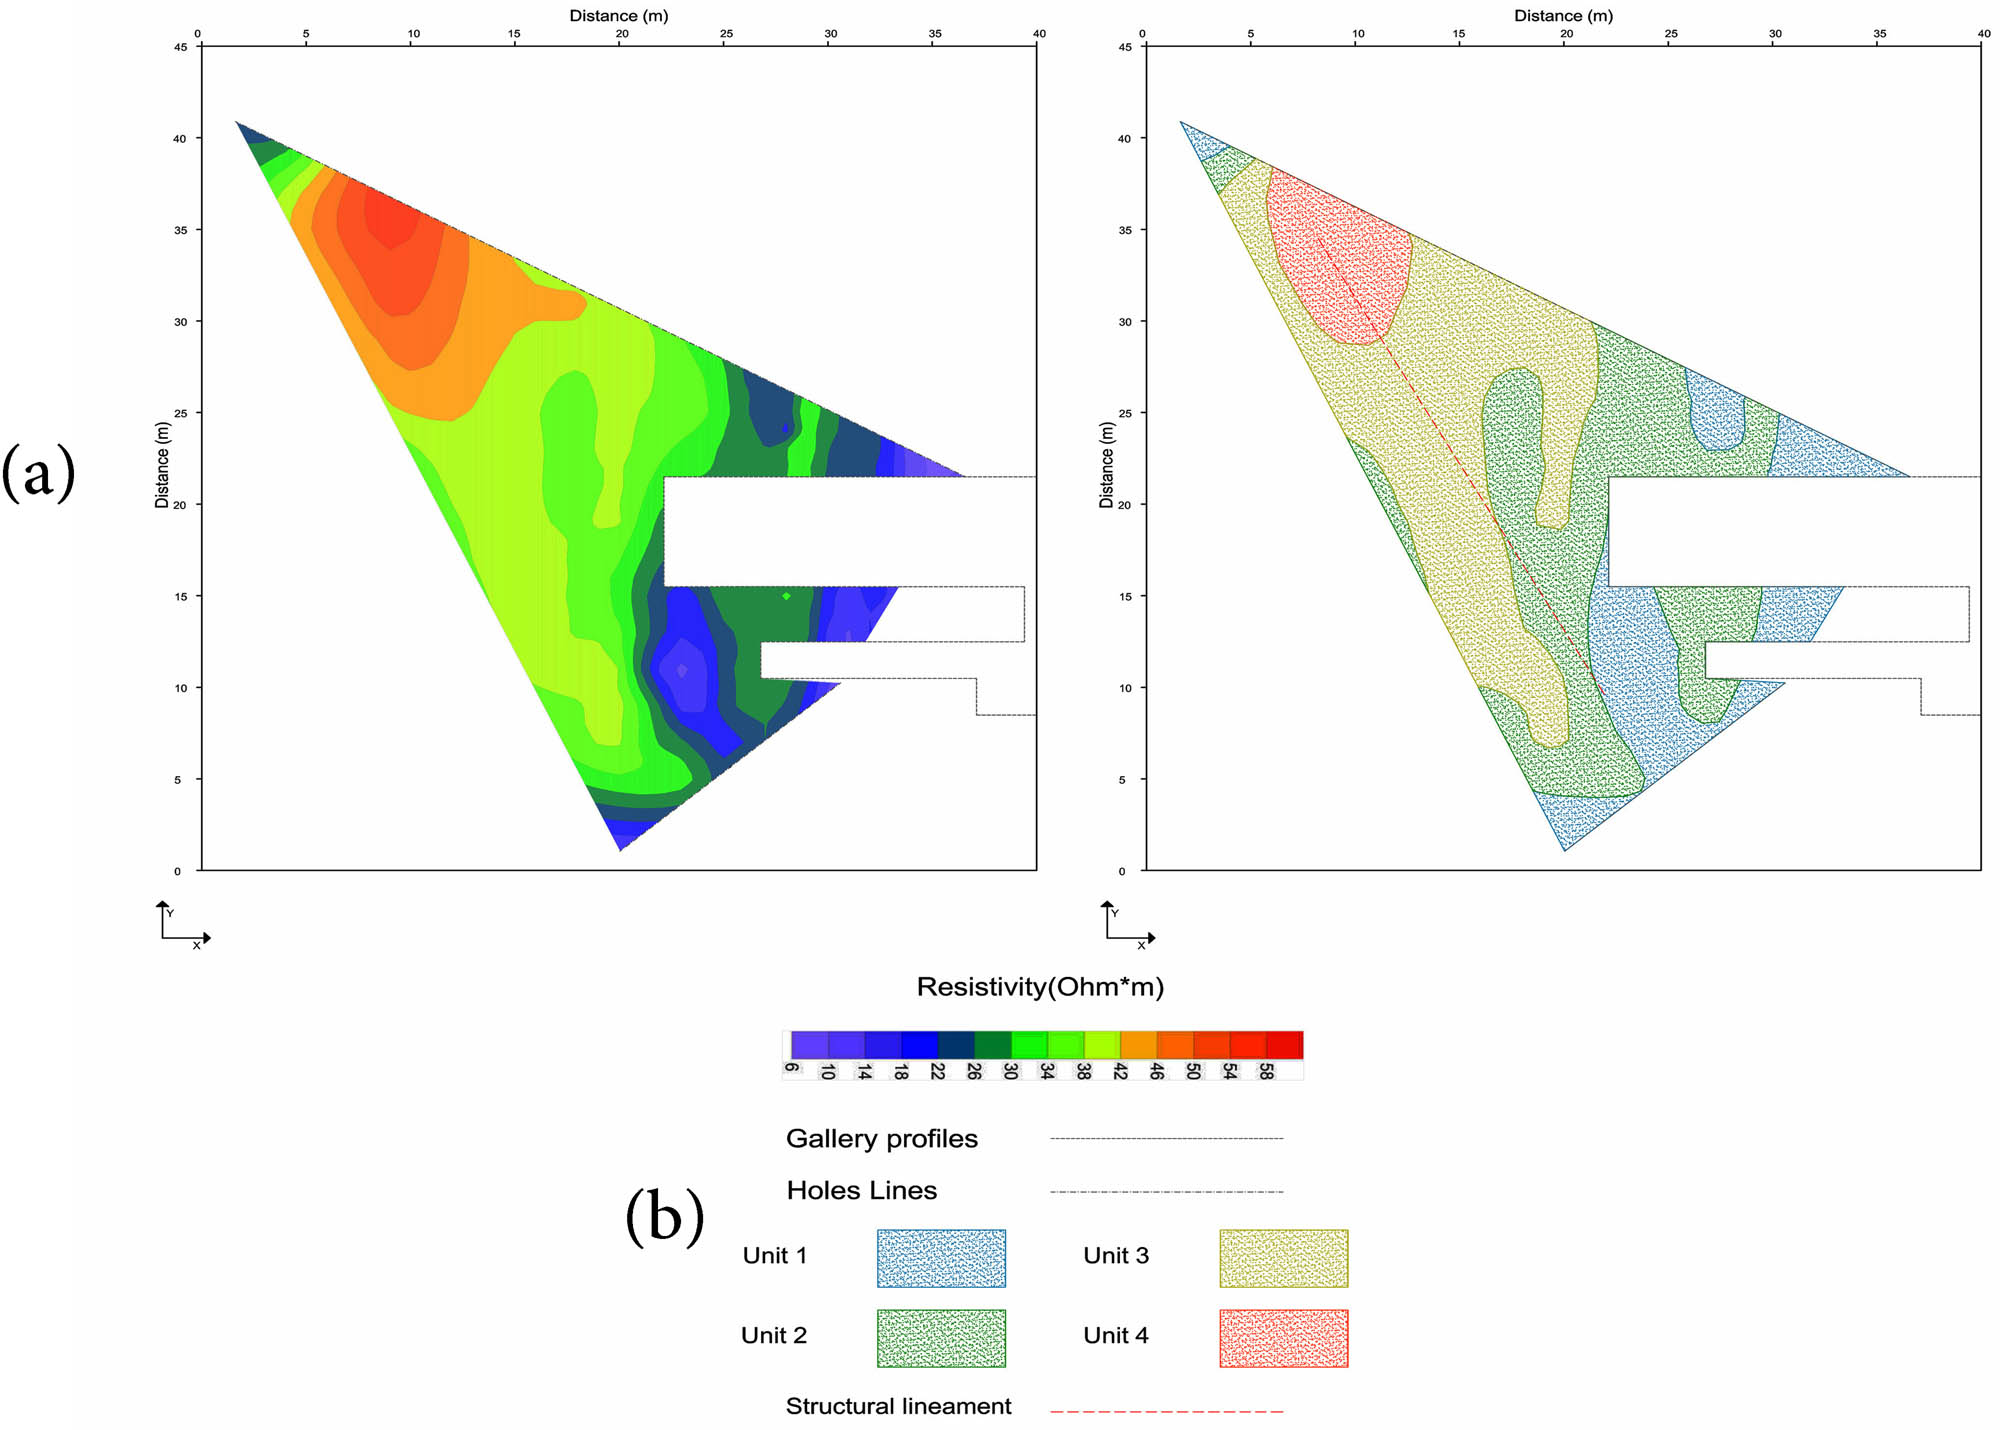
Geoelectrical survey result at (a) depth 619 m and (b) legend.
These geoelectrical models show that the lower electrical resistivity portions are located on the left side of the tunnel, which corresponds to a high water presence indicative of the fractured rock. The most distal part from the tunnel face is characterized by a resistivity decrement. This situation seems to be confirmed by R1−R2 boreholes that have experienced almost no water ingression during drilling, compared to L1−L2 boreholes located on the left side.
In data processing, it was necessary to use a geoelectrical anisotropy damping factor; apparent resistivity data were lower for corresponding (homologous) electrodes and higher (40 times) when the measurements were between distant electrodes. This consideration may confirm the presence of lineaments. The water is positioned on the left side of the tunnel as indicated by an area of low electrical resistivity; these conductive data occurred at lower altitude.
Therefore, this method can be applied to illustrate the properties of the hydrogeologic zones in the areas elevated in front of the tunnel. To improve the perception of the ERT results and accuracy in finding the water zone, it can be combined with other geophysical or hydrogeologicl methods [25].
5.2 TSP303 results
After the selection of the proper seismic data, seismic data processing per receiver started running immediately according to a number of primary control steps. The most important of these steps are band-pass filter, first arrival pick, Q-estimation, P–S separation, velocity analysis, and depth migration. The time of reflected signal is converted to the distance through the analysis of the reflected wave velocity.
The aim of the seismic data processing is to extract and enhance the reflected wave field. For this purpose, specifically designed processing steps are applied to the data. The result of each step is stored and enabled the processor to review during the processing.
The wave separation process of Amberg TSP Plus separates the recordings into wave types according to their polarization type by rotating the coordinate system as a function of recording time. At the end of the evaluation, all preprocessed data were processed using 3D-processing methods and a user-defined 3D-velocity model. In the following, extracted reflectors were interpreted geologically, and the calculated rock properties are presented. Finally, based on P and S velocity and geotechnical parameters, the rock formation are divided and the results are interpreted. In this step, only the more eminent reflection signals in front of tunnel face are taken.
After entering the geometry of the Nosoud Tunnel profile into the Amberg TSP plus system, the recorded row data were extracted for each receiver as the three components X, Y, and Z. The acquired data were high quality. First, arrival amplitudes dominated and resulted in high-resolution data. The maximum to 200 ms was processed. The errors of location are about 1 m, and for some other engineering investigation, this location error can be more than 5 m. The difficulty in determining the velocities of seismic waves is the reason for errors of the location.
Results from the test site showed some low-velocity anomalies (LVAs), which are interpreted as fault or fracture zones (Figures 7 and 8). Four low velocity seismic zones were detected that their locations are shown in Table 2. The thickness values of the anomalies are 3, 3, 4, and 3 m, respectively. LVAs are often attributed to excess temperature or water content.
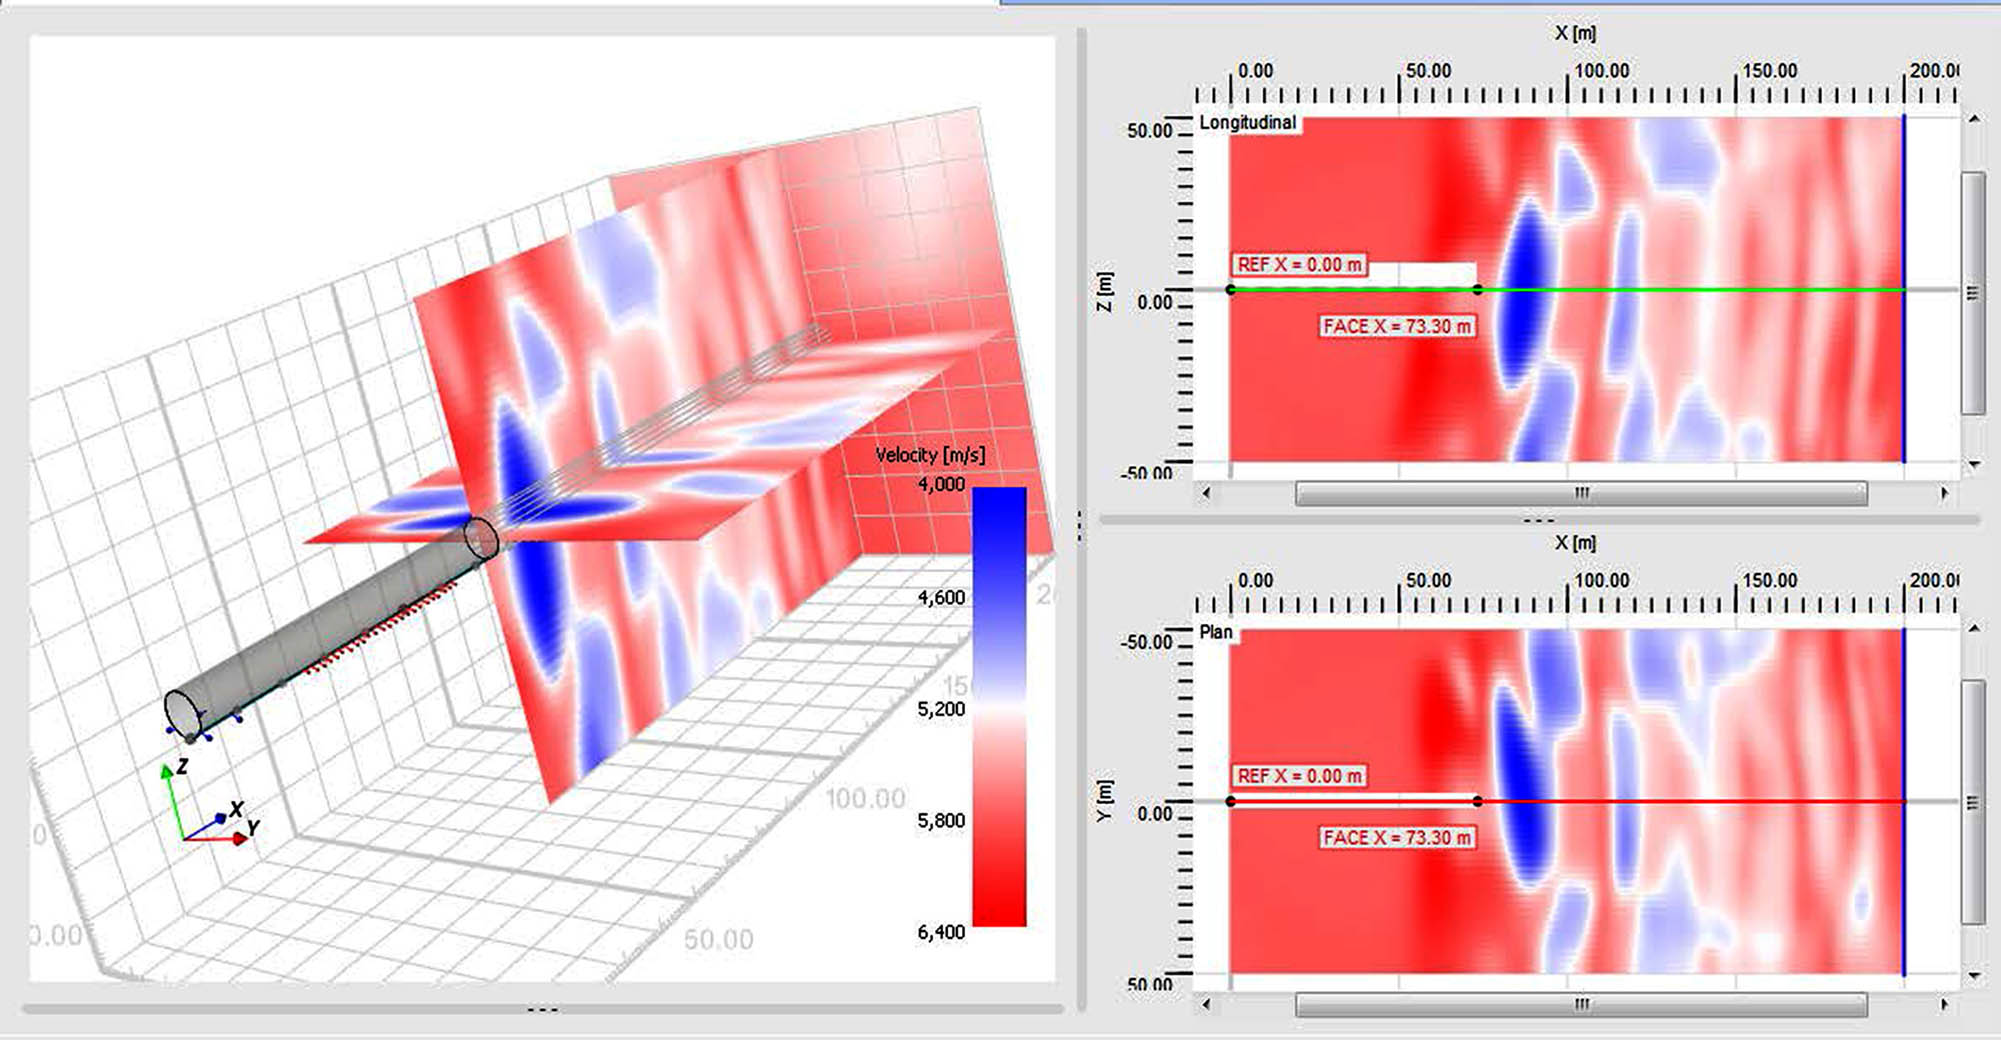
P-Wave velocity distribution with two low velocity zones (LVZ) indicated.
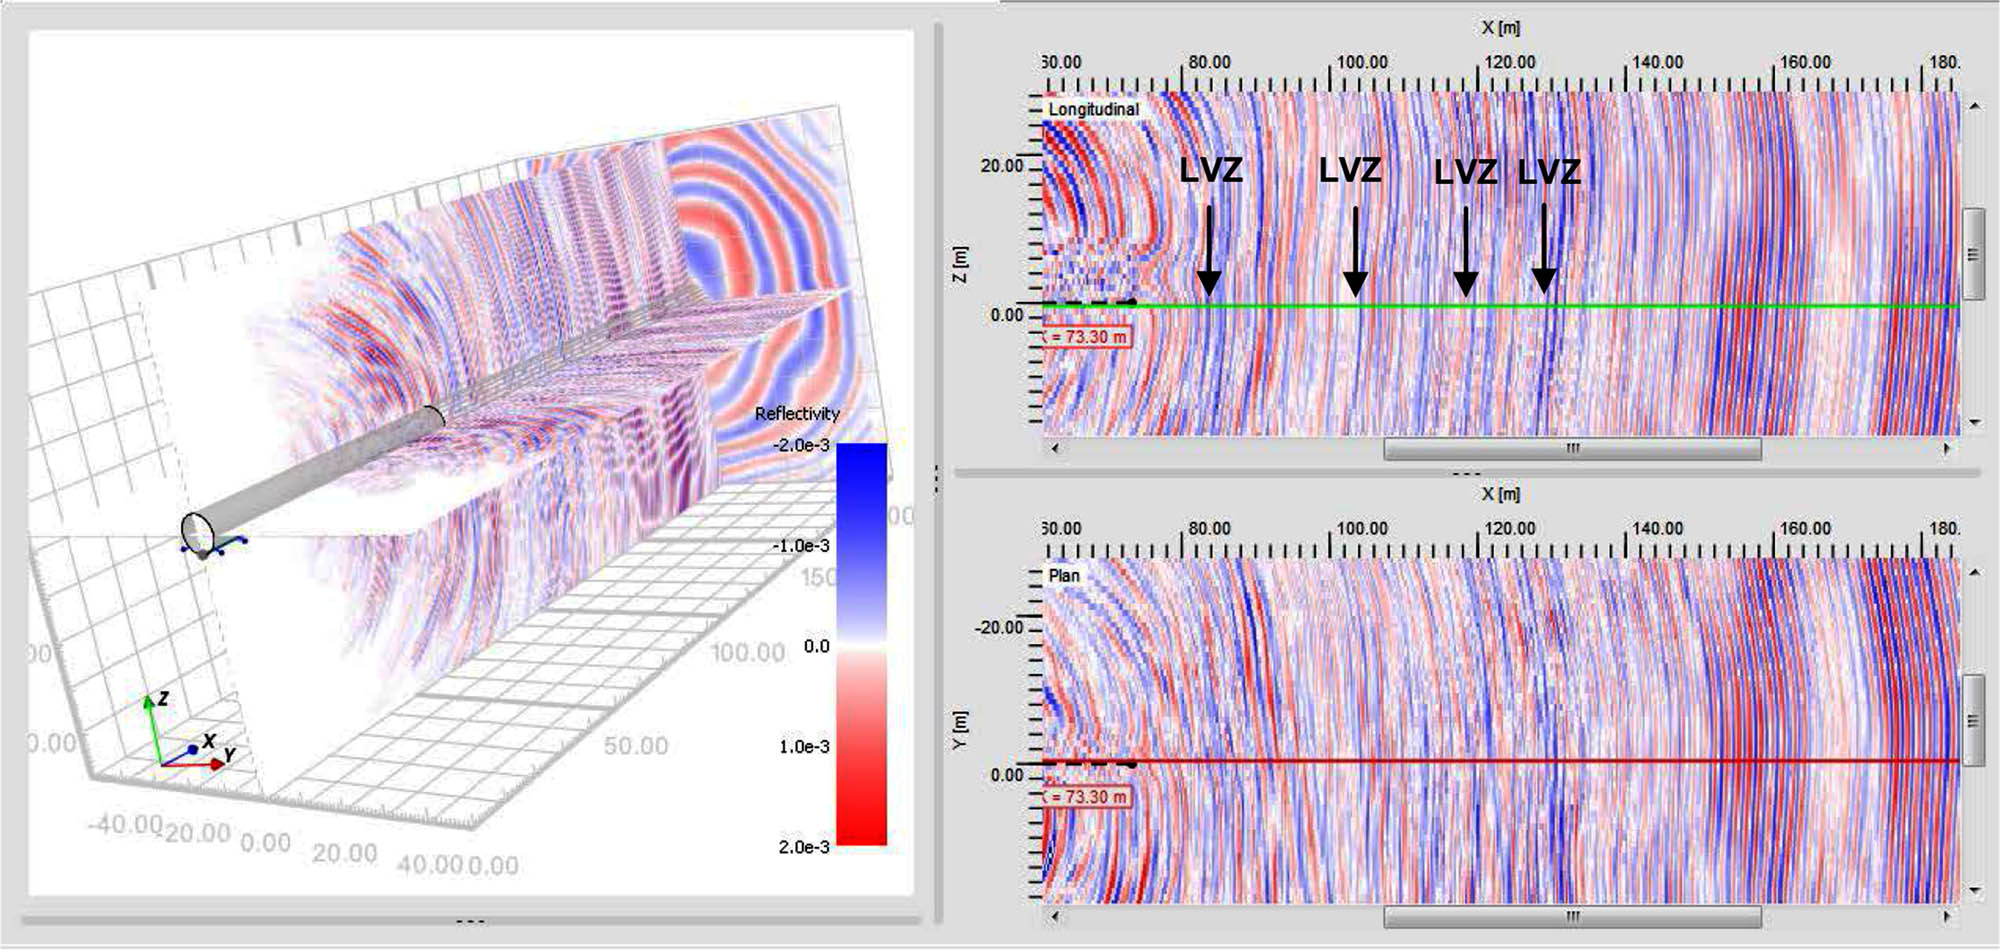
P-Wave depth migration with low velocity zones (LVZ) indicated.
Seismic zones detected
| Interval no. | Change (m) | |
|---|---|---|
| From | To | |
| 1 | 19,919 | 19,922 |
| 2 | 19,925 | 19,928 |
| 3 | 19,938 | 19,942 |
| 4 | 19,954 | 19,957 |
Figure 9 illustrates a change in rock mechanical properties, the P-wave velocity and S-wave velocity ratio, and Poisson’s ratio (the VP/VS variety range was between 1.80 and 2.41 and the Poisson’s was between 0.28 and 0.40).
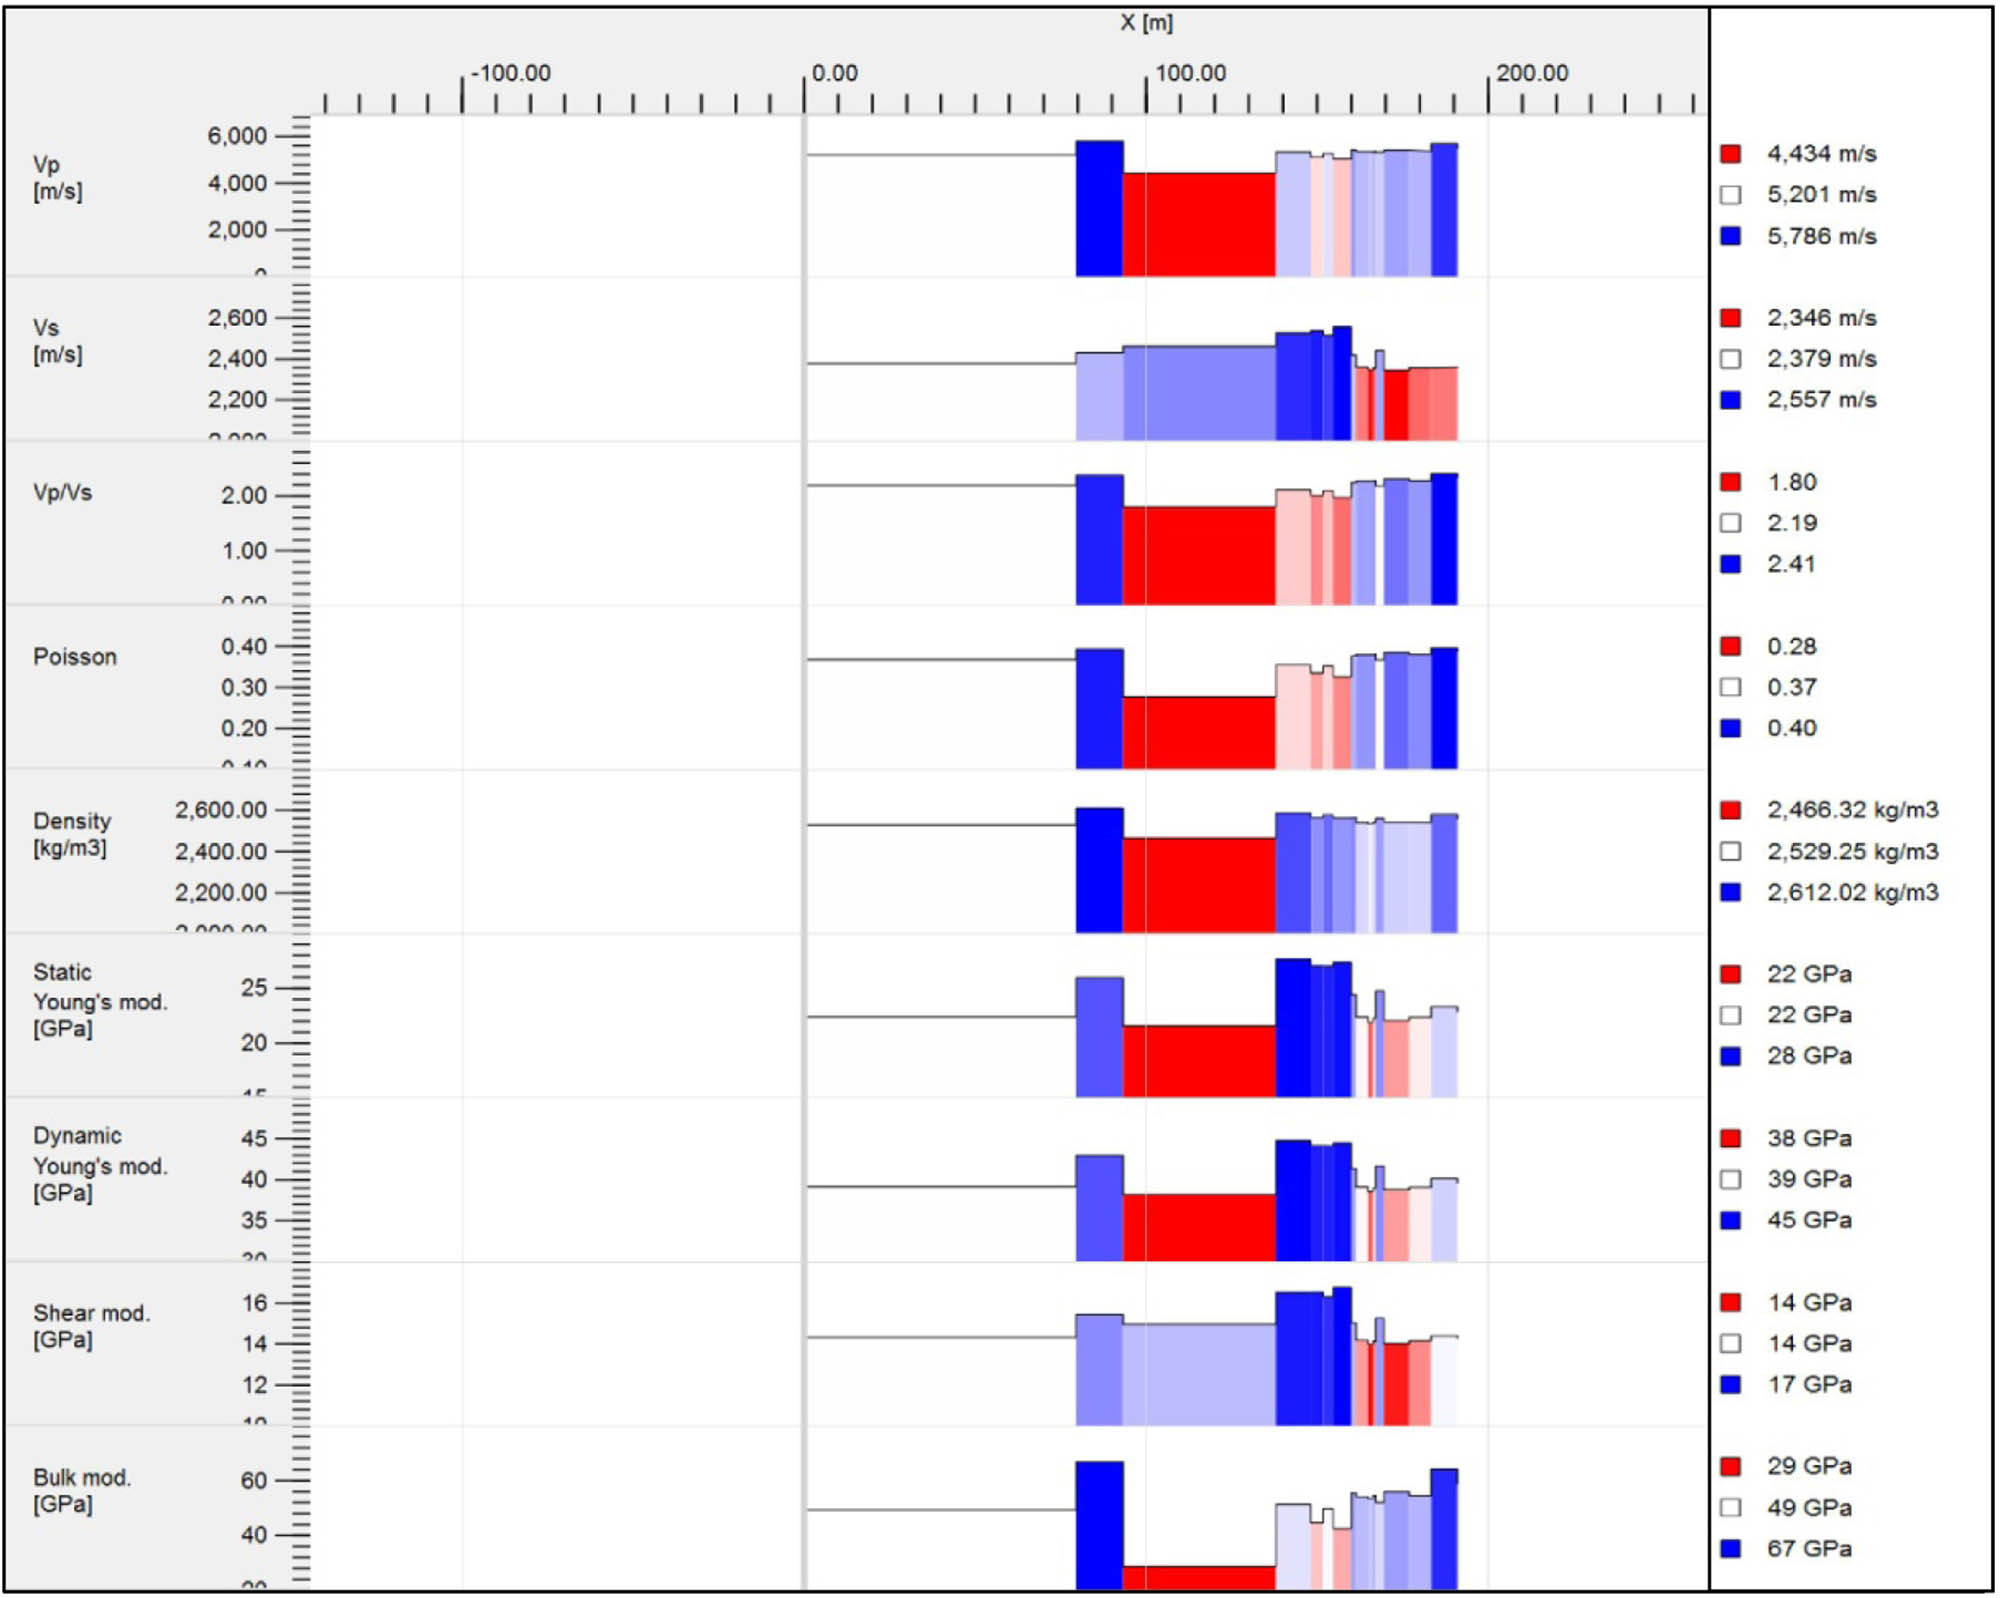
Rock mechanical properties.
In compression with previous works, for instance, Qiyueshan tunnel in 2014 [18], Ma Jiazhai tunnel in 2012 [26], both located in the Karst area, and Shimenya tunnel of Yi-Ba highway in 2018 [27], the accuracy of our TSP303 operation results is very high even more than the results of the other works mentioned earlier, although our investigation is in the inappropriate condition due to existing water in the tunnel. This high accuracy is because of using high precision primary velocity in the data processing, which is due to the application of the ERT method and the presence of the boreholes in tunnel before the TSP303 operation.
6 Conclusions
The interpretation of recent geophysical and geoelectrical surveys has suggested better rock-massif conditions on the right side of the tunnel, especially in terms of fracturing and, as a consequence, expected water ingress when performing excavation and drilling operations.
The comparison between ERT and TSP 303 methods indicates that these two geophysical methods are suitable for tunnel exploration. The results are in agreement with each other, but the results of TSP 303 were more accurate with higher quality and greater compliance with rock properties in front of the tunnel. In summary, despite the low energy transmission in the given rock mass, the data lead to a geological forecast over a range of about 100 m from the face. However, some uncertainty about the location of the remote fracture zone needs to be verified later as excavation proceeds.
Based on the information obtained so far, the TSP 303 system can be successfully used in tunneling activities in the Nosoud region. Here, the prevailing rock types and expected geological structures offer the ideal scenario for using this technology. Data acquisition does not significantly delay or effect tunnel operations and can be performed on a continuous basis as needed. The use of seismic investigations together with complementary exploration tools helps reduce the risks associated with tunnel exploration considerably. Therefore, proper investigations must be carried out using the advanced 3D TSP technology on a continuous basis.
References
[1] Madani H. Tunneling. 2nd ed. Tehran, Iran: Tehran Polytechnic University Press; 1998. p. 315–28 (in Persian).Suche in Google Scholar
[2] Osanloo M. Excavation Methods. 1st ed. Tehran, Iran: Nashre Seda Press; 1996. p. 152–75 (in Persian).Suche in Google Scholar
[3] Alimoradi A, Moradzadeh A, Naderi R, Zad Salehi M, Etemadi A. Prediction of geological hazardous zones in front of a tunnel face using TSP-203 and artificial neural networks. Tunn Undergr Space Technol. 2008;23:711–17.10.1016/j.tust.2008.01.001Suche in Google Scholar
[4] Zhu L, Zhang C, Zhang C, Zhang Z, Zhou X, Liu W, et al. A new and reliable dual model- and data-driven TOC prediction concept: A TOC logging evaluation method using multiple overlapping methods integrated with semi-supervised deep learning. J Pet Sci Eng. 2020;188:106944–60.10.1016/j.petrol.2020.106944Suche in Google Scholar
[5] Zhu L, Zhang C, Zhang C, Zhang Z, Nie X, Zhou X, et al. Forming a new small sample deep learning model to predict total organic carbon content by combining unsupervised learning with semisupervised learning. Appl Soft Comput. 2019;83:105596–619.10.1016/j.asoc.2019.105596Suche in Google Scholar
[6] Miah MI, Zendehboudi S, Ahmed S. Log data-driven model and feature ranking for water saturation prediction using machine learning approach. J Pet Sci Eng. 2020;194:107291–310.10.1016/j.petrol.2020.107291Suche in Google Scholar
[7] Hermans T, Nguyen F, Caers J. Uncertainty in training image-based inversion of hydraulic head data constrained to ERT data: Workflow and case study. Water Resour Res. 2015;51:5332–52.10.1002/2014WR016460Suche in Google Scholar
[8] Yeh HF, Lin HI, Wu CS, Hsu KC, Lee JW, Lee CH. Electrical resistivity tomography applied to groundwater aquifer at downstream of Chih-Ben Creek basin, Taiwan. Env Earth Sci. 2015;73:4681–87.10.1007/s12665-014-3752-1Suche in Google Scholar
[9] Nguyen F, Garambois S, Jongmans D, Pirard E, Loke M. Image processing of 2D resistivity data for imaging faults. J Appl Geophys. 2005;57:260–77.10.1016/j.jappgeo.2005.02.001Suche in Google Scholar
[10] Caterina D, Beaujean J, Robert T, Nguyen F. A comparison study of different image appraisal tools for electrical resistivity tomography. Surf Geophys. 2013;11:639–57.10.3997/1873-0604.2013022Suche in Google Scholar
[11] Van Hoorde M, Hermans T, Dumont G, Nguyen F. 3D electrical resistivity tomography of karstified formations using cross-line measurements. Eng Geol. 2017;220:123–32.10.1016/j.enggeo.2017.01.028Suche in Google Scholar
[12] Amberg Measuring Technique. TSP 303 Processing: Amberg Technologies AG. Switzerland; 2002.Suche in Google Scholar
[13] Yang L, Chen W, Liu W, Zha B, Zhu L. Random noise attenuation based on residual convolutional neural network in seismic datasets. Ieee Access. 2020;8:30271–86..10.1109/ACCESS.2020.2972464Suche in Google Scholar
[14] Zhong L. The application of TSP-202 detection system in geologic prediction in Xiguona Tunnel. Geol Prospecting. 2002;38(1):86–89.Suche in Google Scholar
[15] Yonggui Z, Hui J, Xiaopeng Z. Tunnel seismic tomography method for geological prediction and its application. J Appl Geophysics. 2006;3(2):69–74.10.1007/s11770-006-0010-7Suche in Google Scholar
[16] Morsali M, Rezaei M. Assessment of H2S emission hazards into tunnels: the Nosoud tunnel case study from Iran. Env Earth Sci. 2017;76:227.10.1007/s12665-017-6493-0Suche in Google Scholar
[17] GeoRayan Ltd. Co. Result report Tunnel Seismic Prediction – TSP 303. Tehran, Iran, 2016. p. 13.Suche in Google Scholar
[18] Metwaly M, AlFouzan F. Application of 2-D geoelectrical resistivity tomography for subsurface cavity detection in the eastern part of Saudi Arabia. Geosci Front. 2013;4:469–76.10.1016/j.gsf.2012.12.005Suche in Google Scholar
[19] Ha SH, Kim DS, Park IJ. Application of electrical resistivity techniques to detect weak and fracture zones during underground construction. Env Earth Sci. 2009;60:723–31.10.1007/s12665-009-0210-6Suche in Google Scholar
[20] Ding H, Jiang W. Application of Geophysical Methods in Tunnel Exploration, 5th International Conference on Civil, Architectural and Hydraulic Engineering. Published by Atlantis Press; 2016.10.2991/iccahe-16.2016.33Suche in Google Scholar
[21] Shi SS, Li SC, Li LP, Zhou ZQ, Wang J. Advance optimized classification and application of surrounding rock based on fuzzy analytic hierarchy process and Tunnel Seismic Prediction. Autom Constr. 2014;37:217–22.10.1016/j.autcon.2013.08.019Suche in Google Scholar
[22] Lin C, Li S. Tunnel seismic prediction (TSP) and its application in tunnel engineering. Appl Mech Mater. 2014;501:1779–82.10.4028/www.scientific.net/AMM.501-504.1779Suche in Google Scholar
[23] Dickmann T, Hecht J, Choudary M, Rahbar KA. Advanced seismic investigations during construction of hydro tunnels. Recent Adv Rock Eng (RARE). 2016;2352–5401.Suche in Google Scholar
[24] Dickmann T, Krueger D. Is geological uncertainty ahead of the face controllable? World Tunnel Congress (WTC); 2013 May 31–Jun 07.10.1201/b14769-195Suche in Google Scholar
[25] Hu J, Wu XW, Ke H, Xu XB, Lan JW, Zhan LT. Application of electrical resistivity tomography to monitor the dewatering of vertical and horizontal wells in municipal solid waste landfills. Eng Geol. 2019;254:1–12.10.1016/j.enggeo.2019.03.021Suche in Google Scholar
[26] Dai S, Ma C. Application of TSP tunnel geological prediction for case study. Adv Mater Res. 2012;490:1816–20.10.4028/www.scientific.net/AMR.490-495.1816Suche in Google Scholar
[27] Bu L, Li SC, Shi S, Xie XK, Li LP, Zhou ZQ, et al. A new advance classification method for surrounding rock in tunnels based on the set-pair analysis and tunnel seismic prediction system. Geotech Geol Eng. 2018;36:2403–13.10.1007/s10706-018-0471-5Suche in Google Scholar
© 2020 Nima Dastanboo et al., published by De Gruyter
This work is licensed under the Creative Commons Attribution 4.0 International License.
Artikel in diesem Heft
- Regular Articles
- The simulation approach to the interpretation of archival aerial photographs
- The application of137Cs and210Pbexmethods in soil erosion research of Titel loess plateau, Vojvodina, Northern Serbia
- Provenance and tectonic significance of the Zhongwunongshan Group from the Zhongwunongshan Structural Belt in China: insights from zircon geochronology
- Analysis, Assessment and Early Warning of Mudflow Disasters along the Shigatse Section of the China–Nepal Highway
- Sedimentary succession and recognition marks of lacustrine gravel beach-bars, a case study from the Qinghai Lake, China
- Predicting small water courses’ physico-chemical status from watershed characteristics with two multivariate statistical methods
- An Overview of the Carbonatites from the Indian Subcontinent
- A new statistical approach to the geochemical systematics of Italian alkaline igneous rocks
- The significance of karst areas in European national parks and geoparks
- Geochronology, trace elements and Hf isotopic geochemistry of zircons from Swat orthogneisses, Northern Pakistan
- Regional-scale drought monitor using synthesized index based on remote sensing in northeast China
- Application of combined electrical resistivity tomography and seismic reflection method to explore hidden active faults in Pingwu, Sichuan, China
- Impact of interpolation techniques on the accuracy of large-scale digital elevation model
- Natural and human-induced factors controlling the phreatic groundwater geochemistry of the Longgang River basin, South China
- Land use/land cover assessment as related to soil and irrigation water salinity over an oasis in arid environment
- Effect of tillage, slope, and rainfall on soil surface microtopography quantified by geostatistical and fractal indices during sheet erosion
- Validation of the number of tie vectors in post-processing using the method of frequency in a centric cube
- An integrated petrophysical-based wedge modeling and thin bed AVO analysis for improved reservoir characterization of Zhujiang Formation, Huizhou sub-basin, China: A case study
- A grain size auto-classification of Baikouquan Formation, Mahu Depression, Junggar Basin, China
- Dynamics of mid-channel bars in the Middle Vistula River in response to ferry crossing abutment construction
- Estimation of permeability and saturation based on imaginary component of complex resistivity spectra: A laboratory study
- Distribution characteristics of typical geological relics in the Western Sichuan Plateau
- Inconsistency distribution patterns of different remote sensing land-cover data from the perspective of ecological zoning
- A new methodological approach (QEMSCAN®) in the mineralogical study of Polish loess: Guidelines for further research
- Displacement and deformation study of engineering structures with the use of modern laser technologies
- Virtual resolution enhancement: A new enhancement tool for seismic data
- Aeromagnetic mapping of fault architecture along Lagos–Ore axis, southwestern Nigeria
- Deformation and failure mechanism of full seam chamber with extra-large section and its control technology
- Plastic failure zone characteristics and stability control technology of roadway in the fault area under non-uniformly high geostress: A case study from Yuandian Coal Mine in Northern Anhui Province, China
- Comparison of swarm intelligence algorithms for optimized band selection of hyperspectral remote sensing image
- Soil carbon stock and nutrient characteristics of Senna siamea grove in the semi-deciduous forest zone of Ghana
- Carbonatites from the Southern Brazilian platform: I
- Seismicity, focal mechanism, and stress tensor analysis of the Simav region, western Turkey
- Application of simulated annealing algorithm for 3D coordinate transformation problem solution
- Application of the terrestrial laser scanner in the monitoring of earth structures
- The Cretaceous igneous rocks in southeastern Guangxi and their implication for tectonic environment in southwestern South China Block
- Pore-scale gas–water flow in rock: Visualization experiment and simulation
- Assessment of surface parameters of VDW foundation piles using geodetic measurement techniques
- Spatial distribution and risk assessment of toxic metals in agricultural soils from endemic nasopharyngeal carcinoma region in South China
- An ABC-optimized fuzzy ELECTRE approach for assessing petroleum potential at the petroleum system level
- Microscopic mechanism of sandstone hydration in Yungang Grottoes, China
- Importance of traditional landscapes in Slovenia for conservation of endangered butterfly
- Landscape pattern and economic factors’ effect on prediction accuracy of cellular automata-Markov chain model on county scale
- The influence of river training on the location of erosion and accumulation zones (Kłodzko County, South West Poland)
- Multi-temporal survey of diaphragm wall with terrestrial laser scanning method
- Functionality and reliability of horizontal control net (Poland)
- Strata behavior and control strategy of backfilling collaborate with caving fully-mechanized mining
- The use of classical methods and neural networks in deformation studies of hydrotechnical objects
- Ice-crevasse sedimentation in the eastern part of the Głubczyce Plateau (S Poland) during the final stage of the Drenthian Glaciation
- Structure of end moraines and dynamics of the recession phase of the Warta Stadial ice sheet, Kłodawa Upland, Central Poland
- Mineralogy, mineral chemistry and thermobarometry of post-mineralization dykes of the Sungun Cu–Mo porphyry deposit (Northwest Iran)
- Main problems of the research on the Palaeolithic of Halych-Dnister region (Ukraine)
- Application of isometric transformation and robust estimation to compare the measurement results of steel pipe spools
- Hybrid machine learning hydrological model for flood forecast purpose
- Rainfall thresholds of shallow landslides in Wuyuan County of Jiangxi Province, China
- Dynamic simulation for the process of mining subsidence based on cellular automata model
- Developing large-scale international ecological networks based on least-cost path analysis – a case study of Altai mountains
- Seismic characteristics of polygonal fault systems in the Great South Basin, New Zealand
- New approach of clustering of late Pleni-Weichselian loess deposits (L1LL1) in Poland
- Implementation of virtual reference points in registering scanning images of tall structures
- Constraints of nonseismic geophysical data on the deep geological structure of the Benxi iron-ore district, Liaoning, China
- Mechanical analysis of basic roof fracture mechanism and feature in coal mining with partial gangue backfilling
- The violent ground motion before the Jiuzhaigou earthquake Ms7.0
- Landslide site delineation from geometric signatures derived with the Hilbert–Huang transform for cases in Southern Taiwan
- Hydrological process simulation in Manas River Basin using CMADS
- LA-ICP-MS U–Pb ages of detrital zircons from Middle Jurassic sedimentary rocks in southwestern Fujian: Sedimentary provenance and its geological significance
- Analysis of pore throat characteristics of tight sandstone reservoirs
- Effects of igneous intrusions on source rock in the early diagenetic stage: A case study on Beipiao Formation in Jinyang Basin, Northeast China
- Applying floodplain geomorphology to flood management (The Lower Vistula River upstream from Plock, Poland)
- Effect of photogrammetric RPAS flight parameters on plani-altimetric accuracy of DTM
- Morphodynamic conditions of heavy metal concentration in deposits of the Vistula River valley near Kępa Gostecka (central Poland)
- Accuracy and functional assessment of an original low-cost fibre-based inclinometer designed for structural monitoring
- The impacts of diagenetic facies on reservoir quality in tight sandstones
- Application of electrical resistivity imaging to detection of hidden geological structures in a single roadway
- Comparison between electrical resistivity tomography and tunnel seismic prediction 303 methods for detecting the water zone ahead of the tunnel face: A case study
- The genesis model of carbonate cementation in the tight oil reservoir: A case of Chang 6 oil layers of the Upper Triassic Yanchang Formation in the western Jiyuan area, Ordos Basin, China
- Disintegration characteristics in granite residual soil and their relationship with the collapsing gully in South China
- Analysis of surface deformation and driving forces in Lanzhou
- Geochemical characteristics of produced water from coalbed methane wells and its influence on productivity in Laochang Coalfield, China
- A combination of genetic inversion and seismic frequency attributes to delineate reservoir targets in offshore northern Orange Basin, South Africa
- Explore the application of high-resolution nighttime light remote sensing images in nighttime marine ship detection: A case study of LJ1-01 data
- DTM-based analysis of the spatial distribution of topolineaments
- Spatiotemporal variation and climatic response of water level of major lakes in China, Mongolia, and Russia
- The Cretaceous stratigraphy, Songliao Basin, Northeast China: Constrains from drillings and geophysics
- Canal of St. Bartholomew in Seča/Sezza: Social construction of the seascape
- A modelling resin material and its application in rock-failure study: Samples with two 3D internal fracture surfaces
- Utilization of marble piece wastes as base materials
- Slope stability evaluation using backpropagation neural networks and multivariate adaptive regression splines
- Rigidity of “Warsaw clay” from the Poznań Formation determined by in situ tests
- Numerical simulation for the effects of waves and grain size on deltaic processes and morphologies
- Impact of tourism activities on water pollution in the West Lake Basin (Hangzhou, China)
- Fracture characteristics from outcrops and its meaning to gas accumulation in the Jiyuan Basin, Henan Province, China
- Impact evaluation and driving type identification of human factors on rural human settlement environment: Taking Gansu Province, China as an example
- Identification of the spatial distributions, pollution levels, sources, and health risk of heavy metals in surface dusts from Korla, NW China
- Petrography and geochemistry of clastic sedimentary rocks as evidence for the provenance of the Jurassic stratum in the Daqingshan area
- Super-resolution reconstruction of a digital elevation model based on a deep residual network
- Seismic prediction of lithofacies heterogeneity in paleogene hetaoyuan shale play, Biyang depression, China
- Cultural landscape of the Gorica Hills in the nineteenth century: Franciscean land cadastre reports as the source for clarification of the classification of cultivable land types
- Analysis and prediction of LUCC change in Huang-Huai-Hai river basin
- Hydrochemical differences between river water and groundwater in Suzhou, Northern Anhui Province, China
- The relationship between heat flow and seismicity in global tectonically active zones
- Modeling of Landslide susceptibility in a part of Abay Basin, northwestern Ethiopia
- M-GAM method in function of tourism potential assessment: Case study of the Sokobanja basin in eastern Serbia
- Dehydration and stabilization of unconsolidated laminated lake sediments using gypsum for the preparation of thin sections
- Agriculture and land use in the North of Russia: Case study of Karelia and Yakutia
- Textural characteristics, mode of transportation and depositional environment of the Cretaceous sandstone in the Bredasdorp Basin, off the south coast of South Africa: Evidence from grain size analysis
- One-dimensional constrained inversion study of TEM and application in coal goafs’ detection
- The spatial distribution of retail outlets in Urumqi: The application of points of interest
- Aptian–Albian deposits of the Ait Ourir basin (High Atlas, Morocco): New additional data on their paleoenvironment, sedimentology, and palaeogeography
- Traditional agricultural landscapes in Uskopaljska valley (Bosnia and Herzegovina)
- A detection method for reservoir waterbodies vector data based on EGADS
- Modelling and mapping of the COVID-19 trajectory and pandemic paths at global scale: A geographer’s perspective
- Effect of organic maturity on shale gas genesis and pores development: A case study on marine shale in the upper Yangtze region, South China
- Gravel roundness quantitative analysis for sedimentary microfacies of fan delta deposition, Baikouquan Formation, Mahu Depression, Northwestern China
- Features of terraces and the incision rate along the lower reaches of the Yarlung Zangbo River east of Namche Barwa: Constraints on tectonic uplift
- Application of laser scanning technology for structure gauge measurement
- Calibration of the depth invariant algorithm to monitor the tidal action of Rabigh City at the Red Sea Coast, Saudi Arabia
- Evolution of the Bystrzyca River valley during Middle Pleistocene Interglacial (Sudetic Foreland, south-western Poland)
- A 3D numerical analysis of the compaction effects on the behavior of panel-type MSE walls
- Landscape dynamics at borderlands: analysing land use changes from Southern Slovenia
- Effects of oil viscosity on waterflooding: A case study of high water-cut sandstone oilfield in Kazakhstan
- Special Issue: Alkaline-Carbonatitic magmatism
- Carbonatites from the southern Brazilian Platform: A review. II: Isotopic evidences
- Review Article
- Technology and innovation: Changing concept of rural tourism – A systematic review