Numerical simulation for the effects of waves and grain size on deltaic processes and morphologies
-
Yang Liu
 ,
Jun Wang
,
Jun Wang

Abstract
Currently, the sedimentation process concerning the formation of the morphological changes of deltas under the action of waves has received little attention. Two numerical simulations were carried out in this study to explore the sedimentary morphological changes of deltas under wave action. In the first experiment, the morphological characteristics of river-dominated deltas and wave-dominated deltas were compared. Results showed that a wave-dominated delta was more likely to produce slender and stable rivers relative to a river-dominated delta. In the second experiment, the morphologies of wave-dominated deltas with sediments of different grain sizes were compared. Results indicated that delta morphology was not significantly correlated with the median grain size (
1 Introduction
As a low, flat, and fertile land close to the river and the sea, a delta is rich in biological resources and provides favorable conditions for the development of agriculture, fishery, and aquaculture. Therefore, a delta in a climate-friendly area is usually a densely populated and economically developed area in a locale [1]. While deltas account for only 0.56% of the world’s total surface area, 4.1% of the world’s population live in deltas. The population living in deltas is estimated to increase from 237 million in 2000 to 322 million in 2020. The population living in some deltas, e.g., the Yangtze Delta (Shanghai, China), Zhujiang Delta (Guangzhou, China), Mississippi Delta (New Orleans, USA), and Niger Delta (Lagos, Nigeria), grows by 1.59% annually, which is higher than the world population growth rate of 1.11% [2]. In the case of the Nile Delta, there are 50 million people living in it, and the delta contains large cities such as Alexandria and Cairo.
Ancient delta deposits are highly valued because they possess abundant coal, oil, and natural gas. Because of petroleum geological exploration, many oil and gas fields have been found to be related to the sedimentation of deltas, most of which are large or extra-large. For instance, most of the oil and gas reservoirs in the Burgan oil field in Kuwait, the Maracaibo Basin in Venezuela, and the Bolivar Offshore Field are related to deltaic sedimentation [3,4,5,6,7,8]. Hence, studying the formation and evolution of deltas is of great importance in production and human development.
Great emphasis has been placed on studies of deltas, and research results have been fruitful. Delta morphology is mainly dominated by rivers, waves, and tides [9]. Studies have shown that the grain size of sediment also affects delta morphologies [10,11]. Since 2000, as a result of the improvement of computing power and the development of the fluid dynamics theory, geomorphology simulation using computers has been carried out extensively in geological studies. It has proven to be a feasible method for exploring the formation of river-dominated deltas using geomorphological numerical models based on physical models [12]. According to numerical simulations, shallow basins are more likely to form deltas whose branch channels are formed by sedimentation at mouth bars, such as the Wax Lake Delta in Louisiana, whereas deep basins are more likely to form deltas of the classic bird-foot shape [13]. Simulation results also indicated that sand-dominated deltas are more fan-shaped, whereas mud-dominated deltas are more bird-foot-shaped in planform [14]. According to a three-dimensional hydrodynamic numerical simulation, the hydrodynamic conditions in the upper reaches of the river control the planform of the delta, and the conditions in the lower reaches control the migration of the mouth bar and branch channels [15]. The number of branch channels in a delta is closely related to the flow of the river [12,16]. The hydrodynamic-based delta numerical simulation method has been widely applied in geological studies on deltas and has generated ample research results [17,18,19].
As a result of the complexity of sedimentary simulation and the duration of time required for computation, previous numerical simulations often excluded wave action. Although the sedimentary simulation of river-dominated deltas is already well-developed, there is much work to be done on the sedimentary numerical simulation of wave-dominated deltas.
The Mossy Delta, shown in Figure 1a, is located in Saskatchewan, Canada, with median grain-size D50 = 0.125 mm and Pm : Pr = 0.15 (the ocean energy Pm is equal to the sum of the square of the mean monthly maximum significant wave height and the square of the tidal height difference, the river energy
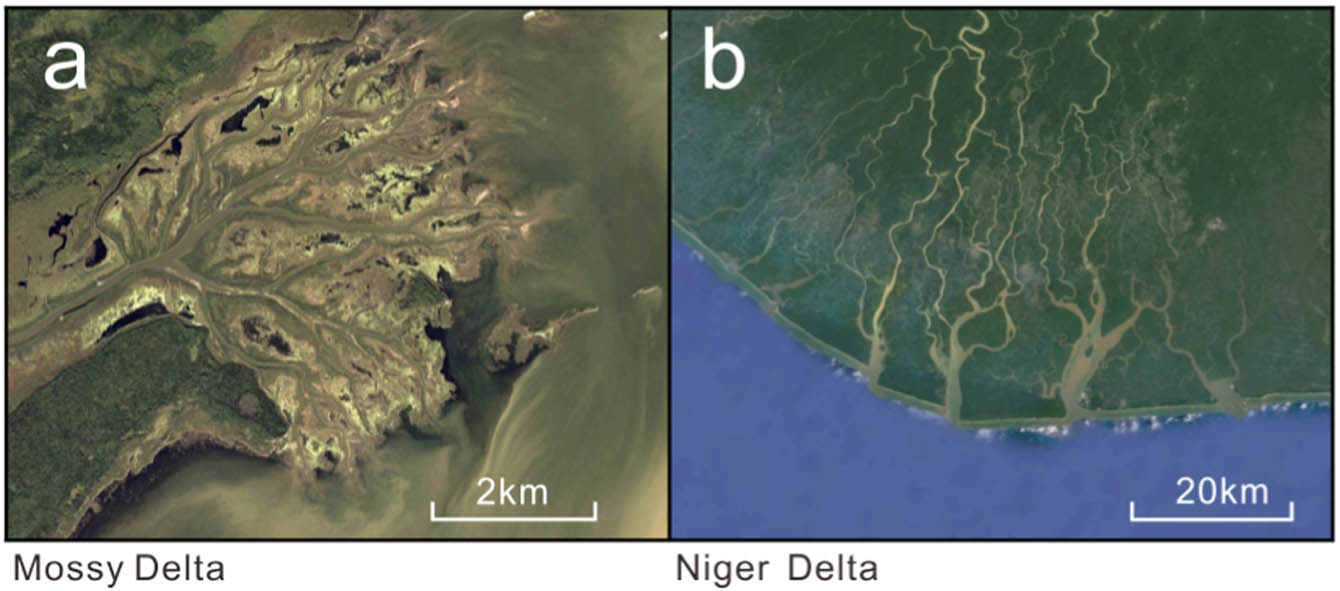
Different morphologies of deltas with similar D50 values under the effects of different wave energies. (a) Delta front with finger-like mouth bar. (b) Delta front with a smooth arcuate shape. Deltas were located in Saskatchewan, Canada (54°04′N, 102°21′W) (Figure 1a), and Nigeria (4°27N, 6°6′E) (Figure 1b). Images were obtained from Google Earth.
User-defined model parameters for runs in this study
| User-defined model parameters | Value | Units |
|---|---|---|
| Grid size | 200 × 150 | Cells |
| Cell size | 25 × 25 | m |
| Initial basin bed slope | 0.000375 | — |
| Initial channel dimensions (width × depth) | 250 × 2.5 | m |
| Upstream open boundary: incoming water discharge | 1,000 | m3 s−1 |
| Downstream open boundary: constant water surface elevation | 0 | m |
| Initial sediment layer thickness at bed | 5 | m |
| Subsurface stratigraphy bed layer thickness | 0.1 | m |
| Number of subsurface stratigraphy bed layers | 10 | — |
| Time step | 0.2 | min |
| Morphological scale factor | 175 | — |
| Spin-up interval before morphological updating begins | 360 | min |
| Spatially constant Chézy value for hydrodynamic roughness | 45 | |
| Factor for erosion of adjacent dry cells | 0.33 | — |
| Number of sediment fractions | 5 | — |
| Cohesive sediment critical shear stress for erosion ( | 1 | |
| Cohesive sediment critical shear stress for deposition ( | 1,000 | |
| Significant wave height | 1 | m |
| Peak period ( | 5 | s |
| Wave angle | 0 | deg |
Figure 2 shows images (from Google Earth) of several deltas affected by similar wave energy. According to the collected data, the deltas in Figure 2 are as follows: (a) median grain size
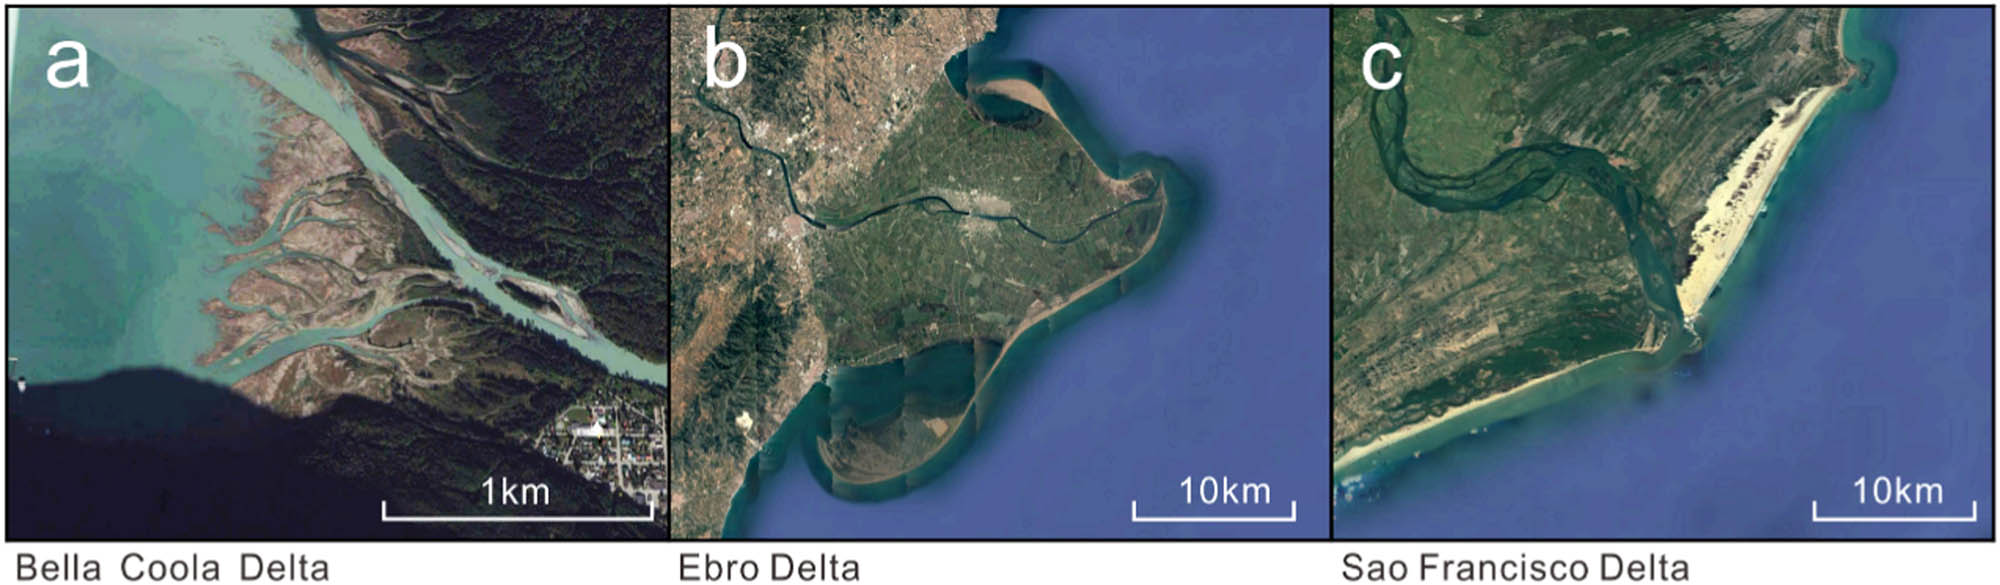
Different deltaic morphologies under similar wave conditions. Deltas were located at the Bella Coola Valley in British Columbia, Canada (52°22′N, 126°45′W) (a), the Iberian Peninsula, Spain (40°42′N, 0°42′E) (b), and Brazil (10°24′S, 36°29′W) (c). Images were obtained from Google Earth.
To investigate the combined effects of waves and grain size on morphologies of deltas, a new numerical simulation model was developed in this study. Two experiments were performed in this model: (1) with all the other conditions set the same, morphologies of deltas with and without wave action were compared. (2) Under fixed wave energy conditions, the effects of different grain sizes of the sediment on delta morphology were studied. This model quantitatively analyzes the development process of deltas and provides a new method for revealing the distribution of sand sediments.
2 Materials and methods
To fully reflect the process of deltaic sedimentation and establish its sedimentary model, the front-based computational fluid dynamics method was used in this study instead of the traditional behavior-based model, resulting in a so-called process-based model. This method comprehensively considers the influence of hydrodynamics on sedimentary grains, realizes the transport and erosion of sediments, and finally changes the landform under hydrodynamic conditions. The accuracy of this method has been verified by abundant numerical simulations [14,15,22,23,24].
Deflt3D is a hydrodynamic numerical simulation software that was developed by Delft Hydraulics in Delft, the Netherlands. Following the Navier–Stokes equation and adhering to sediment-transport rules and the Law of Conservation of Mass, the software describes the motion of sedimentary grains under hydrodynamic forces by solving the equations concerning the transport, sedimentation, and erosion of sediments. In this study, the simulation calculation process was completed using the Delft3D software, the post-processing of data was realized through C# programming, and the data were three-dimensionally displayed using the OpenGL method.
The transport of cohesive and non-cohesive suspended sediment is calculated by solving the depth-averaged version of the three-dimensionally advection-diffusion equation:
where
The sedimentation velocity of the non-cohesive sediments of fraction i
where g is the acceleration due to gravity (9.8 m/s2), si is the relative density of the sediment fraction
where
The erosion and sedimentation of cohesive sediments are calculated according to the method proposed by Partheniades [26]:
where
The waves were calculated using the Delft3D-wave, which uses the third-generation Simulating Waves Nearshore (SWAN) wave model in this study [27,28]. The wave model was developed based on the second-generation hindcasting of waves in shallow-water wave model [29]. Because of the completely implicit scheme that has been implemented, the wave computation in the SWAN wave model can be unconditionally stable, which greatly improves the computational efficiency. In the SWAN wave model, the evolution of the spectrum is represented by the spectral action balance equation, which is expressed in the Cartesian coordinates system as follows [30]:
where the term N is a function of
The transport of bedload is calculated by the method described by Van Rijn [34]:
where
As tide and deltaic deposits accumulate in the fluvial-to-marine transition zone, the seaward part of estuaries and deltas is subjected to tidal action that produces an alternation of landward-directed and seaward-directed tidal currents. And this area is one of the most complicated areas on earth, which results in a large number of terrestrial and marine processes [35]. Although we can achieve tidal effects by changing the water level and estuary flow direction, more research is needed on the accuracy of the simulation results. So the effects of tide are not considered in this study.
3 Numerical simulation of sedimentation
The same grid was used for all the simulation experiments. The grid consisted of 200 × 150 cells, each of which had a length and width of 25 m, and the simulated computational domain was a 5,000 m × 3,750 m basin with a bed slope of 0.000376 to the south (Figure 3). The thickness of the initial stratum was 5 m, and the grain size of the initial stratum was distributed as the same as the grain size of the sediment input in this simulation. Moreover, the spatially constant Chézy value for hydrodynamic roughness was 45. The water discharged into the basin was
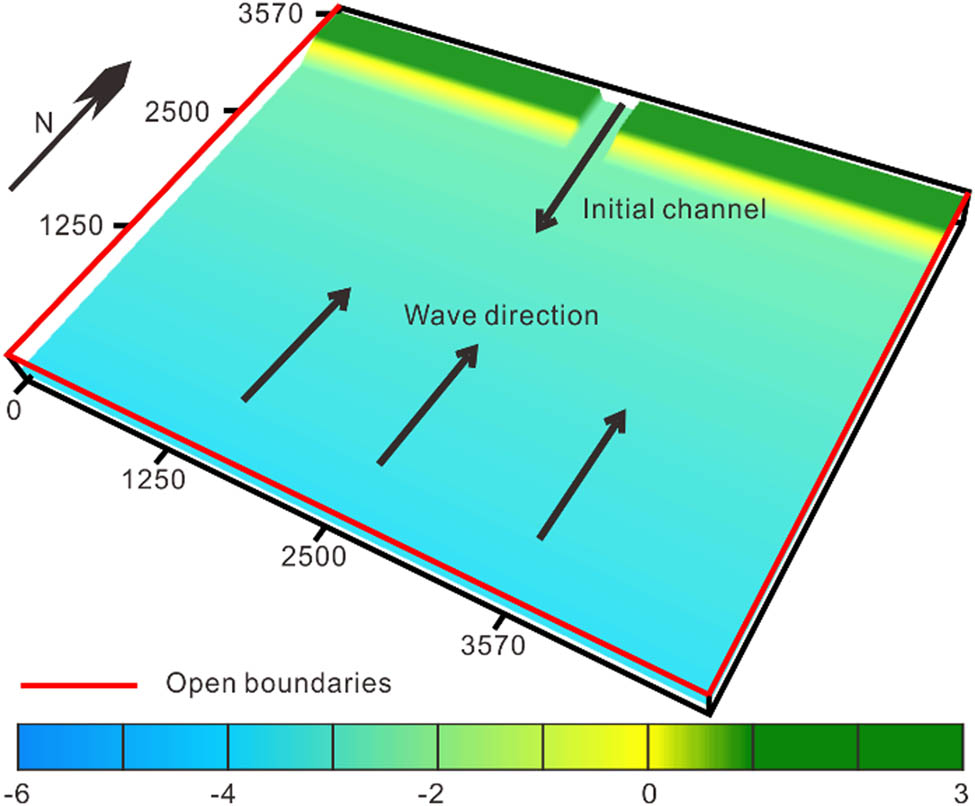
Numerical simulation of the initial model. The water surface was 0 m high, the initial river channel was in the north of the model, and the water and sediments entered the system from the north channel. If there were waves, the waves spread from south to north. The red line denotes an open boundary.
For a more realistic simulation of the input sediment, the grain size of the sediment input into the simulation system was assumed to be normally distributed. Since only discrete data can be input into the computer simulation system, the incoming sediment discharge was partitioned into five different sediment fractions during each model run (Figure 4a). By changing the standard deviation (
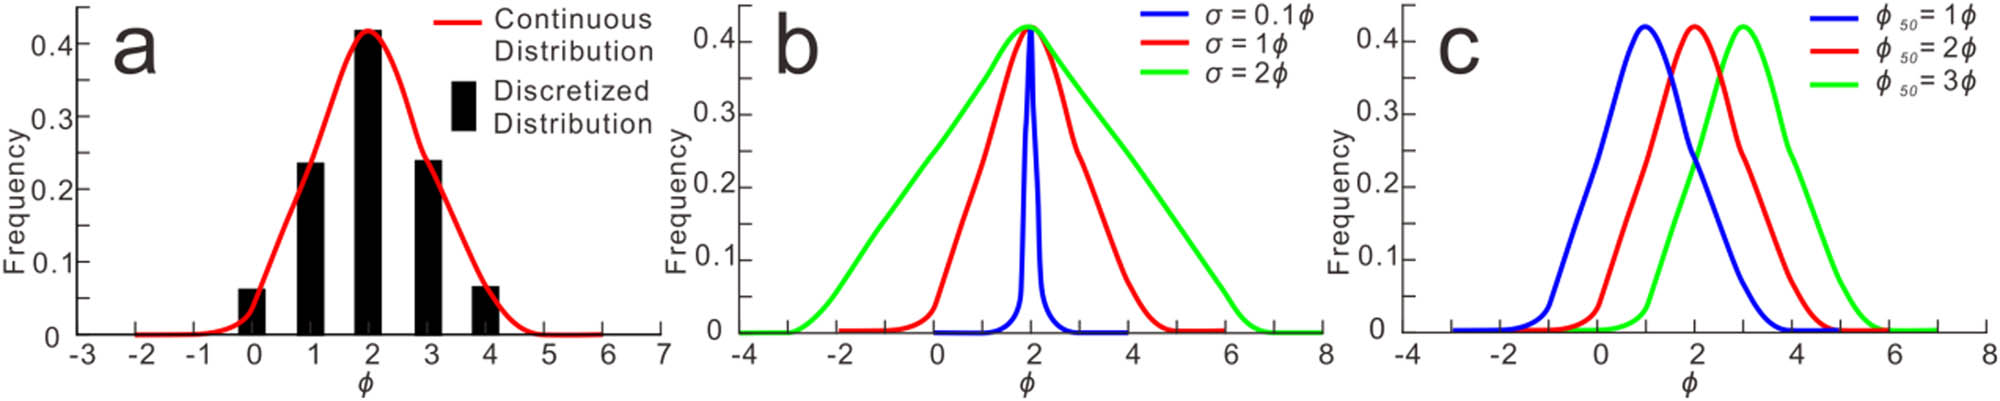
Example grain-size distributions. (a) The continuous grain-size distribution was discretized into five sediment fractions as denoted by the black rectangle, where
The Run ID in Simulation Experiment 1 was represented by the capital letter A. To reflect the difference between delta morphology with and without wave action, four experiments were designed for Simulation Experiment 1. The specific parameters are shown in Table 2, where A1 and A3 were not wave-dominated, and A2 and A4 were under the action of waves, and the parameters were the same; that is, the significant wave height was 1 m, the peak period (
Comparison of simulation parameters with and without wave action for this study
| Run ID | Wave | |||
|---|---|---|---|---|
| A1 | 0.5 | 1 | 2 | No |
| A2 | 0.5 | 1 | 2 | Yes |
| A3 | 0.125 | 3 | 2 | No |
| A4 | 0.125 | 3 | 2 | Yes |
The Run ID in Simulation Experiment 2 was denoted by the capital letter B. In order to reflect the influence of change in grain size of the sediment on delta morphology, nine experiments were designed in this study, the specific parameters of which are shown in Run ID B1–B9 in Table 3. Wave conditions were introduced in Run ID B1–B9 with the same parameters: the significant wave height was 1 m, the peak period (
Model run IDs and grain size boundary conditions for this study
| Run ID | % Cohesive | |||||
|---|---|---|---|---|---|---|
| B1 | 0.5 | 1 | 0.1 | 0.5236 | 0.9336 | 0 |
| B2 | 0.5 | 1 | 1 | 0.8066 | 0.31 | 1 |
| B3 | 0.5 | 1 | 2 | 1.2746 | −0.35 | 8 |
| B4 | 0.25 | 2 | 0.1 | 0.2643 | 1.92 | 0 |
| B5 | 0.25 | 2 | 1 | 0.3758 | 1.412 | 4 |
| B6 | 0.25 | 2 | 2 | 0.6598 | 0.6 | 20 |
| B7 | 0.125 | 3 | 0.1 | 0.1324 | 2.917 | 0 |
| B8 | 0.125 | 3 | 1 | 0.1961 | 2.35 | 19 |
| B9 | 0.125 | 3 | 2 | 0.3186 | 1.65 | 30 |
4 Results
The finite difference calculation method based on the principle of fluid dynamics was used in this study. The state of sediments in water was iteratively calculated in terms of time, and the action of waves on sedimentary grains was taken into consideration. The simulation only followed fluid dynamics and the patterns of transport, erosion, and deposit of sediments without adding any functional modules that affected the formation and abandonment of river channels or the formation of sand dams and shoals.
Three basic parameters of the delta at different times (i.e., the topset gradient, the number of channel mouths, and delta front rugosity) were monitored during the simulation process. These parameters will be explained and calculated later in this study. When all three parameters of delta morphology became stable, the delta had entered a stable state, and the time when the steady state appeared was at about two thirds of the total simulation time (Figure 5). Therefore, after the simulation of the time duration T, delta morphology was stable and was then analyzed.

Stability analysis of delta numerical simulation. (a) Average topset gradient becomes stable at 0.4 t/T. (b) Average number of channel mouths becomes stable at 0.6 t/T. (c) Delta front rugosity becomes stable at 0.6 t/T. For the sediments of all models,
4.1 Comparison of sedimentary simulation of deltas with and without the action of waves
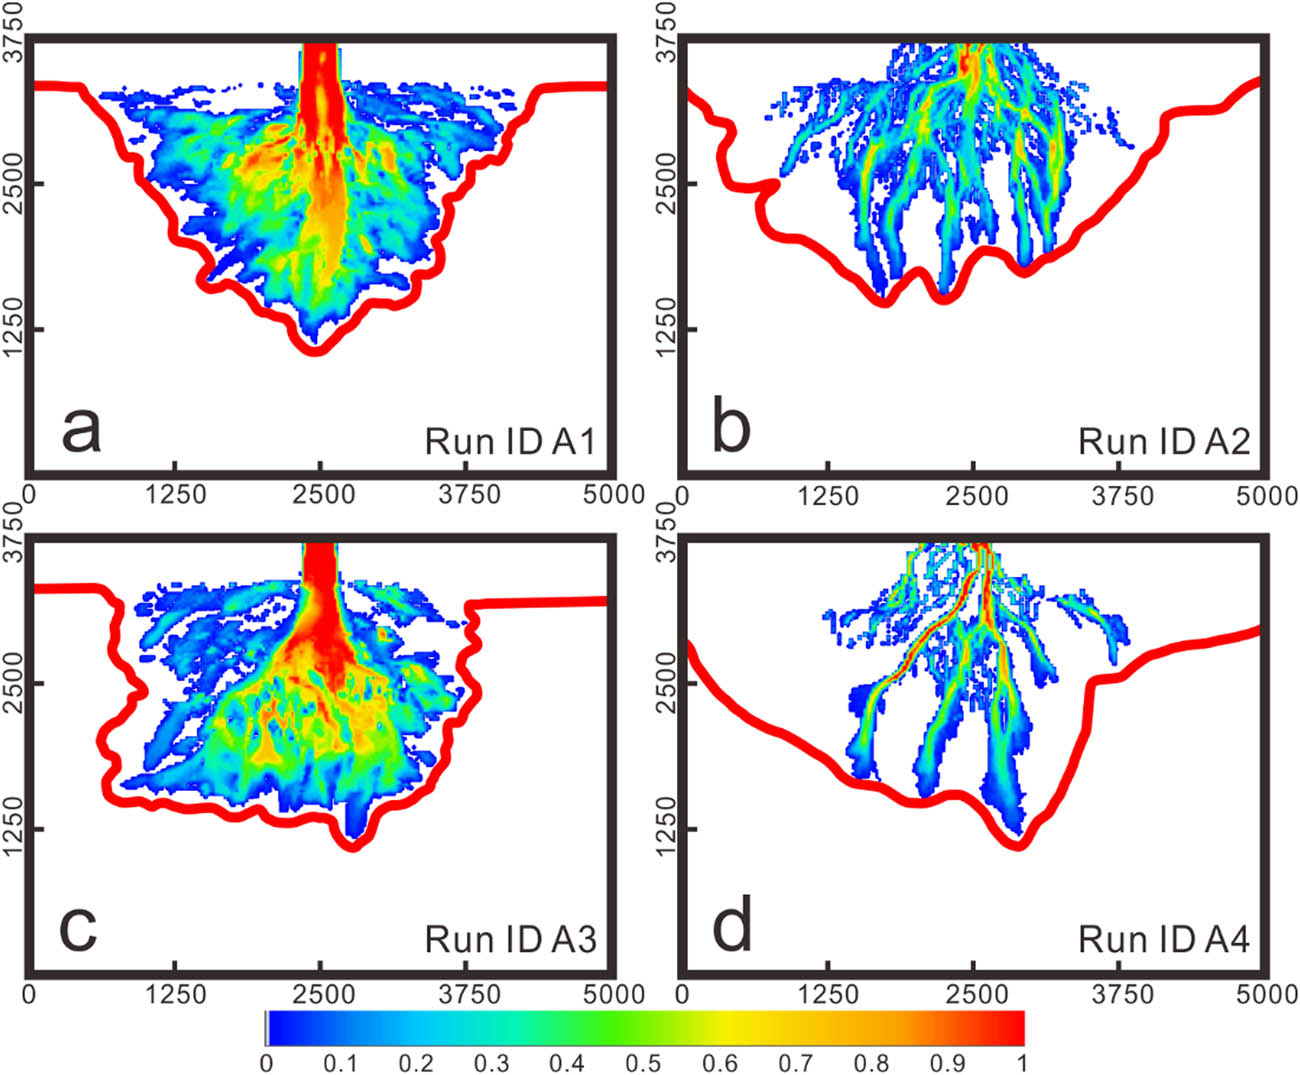
In Simulation Experiment 1, with two different median grain sizes as the inputs, the numerical simulation was carried out with and without wave action. Run IDs A1–A4 in Table 2 correspond to (a)–(d) in Figure 6. The sediment grain sizes shown in Figure 6a and b are both relatively coarse; those shown in Figure 6c and d are also the same, but are comparatively fine. The deltas in Figure 6a and c are river-dominated ones. Those in Figure 6b and d are wave-dominated deltas. It was evident that when there were waves, the number of river channels in the delta was reduced, and in terms of the number of river channels, the wave-dominated delta was more sensitive to changes in sediment grain size than was the river-dominated delta. The actual data of the Mossy Delta in Figure 1a and the Niger Delta in Figure 1b were applied as the simulation parameters in Figure 6c and d. Moreover, the morphologies of the deltas in Figure 6c and d were also close to the morphologies of deltas in Figure 1a and b, which verified the correctness of this wave simulation method.
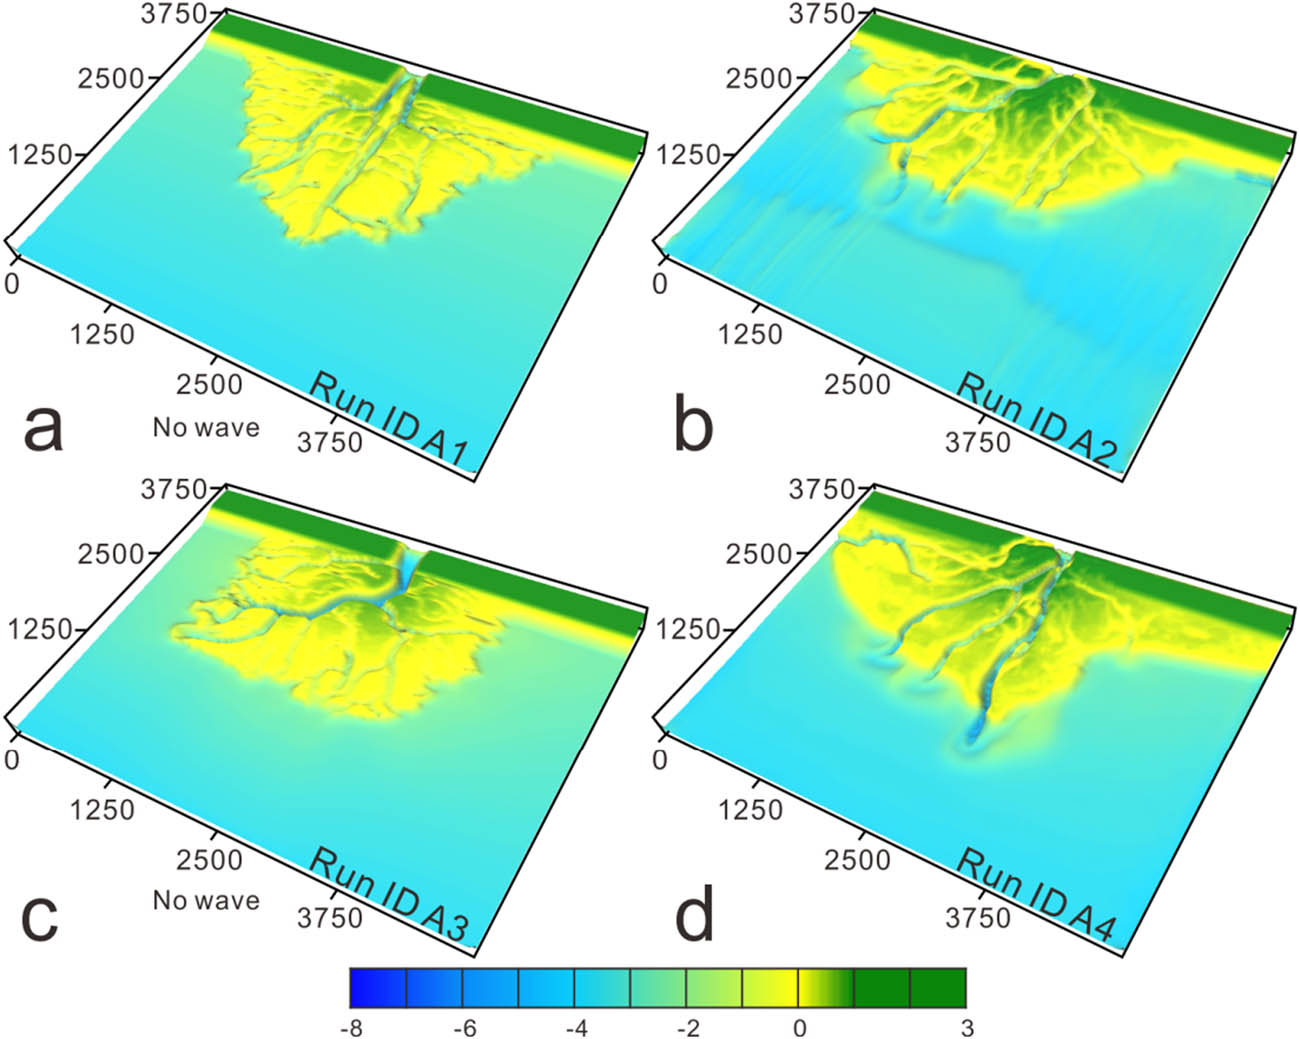
Comparative simulation of the delta with and without wave action. (a)–(d) Correspond to Run ID A1–A4 in Table 2. The grain size parameters were consistent for (a) and (b) (D50 = 0.5 mm,
As shown in Figure 6, once the delta was affected by the waves, not only did the delta morphology change but the distribution characteristics of the river channels changed as well. Because the delta in Figure 6 was the result from the simulation calculation, it could only statically display the distribution characteristics of the river channels. To study the variation of river channels over time during the development phase of the delta, we calculated how the area of active river channels (excluding the abandoned river channels) changed over time (Figure 7). The results showed that the area of the river channels without wave action increased more significantly over time than the area of the river channels with wave action.
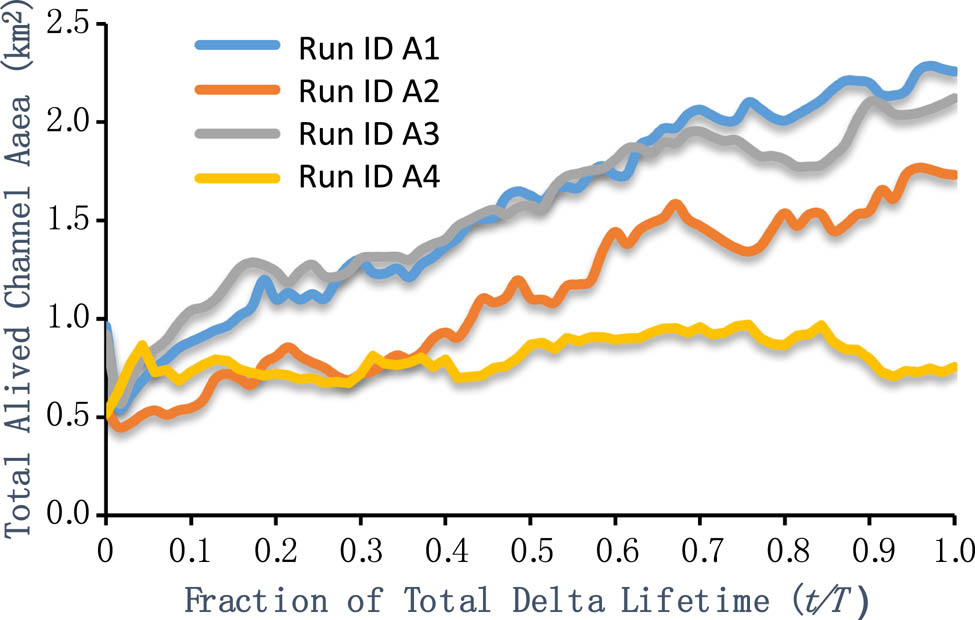
Total area of active river channels. The four curves in the figure indicate the change in the area of the river channels over time during the simulation of Run ID A1–A4. Without the action of waves, Run ID A1 and A3 (grey and blue lines) feature a relatively large slope; with the action of waves, Run ID A2 and A4 (red and yellow lines) feature a comparatively small slope
4.2 Comparison of sedimentary simulation of wave-dominated deltas with different sediment grain sizes
In Simulation Experiment 2, based on the nine sediments of different grain sizes input into the simulation system, the delta developed different morphological characteristics under wave action (Figure 8). Figure 8a–i correspond to Run ID B1–B9 in Table 3, from which we directly observed that the shape of the delta and the number of river channels varied significantly with the change in grain size distribution. Moreover, the deltas in Figure 8a, d, and g are quite similar to the three deltas in Figure 2. Therefore, if the causes of changes in delta morphology can be found, the reason for the different morphologies of deltas in Figure 2 can be explained.
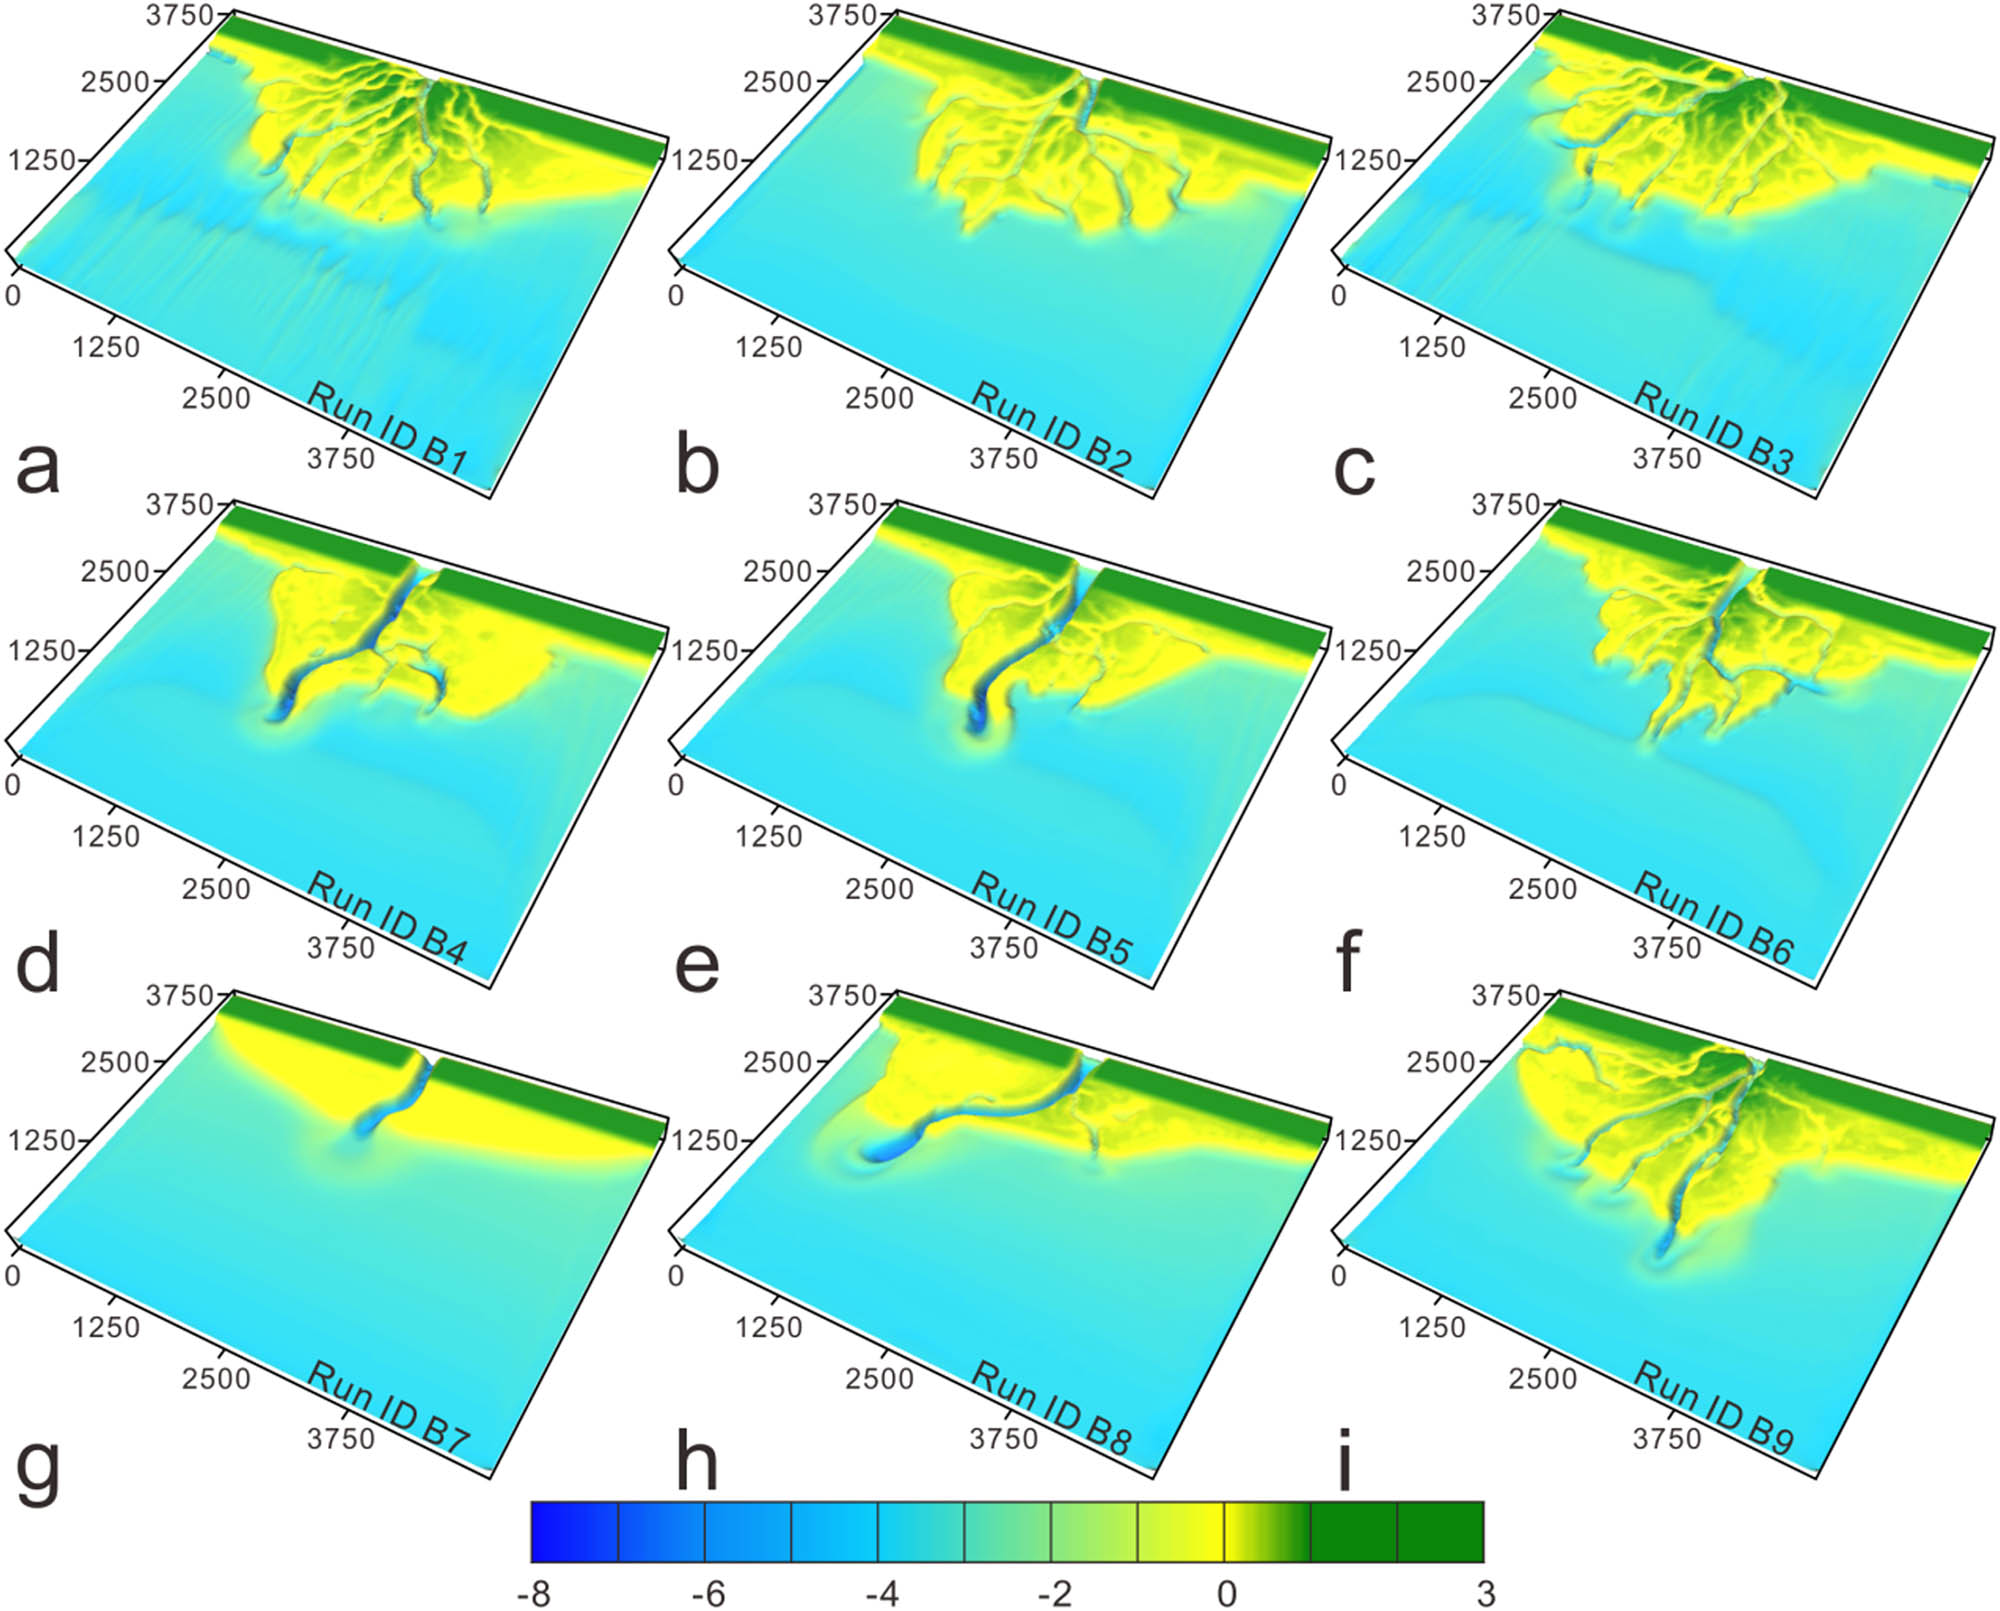
Simulation results of sediments with different grain-size distributions under constant wave action. (a)–(i) correspond to Run ID B1–B9 in Table 3. A total of 12,000 steps were involved in the computation, and the simulation time was about 8 years. The specific parameters of the waves are shown in Table 1.
To analyze the effects of sediment grain size on wave-dominated deltas, the morphological features of the deltas were quantified. For the simulation result of each delta, in addition to the three aforementioned basic parameters, i.e., topset gradient, number of channel mouths, and delta front rugosity, the delta shape was also calculated.
To calculate the topset gradient, the coastline in the model area was calculated first. The Opening–Angle method [42] was used in this study to describe the delta coastline. To calculate the coastline, we had to set the threshold value
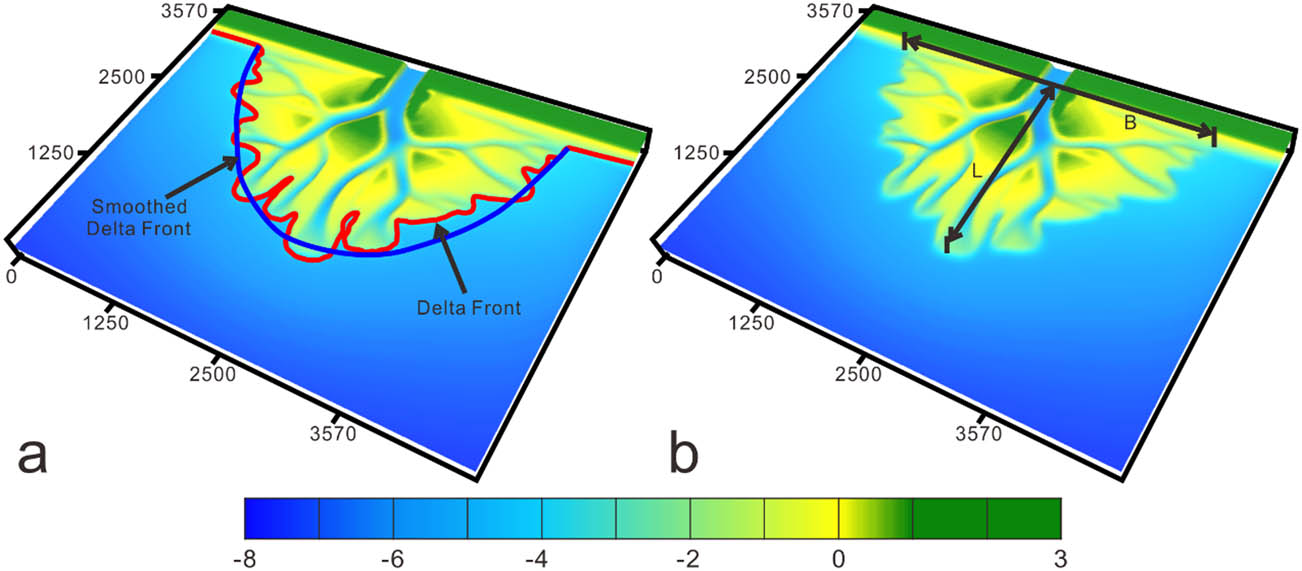
Property calculations for the delta simulation results. (a) Delta front rugosity and (b) delta shape; the deltas shown in (a) and (b) are the same, and the sediment lithology could be divided into two types: sandstone 0.1 mm and mudstone <0.064 mm, no waves. The rugosity value of this model ≈ 1.45, A ≈ 0.77.
A channel mouth was defined as a location where more than two channelized cells intersected the shoreline. As the value of
The value of delta front rugosity was mainly affected by the sand dam at the channel mouth. In this study, the contour line of 1 m underwater was used to describe the delta front rugosity. The contour line was obtained by simply processing the simulated morphological elevation data of the delta. A method similar to Gaussian filtering was used to process the delta front length (red line in Figure 9a), and the filtering window was 40 sampling points long. The delta front rugosity was the ratio of the delta front length to the smoothed delta front length (blue line in Figure 9a). The closer the delta front rugosity got to 1, the smoother the delta front was. If the delta front rugosity was much greater than 1, delta front was rougher. Similarly, as the value of
where A is the delta shape; B is the delta width, defined as the maximum beach-parallel distance across the delta shoreline; and L is the delta length, defined as the maximum beach-perpendicular distance (Figure 9b). When the A value was greater than 1, the long axis of the delta was parallel to its northern boundary. When the A value equaled 1, the delta was semicircular. Finally, when the A value was smaller than 1, the long axis of the delta was perpendicular to the northern boundary, and the rivers were slender. The simulation experiments showed that as the value of
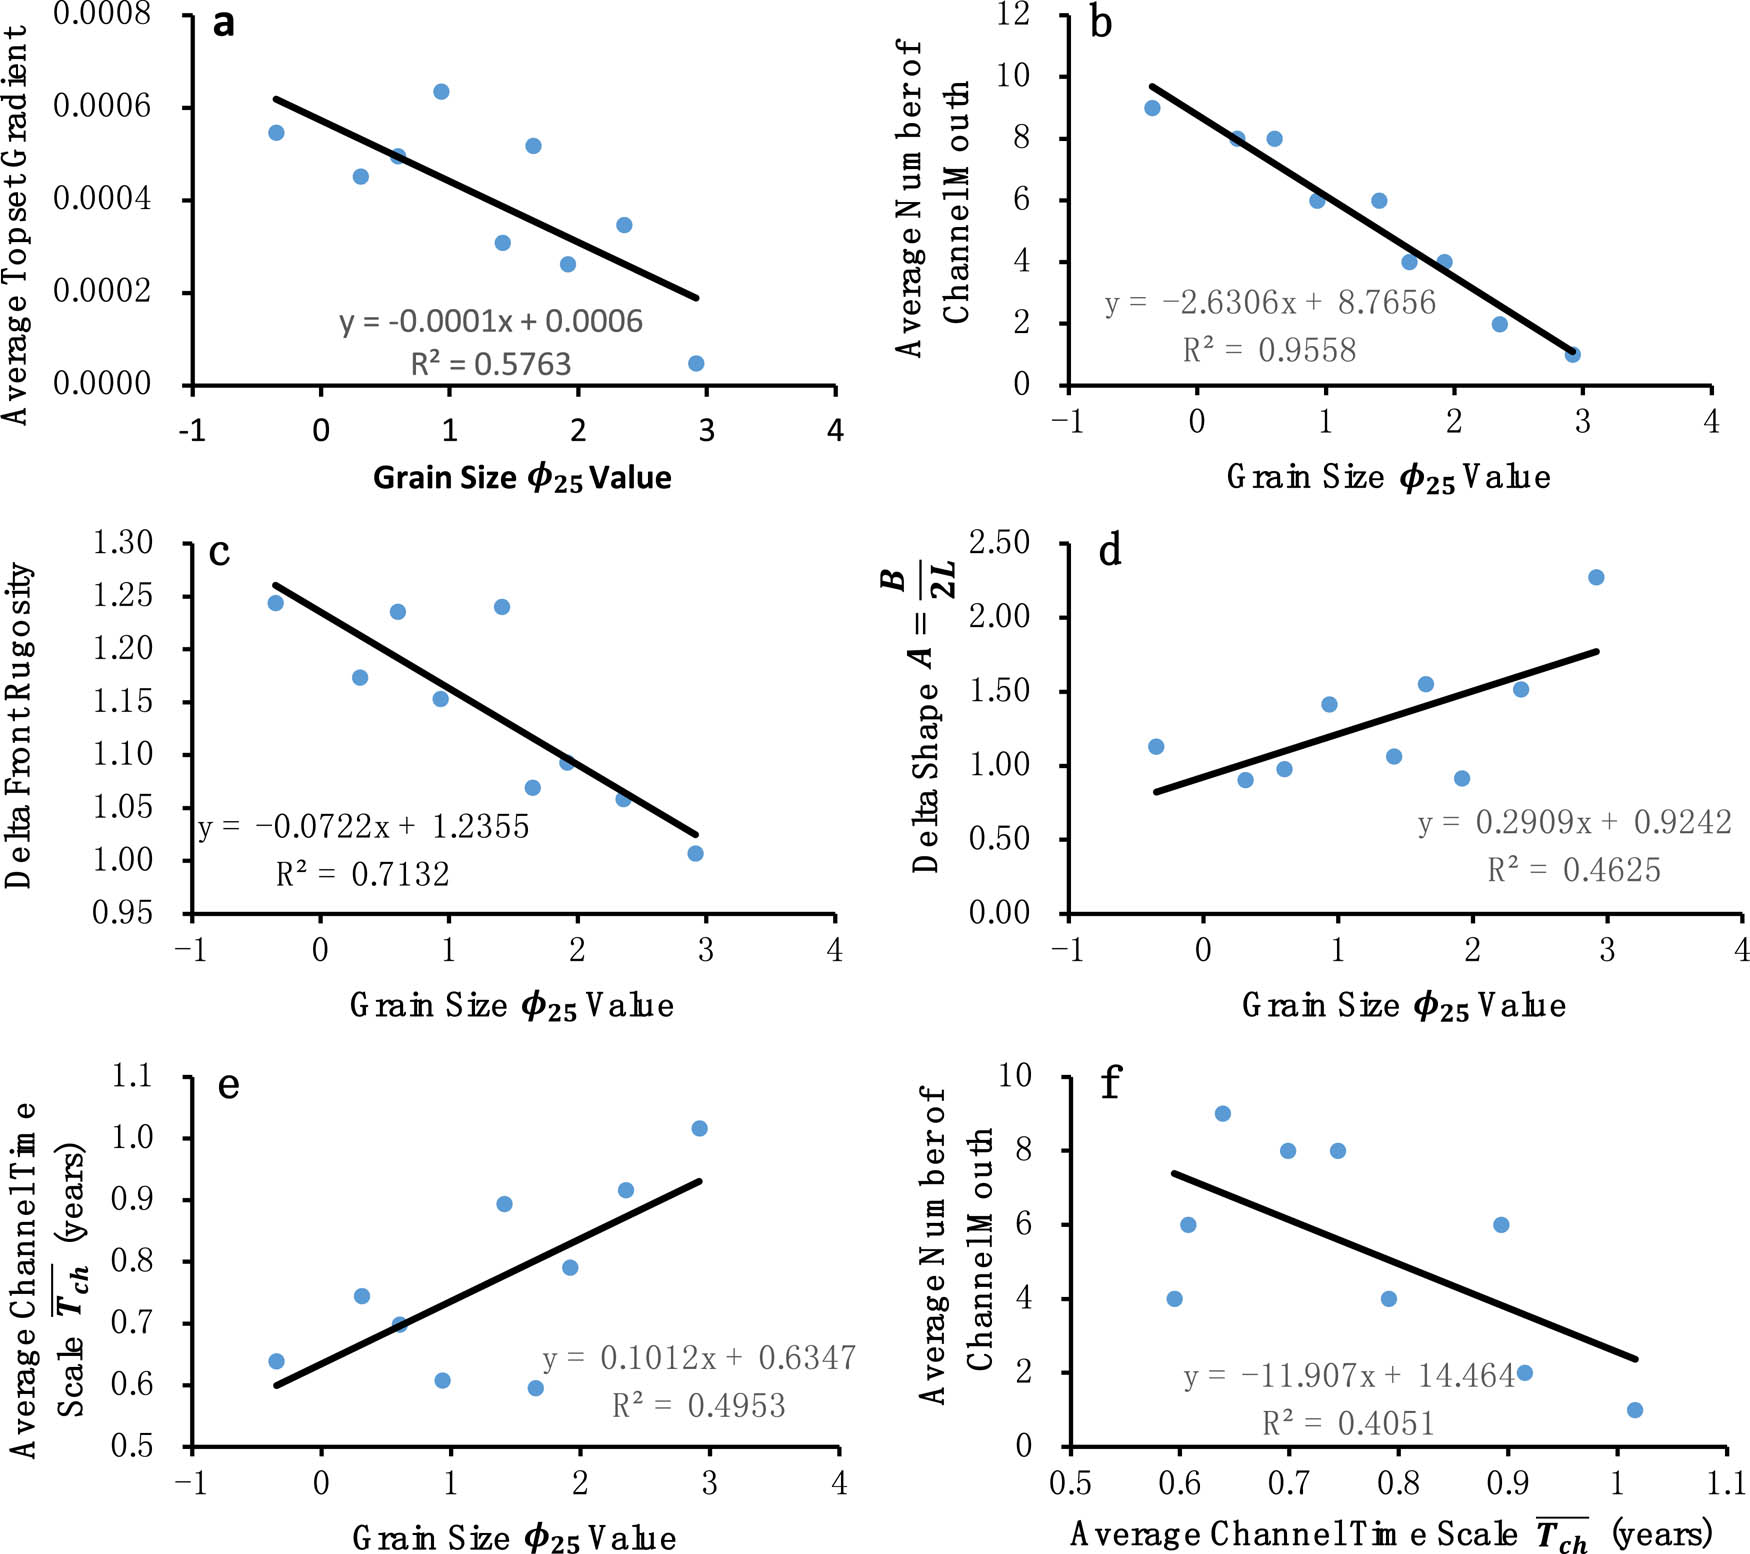
Relationship between delta morphological parameters,
5 Discussion
As detailed in the previous section, we observe a morphological transition in deltas as grain size increases and percent cohesive sediment changes. In this section, we explore how sediment properties create the observed variations in delta morphology when the delta is attacked by the wave.
First of all, the waves affect the delta deposition through the following hydrodynamic processes: (i) waves attacking the river mouth at an angle lead to a deflection of the river jet [43]; they change the jet direction on the river mouth and change the morphology of the mouth bar. (ii) The increase in bottom shear stresses due to waves results in a higher lateral spreading of the jet [44]; an increase in jet spreading produces a sharp decrease of jet velocity, favoring the deposition of the sediments. (iii) The waves increase the maximum shear stress close to the river mouth, maintaining sediment in suspension and transporting it farther away from the river mouth [45]. At last, we must declare that our simulations longshore transport is limited since we consider waves propagating on a small slope bottom. The surf zone is therefore hardly absent, and waves break only near the bar or the beach. So we cannot simulate deltas with strong longshore currents.
5.1 Influence of waves on delta channels
Simulation Experiment 1 consisted of Run ID A1–A4. Figure 6 shows the river-dominated delta (Run ID A1 and Run ID A3) and the wave-dominated delta (Run ID A2 and Run ID A4). Although the river-dominated deltas had different grain-size distributions, they shared a similar river channel distribution (Figure 6a and c), and it was the same case for the two wave-dominated deltas (Figure 6b and d). During the development of the wave-dominated delta, the total area of active river channels grew slowly (Run ID A2 and A4 in Figure 7), whereas the total area of active river channels that were not dominated by waves increased rapidly with time (Run ID A1 and A3 in Figure 7). Figure 7, which shows the changes in the area of active river channels over time, might be too abstract. To more intuitively reflect the influence of wave action on the delta channel, the total duration of river activity was projected on a plane to show the total activity duration of the delta channel (Figure 11). Figure 11a–d are Run IDA1–A4, respectively. The different colors in the figures denote the total activity duration of river channels in the delta during the simulation calculation. The river channels existed in the red area for a long time and existed in the blue area for a short time, but no river passes by the white area. Whether a river channel was active was determined by the water flow in the river channel. If the flow rate was greater than
Time of existence of river channels in the delta. (a)–(d) are time maps concerning the simulation computation of the active rivers Run ID A1–A4 river; (a)–(d) indicate the accumulation of active rivers in terms of time, where red indicates the time of existence of river channels and blue denotes the time period during which the river channels did not exist. The red lines in (a)–(d) represent the delta front.
In our opinion, the direction of the estuaries changes continuously as the delta grows when waves attack the river mouth at low angles, the jet spreading is the dominant process, higher jet spreading favors the deposition of sediments near the mouth, and the formation of a mouth bar. But, the shear stress controlled by the waves and jet has the opposite effect on sediment transport that resuspends and transports it farther away. In this way, the mouth bar has been damaged while being deposited, and the channel cannot branch, making the river channel stable and growing toward the sea. When wave incidence is persistently oblique to the river mouth, low bottom shear stresses favor the deposition of sediments close to the river mouth, likely forming a mouth bar. In particular, waves are perpendicular to the flow at high wave angles, the jet is completely deflected, and bottom shear stresses are low. Littoral drift redirects the sediment downdrift along the adjacent coast. At the river mouth, the side near the beach quickly accepts sediment, forming pronounced subaqueous levees which assume the form of broad shoals. Over time, the natural underwater levees into a delta plain, causing channels that were originally perpendicular to the waves to deflect towards the basin.
The average delta front slope in Run IDA1–A4 was calculated. The delta front slopes in Run IDA1 and A3 without wave action were relatively large, at 0.0942 and 0.0328, respectively. The delta front slopes in Run IDA2 and A4 under wave action were relatively small, at 0.0251 and 0.0061, respectively. This is because the larger the delta slope, the more likely that avulsion would occur. So we think that the slope is one of the reasons why the wave-dominated delta has fewer channels than the river-dominated delta.
5.2 Morphological differences between wave-dominated deltas with different sediment grain sizes
As shown in Simulation Experiment 2, delta morphology changed as the grain-size distribution changed. According to the data statistics,
5.2.1 Relationship between grain size and morphologies of deltas
Changes in delta morphology are associated with sedimentation and erosion. Sedimentation is related to the sedimentation velocity (
As indicated by the sedimentation simulation results, under wave action, the content of particles with a relatively large grain size in the sediments was the main factor controlling the topset gradient. Sediments with a smaller value of
Why do coarse-grained wave-controlled deltas have more channels than fine-grained wave-controlled deltas? To quantify channel mobility at the top of the delta, we calculated the average time scale
5.2.2 Different front sedimentation of wave-dominated deltas with different grain sizes
The planar shape of the delta is related to the channel mouth and waves on the coastline. In the simulation experiment, the diversion channel involved the following two situations: (1) avulse to a new location and (2) bifurcate at the mouth bar. Mouth bars are a key factor for delta front rugosity. Delta front rugosity is generated by the difference between the velocities of different parts of the delta. So why do coarse-grained wave-controlled deltas have rugose shape of the delta front with semicircular in planform and fine-grained deltas have smooth delta front with elongate in planform?
In most cases, delta front rugosity corresponds to the sedimentary form of the channel mouth. Although a non-channel mouth area is affected by waves and sedimentation, morphological changes in areas away from the channel mouth are milder than those at the channel mouth. Thus, the morphology in areas lacking channel mouths changes slowly. Near the channel mouth, when the sediment properties forming the delta had a comparatively small
Figure 12 shows part of Run ID B3, which evolved from a one-river channel (Figure 12a) to an avulsed channel coexisting with the original channel (Figure 12b). In the end, the original channel was abandoned and a new mouth bar originated from the avulsed channel (Figure 12c). In this mode, the delta formed a large number of mouth bars because of a large number of channel mouths, and the mouth bars caused the rugose shape of the delta front.
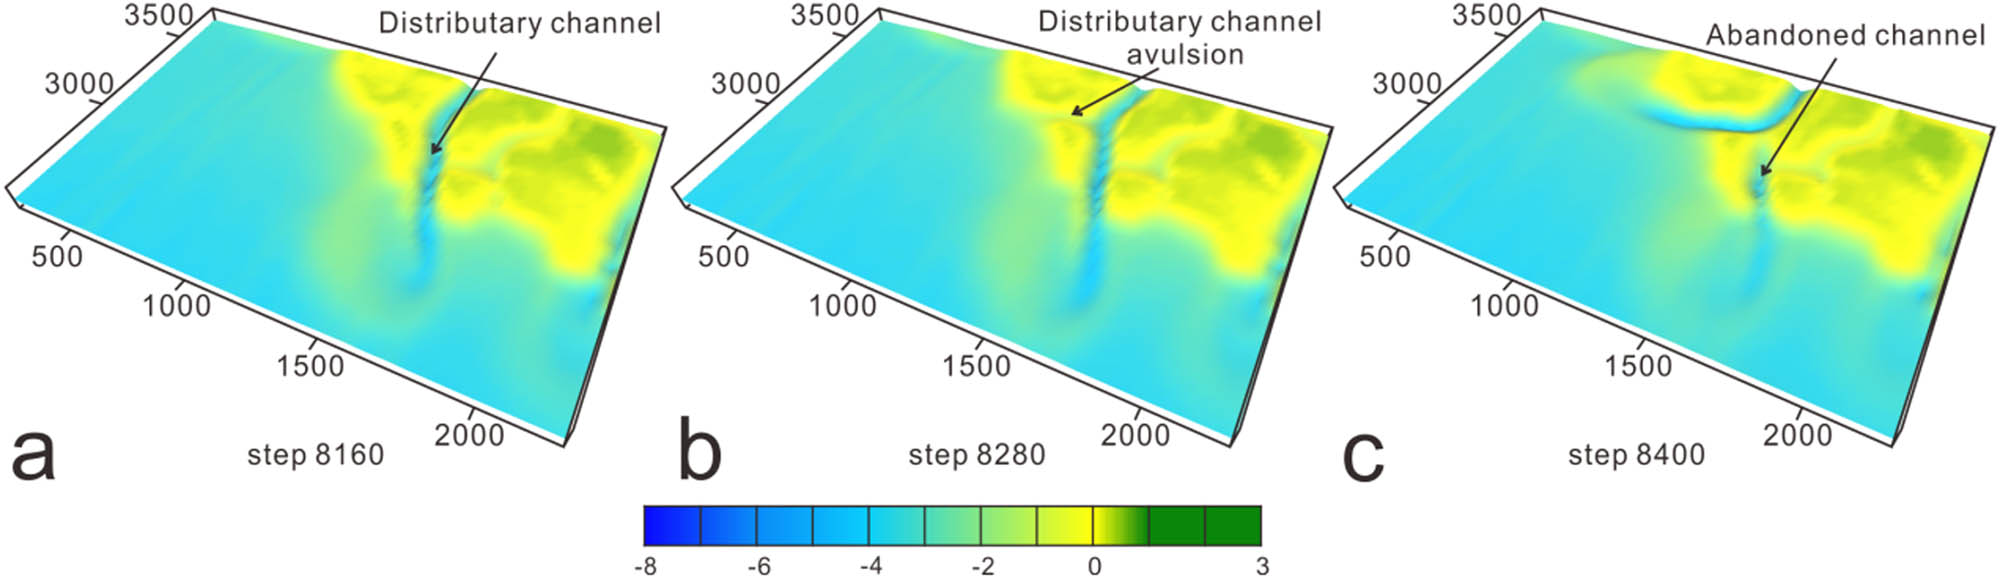
Formation of avulsed channels dominated by coarse-grained sediments in the delta front (the local part of Run ID B3). (a) step 8160, (b) step 8280 and (c) step 8400.
When the sediment had a relatively large
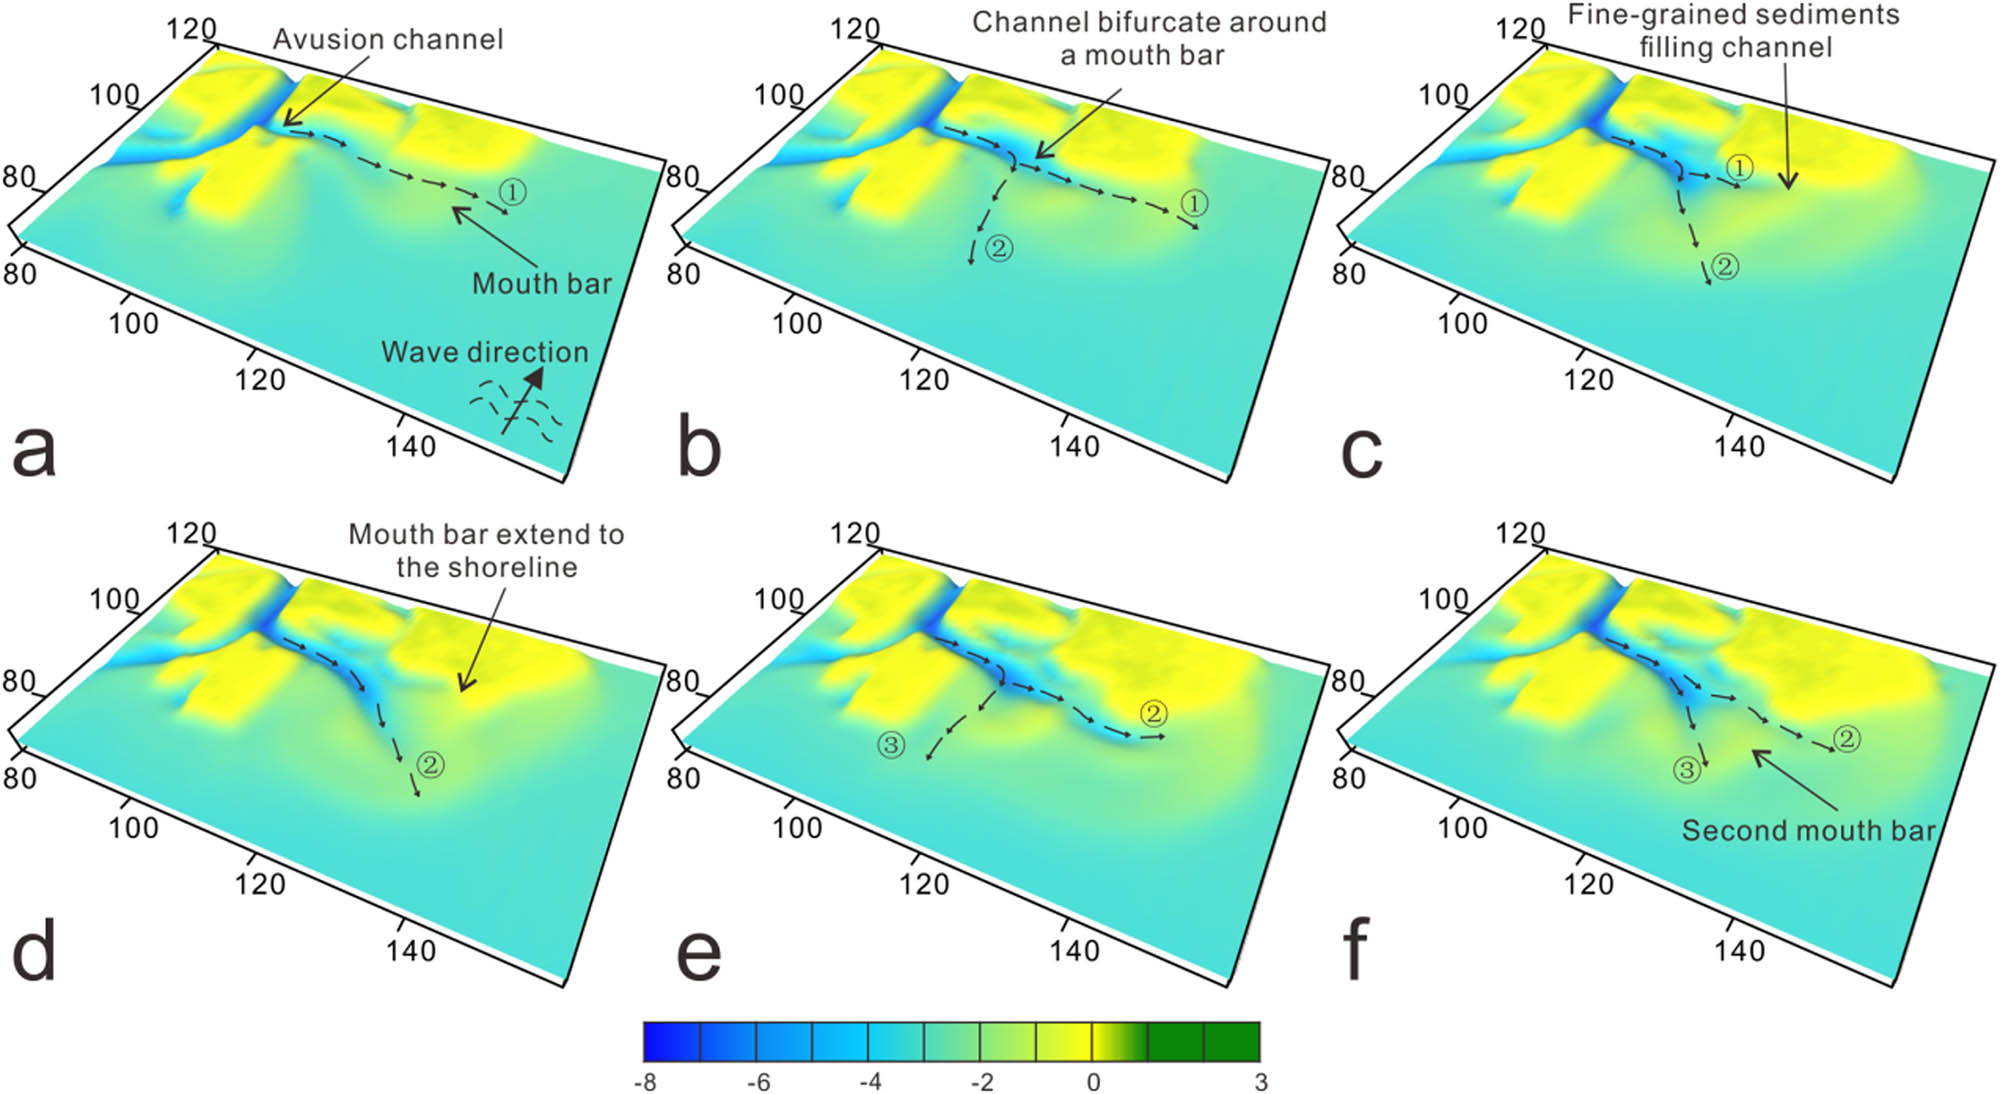
Wave-transformed mouth bar. The circled numbers (①–③) in the figure denote the secondary channels of the underwater diversion river, showing the part of Run ID B9. (a) step 3240, (b) step 3480, (c) step 3720, (d) step 3960, (e) step 4200 and (f) step 4440.
In addition, when the sediment had a comparatively small
6 Conclusions
According to Simulation Experiment 1, a smoother delta front and an unstable mouth bar were formed under wave action. Simulation Experiment 2 showed that because of changes in the grain size, the arcuate delta with a shallow gradient and stable channels turned into a semicircular delta with a steep gradient and many active channels. This morphological change occurred because the nature of the sediments determined the number of channels and the waves reshaped the sediments. Moreover, the
Affected by waves, the delta front tended to have a small gradient, resulting in the wave-dominated delta to have slender and stable river channels. Less impacted by waves, the river-dominated delta had a relatively large delta front gradient with frequent underwater diversion of channels and avulsed channels.
When
When
Acknowledgments
This research was funded by the National Natural Science Foundation of China (No. 41872109) and Open Fund of State Key Laboratory of Oil and Gas Reservoir Geology and Exploitation (Grant No. PLC20180507, Chengdu University of Technology). The authors are grateful to Dr Wenjian Jiang for his constructive suggestions on the numerical simulation models. The authors thank Dr Tengjiao Sun for reading earlier versions of the manuscript.
References
[1] Ericson JP, Vörösmarty CJ, Dingman SL, Ward LG, Meybeck M. Effective sea-level rise and deltas: causes of change and human dimension implications. Glob Planet Change. 2006;50:63–82.10.1016/j.gloplacha.2005.07.004Search in Google Scholar
[2] Edmonds D, Caldwell R, Baumgardner S, Paola C, Roy S, Nelson A, et al. A global analysis of human habitation on river deltas. EGU Gen Assembly Conf Abstr. 2017;19:10832.Search in Google Scholar
[3] Beydoun ZR. The petroleum resources of the Middle East: a review. J Pet Geol. 1986;9:5–27.10.1111/j.1747-5457.1986.tb00370.xSearch in Google Scholar
[4] Bockmeulen H, Barker C, Dickey PA. Geology and geochemistry of crude oils, Bolivar Coastal Fields, Venezuela1. AAPG Bull. 1983;67:242–70.Search in Google Scholar
[5] Carman GJ. Structural elements of onshore Kuwait. GeoArabia. 1996;1:239–66.10.2113/geoarabia0102239Search in Google Scholar
[6] Escalona A, Mann P. An overview of the petroleum system of Maracaibo Basin. AAPG Bull. 2006;90:657–78.10.1306/10140505038Search in Google Scholar
[7] Holland DS, Leedy JB, Lammlein DR. Eugene Island block 330 field – USA Offshore Louisiana. In: Stoneley R, editor. Structural Traps III: Tectonic Fold and Fault Traps. Tulsa, Oklahma, USA: American Association Of Petroleum Geologists; 1983. p. 1956–62.Search in Google Scholar
[8] Lewis RL, Dupuy, Jr. HJ. Eugene Island block 330 field – development and production history. J Pet Technol. 1983;35(11):1956–62.10.2118/10003-PASearch in Google Scholar
[9] Galloway WE. Process framework for describing the morphologic and stratigraphic evolution of deltaic depositional systems. In: Broussard ML, editor. Deltas. Models for Exploration. Houston Geol. Soc.; 1975. p. 87–98.Search in Google Scholar
[10] McPherson JG, Shanmugam G, Moiola RJ. Fan-deltas and braid deltas: varieties of coarse-grained deltas. GSA Bull. 1987;99:331–40.10.1130/0016-7606(1987)99<331:FABDVO>2.0.CO;2Search in Google Scholar
[11] Orton GJ, Reading HG. Variability of deltaic processes in terms of sediment supply, with particular emphasis on grain size. Sedimentology. 1993;40:475–512.10.1111/j.1365-3091.1993.tb01347.xSearch in Google Scholar
[12] Geleynse N, Storms JEA, Stive MJF, Jagers HRA, Walstra DJR. Modeling of a mixed-load fluvio-deltaic system. Geophys Res Lett. 2010;37(5):L05402. 10.1029/2009GL042000.Search in Google Scholar
[13] Storms JEA, Stive MJF, Roelvink DA, Walstra DJ. Initial morphologic and stratigraphic delta evolution related to Buoyant River plumes. Coast Sediment. 2007;7:736–48.10.1061/40926(239)56Search in Google Scholar
[14] Burpee AP, Slingerland RL, Edmonds DA, Parsons D, Best J, Cederberg J, et al. Grain-size controls on the morphology and internal geometry of river-dominated deltas. J Sediment Res. 2015;85:699–714.10.2110/jsr.2015.39Search in Google Scholar
[15] Edmonds DA, Slingerland RL. Significant effect of sediment cohesion on delta morphology. Nat Geosci. 2010;3:105–9.10.1038/ngeo730Search in Google Scholar
[16] Geleynse N, Storms JEA, Walstra D-JR, Jagers HRA, Wang ZB, Stive MJF. Controls on river delta formation; insights from numerical modelling. Earth Planet Sci Lett. 2011;302:217–26.10.1016/j.epsl.2010.12.013Search in Google Scholar
[17] Edmonds DA, Slingerland RL. Mechanics of river mouth bar formation: implications for the morphodynamics of delta distributary networks. J Geophys Res Earth Surf. 2007;112(F2):F02034. 10.1029/2006JF000574.Search in Google Scholar
[18] Edmonds DA, Slingerland RL. Stability of delta distributary networks and their bifurcations. Water Resour Res. 2008;44(9):W09426. 10.1029/2008WR006992.Search in Google Scholar
[19] Jerolmack DJ. Conceptual framework for assessing the response of delta channel networks to Holocene sea level rise. Quaternary Sci Rev. 2009;28:1786–800.10.1016/j.quascirev.2009.02.015Search in Google Scholar
[20] Syvitski JPM, Saito Y. Morphodynamics of deltas under the influence of humans. Glob Planet Change. 2007;57:261–82.10.1016/j.gloplacha.2006.12.001Search in Google Scholar
[21] Caldwell RL, Edmonds DA. The effects of sediment properties on deltaic processes and morphologies: a numerical modeling study. J Geophys Res Earth Surf. 2014;119:961–82.10.1002/2013JF002965Search in Google Scholar
[22] Lesser GR, Roelvink JA, van Kester JATM, Stelling GS. Development and validation of a three-dimensional morphological model. Coast Eng. 2004;51:883–915.10.1016/j.coastaleng.2004.07.014Search in Google Scholar
[23] Schuurman F, Kleinhans MG. Bar dynamics and bifurcation evolution in a modelled braided sand-bed river. Earth Surf Process Landf. 2015;40:1318–33.10.1002/esp.3722Search in Google Scholar
[24] Schuurman F, Marra WA, Kleinhans MG. Physics-based modeling of large braided sand-bed rivers: bar pattern formation, dynamics, and sensitivity. J Geophys Res Earth Surf. 2013;118:2509–27.10.1002/2013JF002896Search in Google Scholar
[25] Van Rjin L. Principles of sediment transport in rivers. Amsterdam: Estuaries and Coastal Seas Aqua Publications; 1993.Search in Google Scholar
[26] Partheniades E. Erosion and deposition of cohesive soils. J Hydraul Div. 1965;91:105–39.10.1061/JYCEAJ.0001165Search in Google Scholar
[27] Booij N, Ris RC, Holthuijsen LH. A third-generation wave model for coastal regions: 1. Model description and validation. J Geophys Res Oceans. 1999;104:7649–66.10.1029/98JC02622Search in Google Scholar
[28] Ris RC, Holthuijsen LH, Booij N. A third-generation wave model for coastal regions: 2. Verification. J Geophys Res Ocean. 1999;104:7667–81.10.1029/1998JC900123Search in Google Scholar
[29] Holthuijsen LH, Booij N, Herbers THC. A prediction model for stationary, short-crested waves in shallow water with ambient currents. Coast Eng. 1989;13:23–54.10.1016/0378-3839(89)90031-8Search in Google Scholar
[30] Hasselmann K, Barnett T, Bouws E, Carlson H, Cartwright DE, Enke K, et al. Measurements of wind-wave growth and swell decay during the Joint North Sea Wave Project (JONSWAP). Hamburg: Deutches Hydrographisches Institut; 1973.Search in Google Scholar
[31] Dingemans MW. Water wave propagation over uneven bottoms. Singapore: World Scientific; 1997.10.1142/1241-part1Search in Google Scholar
[32] Mei CC. The applied dynamics of ocean surface waves. Ocean Eng. 1984;11:321.10.1016/0029-8018(84)90033-7Search in Google Scholar
[33] Whiteman GB. Linear and Nonlinear Waves, vol. 26(11). Toronto: John Wiley & Sons; 2011. p. 498–8.10.1088/0031-9112/26/11/028Search in Google Scholar
[34] van Rijn LC, Walstra DJR, Grasmeijer B, Sutherland J, Pan S, Sierra JP. The predictability of cross-shore bed evolution of sandy beaches at the time scale of storms and seasons using process-based profile models. Coast Eng. 2003;47:295–327.10.1016/S0378-3839(02)00120-5Search in Google Scholar
[35] Dalrymple RW, Choi K. Morphologic and facies trends through the fluvial–marine transition in tide-dominated depositional systems: a schematic framework for environmental and sequence-stratigraphic interpretation. Earth-Sci Rev. 2007;81:135–74.10.1016/j.earscirev.2006.10.002Search in Google Scholar
[36] Dingemans MW, Radder A, De Vriend H. Computation of the driving forces of wave-induced currents. Coast Eng. 1987;11:539–63.10.1016/0378-3839(87)90026-3Search in Google Scholar
[37] Dean RG, Dalrymple RA. Water wave mechanics for engineers and scientists. Singapore: World Scientific Publishing Company; 1991.10.1142/1232Search in Google Scholar
[38] Fredsøe J, Deigaard R. Mechanics of coastal sediment transport. Singapore: World Scientific; 1992.10.1142/1546Search in Google Scholar
[39] Deigaard R, Fredsøe J, Hedegaard IB. Suspended sediment in the surf zone. J Waterway Port Coastal Ocean Eng. 1986;112:115–28.10.1061/(ASCE)0733-950X(1986)112:1(115)Search in Google Scholar
[40] Soulsby RL, Davies AG, Fredsøe J, Huntley DA, Jonnson IG, Myrhaug D, et al. Bed shear-stresses due to combined waves and currents. Abstracts-in-depth of the Marine Science and Technology G8-M overall workshop. Grenoble; 1993. p. 2.1–1–2.1–4.Search in Google Scholar
[41] Folk RL. Petrology of sedimentary rocks. Austin, Texas, United States (USA): Hemphill Pub. Comp; 1974.Search in Google Scholar
[42] Shaw JB, Wolinsky MA, Paola C, Voller VR. An image-based method for shoreline mapping on complex coasts. Geophys Res Lett. 2008;35(12):L12405. 10.1029/2008GL033963Search in Google Scholar
[43] Ashworth PJ, Best JL, Jones M. Relationship between sediment supply and avulsion frequency in braided rivers. Geology. 2004;32:21–4.10.1130/G19919.1Search in Google Scholar
[44] Bryant M, Falk P, Paola C. Experimental study of avulsion frequency and rate of deposition. Geology. 1995;23:365–8.10.1130/0091-7613(1995)023<0365:ESOAFA>2.3.CO;2Search in Google Scholar
[45] Nardin W, Fagherazzi S. The effect of wind waves on the development of river mouth bars. Geophys Res Lett. 2012;39:191–204.10.1029/2012GL051788Search in Google Scholar
© 2020 Yang Liu et al., published by De Gruyter
This work is licensed under the Creative Commons Attribution 4.0 International License.
Articles in the same Issue
- Regular Articles
- The simulation approach to the interpretation of archival aerial photographs
- The application of137Cs and210Pbexmethods in soil erosion research of Titel loess plateau, Vojvodina, Northern Serbia
- Provenance and tectonic significance of the Zhongwunongshan Group from the Zhongwunongshan Structural Belt in China: insights from zircon geochronology
- Analysis, Assessment and Early Warning of Mudflow Disasters along the Shigatse Section of the China–Nepal Highway
- Sedimentary succession and recognition marks of lacustrine gravel beach-bars, a case study from the Qinghai Lake, China
- Predicting small water courses’ physico-chemical status from watershed characteristics with two multivariate statistical methods
- An Overview of the Carbonatites from the Indian Subcontinent
- A new statistical approach to the geochemical systematics of Italian alkaline igneous rocks
- The significance of karst areas in European national parks and geoparks
- Geochronology, trace elements and Hf isotopic geochemistry of zircons from Swat orthogneisses, Northern Pakistan
- Regional-scale drought monitor using synthesized index based on remote sensing in northeast China
- Application of combined electrical resistivity tomography and seismic reflection method to explore hidden active faults in Pingwu, Sichuan, China
- Impact of interpolation techniques on the accuracy of large-scale digital elevation model
- Natural and human-induced factors controlling the phreatic groundwater geochemistry of the Longgang River basin, South China
- Land use/land cover assessment as related to soil and irrigation water salinity over an oasis in arid environment
- Effect of tillage, slope, and rainfall on soil surface microtopography quantified by geostatistical and fractal indices during sheet erosion
- Validation of the number of tie vectors in post-processing using the method of frequency in a centric cube
- An integrated petrophysical-based wedge modeling and thin bed AVO analysis for improved reservoir characterization of Zhujiang Formation, Huizhou sub-basin, China: A case study
- A grain size auto-classification of Baikouquan Formation, Mahu Depression, Junggar Basin, China
- Dynamics of mid-channel bars in the Middle Vistula River in response to ferry crossing abutment construction
- Estimation of permeability and saturation based on imaginary component of complex resistivity spectra: A laboratory study
- Distribution characteristics of typical geological relics in the Western Sichuan Plateau
- Inconsistency distribution patterns of different remote sensing land-cover data from the perspective of ecological zoning
- A new methodological approach (QEMSCAN®) in the mineralogical study of Polish loess: Guidelines for further research
- Displacement and deformation study of engineering structures with the use of modern laser technologies
- Virtual resolution enhancement: A new enhancement tool for seismic data
- Aeromagnetic mapping of fault architecture along Lagos–Ore axis, southwestern Nigeria
- Deformation and failure mechanism of full seam chamber with extra-large section and its control technology
- Plastic failure zone characteristics and stability control technology of roadway in the fault area under non-uniformly high geostress: A case study from Yuandian Coal Mine in Northern Anhui Province, China
- Comparison of swarm intelligence algorithms for optimized band selection of hyperspectral remote sensing image
- Soil carbon stock and nutrient characteristics of Senna siamea grove in the semi-deciduous forest zone of Ghana
- Carbonatites from the Southern Brazilian platform: I
- Seismicity, focal mechanism, and stress tensor analysis of the Simav region, western Turkey
- Application of simulated annealing algorithm for 3D coordinate transformation problem solution
- Application of the terrestrial laser scanner in the monitoring of earth structures
- The Cretaceous igneous rocks in southeastern Guangxi and their implication for tectonic environment in southwestern South China Block
- Pore-scale gas–water flow in rock: Visualization experiment and simulation
- Assessment of surface parameters of VDW foundation piles using geodetic measurement techniques
- Spatial distribution and risk assessment of toxic metals in agricultural soils from endemic nasopharyngeal carcinoma region in South China
- An ABC-optimized fuzzy ELECTRE approach for assessing petroleum potential at the petroleum system level
- Microscopic mechanism of sandstone hydration in Yungang Grottoes, China
- Importance of traditional landscapes in Slovenia for conservation of endangered butterfly
- Landscape pattern and economic factors’ effect on prediction accuracy of cellular automata-Markov chain model on county scale
- The influence of river training on the location of erosion and accumulation zones (Kłodzko County, South West Poland)
- Multi-temporal survey of diaphragm wall with terrestrial laser scanning method
- Functionality and reliability of horizontal control net (Poland)
- Strata behavior and control strategy of backfilling collaborate with caving fully-mechanized mining
- The use of classical methods and neural networks in deformation studies of hydrotechnical objects
- Ice-crevasse sedimentation in the eastern part of the Głubczyce Plateau (S Poland) during the final stage of the Drenthian Glaciation
- Structure of end moraines and dynamics of the recession phase of the Warta Stadial ice sheet, Kłodawa Upland, Central Poland
- Mineralogy, mineral chemistry and thermobarometry of post-mineralization dykes of the Sungun Cu–Mo porphyry deposit (Northwest Iran)
- Main problems of the research on the Palaeolithic of Halych-Dnister region (Ukraine)
- Application of isometric transformation and robust estimation to compare the measurement results of steel pipe spools
- Hybrid machine learning hydrological model for flood forecast purpose
- Rainfall thresholds of shallow landslides in Wuyuan County of Jiangxi Province, China
- Dynamic simulation for the process of mining subsidence based on cellular automata model
- Developing large-scale international ecological networks based on least-cost path analysis – a case study of Altai mountains
- Seismic characteristics of polygonal fault systems in the Great South Basin, New Zealand
- New approach of clustering of late Pleni-Weichselian loess deposits (L1LL1) in Poland
- Implementation of virtual reference points in registering scanning images of tall structures
- Constraints of nonseismic geophysical data on the deep geological structure of the Benxi iron-ore district, Liaoning, China
- Mechanical analysis of basic roof fracture mechanism and feature in coal mining with partial gangue backfilling
- The violent ground motion before the Jiuzhaigou earthquake Ms7.0
- Landslide site delineation from geometric signatures derived with the Hilbert–Huang transform for cases in Southern Taiwan
- Hydrological process simulation in Manas River Basin using CMADS
- LA-ICP-MS U–Pb ages of detrital zircons from Middle Jurassic sedimentary rocks in southwestern Fujian: Sedimentary provenance and its geological significance
- Analysis of pore throat characteristics of tight sandstone reservoirs
- Effects of igneous intrusions on source rock in the early diagenetic stage: A case study on Beipiao Formation in Jinyang Basin, Northeast China
- Applying floodplain geomorphology to flood management (The Lower Vistula River upstream from Plock, Poland)
- Effect of photogrammetric RPAS flight parameters on plani-altimetric accuracy of DTM
- Morphodynamic conditions of heavy metal concentration in deposits of the Vistula River valley near Kępa Gostecka (central Poland)
- Accuracy and functional assessment of an original low-cost fibre-based inclinometer designed for structural monitoring
- The impacts of diagenetic facies on reservoir quality in tight sandstones
- Application of electrical resistivity imaging to detection of hidden geological structures in a single roadway
- Comparison between electrical resistivity tomography and tunnel seismic prediction 303 methods for detecting the water zone ahead of the tunnel face: A case study
- The genesis model of carbonate cementation in the tight oil reservoir: A case of Chang 6 oil layers of the Upper Triassic Yanchang Formation in the western Jiyuan area, Ordos Basin, China
- Disintegration characteristics in granite residual soil and their relationship with the collapsing gully in South China
- Analysis of surface deformation and driving forces in Lanzhou
- Geochemical characteristics of produced water from coalbed methane wells and its influence on productivity in Laochang Coalfield, China
- A combination of genetic inversion and seismic frequency attributes to delineate reservoir targets in offshore northern Orange Basin, South Africa
- Explore the application of high-resolution nighttime light remote sensing images in nighttime marine ship detection: A case study of LJ1-01 data
- DTM-based analysis of the spatial distribution of topolineaments
- Spatiotemporal variation and climatic response of water level of major lakes in China, Mongolia, and Russia
- The Cretaceous stratigraphy, Songliao Basin, Northeast China: Constrains from drillings and geophysics
- Canal of St. Bartholomew in Seča/Sezza: Social construction of the seascape
- A modelling resin material and its application in rock-failure study: Samples with two 3D internal fracture surfaces
- Utilization of marble piece wastes as base materials
- Slope stability evaluation using backpropagation neural networks and multivariate adaptive regression splines
- Rigidity of “Warsaw clay” from the Poznań Formation determined by in situ tests
- Numerical simulation for the effects of waves and grain size on deltaic processes and morphologies
- Impact of tourism activities on water pollution in the West Lake Basin (Hangzhou, China)
- Fracture characteristics from outcrops and its meaning to gas accumulation in the Jiyuan Basin, Henan Province, China
- Impact evaluation and driving type identification of human factors on rural human settlement environment: Taking Gansu Province, China as an example
- Identification of the spatial distributions, pollution levels, sources, and health risk of heavy metals in surface dusts from Korla, NW China
- Petrography and geochemistry of clastic sedimentary rocks as evidence for the provenance of the Jurassic stratum in the Daqingshan area
- Super-resolution reconstruction of a digital elevation model based on a deep residual network
- Seismic prediction of lithofacies heterogeneity in paleogene hetaoyuan shale play, Biyang depression, China
- Cultural landscape of the Gorica Hills in the nineteenth century: Franciscean land cadastre reports as the source for clarification of the classification of cultivable land types
- Analysis and prediction of LUCC change in Huang-Huai-Hai river basin
- Hydrochemical differences between river water and groundwater in Suzhou, Northern Anhui Province, China
- The relationship between heat flow and seismicity in global tectonically active zones
- Modeling of Landslide susceptibility in a part of Abay Basin, northwestern Ethiopia
- M-GAM method in function of tourism potential assessment: Case study of the Sokobanja basin in eastern Serbia
- Dehydration and stabilization of unconsolidated laminated lake sediments using gypsum for the preparation of thin sections
- Agriculture and land use in the North of Russia: Case study of Karelia and Yakutia
- Textural characteristics, mode of transportation and depositional environment of the Cretaceous sandstone in the Bredasdorp Basin, off the south coast of South Africa: Evidence from grain size analysis
- One-dimensional constrained inversion study of TEM and application in coal goafs’ detection
- The spatial distribution of retail outlets in Urumqi: The application of points of interest
- Aptian–Albian deposits of the Ait Ourir basin (High Atlas, Morocco): New additional data on their paleoenvironment, sedimentology, and palaeogeography
- Traditional agricultural landscapes in Uskopaljska valley (Bosnia and Herzegovina)
- A detection method for reservoir waterbodies vector data based on EGADS
- Modelling and mapping of the COVID-19 trajectory and pandemic paths at global scale: A geographer’s perspective
- Effect of organic maturity on shale gas genesis and pores development: A case study on marine shale in the upper Yangtze region, South China
- Gravel roundness quantitative analysis for sedimentary microfacies of fan delta deposition, Baikouquan Formation, Mahu Depression, Northwestern China
- Features of terraces and the incision rate along the lower reaches of the Yarlung Zangbo River east of Namche Barwa: Constraints on tectonic uplift
- Application of laser scanning technology for structure gauge measurement
- Calibration of the depth invariant algorithm to monitor the tidal action of Rabigh City at the Red Sea Coast, Saudi Arabia
- Evolution of the Bystrzyca River valley during Middle Pleistocene Interglacial (Sudetic Foreland, south-western Poland)
- A 3D numerical analysis of the compaction effects on the behavior of panel-type MSE walls
- Landscape dynamics at borderlands: analysing land use changes from Southern Slovenia
- Effects of oil viscosity on waterflooding: A case study of high water-cut sandstone oilfield in Kazakhstan
- Special Issue: Alkaline-Carbonatitic magmatism
- Carbonatites from the southern Brazilian Platform: A review. II: Isotopic evidences
- Review Article
- Technology and innovation: Changing concept of rural tourism – A systematic review