Research on the size effect of roughness on rock uniaxial compressive strength and characteristic strength
-
Gaojian Hu
 ,
Yu Li
,
Yu Li

Abstract
The joint roughness has an influence on the uniaxial compressive strength (UCS) and characteristic strength of the rock, but the relationship of the influence is yet to be obtained. In this article, the influence of the size of the rock with rough joints on the UCS and the influence of the size effect of roughness on the UCS are studied by establishing 11 sets of numerical simulation schemes, a total of 30 working conditions. The stress–strain curve law of rocks with different roughness and sizes is analyzed, and the relationship between UCS and the size of rock with rough joints, joint roughness coefficient (JRC), is respectively proposed. Mathematical models of rock characteristic size of UCS, characteristic strength of the rock, and JRC are established, respectively.
1 Introduction
Under the influence of complex geological action, the rock will form structural surfaces with different geometric states, such as joints, bedding, and faults. Among them, joints are widespread in the rock, and the joints will reduce the strength of the rock. Joint roughness coefficient (JRC) is a key factor affecting the mechanical properties of rocks. Rock has a size effect. Because of the existence of joints, the size effect of the rock will be different. These differences may be affected by JRC.
Uniaxial compressive strength (UCS) is one of the mechanical properties of compressive strength (CS), and the CS has a size effect. Therefore, it is critical to understand the relationship between CS and rock size during rock engineering-related projects. For example, Masoumi [1] analyzed those different types of rock by generally following the trend of size effect and found that increasing rock size will reduce rock strength. Usol tseva and Tsoi [2] presented the results of the experimental study of the influence of sizes effect on the strength of samples of hornfels, limestone, sandstone, siltstone, and ore-bearing rocks. Huang et al. [3] provided a method to study the relationship between rock mass mechanical parameters and size. Some scholars, such as Long-Long et al. [4], Wang et al. [5], and Fu [6], have conducted research on the size effect of UCS for different types of rock through indoor uniaxial compression tests. Some scholars have studied the influence of different height–diameter ratios on the mechanical properties of rock. For example, Zhang et al. [7] used Particle Flow Code 2D (PFC2D) to study the influence of different height-to-diameter ratios on rock mechanical properties. Li et al. [8] studied the effect of length and diameter ratio on rock mechanical behavior under dynamic and static compression. The above content mainly studies the size effect of UCS, and seldom considers the influence of JRC on the size effect of UCS. The mathematical model of UCS and JRC and size has not been established.
The size effect of UCS is generally developed by rock samples of different sizes, and it is mostly studied by laboratory tests and numerical simulations. Some scholars have studied the size effect of UCS through laboratory tests. Wu et al. [9] studied the size effect of rocks in a small size range (20–50 mm in diameter). Wang et al. [10] studied the size effect of the strength of large-sized (400 mm × 400 mm × 800 mm) rock through laboratory tests. However, the size of the rock studied in the laboratory is too small to be used in engineering practice. As the size of the rock increases, the instruments for laboratory tests cannot meet the requirements of large-scale rock research. Therefore, the numerical simulation has better applicability compared with the laboratory tests. Some scholars used numerical simulation to study the size effect of CS. Wang and Xiao-Yia [11] based on the rock fracture process analysis system, realistic failure process analysis (RFPA3D), performed two different uniaxial compression numerical simulation tests on five groups of samples. Dongping et al. [12] simulated the CS of different rock sizes through Universal Distinct Element Code (UDEC) and obtained the law of CS changing with size. Luo et al. [13] conducted numerical simulation experiments on three different boundary conditions through RFPA and found that the UCS decreases with the increase of the rock size. Tian et al. [14] conducted numerical simulation experiments of different rock sizes through RFPA2D. The mentioned scholars earlier also conducted research on the size effect of rock strength. Through comparative analysis, it can be concluded that the operability of numerical simulation is stronger, and the scope of application is wider. However, the study of the size effect of JRC on rock strength is rarely involved, and the mathematical model of UCS and JRC and rock size has not been established.
The roughness of the joint affects the UCS of the rock. Some scholars have studied the influence of JRC on the UCS of rock through laboratory uniaxial compression experiments. Asadizadeha et al. [15] studied the effect of JRC on the UCS of non-persistent joint blocks. Wang et al. [16] and Basker and Madhavan [17] have obtained through laboratory uniaxial compression experiments that the JRC will affect the UCS of the rock. Some scholars have also studied the influence of JRC on the CS of rock through laboratory triaxial compression experiments. Sheng-Qi et al. [18] obtained through the triaxial compression experiment that as the JRC increases, the triaxial compression strength also increases. Aminpure and Moomivand [19] studied the influence of continuous roughness on rock strength under triaxial compression stress. Some scholars have studied the effect of JRC on CS through numerical simulation experiments. Cao et al. [20] studied the strength and failure behavior of jointed rock specimens under uniaxial loading. Numerical simulation can make up for the shortcomings of laboratory experiments. The feasibility of numerical simulation is proved by comparing the results of laboratory tests and numerical simulation experiments. Chaohui [21] conducted uniaxial compression tests to study the deformation characteristics and crack evolution laws of jointed rock masses with different JRC through laboratory tests and numerical simulations. Whether using laboratory uniaxial compression tests or numerical simulations, it is more conducive to engineering practice to study the influence of JRC on rock strength and deformation. The previous content is mainly to study the influence of JRC on the CS of rock. However, the influence of rock size on the CS of rough jointed rock is hardly involved, and the relationship between CS of rock and JRC and size has not been obtained.
A large number of studies have found that when the volume of the rock increases to a certain value, the mechanics parameters and strength of the rock no longer change with the increase in volume, that is, the characteristic size. Some scholars used numerical simulations to determine the characteristic size of the UCS of rock. Liang et al. [22] used numerical simulations to determine the representative elemental volume (REV) size as 14 m × 14 m. Laghaei et al. [23] used numerical simulations to determine the REV of rock mass deformation in 3D. Some scholars obtained the characteristic size of the UCS of rock by analyzing the block angle. Xia et al. [24] analyzed the REV of rock from a massive perspective. Qingfa et al. [25] revealed the relationship between rock mass geometry and mechanical size effect from the perspective of rock mass spatial structure and determined the geometric characteristic size of fractured rock mass. Determining the size of the REV is the key to studying the real mechanical parameters of the rock. Scholars also studied the characteristic size of rocks by compression tests. Wang et al. [26] conducted uniaxial compression tests on granite, and finally estimated that the size of REV of the rock mass was 9 m × 9 m. Sun et al. [27] studied the size effect of elastic modulus in different directions of the layered jointed rock mass to determine its typical unit size. Ma et al. [28] obtained through three-axis numerical simulation that the mechanical strength parameters of rock masses change with the size. When the size reaches or exceeds 4 m × 4 m × 8 m, it tends to be stable. However, these documents use compression tests to determine the characteristic size, and the mathematical model of CS and characteristic size of UCS has not been established.
The strength under the characteristic size can be called the characteristic strength. Huang and Li [29] compared the fitting function of the characteristic strength curve obtained by the numerical simulation and the laboratory test and got the conclusion that the results of the numerical simulation and the laboratory test are similar. As there are few research on characteristic strength, further research on characteristic strength is needed. Obtaining the size effect of rock strength and the law of JRC on rock strength are of great help to engineering applications.
This article mainly studies the influence of (i) the size of the rock with rough joints on the UCS and (ii) the JRC on the size effect of the UCS by using RFPA and numerical simulations. The size effect relationship of UCS is obtained by analyzing the stress–strain curve of rock failure. The relationship between (i) UCS and the size of the rock with rough joints, (ii) UCS and JRC, (iii) the characteristic size of UCS and JRC, and (iv) rock characteristic strength and JRC is studied by establishing mathematical models.
2 Establishment of numerical model
The software used in this simulation is RFPA, which is a numerical calculation method for simulating inhomogeneous materials developed based on finite-element theory and statistical damage theory. This method accounts for the non-uniformity and randomness of materials and combines the statistical distribution assumptions of material properties into the finite-element method. It is assumed that the mechanical properties of discretized meso-primitives obey a certain statistical distribution law, thereby establishing the relationship between the meso-medium and macro-medium mechanical properties. The method is described by the Weibull statistical distribution function, whose formula is
where α is the basic mechanical parameter of the material medium (e.g., elastic modulus, strength, Poisson’s ratio, weight), α 0 is the average value of α, m is the property parameter of the distribution function, whose physical meaning reflects the uniformity of the material medium, and φ(α) is the statistical distribution density of the material elementary mechanical property.
2.1 Numerical simulation program and model establishment
The focus of numerical simulation is the influence of (i) the size of the rough-joint rock on the UCS and (ii) the JRC on the size effect of the UCS. Five sets of numerical simulation schemes with roughness values of 1.6, 2.6, 3.6, 4.6, and 5.6 were established to study the relationship between UCS and rock size. Each set of simulation schemes included six size working conditions, the sizes were 200 mm × 200 mm, 400 mm × 400 mm, 600 mm × 600 mm, 800 mm × 800 mm, 1,000 mm × 1,000 mm, and 1,200 mm × 1,200 mm. Six numerical simulation schemes with the rock size of 200 mm × 200 mm, 400 mm × 400 mm, 600 mm × 600 mm, 800 mm × 800 mm, 1,000 mm × 1,000 mm, and 1,200 mm × 1,200 mm were established to study the relationship between UCS and JRC. Each set of simulation schemes included five joint roughness working conditions. The joint roughness is 1.6, 2.6, 3.6, 4.6, and 5.6. The numerical simulation schemes are given in Table 1.
Combination of JRC and rock size
| Numerical simulation | Joint roughness | Combination of JRC and rock size | |||||
|---|---|---|---|---|---|---|---|
| Program 6 | Program 7 | Program 8 | Program 9 | Program 10 | Program 11 | ||
| Size 200 mm | Size 400 mm | Size 600 mm | Size 800 mm | Size 1,000 mm | Size 1,200 mm | ||
| Program 1 | 1.6 | 1.6 × 200 | 1.6 × 400 | 1.6 × 600 | 1.6 × 800 | 1.6 × 1,000 | 1.6 × 1,200 |
| Program 2 | 2.6 | 2.6 × 200 | 2.6 × 400 | 2.6 × 600 | 2.6 × 800 | 2.6 × 1,000 | 2.6 × 1,200 |
| Program 3 | 3.6 | 3.6 × 200 | 3.6 × 400 | 3.6 × 600 | 3.6 × 800 | 3.6 × 1,000 | 3.6 × 1,200 |
| Program 4 | 4.6 | 4.6 × 200 | 4.6 × 400 | 4.6 × 600 | 4.6 × 800 | 4.6 × 1,000 | 4.6 × 1,200 |
| Program 5 | 5.6 | 5.6 × 200 | 5.6 × 400 | 5.6 × 600 | 5.6 × 800 | 5.6 × 1,000 | 5.6 × 1,200 |
This numerical simulation contains two aspects of research content. Research content 1 is the influence of size on the UCS of rock. Research content 2 is the influence of JRC on the UCS. For research content 1, five sets of numerical simulation programs were set with the JRC values of 1.6, 2.6, 3.6, 4.6, and 5.6, respectively. Uniaxial compression numerical simulation is performed for each working condition. For research content 2, six sets of numerical simulation programs with sizes of 200 mm × 200 mm, 400 mm × 400 mm, 600 mm × 600 mm, 800 mm × 800 mm, 1,000 mm × 1,000 mm, and 1,200 mm × 1,200 mm are set up. Each set of simulation programs contains five kinds of JRC conditions, and the JRC values are 1.6, 2.6, 3.6, 4.6, and 5.6, respectively. Uniaxial compression numerical simulation is performed for each working condition. The specific numerical simulation programs are shown in Table 1.
A total of 30 numerical simulation models had been established in this article. However, due to the limitation of the article length, reported here are a series of numerical simulation models with a rock size of 200 mm × 200 mm (Figure 1) and a series of numerical simulation models with the JRC of 1.6 (Figure 2) as examples. Through these two examples, the process of establishing the numerical simulation model when the JRC changes and the process of establishing the numerical simulation model when the size of the rock changes were introduced.

The model with different roughness when the rock size is 200 mm × 200 mm: (a) (JRC = 1.6), (b) (JRC = 2.6), (c) (JRC = 3.6), (d) (JRC = 4.6), and (e) (JRC = 5.6).

The rock model of different rock sizes with a roughness of 1.6.
2.2 Boundary conditions and rock parameters
2.2.1 Rock mechanical parameters and joint parameters
The rock mechanics parameters were obtained through the geological survey of the slope rock mass of Zhang’ao Mine, which is located in Zhang’ao Village, Shengzhou City, Zhejiang Province, China. First, the rock resilience measurement, structural surface measurement, and rock mass classification of the slope rock mass were performed to solve the UCS and rock mass grade of the rock. Then, the rock mechanics parameters, such as elastic modulus, Poisson’s ratio, and friction angle, were solved based on the Hoek–Brown criterion.
The elastic modulus of the rock was 8,000 MPa, its Poisson’s ratio was 0.25, its CS was 60 MPa, its cohesion was 1.2 MPa, its friction angle was 30°, and its density was 2,600 g/cm3. The elastic modulus of the joint was 0.01 MPa, its Poisson’s ratio was 0.25, its CS was 0.01 MPa, and its friction angle was 10°, as shown in Table 2.
The dynamic parameters of the sectional rock
| Materials | Elastic Modulus (MPa) | CS (MPa) | Poisson’s ratio | Cohesion (MPa) | Friction angle (°) |
|---|---|---|---|---|---|
| Rock | 8,000 | 60 | 0.25 | 1.2 | 30 |
| Joint | 0.01 | 0.01 | 0.25 | — | 10 |
2.2.2 Boundary conditions and loading methods
The simulation adopts the plane stress model and the Mohr–Coulomb criterion based on the rock uniaxial compression deformation theory. The constraint conditions were that the load was born not by the two sides of the model but by its upper and lower surfaces. The displacement loading on both sides of the model was 0 mm, and that on its upper and lower surfaces was 0.01 mm. The loading method and boundary control are shown in Figure 3.

The loading method and boundary control diagram.
3 Numerical simulation results and analysis
3.1 Research on the influence of rock size on the UCS
According to the results of (i), the stress–strain relationship of different rock sizes is analyzed to propose a fitting method for the relationship between UCS and rock size with rough joints and establish a mathematical model for UCS and rock size with rough joint.
3.1.1 Analysis of stress–strain curves of different rock sizes
The stress–strain curve of the rock can better reflect the physical and mechanical properties of the rock material. The full stress–strain curve of the rock is divided into three stages: linear elastic stage, damage stage, and residual stage. According to the simulation scheme for the influence of rock size with a rough joint on UCS, output the numerical simulation results of each working condition. Then, the stress–strain curves of all working conditions in each numerical simulation scheme were drawn in the same coordinate system, and a summary of the stress–strain curves of different rock sizes for each numerical simulation scheme was obtained, as shown in Figure 4.

Stress–strain curves of different size rocks under different roughness: (a) (JRC = 1.6), (b) (JRC = 2.6), (c) (JRC = 3.6), (d) (JRC = 4.6), and (e) (JRC = 5.6).
According to the stress–strain curve for each working condition in Figure 4, the UCS of the rock in each working condition was explored, and the UCS of the rock under all working conditions is summarized in Table 3.
Peak strength of different rock sizes
| Numerical simulation | Joint roughness | Peak strength of rocks with different rock sizes (MPa) | |||||
|---|---|---|---|---|---|---|---|
| Program 6 | Program 7 | Program 8 | Program 9 | Program 10 | Program 11 | ||
| Size 200 mm | Size 400 mm | Size 600 mm | Size 800 mm | Size 1,000 mm | Size 1,200 mm | ||
| Program 1 | 1.6 | 28.76 | 13.01 | 9.79 | 7.04 | 5.04 | 4.91 |
| Program 2 | 2.6 | 34.13 | 15.68 | 11.11 | 8.67 | 6.02 | 6 |
| Program 3 | 3.6 | 39.12 | 21.47 | 14.33 | 10.51 | 8.53 | 6.09 |
| Program 4 | 4.6 | 42.95 | 22.27 | 17.69 | 17.49 | 8.13 | 6.3 |
| Program 5 | 5.6 | 66.05 | 38.2 | 23.55 | 18.39 | 14.26 | 12.69 |
Figure 4 shows that the trend of stress–strain curves of different sizes under the JRC are similar. Figure 4a is taken as an example to analyze the rock failure. When the strain is in the interval of 0–0.002, the curve approximates a linear distribution. At this stage, the rock begins to fail along the cracks, indicating that the rock has certain plastic properties. When the strain is in the range of 0.002–0.005, the strain at the peak stress intensity will be different due to the different rock sizes. Take the curve of size 200 mm in Figure 4a as an example. When the strain is in the range of 0.002–0.005, the stress–strain curve begins to grow slowly, and the cracks continue to fail with the increase of stress. The stress–strain curve bends downward until the strain increases to 0.003. The rock undergoes brittle failure, with obvious brittleness characteristics, that is, it enters the failure stage. When the strain is between 0 and 0.003, the stress will not reach the peak strength immediately, because part of the cracks in the rock are compacted during the failure process. As the failure continues to increase, the stress does not reach its peak strength until a certain level. When the strain increases to 0.003, the stress quickly drops to the residual strength. Due to the shear slip inside the rock, the rock produces irreversible plastic deformation, in which t is the residual stage. When the rock strength drops to the residual strength, the stress–strain curve gradually becomes flat, indicating that the rock still has a certain degree of ductility after failure.
Analyzing the influence of size on the UCS of rock. Figure 4 shows that there is a large vertical distance between the stress–strain curves when the rock size is 200 mm and 400 mm. As the rock size increases, the vertical distance of the stress–strain curve gradually decreases, indicating that the larger the rock size, the smaller the dispersion. Figure 4 and Table 3 show that the peak stress intensity of the rock with JRC of 1.6 is reduced from 28.76 to 4.91 MPa, and the reduction is 83%. The other stress–strain curves in Figure 4 also has similar laws. It shows that under the same roughness, the peak stress intensity decreases with the increase of the rock size.
Analyzing the influence of JRC on the UCS of rock. Taking the rock size of 200 mm in Figure 4a as an example, when the JRC increases from 1.6 to 5.6, the peak stress intensity of the rock increases from 28.76 to 66.05 MPa. The increase is 129.7%. It shows that the greater the roughness, the higher the peak stress intensity.
The above research shows that the smaller the rock size, the greater the UCS of the rock, and the greater the dispersion of the stress–strain curve. The greater the JRC of the rock, the greater its UCS.
3.1.2 Fitting method of relationship between rock UCS and rock size
According to the statistical data in Table 3, it can be found that as the size of the rock continues to increase, the UCS of the rock gradually decreases. A scatter plot of UCS and rock size in each numerical simulation scheme was drawn. The fitting curve between the UCS and the size of the rock was drawn through the scatter diagram as shown in Figure 5.

Fitting curves of UCS and rock size with different roughness.
Figure 5 shows that as the rock size increases, the UCS of the rock decreases. And the larger the size, the smaller the change range, and the fitting relationship of exponential attenuation was obtained. According to Figure 5, the following relationships between UCS and rock size of different JRCs are shown in Table 4.
Fitting relationship between rock UCS and rock size
| Roughness | Fitting formula | R 2 |
|---|---|---|
| 1.6 |
|
0.985 |
| 2.6 |
|
0.989 |
| 3.6 |
|
0.995 |
| 4.6 |
|
0.908 |
| 5.6 |
|
0.999 |
The coefficients of determination in the fitting relationship were
3.1.3 Establishment of a mathematical model of rock UCS and rock size
3.1.3.1 Mathematical model of rock UCS and different rock sizes
The relationship between UCS and rock size under the different conforms to the negative exponent. A mathematical model of UCS and rock size was proposed. The mathematical model obtained was
where
Equation (2) gives the relationship between UCS and the size of the rock. The formula contains the undetermined parameters a, b, and c. When a, b, and c are determined, you can obtain the relationship between the UCS and rock size.
3.1.3.2 Solving method of parameters
The fitting relationship in Table 4 shows that the values of the parameters a, b, and c were related to the JRC, and the parameters under each JRC were calculated, as shown in Table 5.
Values of parameters a, b, c
| Roughness | |||||
|---|---|---|---|---|---|
| Parameter | 1.6 | 2.6 | 3.6 | 4.6 | 5.6 |
| A | 5.14 | 6.23 | 7.93 | 8.52 | 11.98 |
| B | 61.55 | 68.91 | 70.9 | 79.45 | 109 |
| C | 206.95 | 223.9 | 256.12 | 270.33 | 288.19 |
According to the data therein, the JRC was used as the abscissa and the parameter was used as the ordinate to draw a scatter diagram of the parameters and the JRC. According to the scatter diagram, the relationship between parameters a, b, and c and JRC was fitted, as shown in Figures 6–8.

Fitting curve of parameter a and joint roughness.
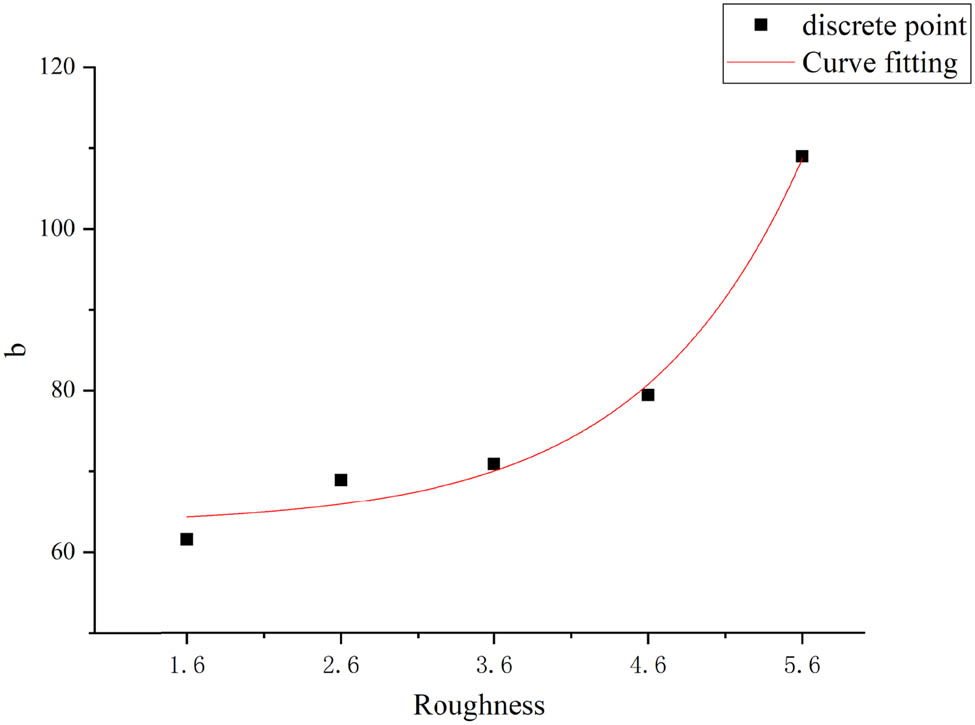
Fitting curve of parameter b and joint roughness.

Fitting curve of parameter c and joint roughness.
The mathematical model of the parameter and JRC was obtained through the fitted graph. The mathematical model of parameter a and JRC was
The mathematical model of parameter b and JRC was
The mathematical model of parameter c and JRC was
where a, b, and c are parameters, and JRC is the joint roughness coefficient.
3.1.3.3 Mathematical model of UCS and the size of rock with rough joints
The mathematical model of parameters and JRC was brought into the mathematical model of UCS and rock size. The mathematical model of UCS and rock size was obtained.
where σ(l) (MPa) is the UCS of rocks of different sizes; l (mm) is the rock size; JRC is the joint roughness coefficient.
The obtained mathematical models of UCS and different rock sizes can be extended to practical projects in similar situations. The mathematical models provide a method to quantitatively analyze rock size and rock strength to better guide engineering practice.
3.2 Research on the influence of joint roughness on the UCS of rock
According to the results of (ii), the stress–strain relationship of different JRCs was analyzed to propose a fitting method for the relationship between UCS and JRC and establish the mathematical model of the size effect of UCS and JRC.
3.2.1 Analysis of stress–strain curve with different joint roughness
According to the simulation scheme (program6-11) for the influence of JRC on the size effect of UCS and output the numerical simulation results of each working condition. Then, the stress–strain curves of all working conditions in each numerical simulation scheme were drawn in the same coordinate system, and a summary diagram of the stress–strain curves of different JRC for each numerical simulation scheme was obtained, as shown in Figure 9.

Stress strain curves of different roughness in different sizes: (a) size 200 mm × 200 mm, (b) size 400 mm × 400 mm, (c) size 600 mm × 600 mm, (d) size 800 mm × 800 mm, (e) size 1,000 mm × 1,000 mm, and (f) size 1,200 mm × 1,200 mm.
According to the stress–strain curve for each working condition in the numerical simulation scheme, the UCS of the rock in each working condition was explored. The UCS of the rock under all working conditions is summarized in Table 6.
Peak strength of different rock sizes
| Numerical simulation | Size (mm) | Peak strength of different sizes of rock (MPa) | ||||
|---|---|---|---|---|---|---|
| Program 1 | Program 2 | Program 3 | Program 4 | Program 5 | ||
| JRC = 1.6 | JRC = 2.6 | JRC = 3.6 | JRC = 4.6 | JRC = 5.6 | ||
| Program 6 | 200 | 28.76 | 34.13 | 39.12 | 43.2 | 66.05 |
| Program 7 | 400 | 13.01 | 15.68 | 21.47 | 22.27 | 38.2 |
| Program 8 | 600 | 9.79 | 11.11 | 14.33 | 17.69 | 23.55 |
| Program 9 | 800 | 7.04 | 8.67 | 10.51 | 17.49 | 18.39 |
| Program 10 | 1,000 | 5.04 | 6.02 | 8.53 | 8.13 | 14.26 |
| Program 11 | 1,200 | 4.91 | 6 | 6.09 | 6.3 | 12.69 |
Figure 9 shows the stress–strain curves of different JRC under different sizes. The curve for the rock size of 600 mm in Figure 9c is selected as an example to analyze the failure characteristics of the rock in the uniaxial compression numerical simulation. When the strain is 0–0.0025, the rock stress–strain curve is linearly distributed, and this is the linear compression stage. When the strain is between 0.0025 and 0.0035, the stress–strain curve develops from linear elasticity to the yield failure stage, and the peak stress intensity of the rock drops sharply to the residual stress intensity. At this time, the rock is a brittle failure, showing brittle characteristics. After the strain is 0.004, the stress–strain curve tends to be flat, and the rock is in the residual strength deformation stage.
Take Figure 9c as an example to analyze the influence of JRC changes on the UCS of rock. Table 6 shows that when the JRC is 1.6, the rock stress peak strength is 9.79 MPa. When the JRC increases to 5.6, the peak stress intensity of the rock is 23.55 MPa. The growth rate of rock stress peak strength is 140.6%. It shows that under the same size, the greater the JRC, the greater the rock stress peak strength. Figure 6c also shows that the residual strength is reduced stepwise. However, the residual strength of the rock with a JRC of 5.6 is significantly greater than that of the rock with a JRC of 4.6. It shows that the greater the JRC, the greater the residual strength of the rock.
Combining Figure 9 and Table 6 to analyze the influence of size on UCS. Take the rock size with a JRC of 5.6 in Figure 9 as an example. It can be clearly seen that the peak stress strength of rock with the size of 200 mm is significantly higher than that of a rock with the size of 400 mm. And the peak stress strength shows a decreasing trend with the increase of rock size. Table 6 also shows that the peak stress strength of the rock with the size of 200 mm is 66.05 MPa, and the peak stress strength of the rock with a size of 1,200 mm is 12.69 MPa. The decrease rate of rock stress peak strength is 80%. It shows that under the same JRC, the larger the rock size, the lower the peak stress strength of the rock.
The above analysis shows that when the JRC is the same, the larger the size of the rock, the smaller its UCS. When the rock size is the same, the UCS of the rock increases with the increase of JRC.
3.2.2 Fitting method of relationship between UCS and roughness
Table 6 shows that with the continuous increase of JRC, the UCS of the rock gradually increases. A scatter plot of UCS and JRC of rock was drawn. According to the scatter plot, the fitting curve between the UCS and JRC was drawn, as shown in Figure 10.

Fitting curves of UCS and roughness with different rock sizes.
Figure 10 shows that with the increase of JRC, the UCS of the rock gradually increases under the same rock size, showing a power function. Rock with different JRCs has the same changing law. The relationship between UCS and JRC of rocks of different sizes is obtained, as shown in Table 7.
Fitting relationship between rock UCS and roughness
| Size l (mm) | Fitting formula |
|---|---|
| 200 |
|
| 400 |
|
| 600 |
|
| 800 |
|
| 1,000 |
|
| 1,200 |
|
3.2.3 Establishment of a mathematical model of UCS and JRC
3.2.3.1 Mathematical model of UCS and JRC
According to the relationship of UCS and rock with different JRC. The types of functions that the relationship formulas conform to were analyzed, and the following mathematical model for UCS and JRC is proposed as
where σ(JRC) (MPa) is the UCS of the rock; JRC is the JRC, and d and f are the parameters.
3.2.3.2 Solving method of parameters
By fitting the relationship formula, the relationship between UCS and JRC was obtained. Table 7 shows that the values of the parameters d and f were related to the rock size, and the parameters of each rock size were calculated and are summarized, as shown in Table 8.
Values of parameters d and f
| Size (mm) | ||||||
|---|---|---|---|---|---|---|
| Parameters | 200 | 400 | 600 | 800 | 1,000 | 1,200 |
| d | 11.93 | 8.8 | 6.58 | 4.85 | 3.67 | 2.44 |
| f | 0.71 | 0.75 | 0.81 | 0.93 | 1.11 | 1.25 |
According to the data therein. A scatter diagram of the parameters and the rock size was drawn, with the rock size taken as the abscissa and the parameter taken as the ordinate. According to the scatter diagram, the relationship between the parameters d and f and the rock size was fitted, as shown in Figures 11 and 12.

Fitting curve of parameter d and rock size.

Fitting curve of parameter f and rock size.
According to the fitting curves in Figures 11 and 12, the relationships between the parameters d and f and the rock size are as follows:
where d and f are parameters, and l [mm] is the rock size.
3.2.3.3 Mathematical model for the size effect of UCS and JRC
The mathematical model of parameters and rock size was brought into the mathematical model of UCS and JRC. The mathematical model formulas of UCS and JRC were obtained:
where σ(JRC) (MPa) is the UCS of the rock; JRC is the JRC; l (mm) is the rock size.
The obtained mathematical model of UCS and JRC of the rock can be extended to the field rock with different JRC. It provides a quantitative analysis method for UCS and JRC, and better guide engineering application.
3.3 Establishment of mathematical models of uniaxial compressive characteristic size, characteristic strength, and JRC
In rock mechanics, characteristic strength is usually used to characterize the size effect of rock strength. The influence of JRC on the characteristic size of UCS and the characteristic strength of rock was studied by numerical simulation. A mathematical model of rock uniaxial compression characteristic size of UCS and JRC was established. A mathematical model of rock uniaxial compressive characteristic strength and JRC was established.
3.3.1 Establishment of a mathematical model of uniaxial compressive characteristic size and joint roughness
The rock size parameters have already reflected the heterogeneity of the meso-size. Due to the influence of meso-uniformity, the obtained mechanical parameters of the rock will have a certain degree of dispersion. Every non-uniform material has an obvious characteristic size. The literature [30] gave a detailed answer to this question based on physical mechanics experiments and meso-parameter statistical distribution theory. According to the research ideas of the literature [30], the absolute value of the slope of the curve is obtained by deriving the two sides of equation (2):
where r is the acceptable absolute value of the slope, which can be exceedingly small, if the approval curve is close to the level and meets the engineering requirements.
Table 9 shows that with the increase of JRC, the characteristic size of the rock also increases. This law qualitatively analyzes the relationship between rock characteristic size and JRC. Taking the JRC as the abscissa and the characteristic size of the rock as the ordinate, a scatter diagram of the characteristic size of the UCS and the JRC was drawn. According to the scatter diagram of rock characteristic size of UCS and JRC, the fitting curve of rock characteristic size and JRC was drawn, as shown in Figure 13.
Relationship between JRC and characteristic size
| Roughness | 1.6 | 2.6 | 3.6 | 4.6 | 5.6 |
|---|---|---|---|---|---|
| Characteristic size (mm) | 369.01 | 406.90 | 438.31 | 478.81 | 583.14 |

Fitting curve between the characteristic size of rock and roughness.
Analyzing the form of the fitted curve, Figure 13 shows that it conforms to the relationship of the index. The mathematical model formula of rock characteristic size and JRC was as follows.
where L (mm) is the characteristic size of the UCS; JRC is the joint roughness coefficient.
3.3.2 Establishment of mathematical model of rock uniaxial compressive characteristic strength and joint roughness
The characteristic size was obtained from the previous hypothesis test and then substituted into equation (2) to obtain the characteristic strength of the rock under the characteristic size. The characteristic strength of the rock under different JRCs can be obtained through the analytical formula, as shown in Table 10.
Relationship between roughness and characteristic strength
| Roughness | 1.6 | 2.6 | 3.6 | 4.6 | 5.6 |
|---|---|---|---|---|---|
| Characteristic strength (MPa) | 15.3 | 17.73 | 20.27 | 23.02 | 24.60 |
Table 10 shows that as the JRC increases, the characteristic strength of the rock increases. The fitting curve of rock characteristic strength and JRC is shown in Figure 14.

Fitting curve of characteristic strength and roughness.
Analyzing the form of the fitting curve, it is found that it conforms to the relationship of the power function, and the mathematical model formula of the rock characteristic strength and JRC is obtained as follows:
where σ(JRC) (MPa) is the characteristic strength of the rock; JRC is the joint roughness coefficient.
4 Discussion
The joint roughness of a rock has an impact on the UCS and characteristic strength of the rock, but the mathematical relationship model between them has not yet been obtained. Through this research, a mathematical model of UCS and JRC and a mathematical model of UCS and rock size were established. A mathematical model of rock characteristic size of UCS and JRC and a mathematical model of rock characteristic strength and JRC were established. The establishment of these four mathematical models quantifies the relationship between UCS of rock, rock characteristic size of UCS, rock characteristic strength, and JRC, which have important scientific significance. For the engineering site, when the JRC and rock size are obtained, the UCS, characteristic size of UCS, and characteristic strength of the rock can be quickly obtained, which has significant engineering guiding significance.
In this article, the method of solving UCS and JRC, UCS and size, rock characteristic size of UCS and JRC, and rock characteristic strength and JRC, is obtained.
However, this study still has some shortcomings. Because this study was conducted by means of numerical simulation, the simulation conditions were simplified. When the model was established, there was only one horizontal roughness joint, ignoring the effects of other small cracks and water content that may exist in the rock. Therefore, the factors considered are not yet complete, and there is still an area for improvement. When extended to the engineering site, it is only applicable to specific rocks with a horizontal joint.
5 Conclusion
This article studied the influence of the size of rock with a rough joint on UCS and the size effect of JRC on UCS. The size effect of UCS was analyzed through the stress–strain curves of rocks of different sizes and JRC. According to these numerical simulations, the following conclusions were obtained:
The relationship between the UCS and the size of the rock with rough joints was
solving for the parameters a, b and c, the specific formula was obtained as
The relationship between UCS and JRC was
solving the parameters d and f, and the specific formula was obtained as
The characteristic size of UCS is related to JRC. Our simulation gives the particular form:
The characteristic strength of the rock is related to the JRC. Our simulation gives the particular form:
-
Funding information: The authors appreciate the support of the Zhejiang Collaborative Innovation Center for Prevention and Control of Mountain Geological Hazards (PCMGH-2017-Y-05) and Key Laboratory of Rock Mechanics and Geohazards of Zhejiang Province (ZGRMG-2019-07).
-
Author contributions: Gaojian Hu: Conceptualization, methodology, writing – original draft preparation, writing – review & editing. Yu Li: software, investigation, data curation, writing – original draft preparation. Gang Ma: data curation, writing – review & editing.
-
Conflict of interest: The author declares that there is no conflict of interest regarding the publication of this article.
-
Data availability statement: The data that support the findings of this study are available from the corresponding author, G Hu, upon reasonable request.
References
[1] Masoumi H . Size effect of rock samples. Scale-size and structural effects of rock materials. China: Tsinghua University Press. 2020. p. 1–144.10.1016/B978-0-12-820031-5.00001-1Search in Google Scholar
[2] Usol’Tseva OM , Tsoi PA . The influence of size effect on strength and deformation characteristics of different types of rock samples. IOP Conf Series Earth Environ Sci. 2021;720(1):012089 (7pp).10.1088/1755-1315/720/1/012089Search in Google Scholar
[3] Huang M , Liu D , Hong C , Du S , Luo Z , Li C , et al. Representative sample sampling method for size effect experiment of jointed rock mass. Geofluids. 2020;2020(10):1–8.10.1155/2020/8870387Search in Google Scholar
[4] Long-long LV , Li SO , Hong-jian LI , Hang-zhou LI . Size effect on uniaxial compressive strength of red bed soft rock. J Yangtze River Sci Res Inst. 2016;33(9):78–82.Search in Google Scholar
[5] Wang C , Liu C , Liu D . Experimental study on volume effect of saturated fractured sandstone under uniaxial compression. Chin J Undergr Space Eng. 2019;15(5):1331–40.Search in Google Scholar
[6] Fu W . Experimental study on size effect of uniaxial compressive strength of rock with different height-diameter ratio. Resour Environ Eng. 2019;33(2):232–4.Search in Google Scholar
[7] Zhang H , Zhang X , Zhou H . Research on acoustic emission characteristics and constitutive model of rock damage evolution with different sizes. Adv Civ Eng. 2020;2020(16):1–8.10.1155/2020/6660595Search in Google Scholar
[8] Li DY , Xiao P , Xie T , Li XB . On the effect of length to diameter ratio of rock specimen subjected to dynamic and static compression. J Exp Mech. 2018;33(1):93–100.Search in Google Scholar
[9] Wu FQ , Qiao L , Guan SG , Zhang QT , Wang ZY , Wu J . Study on the size effect of small-sized rock samples in uniaxial compression test. Chin J Rock Mech Eng. 2021;40(5):865–73.Search in Google Scholar
[10] Wang LS , Sun DS , Zheng XH , Zhao WH , Li AW , Li Q . Size effect experiment of uniaxial compressive strength of three typical rocks. J Geomech. 2017;23(2):327–32.Search in Google Scholar
[11] Wang CY , Xiao-Ya DU . Comparative analysis of rock size effect test and RFPA∼(3D) numerical simulation. Ind Miner Process. 2018;47(2):28–30.Search in Google Scholar
[12] Dongping L , Jun L , Rongrong S . Numerical study based on the size effect of UDEC rock mass compressive strength. Chin J Undergr Space Eng. 2019;15(4):1098–1105.Search in Google Scholar
[13] Luo Z , Chen C , Zou B , Tao Y . Numerical simulation of rock strength size effect under different boundary conditions. Bull Sci Technol. 2019;35(8):13–8.Search in Google Scholar
[14] Tian Z , Tang C , Li H , Xing H , Ning X . Numerical simulation of rock uniaxial compressive strength and deformation failure law under different size conditions. Adv Civ Eng. 2021;2021(2):1–11.10.1155/2021/6643884Search in Google Scholar
[15] Asadizadeha M , Hossainia MF , Moosavia M , Mohammadia S . A laboratory study on mix design to properly resemble brittle jointed rock. Int J Min Geo-Eng. 2016;50(2):201–10.Search in Google Scholar
[16] Wang PT , Liu Y , Zhang L , Huang ZJ , Cai MF . Preliminary experimental study on uniaxial compressive properties of 3D printed fractured rock models. Yanshilixue Yu Gongcheng Xuebao/Chinese J Rock Mech Eng. 2018;37(2):364–73.Search in Google Scholar
[17] Basker RP , Madhavan M . Uniaxial compressive strength of jointed rock mass. In: International Conference on Emerging and Sustainable Trends in Civil Engineering; 2018.Search in Google Scholar
[18] Sheng-qi Y , Jia-wei L , Wen-ling T , Jin-zhou T . Experimental study of mechanical behavior of rock specimens with different joint roughness coefficient under conventional triaxial compression. Rock Soil Mech. 2018;39(S1):21–32.Search in Google Scholar
[19] Aminpure F , Moomivand H . Effect of discontinuity roughness and orientation on the parameters of the rock failure criterion under triaxial compressive stress. J South Afr Inst Min Metall. 2019;119(12):1047–60.Search in Google Scholar
[20] Cao R , Lin H , Cao P . Strength and failure characteristics of brittle jointed rock-like specimens under uniaxial compression: digital speckle technology and a particle mechanics approach. Int J Mining Sci Technol. 2018;28(4):669–77.10.1016/j.ijmst.2018.02.002Search in Google Scholar
[21] Chaohui S . Strength test and numerical application of rocks with different roughness. Wu Lizhou: Chengdu University of Technology; 2020.Search in Google Scholar
[22] Liang Z , Wu N , Li Y , Li H , Li W . Numerical study on anisotropy of the representative elementary volume of strength and deformability of jointed rock masses. Rock Mech Rock Eng. 2019;52(3):4387–402.10.1007/s00603-019-01859-9Search in Google Scholar
[23] Laghaei M , Baghbanan A , Hashemolhosseini H , Dehghanipoodeh M . Numerical determination of deformability and strength of 3D fractured rock mass. Int J Rock Mech Min Sci. 2018;110:246–56.10.1016/j.ijrmms.2018.07.015Search in Google Scholar
[24] Xia L , Zheng Y , Yu Q . Estimation of the REV size for blockiness of fractured rock masses. Computers Geotech. 2016;76(Jun):83–92.10.1016/j.compgeo.2016.02.016Search in Google Scholar
[25] Qingfa C , Wenshi Z , Wenjing N , Tingchang Y , Qiuyan F . Research on the correlation between fractured rock mass geometry and mechanical size effect. Chin J Rock Mech Eng. 2019;38(S1):2857–70.Search in Google Scholar
[26] Wang P , Yang T , Xu T , Cai M , Li C . Numerical analysis on scale effect of elasticity, strength, and failure patterns of jointed rock masses. Geoences J. 2016;20(4):539–49.10.1007/s12303-015-0070-xSearch in Google Scholar
[27] Sun X , Cheng D , Huang Y , Li F , He J , Chi J , et al. Numerical simulation of deformation characteristics of layered jointed rock mass. J China Three Gorges Univ (Nat Sci). 2017;39(3):32–5.Search in Google Scholar
[28] Ma C , Yao W , Yao Y , Li J . Simulating strength parameters and size effect of stochastic jointed rock mass using DEM method. KSCE J Civ Eng. 2018;22:4872–81.10.1007/s12205-017-1581-ySearch in Google Scholar
[29] Huang D , Li XQ. Numerical simulation study of the characteristic strength of marble based on the development characteristics of microcracks. Rock Soil Mech. 2017;1:253–62.Search in Google Scholar
[30] Zhao LZ , Yongbin Z , Shibin T , Lianchong L , Chunan T . Rock mass size effect and calculation of its characteristic parameters. Chin J Rock Mech Eng. 2013;32(6):1157–66.Search in Google Scholar
© 2021 Gaojian Hu et al., published by De Gruyter
This work is licensed under the Creative Commons Attribution 4.0 International License.
Articles in the same Issue
- Effects of Material Constructions on Supersonic Flutter Characteristics for Composite Rectangular Plates Reinforced with Carbon Nano-structures
- Processing of Hollow Glass Microspheres (HGM) filled Epoxy Syntactic Foam Composites with improved Structural Characteristics
- Investigation on the anti-penetration performance of the steel/nylon sandwich plate
- Flexural bearing capacity and failure mechanism of CFRP-aluminum laminate beam with double-channel cross-section
- In-Plane Permeability Measurement of Biaxial Woven Fabrics by 2D-Radial Flow Method
- Regular Articles
- Real time defect detection during composite layup via Tactile Shape Sensing
- Mechanical and durability properties of GFRP bars exposed to aggressive solution environments
- Cushioning energy absorption of paper corrugation tubes with regular polygonal cross-section under axial static compression
- An investigation on the degradation behaviors of Mg wires/PLA composite for bone fixation implants: influence of wire content and load mode
- Compressive bearing capacity and failure mechanism of CFRP–aluminum laminate column with single-channel cross section
- Self-Fibers Compacting Concrete Properties Reinforced with Propylene Fibers
- Study on the fabrication of in-situ TiB2/Al composite by electroslag melting
- Characterization and Comparison Research on Composite of Alluvial Clayey Soil Modified with Fine Aggregates of Construction Waste and Fly Ash
- Axial and lateral stiffness of spherical self-balancing fiber reinforced rubber pipes under internal pressure
- Influence of technical parameters on the structure of annular axis braided preforms
- Nano titanium oxide for modifying water physical property and acid-resistance of alluvial soil in Yangtze River estuary
- Modified Halpin–Tsai equation for predicting interfacial effect in water diffusion process
- Experimental research on effect of opening configuration and reinforcement method on buckling and strength analyses of spar web made of composite material
- Photoluminescence characteristics and energy transfer phenomena in Ce3+-doped YVO4 single crystal
- Influence of fiber type on mechanical properties of lightweight cement-based composites
- Mechanical and fracture properties of steel fiber-reinforced geopolymer concrete
- Handcrafted digital light processing apparatus for additively manufacturing oral-prosthesis targeted nano-ceramic resin composites
- 3D printing path planning algorithm for thin walled and complex devices
- Material-removing machining wastes as a filler of a polymer concrete (industrial chips as a filler of a polymer concrete)
- The electrochemical performance and modification mechanism of the corrosion inhibitor on concrete
- Evaluation of the applicability of different viscoelasticity constitutive models in bamboo scrimber short-term tensile creep property research
- Experimental and microstructure analysis of the penetration resistance of composite structures
- Ultrasensitive analysis of SW-BNNT with an extra attached mass
- Active vibration suppression of wind turbine blades integrated with piezoelectric sensors
- Delamination properties and in situ damage monitoring of z-pinned carbon fiber/epoxy composites
- Analysis of the influence of asymmetric geological conditions on stability of high arch dam
- Measurement and simulation validation of numerical model parameters of fresh concrete
- Tuning the through-thickness orientation of 1D nanocarbons to enhance the electrical conductivity and ILSS of hierarchical CFRP composites
- Performance improvements of a short glass fiber-reinforced PA66 composite
- Investigation on the acoustic properties of structural gradient 316L stainless steel hollow spheres composites
- Experimental studies on the dynamic viscoelastic properties of basalt fiber-reinforced asphalt mixtures
- Hot deformation behavior of nano-Al2O3-dispersion-strengthened Cu20W composite
- Synthesize and characterization of conductive nano silver/graphene oxide composites
- Analysis and optimization of mechanical properties of recycled concrete based on aggregate characteristics
- Synthesis and characterization of polyurethane–polysiloxane block copolymers modified by α,ω-hydroxyalkyl polysiloxanes with methacrylate side chain
- Buckling analysis of thin-walled metal liner of cylindrical composite overwrapped pressure vessels with depressions after autofrettage processing
- Use of polypropylene fibres to increase the resistance of reinforcement to chloride corrosion in concretes
- Oblique penetration mechanism of hybrid composite laminates
- Comparative study between dry and wet properties of thermoplastic PA6/PP novel matrix-based carbon fibre composites
- Experimental study on the low-velocity impact failure mechanism of foam core sandwich panels with shape memory alloy hybrid face-sheets
- Preparation, optical properties, and thermal stability of polyvinyl butyral composite films containing core (lanthanum hexaboride)–shell (titanium dioxide)-structured nanoparticles
- Research on the size effect of roughness on rock uniaxial compressive strength and characteristic strength
- Research on the mechanical model of cord-reinforced air spring with winding formation
- Experimental study on the influence of mixing time on concrete performance under different mixing modes
- A continuum damage model for fatigue life prediction of 2.5D woven composites
- Investigation of the influence of recyclate content on Poisson number of composites
- A hard-core soft-shell model for vibration condition of fresh concrete based on low water-cement ratio concrete
- Retraction
- Thermal and mechanical characteristics of cement nanocomposites
- Influence of class F fly ash and silica nano-micro powder on water permeability and thermal properties of high performance cementitious composites
- Effects of fly ash and cement content on rheological, mechanical, and transport properties of high-performance self-compacting concrete
- Erratum
- Inverse analysis of concrete meso-constitutive model parameters considering aggregate size effect
- Special Issue: MDA 2020
- Comparison of the shear behavior in graphite-epoxy composites evaluated by means of biaxial test and off-axis tension test
- Photosynthetic textile biocomposites: Using laboratory testing and digital fabrication to develop flexible living building materials
- Study of gypsum composites with fine solid aggregates at elevated temperatures
- Optimization for drilling process of metal-composite aeronautical structures
- Engineering of composite materials made of epoxy resins modified with recycled fine aggregate
- Evaluation of carbon fiber reinforced polymer – CFRP – machining by applying industrial robots
- Experimental and analytical study of bio-based epoxy composite materials for strengthening reinforced concrete structures
- Environmental effects on mode II fracture toughness of unidirectional E-glass/vinyl ester laminated composites
- Special Issue: NCM4EA
- Effect and mechanism of different excitation modes on the activities of the recycled brick micropowder