Seismic Behaviour of TRC-Strengthened RC Columns under Different Constraint Conditions
-
Liu Ming
 and
Chen Wenjie
and
Chen Wenjie

Abstract
This paper studied the confinement effect of textile layers and the stirrup ratio on the seismic behaviour of TRC-strengthened RC columns using the numerical method. The results showed that the numerical values have good consistency with the experimental. Within the range of 1 to 3 layers of textile, with the increase of the number of textile layers, the peak load, displacement ductility ratio and energy dissipation capacity of the columns increased; however, these parameters only exhibited a limited increase when the textile layers continued to increase. In addition, the textile layers had a slight influence on the rate of the energy dissipation capacity. With the increase of the stirrup ratio, the yield load, peak load and ultimate load of the column did not change significantly, but the ductility coefficient and energy dissipation capacity of the column increased. Furthermore, for a TRC-strengthened column with three layers of textile and a stirrup ratio of 0.34%, the hysteresis loop fullness and the bearing capacity are better than those of a column with two layers of textile and a stirrup ratio of 0.67%. Therefore, it can be seen that TRC could play an efficient constraint role on the column when the stirrup arrangement is less.
Introduction
In recent years, due to earthquakes’ suddenness and destructiveness, large casualties and economic losses have been suffered by countries all over the world. The reinforced concrete (RC) column is the most important load-bearing component in building structures. Therefore, related scholars have studied how to improve the RC column’s seismic performance and to find a way to improve the ductility, energy dissipation capacity and seismic performance of concrete columns on the basis of satisfying the bearing capacity of concrete columns [1]. At present, the traditional reinforcement methods for a concrete column mainly include the method of increasing section and the method of wrapping steel, both of which have the disadvantages of great influence on the stiffness of the original structure and complex construction technology [2]. Therefore, many scholars introduced FRP (Fibre Reinforced Polymer) materials as an alternative.
At present, FRP composites are not only used to reinforce and repair old structures but are also used in new structures. Relevant scholars have also carried out many experiments and relevant finite element analysis. Parvin and Granata [3] used the finite element analysis software ANSYS to study the application of FRP materials in the repair and reinforcement of beam-column joints. Lakshmi et al. [4] studied three types of beam-column joints through finite element simulation and explored a reasonable finite element numerical model for beam-column joints. Mahini et al. [5] proposed the beam-column joint model of FRP plate bonding reinforcement, which used the nonlinear connection element to evaluate the seismic behaviour of the joints. Niroomandi et al. [6] performed finite element analysis on specimens strengthened by FRP, corrected the joint stiffness through nonlinear finite element analysis and introduced the modified joint stiffness into the overall framework for seismic evaluation. Although the FRP reinforcement method is widely used at present, due to the use of epoxy resin as a binder in FRP reinforcement, its compatibility with the concrete substrate is poor, water diffusion is limited, and more importantly, it is difficult to check and evaluate the status of the repaired components hidden by the FRP reinforcement [7]. Therefore, scholars introduced a relatively new alternative cement-based composite (TRC) for the reinforcement of RC structures. This material can be applied to a wet substrate and will not carry moisture leading to freeze-thaw cycle and other factors that may cause damage; at the same time, the crack formed in the matrix will usually appear in the reinforcement layer, which is convenient for visual examination after reinforcement [8]. These cement-based composites are generally divided into two categories. The first category consists of fibre textile and mortar, including fabric-reinforced cementitious matrix (FRCM) [9], textile reinforced concrete (TRC) [10] and textile reinforced mortar (TRM) [11]. The second category is composed of prefabricated rigid FRP grids and mortar, including mineral basic composites (MBC) [12].
In recent years, many scholars have conducted preliminary studies on the seismic behaviour of reinforced concrete structures reinforced by TRC. Bournas and Triantafillou [13] analysed the yield change process of RC columns with TRM under earthquake action. The research shows that when the axial force of the reinforcement reaches the critical load, TRM can transfer the surcharge distribution to the column centre, and the deformation capacity of the strengthened column increases with the increase of the number of TRM reinforcement layers. Al-salloum et al. [14] used TRM to reinforce beam-column joints, and the results of quasi-static tests showed that TRC reinforcement could significantly improve the ultimate bearing capacity and deformation capacity of the joints, as well as improving the ductility and energy dissipation capacity of the joints. With the increase of the number of reinforcement layers, the bearing capacity and ductility of the joints increase. Abadel [15] studied the beam-column joints strengthened with TRM by using finite element simulation and analysed the load-displacement characteristics, ultimate load and crack development model of beam-column joints.
In conclusion, relevant scholars discussed the improvement effect on seismic performance of RC columns strengthened by TRC through experiments, and some progress has been made in the research on the seismic performance of TRC reinforcement columns. However, the current research on the factors affecting the seismic performance of TRC reinforcement columns is mainly based on experimental studies. Due to the constraints of experimental conditions, it is not possible to fully analyse and study the advantages of TRC reinforcement materials. Therefore, this paper establishes a model of the TRC-strengthened column on the basis of ABAQUS and further studies the seismic performance of RC columns strengthened by TRC under low-cycle repeated load. Then, this information is combined with the stress-strain nephogram, hysteretic curve, skeleton curve, ductility and energy dissipation capacity of each TRC strengthened column, and the influence of the number of reinforcement layers and stirrup ratio on the seismic performance of the column is analysed.
1 Numerical Model
1.1 Overall design of test program
In this paper, the samples found in the literature [16] are selected as the research objects of numerical calculations. The section size of the column was 300 mm×300 mm and the clear height of the specimens was 1140 mm so that the shear span ratio was 3.8. The axial compression ratio for all of the columns applied was 0.30; the longitudinal reinforcement diameter of the specimen is 14mm, the diameter of the stirrup is 8 mm and the spacing is 100 mm. The specific geometric size and reinforcement of the specimen are shown in Figure 1, and the basic parameters of the specimen are shown in Table 1.
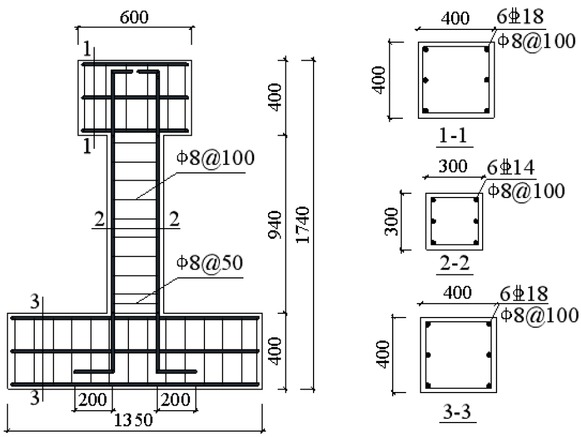
Specimen size and reinforcement detailing
Specimen grouping
| Specimen Number | Concrete Strength | Number of Strengthening Layers | Stirrup Spacing /Stirrup Ratio | Axial Compression Ratio | Application |
|---|---|---|---|---|---|
| C0 | C40 | 0 | 100/0.34% | 0.3 | Comparative Analysis |
| C1 | C40 | 1 | 100/0.34% | 0.3 | Comparative Analysis |
| C2 | C40 | 2 | 100/0.34% | 0.3 | Comparative Analysis |
| C3 | C40 | 3 | 100/0.34% | 0.3 | Comparative Analysis |
| C4 | C40 | 4 | 100/0.34% | 0.3 | Comparative Analysis |
| C5 | C40 | 2 | 50/0.67% | 0.3 | Comparative Analysis |
| C6 | C40 | 2 | 150/0.22% | 0.3 | Comparative Analysis |
| C7 | C40 | 2 | 100/0.34% | 0.25 | Contrast Verification |
| C8 | C40 | 2 | 100/0.34% | 0.15 | Contrast Verification |
1.2 Numerical Modelling
In this paper, the damage-plasticity model in ABAQUS is used to simulate the unrecoverable damage in the process of concrete crushing. Concrete uniaxial compression stress-strain relationship adopts the concrete model [15] proposed by E. Hognestad et al. in 1951, and the uniaxial tensile stress-strain relationship of concrete uses the model proposed by Jiang Jianjing et al. [17]. Tri-linear model is selected for the constitutive relation of reinforce-ment, the relevant parameters of yield stress and ultimate tensile strength of steel bars in the numerical mode are based on Table 2. The reference [18] divides TRC material (textile reinforced concrete material) into a textile grid and fine-grained concrete to simulate the performance of TRC material, the relevant parameters of the textile required in the numerical model of this paper are based on table 3. The warp fibre bundle and the zonal fibre bundle of textile are assumed to be ideal linear elastic material; when the fibre bundle reaches the ultimate strength, the fibre bundle is judged to be broken. Fine grained concrete is assumed to be a concrete material using the constitutive relation of concrete.
Mechanical properties of steel bar
| Type of steel | fy/MPa | fu/MPa | Elongation | application |
|---|---|---|---|---|
 14 14 | 463 | 597 | 28.10% | Longitudinal reinforcement |
 18 18 | 387 | 571 | 28.83% | Longitudinal reinforcement |
| ф8 | 325 | 496 | 27.27% | Stirrup |
Mechanical properties of textile
| Fiber type | Number of filaments per bundle | Filament tensile strength/MPa | Filament elastic modulus/GPa | Filament elongation at break/% | Fiber bundle linear density/Tex | Fiber bundle density/(g.cm−3) |
|---|---|---|---|---|---|---|
| T700S | 12k | 4660 | 231 | 2 | 801 | 1.78 |
| E-glass | 4k | 3200 | 65 | 4.5 | 600 | 2.58 |
In the TRC reinforced column model, the contact relationship between the plate and the core concrete and between TRC and the core concrete at the load ending use the "TIE" constraint, meaning that the joint works together to ensure the effective transfer of load. For the contact relationship between the reinforcement and the concrete (the textile grid and fine grained concrete), it is assumed that they are completely bonded without relative slip, and the constraint mode of "embedded fixation" is adopted.
The bottom of the column of the model adopts a fixed constraint, which constrains all degrees of freedom of all nodes at the bottom of the column pier. In addition, the allowable displacement of the side of the column and the horizontal load is set to 0 to avoid displacement of the column during loading. The axial pressure at the top of the column and the horizontal reciprocating load are applied through a reference point coupled to the top loading plate. The model is recorded in displacement mode, and the loading mode of this model adopts the displacement control mode, the loading system is shown in Figure 2 and the loading apparatus is shown in Figure 3. Loading control is carried out by increasing the yield displacement step by step. Loading is carried out twice at each stage. When the horizontal reaction force drops to about 85% of the ultimate load, the loading is completed.
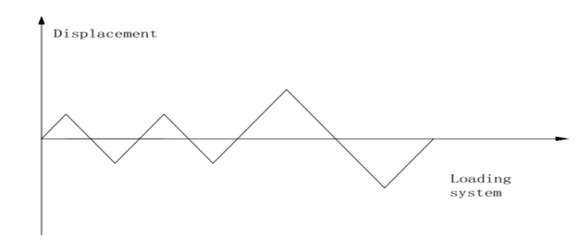
Loading system
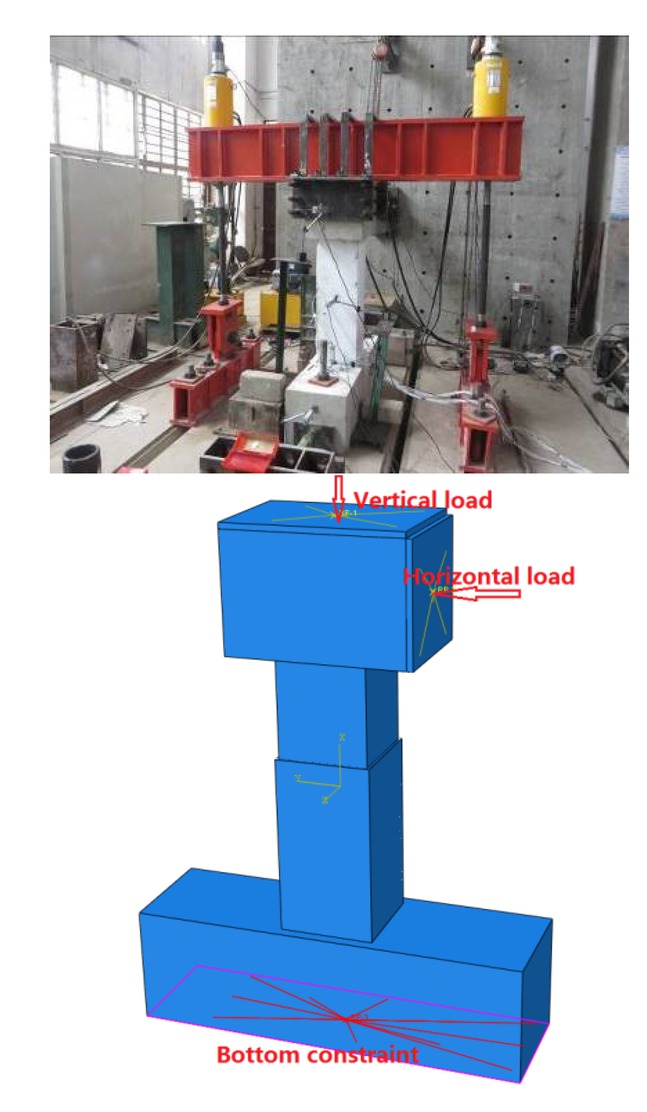
Loading apparatus
1.3 Numerical Model Verification
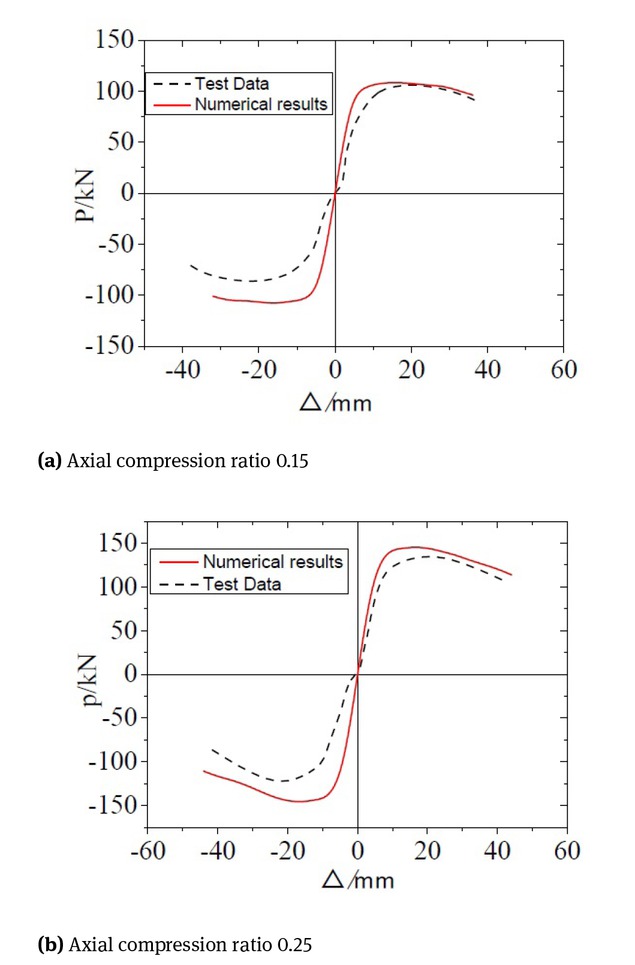
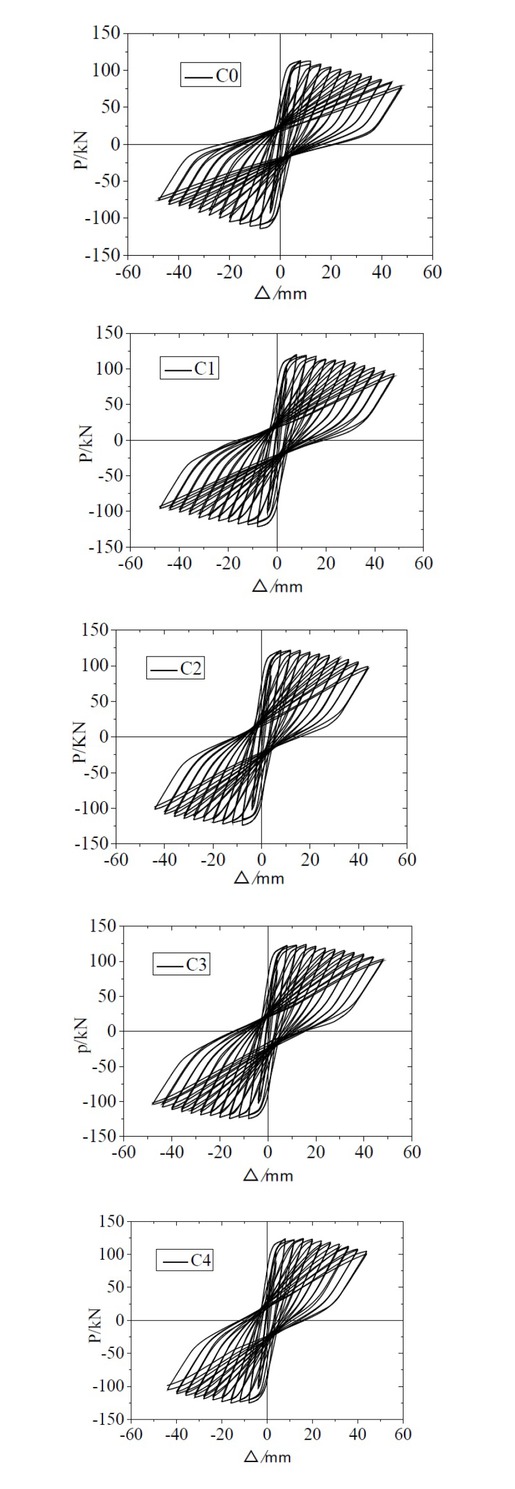
In this paper, the specimens based on literature [16] were selected for finite element analysis; the feasibility of solid modelling and finite element analysis of TRC reinforced RC columns using ABAQUS is verified by comparing the numerical calculation results and the test results. It can be seen from the hysteretic curves of each specimen in Fig. 4 and in combination with Table 4 that the load-displacement hysteretic curves obtained by finite element analysis are generally in good agreement with the test curves. However, there is a difference between the calculated load-deflection hysteretic curve and the actual load-deflection hysteretic curve of TRC confined concrete. This is because the numerical model established in this paper does not produce experimental errors during loading process. For example, there is no negative slip in the model during loading process. However, the actual test in the negative loading process, due to the reasons of test equipment and the inaccuracy of physical alignment before the beginning of the test, the negative slip occurs during negative loading. Moreover, the damage degree of material in the numerical model under low cyclic reciprocating load is smaller than that in the actual test, which can be seen from the skeleton curves of each specimen in Fig. 5 and in combination with Table 4. The skeleton curves obtained by finite element analysis are in good agreement with the overall trend of the experimental skeleton curves, but the limit value of the skeleton curve obtained by finite element analysis is higher than that of the test skeleton curve, and the displacement reaching the limit value is also smaller than that of the test value. This finding is observed mainly because in the finite element analysis of this paper, the uniaxial stress and strain are adopted in the constitutive relation of concrete, and the bond slip between the reinforcement and the concrete is neglected. However, the actual test is a low-frequency cyclic loading test, in which the stiffness and strength of concrete are reduced by different degrees under the action of reciprocating load, and small bond slip between the steel and concrete will also appear. Combined with the actual situation of the test, the limit value of a skeleton curve obtained by finite element analysis is reasonable.
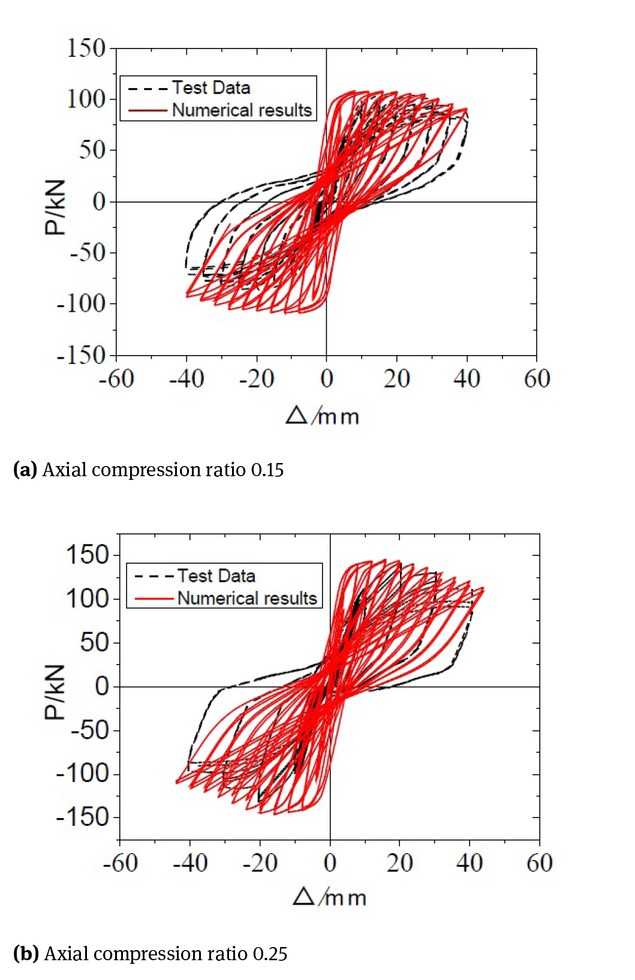
Hysteresis curves of concrete columns
Concrete column skeleton curve comparison chart
Comparison of calculation results and test results data
| Specimen’s Number | Yield Point | Peak Point | Failure Point | |||
|---|---|---|---|---|---|---|
| Py/kN | △y/mm | Pm/kN | △m/mm | Pu/kN | △u/mm | |
| C8 (Numerical results) | 129.44 | 6.77 | 145.50 | 16.00 | 123.68 | 37.51 |
| -129.50 | -6.65 | -146.17 | -16.00 | -124.24 | -33.70 | |
| C8 (Test Data) | 114.45 | 8.62 | 142.00 | 19.94 | 120.70 | 35.55 |
| -115.17 | -8.16 | -130.80 | -20.30 | -111.18 | -32.33 | |
| C7 (Numerical results) | 86.50 | 6.93 | 94.35 | 16.00 | 80.20 | 36.00 |
| -87.10 | -6.90 | -94.74 | -16.00 | -80.53 | -36.00 | |
| C7 (Test Data) | 85.29 | 7.81 | 106.4 | 20.02 | 90.44 | 36.99 |
| -70.49 | -8.93 | -86.6 | -19.93 | -73.61 | -36.80 | |
2 Numerical results and analysis
The numerical results are shown in Table 5:
Test results of each specimen
| Specimen’s Number | Yield Point | Peak Point | Failure Point | Ductility Coefficient | Accumulated Energy Dissipation | |||
|---|---|---|---|---|---|---|---|---|
| Py/kN | △y/mm | Pm/kN | △m/mm | Pu/kN | △u/mm | AVG | Q/kNmm | |
| C0 Unstrengthened | 104.59 | 7.09 | 112.85 | 8.00 | 95.92 | 31.55 | 4.36 | 26072.56 |
| -102.47 | -6.34 | -110.82 | -8.00 | -94.20 | -27.10 | |||
| C1 One layer | 107.77 | 5.48 | 119.92 | 8.00 | 101.93 | 36.21 | 6.76 | 33085.75 |
| -108.93 | -5.49 | -121.25 | -8.00 | -103.06 | -37.95 | |||
| C2 Two layers | 110.75 | 6.05 | 121.80 | 12.00 | 103.53 | 42.52 | 6.91 | 46881.53 |
| -110.51 | -6.05 | -123.80 | -12.00 | -105.23 | -41.17 | |||
| C3 Three layers | 111.73 | 7.09 | 124.08 | 16.00 | 105.47 | 45.59 | 6.50 | 48895.22 |
| -111.88 | -7.09 | -124.47 | -16.00 | -105.80 | -46.62 | |||
| C4 Four layers | 112.84 | 6.96 | 124.10 | 16.00 | 105.49 | 43.17 | 6.60 | 48527.27 |
| -109.99 | -6.15 | -125.51 | -16.00 | -106.68 | -43.06 | |||
| C5 Stirrup Spacing 50 | 101.89 | 5.76 | 124.27 | 12.00 | 105.63 | 40.29 | 7.59 | 46203.74 |
| -103.50 | -5.06 | -123.92 | -12.00 | -105.33 | -41.38 | |||
| C6 Stirrup Spacing150 | 113.73 | 6.95 | 123.96 | 12.00 | 105.37 | 35.81 | 5.32 | 33469.22 |
| -112.51 | -6.13 | -125.66 | -12.00 | -106.81 | -33.62 | |||
Under the conditions of the same axial compression ratio and shear span ratio and with the number of the textile grid layout layers within the range of 1 to 3, the peak load, displacement ductility ratio and energy dissipation capacity of specimens with different numbers of reinforcement layers (C0, C1, C2, C3, C4) increase with the increase of the number of reinforcement layers; however, if the number of layers continues to increase, which has a limit, the energy dissipation rate of the specimens also increases slightly with the increase of the number of layers of the textile grid.
Under the conditions of the same reinforcement layer and different stirrup ratio, the yield load, peak load and ultimate load of specimens with different stirrup spacing (C2, C5, C6) do not change significantly with the increase of stirrup spacing.However, the ductility coefficient and energy dissipation capacity of the specimens increase with the decrease of stirrup spacing.
2.1 Analysis of Stress-Strain Nephogram
In this paper, the crack development direction is defined by the concept of the equivalent plastic strain of the core concrete of the reinforced concrete; the normal vector of the crack surface is parallel to the direction of the equivalent plastic strain, and the crack development is shown by showing the maximum plastic strain.At the same time, the distribution of compression damage on the components is analysed through the distribution map of compression damage, to study the compression area and distribution position of concrete [19]. Combined with the maximum principal strain nephogram of carbon fibre, the strain distribution of carbon fibre under low-cycle repeated load is analysed.
(1) Analysis of plastic strain and compression damage of core concrete
Specimen C0 (Unstrengthened Column)
The nephograms of equivalent plastic strain and maximum principal plastic strain of the specimens are shown in Fig. 6. When reaching the peak displacement of the unreinforced column, the strain at the side subjected to tension at the bottom of the column is large and decreases gradually towards the middle of the column. When the concrete column is destroyed, the bottom of the column body clearly expands, the concrete in the plastic hinge region at the bottom of the column body is crushed, and the concrete strain gradually decreases from the bottom of the column to the middle of the column body. The plastic strain of the unreinforced column shows a gradually changing region from bottom to top. In this region, the colour change of the lower side of the column is the deepest followed by the middle side, and the colour change of the upper side is not clear. Combined with the equivalent plastic strain cloud pictures, it can be seen that the crack of the specimen is mainly horizontal crack and primarily concentrated in the plastic hinge region at the bottom of the column. Under the action of low-cycle repeated load, horizontal cracks are most fully developed in the lower side of the column followed by the middle side, and the development of the upper side is not clear. With the increase of the horizontal load, the horizontal crack increases gradually and passes through along the section of the column. When the specimen reaches the peak displacement, the horizontal cracks of the specimen clearly increase, the concrete at the bottom of the column is crushed in a large area, and the bearing capacity of the specimen decreases rapidly. The crack development is consistent with the specimen in the literature [16]. Fig. 7 shows the distribution cloud pictures of compressive damage. In the initial stage of loading, the compression degree of the lower part of the specimen is high and decreases gradually upwards along the column; the damage degree of the mid-span region of the column is low, and the damage degree of the column increases gradually with the increase of horizontal load.
Nephograms of Equivalent Plastic Strain and Maximum Principal Plastic Strain of C0
Nephograms of Compression Damage of C0
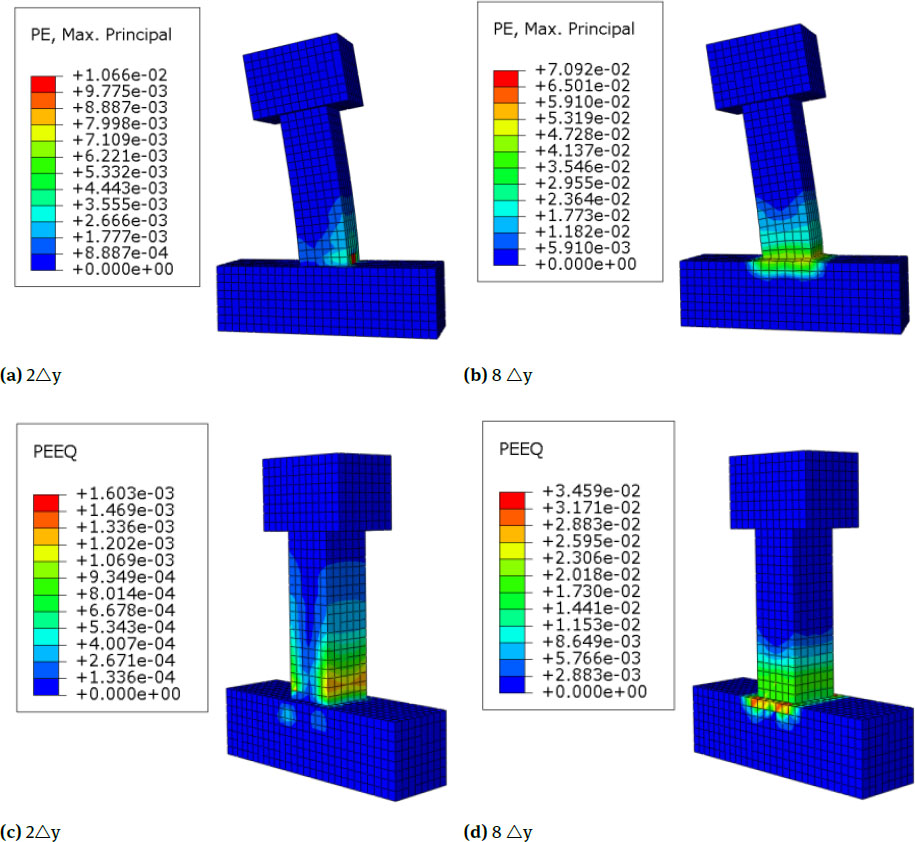
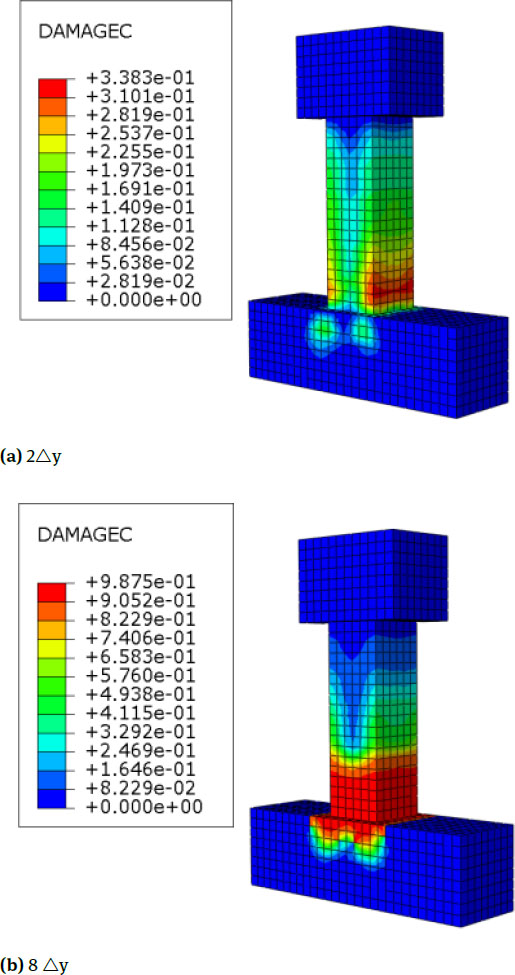
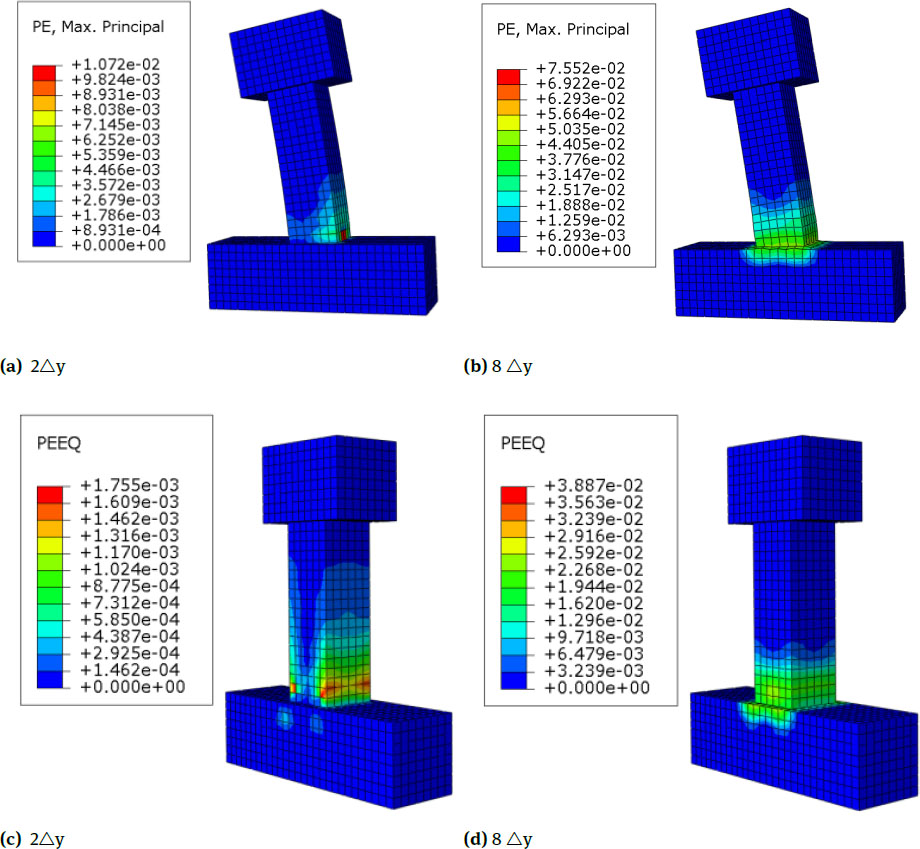
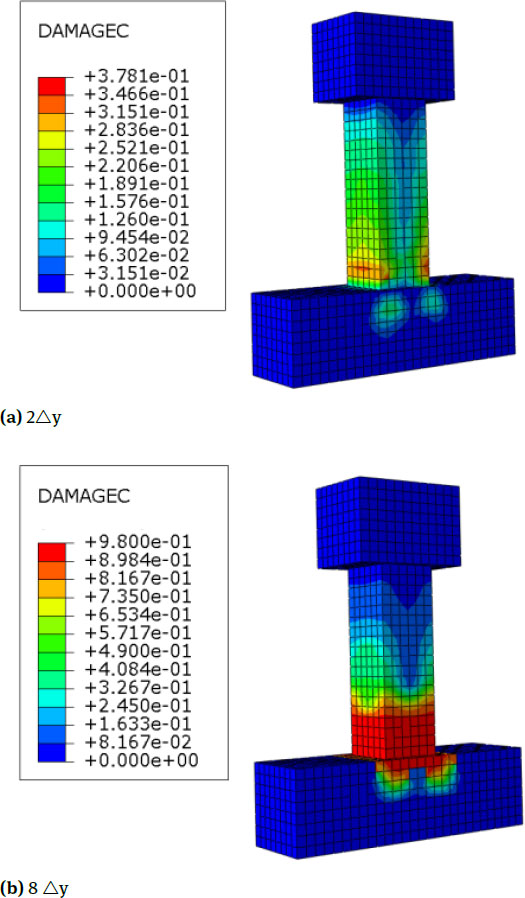
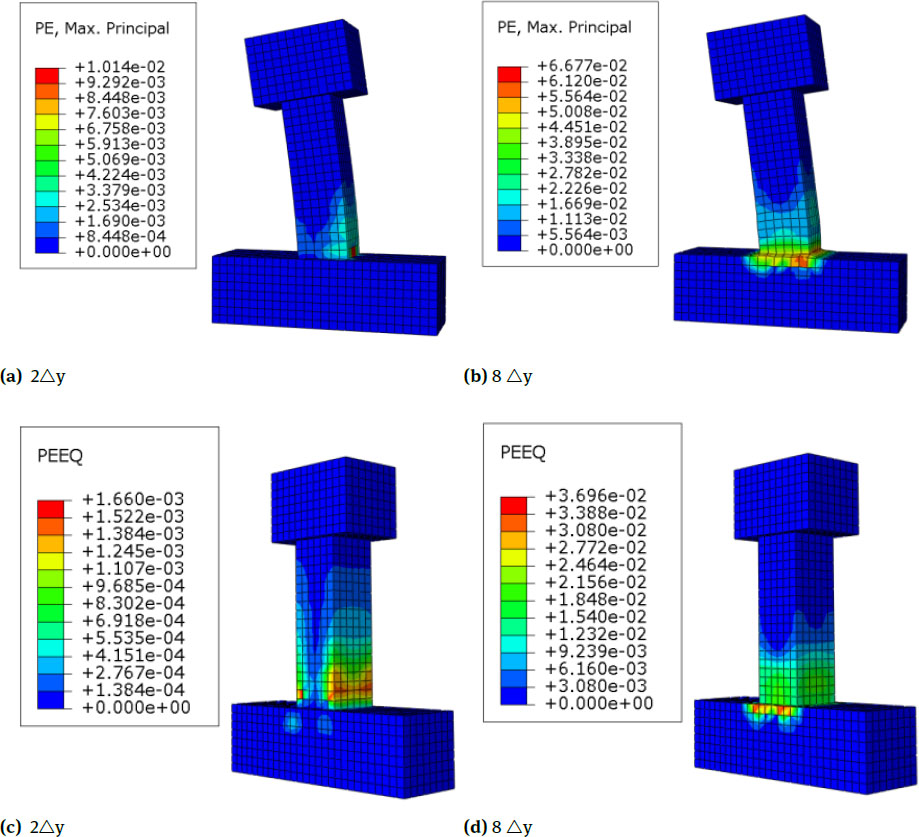
Specimens C2,C3 and C4 (RC Columns Strengthened with Two To Four Layers)
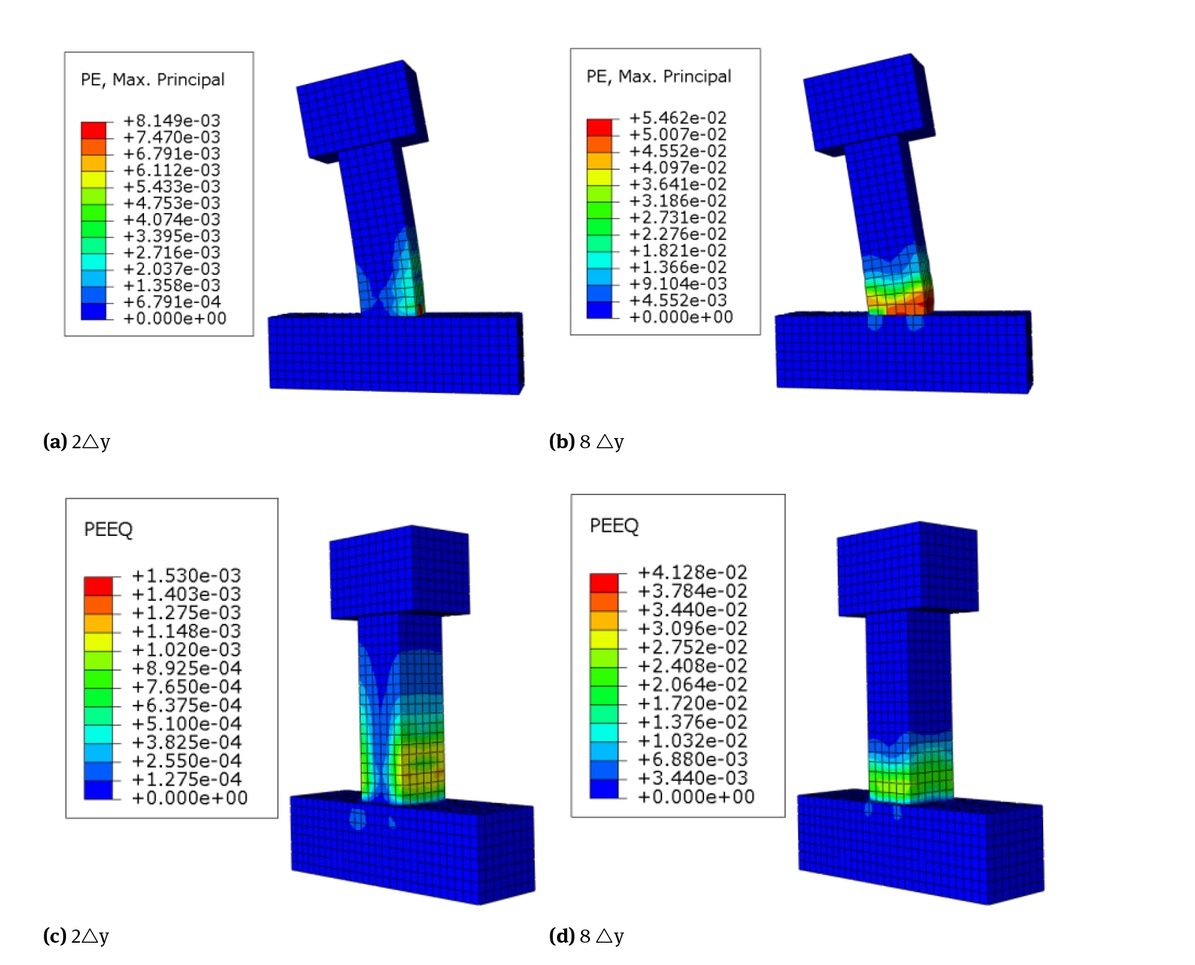
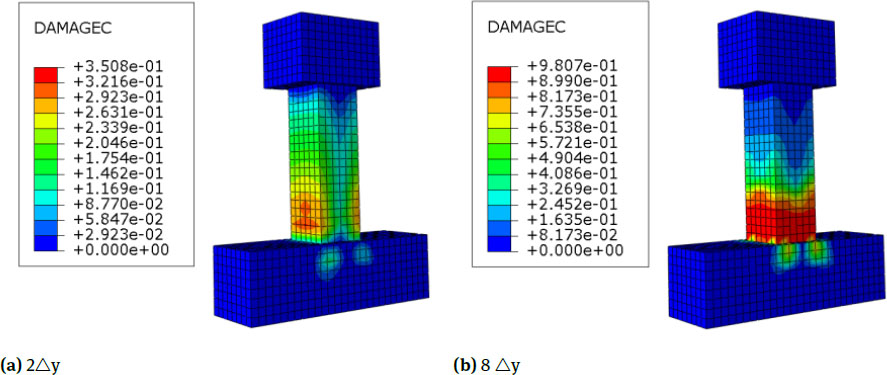
The cloud pictures of equivalent plastic strain and maximum principal plastic strain of the specimens C2,C3 and C4 are shown in Fig. 8, Fig. 10 and Fig. 12. Compared with the unreinforced specimens in the former section, when the core concrete of the reinforced specimens is at its peak displacement, the column body generates a large plastic strain; the strain at the bottom of the column body on the tensile side is the largest and gradually decreases towards the middle of the column body, and as the number of reinforcement layers increases, the plastic strain increases but the increase is not obvious. Compared with the unreinforced column, the plastic strain distribution of the reinforced column is more uniform and the swelling deformation at the bottom of the column is relatively small, and with the increase of the number of reinforcement layers, the restraining effect on the core concrete is enhanced, and the expansion deformation is gradually reduced; the concrete deformation decreases gradually from the bottom to the middle of the column. Compared with the unstrengthened specimens in the former section, the principle of gradual change of the plastic strain cloud pictures of the strengthened specimens is basically the same, but the strain distribution of the strengthened column ismore uniform in the loading process. The stress cloud pictures show that the cracking load and yield load of the specimen increase,which indicates that the cracks of the strengthened column appeared late, and the distribution of cracks is relatively uniform and dense. In addition, horizontal cracks of the strengthened column are most fully developed in the lower side of the column followed by the middle side, and the development of the upper side is not clear. The distribution cloud pictures of the compressive damage are in Fig. 9, Fig. 11 and Fig. 13. Compared with the unreinforced column, the distribution of compressive damage on the column body of the strengthened column is largely the same, but the degree of compression is smaller, and the distribution is more uniform.
Nephograms of Equivalent Plastic Strain and Maximum Principal Plastic Strain of C2
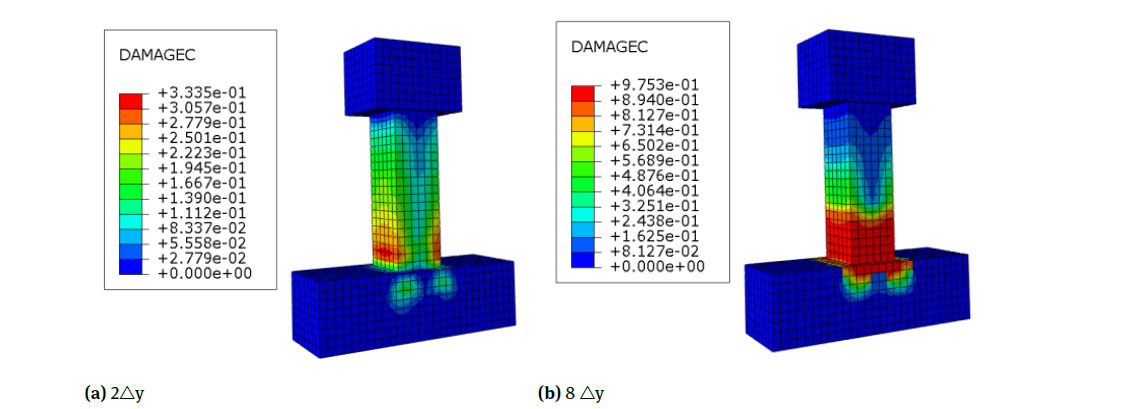
Nephograms of Compression Damage of C2
Nephograms of Equivalent Plastic Strain and Maximum Principal Plastic Strain of C3
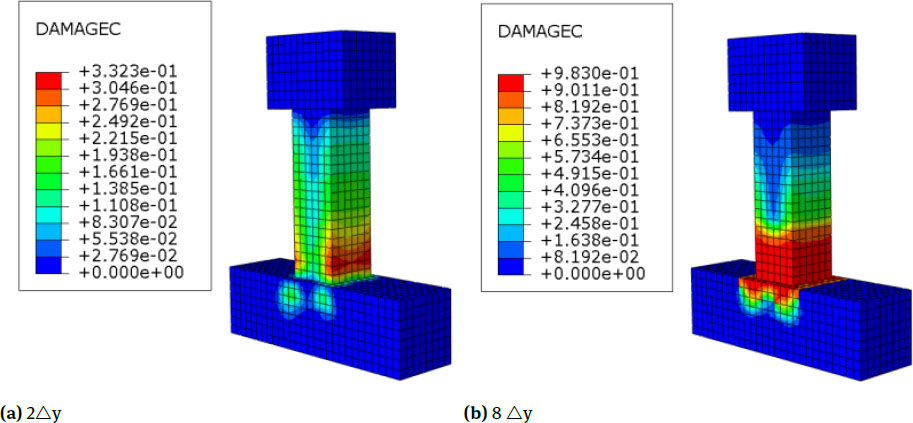
Nephograms of Compression Damage of C3
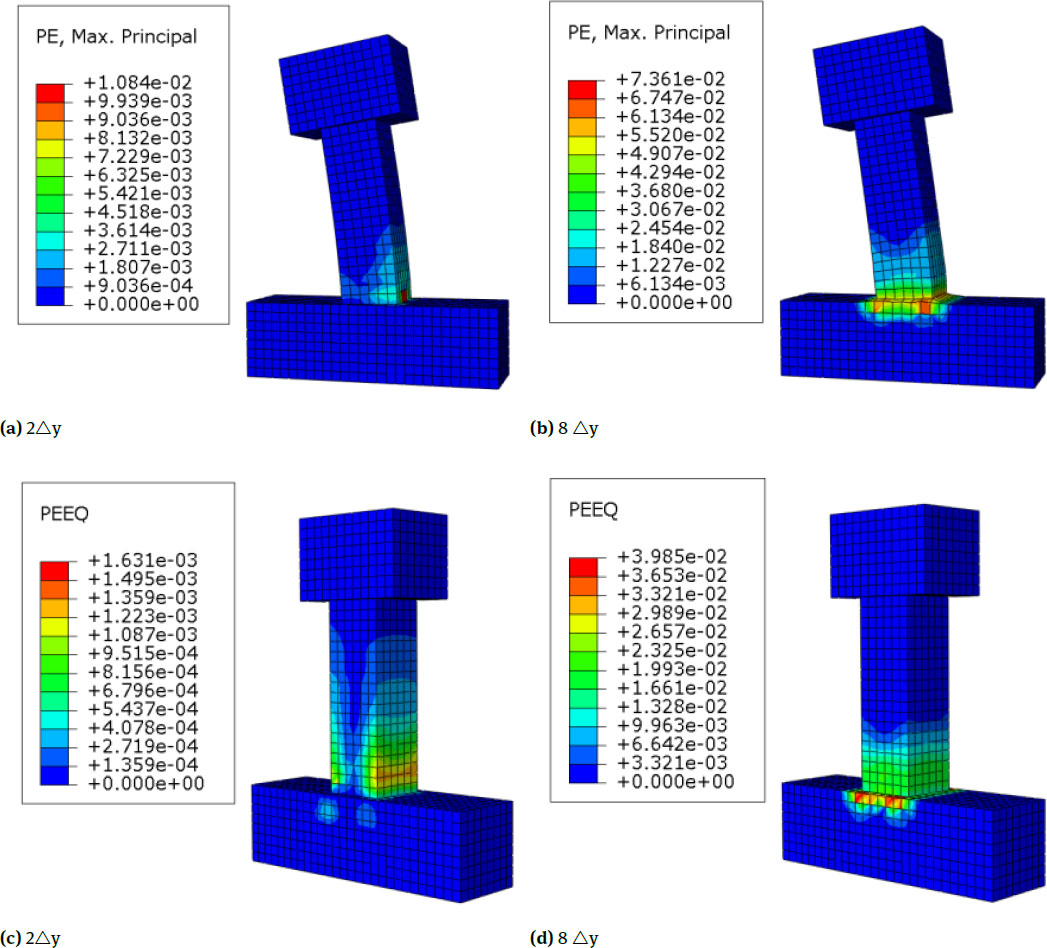
Nephograms of Equivalent Plastic Strain and Maximum Principal Plastic Strain of C4
Nephograms of Compression Damage of C4
Specimen C5 (Stirrup Spacing is 50)
In this part, the specimens with stirrup spacing of 50 (C5) and 150 (C6) (concrete strength of C40 and TRC reinforcement of two layers) are compared with C2 specimens, and the seismic behaviour is analysed.
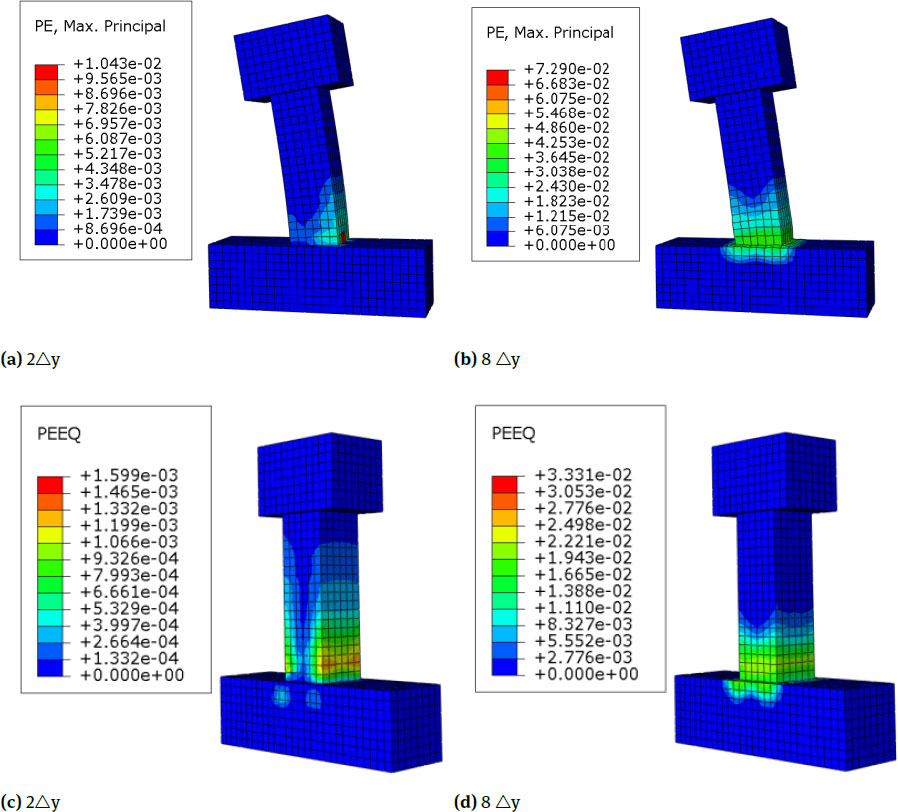
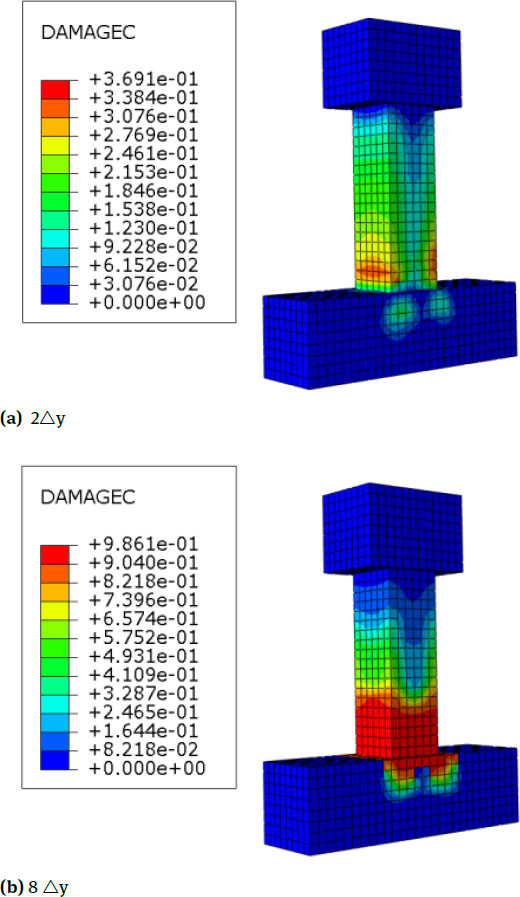
The cloud pictures of equivalent plastic strain and maximum principal plastic strain of the specimen are shown in Fig. 14, combined with the deformation figure of the RC column. Compared with the specimens with stirrup spacing of 100 (C2), TRC columns with stirrup spacing of 50 (C50) have smaller swelling deformation at the bottom of the column during the loading process. This finding is observed because the stirrup spacing decreases, the stirrup ratio of the specimen increases, and the stirrup of the column can effectively restrain the core concrete’s swelling deformation. Combined with the distribution cloud pictures of the compressive damage in Fig. 15, it can be seen that the compressive damage area of TRC columns strengthened with stirrup spacing of 100 (C2) is relatively smaller than that with stirrup spacing of 50 (C5). With the increase of the stirrup ratio, the crack of core concrete in the column body decreases gradually under the same horizontal load and axial force. This finding is observed because the increase of the stirrup ratio can effectively restrain core concrete and reduce its deformation, thereby improving the ductility and seismic behaviour of the specimen. In addition, with the gradual increase of horizontal load, the cracks in the column body gradually expand along the whole section of the specimen, and finally, the whole section is connected, resulting in the reduction of the bearing capacity of the specimen to failure.
Nephograms of Equivalent Plastic Strain and Maximum Principal Plastic Strain of C5
Nephograms of Compression Damage of C5
Specimen C5 (Stirrup Spacing is 150)
The cloud pictures of equivalent plastic strain and maximum principal plastic strain of the specimen are shown in Fig. 16, combined with the deformation figure of RC column. Compared with the specimens with stirrup spacing of 50 and 100 (C2, C5), the swelling deformation of TRC columns with stirrup spacing of 150 (C6) at the bottom of the column increases during the loading process. This finding is observed because the stirrup spacing increases, the stirrup ratio of the specimen decreases, and the stirrup of the column fails to effectively restrain the core concrete’s swelling deformation. Compared with TRC columns with stirrup spacing of 50 and 100 (C2, C5), TRC columns with stirrup spacing of 150 (C6) have largely the same gradual change rule in the plastic strain cloud pictures, but the plastic strain distribution range of the column increases during the loading process. This finding indicates that the range-increase and development of cracks in core concrete with a small stirrup ratio are more obvious than those of other specimens because the stirrup ratio decreases and the restraining effect of the stirrups is low. It can be seen from the distribution cloud pictures of the compressive damage in Fig. 17 and Table 5 that for those specimens with a low stirrup ratio, in the late loading stage, the compressive damage area increases, and its ductility and seismic behaviour weaken.
Nephograms of Equivalent Plastic Strain and Maximum Principal Plastic Strain of C6
Nephograms of Compression Damage of C6
(2) Analysis of Maximum Principal Strain
According to the maximum principal strain nephogram of carbon fibre, the carbon fibre in specimen C2 has a large strain at the bottom of the specimen in the process of horizontal load loading, and the maximum strain appears at the corner of the plastic hinge region at the bottom of the column and the tensile side. This strain is caused by the stress concentration at the corner of the specimen and the core concrete’s swelling deformation; the carbon fibre strain increases gradually with the increase of the horizontal load. Compared with specimen C5, the carbon fibre strain value of specimen C6 is larger in the process of horizontal load. This phenomenon exists because the column of the specimen with a small stirrup ratio will produce obvious swelling deformation under horizontal load and axial force, which leads to the increase of the carbon fibre hoop stress and strain. In addition, compared with specimen C5, the strain of the carbon fibre in specimen C2 is relatively small during horizontal displacement loading, which indicates that the specimens with a higher stirrup ratio have smaller carbon fibre strain under the same horizontal load. It can be seen from the strain nephogram that the carbon fibre of each specimen can still play an effective restriction effect in the corner and the tension side of the specimen until the specimen is destroyed, which indicates that carbon fibre can fully play a constraint role in the process of low-cycle repeated loading.
2.2 Analysis of Hysteretic Curve
(1) Influence of the Number of Reinforcement Layers on TRC Columns
The hysteretic curves of specimens with different reinforcement layers are shown in Fig. 18. The hysteretic curves of the concrete columns before and after reinforcement have a shuttle shape; however, the bearing capacity of the unreinforced column C0 decreases rapidly after it reaches the peak load and passes through several hysteretic loops, and the seismic behaviour of the specimen is poor. Compared with unreinforced columns, the hysteretic curves of reinforced columns are full, and the number of hysteretic loops increases obviously before being destroyed. It can be seen from Table 5 that the horizontal bearing capacity and ductility of the strengthened components have been improved. This finding indicates that the seismic behaviour of the TRC strengthened specimens improves compared with the unstrengthened specimens, and it increases with an increase of the number of strengthened layers within a certain range.
Hysteretic curves of the specimens with different numbers of reinforcement layers
(2) Influence of Stirrup Ratio on TRC Columns
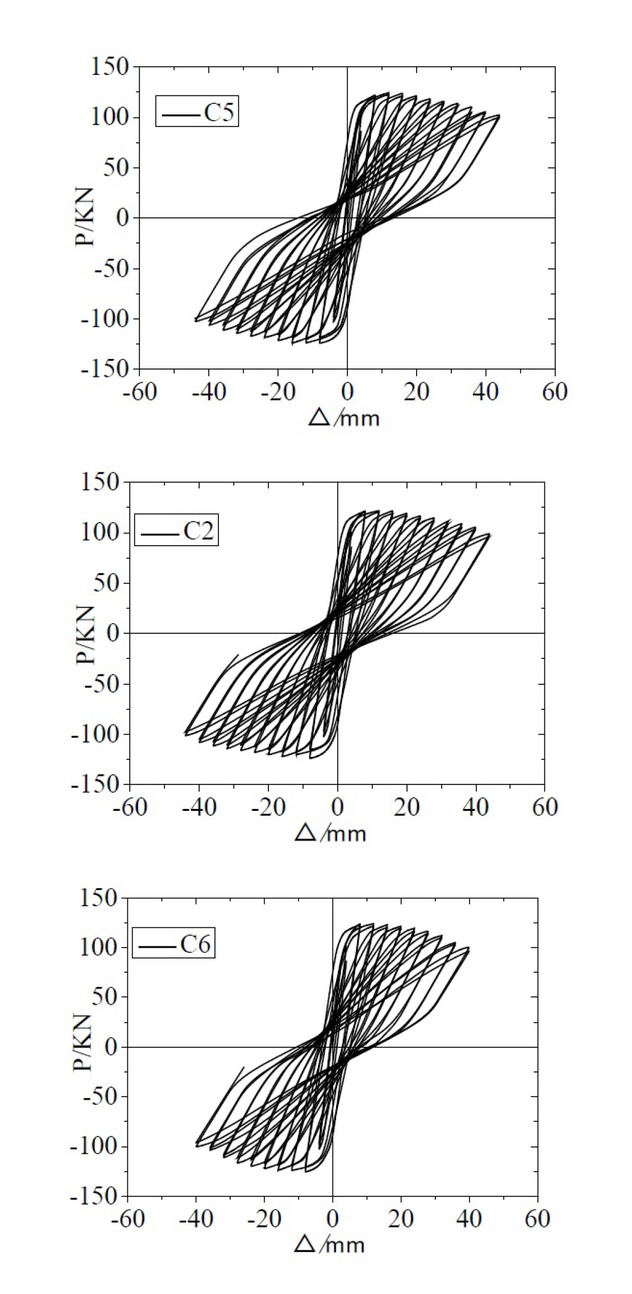
The hysteretic curves of specimens with different stirrup spacings are shown in Fig. 19, although the stirrup spacing has no obvious effect on the peak load and failure load of specimens. However, the hysteresis loop area of specimen C5 (stirrup spacing 50) is larger than that of specimen C2 (stirrup spacing 100) and C6 (stirrup spacing 150). Furthermore, the bearing capacity of specimen C5 decreases more slowly after reaching the peak load, which indicates that within a certain range, the smaller the stirrup spacing is, the better the deformation and energy dissipation capacity of the specimen are. It can be seen from the hysteretic loop curves of specimens with different reinforcement layers in the former section that although the stirrup spacing in C3 and C4 is larger than that in C5 specimens, the hysteretic loop fullness and bearing capacity decline rate are better than that of C5. Therefore, TRC reinforcement can effectively restrain core concrete, and its restraint effect is better than that of a simple stirrup.
Hysteretic curves of different stirrup spacings
2.3 Analysis of Skeleton Curves
(1) Influence of Reinforcement Layer Number on TRC Columns
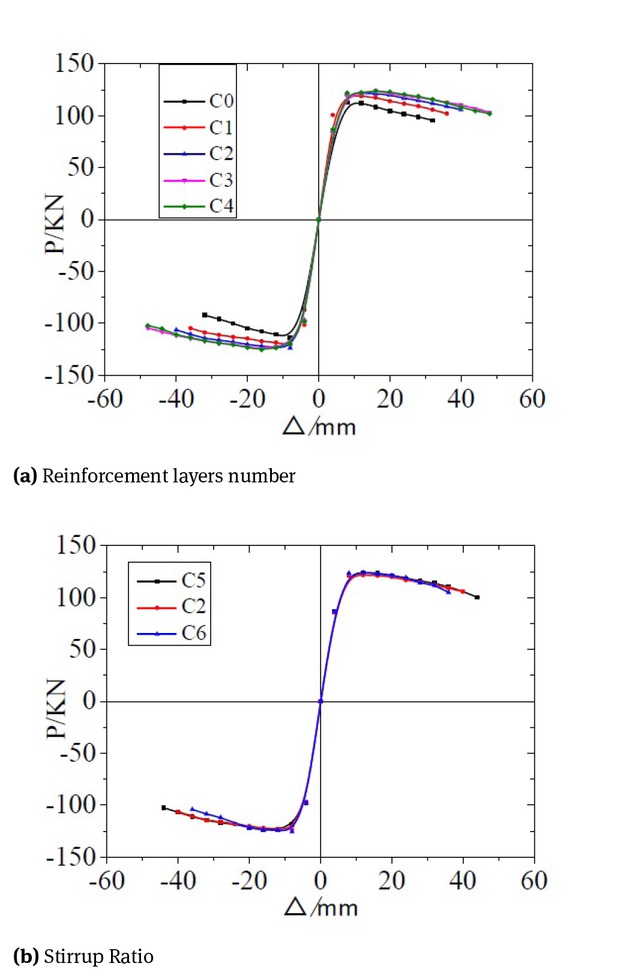
The skeleton curves of specimens with different reinforcement layers are shown in Fig. 20(a). The reinforced column and the unreinforced column go through several stages under the action of low-cycle repeated load, namely, the elastic stage, the elastic-plastic stage, the plastic strengthening stage and the plastic decline stage. In the elastic stage, the initial stiffness of the TRC strengthened column is slightly greater than that of the unstrengthened column. This finding is observed because the TRC reinforcement slightly increases the cross-section area of the specimen, but the different numbers of textile grid layers have no obvious influence on the rigidity of the specimen. With the increase of displacement, TRC reinforcement has no obvious influence on the yield load of the specimen. The descent segment of the skeleton curve of the strengthened column is long and the descending speed is slow. There is an obvious horizontal section, which indicates that TRC reinforcement can effectively restrain the core concrete and improve the ductility of columns significantly. By comparing the peak load before and after reinforcement, it can be seen that the peak load of specimens reinforced by 1–4 layers (C1, C2, C3 and C4) is 9.41%, 11.80%, 13.15% and 14.10% higher than that of specimens C0, respectively. It can be seen that the peak load increases with the increase of the number of reinforcement layers within the range of reinforcement 1 to 4, but the TRC reinforcement has a limited increase in the peak load of the specimens because the longitudinal reinforcement still bears the main load during the whole loading process.
The contrast skeleton curves
(2) Influence of Stirrup Ratio on TRC Columns
Based on data in Table 5, the relationship between the skeleton curves of specimens with different stirrup spacing is shown in Fig. 20(b). The specimens with stirrup spacing of 100 (C2) and 150 (C6) showed no significant changes in the yield load, peak load and ultimate load compared with specimens with stirrup spacing of 50 (C5). Therefore, the increase in the stirrup ratio could not significantly improve the bearing capacity of specimens. However, the bearing capacity of specimens C5 and C2 decreased more slowly than that of specimen C6 after reaching the peak load, and it will be destroyed only after experiencing more hysteretic loops and horizontal displacement. Therefore, it can be seen that the deformation and ductility performance of specimens increase with the increase of stirrup ratio in the later stage of horizontal load loading. The reason is that the stirrup with large stirrup ratio can fully develop the idea of restraint performance and improve the deformability of the specimen at the later stage of loading.
2.4 Analysis of Ductility
The main numerical results of the specimens are shown in Table 3, and the ductility factor is equal to the figure of dividing ultimate displacement by yield displacement. Additionally, there are many methods to determine the yield point, e.g. energy equivalence method, geometric drawing method, Park method [20] and Feng method [21]. The ultimate displacement mainly refers to the displacement corresponding to the load that is the 85% of peak load or the displacement when the specimens are damaged. In this paper, the yield point is determined with the Park method and the ultimate displacement was corresponding to the ultimate load that was the 85% of peak load in the skeleton curves.
(1) Influence of Reinforcement Layer Number on TRC Columns
From the data in Table 4, the displacement ductility ratios of each strengthened specimen (C1, C2, C3, C4) increase by 55.05%, 58.49%, 49.08%, and 51.38%, respectively, compared with the unreinforced specimens (C0). This finding indicates that TRC reinforcement can effectively improve column ductility, and the increase of the displacement ductility ratio increases with the increase of reinforcement layers within the range of 1 to 2 layers. Moreover, when the textile grid is arranged with two layers, the TRC reinforcement increases the ductility coefficient of the specimen most effectively. However, the increased range of the displacement ductility ratio is basically the same whenthe textile grid is arranged with 3 or 4 layers, which indicates that the increased range of the specimens’ ductility is limited when the textile grid is arranged with 3 or more layers.
(2) Influence of the Stirrup Ratio on TRC Columns
From the data in Table 4, the displacement ductility coefficients of the specimens with stirrup spacings of 100 (C2) and 150 (C6) were 8.96% and 18.44% lower than those with stirrup spacing of 50 (C5), respectively. It can be seen that the ductility coefficient of specimens increases with the increase of the stirrup ratio. This increase occurs because the increase of the stirrup ratio enhances the deformation capacity of specimens; after the bearing capacity of the specimens reaches the peak, the bearing capacity of specimens with larger stirrup ratio declines slowly, and the failure displacement of specimens increases, thereby improving the ductility of specimens. The displacement ductility coefficient of specimen C0 (unreinforced, stirrup spacing 100) is 41.97% lower than that of sample C6 (reinforced by two layers, stirrup spacing 150). It can be seen that compared with a simple stirrup, TRC has a more obvious constraint effect and can effectively improve the deformation capacity of the specimen and enhance its seismic behaviour.
2.5 Analysis of Stiffness Degradation
The stiffness degradation of each specimen is analyzed by reference to the equivalent secant stiffness, which is recommended in the reference literature [22], where η is the ratio of the secant stiffness to the yield stiffness for each hysteresis loop and β is the ratio of peak displacement to yield displacement.
(1) Influence of Reinforcement Layer Number on TRC Columns
The stiffness degradation curves of specimens with different reinforcement layers are shown in Fig. 21(a). Before reaching the yield load, the stiffness degradation rate of an unstrengthened column (C0) is largely the same as that of a strengthened column (C1, C2, C3, C4). Nevertheless, before reaching the yield point, the deformation of the specimen is still dominated by elastic deformation. However, after the yield load point, the stiffness degradation rate of C0 obviously increases. The degradation rate of other reinforced columns is slightly different, but the overall difference is not large. The total length of the degradation curves of specimens C3 and C4 are relatively long, indicating that they have good seismic behaviour. In general, TRC reinforcement mainly delays the stiffness degradation of specimens after yielding and ensures sufficient deformation capacity of specimens during large displacement cycle. The number of textile grid layers increases the failure displacement of components but has no obvious influence on the stiffness degradation rate.
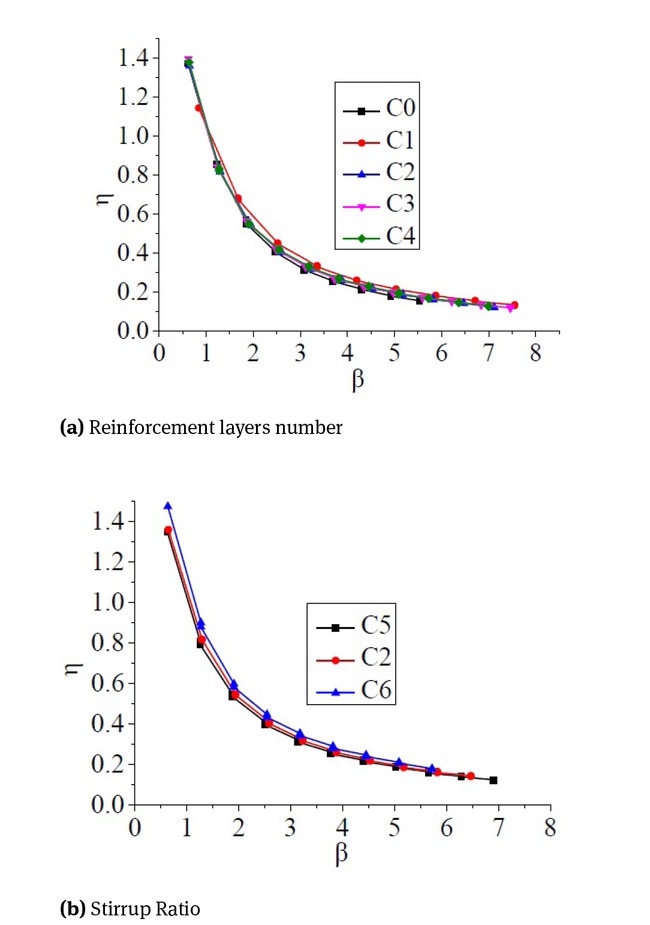
The stiffness degradation curve
(2) Influence of Stirrup Ratio on TRC Columns
The stiffness degradation curves of specimens with different stirrup spacing are shown in Fig. 21(b). Before and after yield, the curves of C2 are nearly coincident with those of C5 and C6, but the stiffness degradation curve of C5 is relatively gentle. At a later stage of loading, the curve of specimen C5 is longer, indicating that the strengthened column with a large stirrup ratio has better ductility and deformation capacity. By observing the degradation curves of C2 and C5, it can be found that the two curves almost overlap; both the size of the stiffness and the stiffness degradation trends are very similar, which indicate that lowering a column’s stirrup ratio within a certain range will have no effect on the stiffness degradation of specimens. This finding further demonstrates that when the layout of a stirrup is small, the TRC restricts the specimens effectively.
2.6 Analysis of Energy Dissipation Capacity
(1) Influence of Reinforcement Layer Number on TRC Columns
The accumulated energy dissipation curves of specimens with different reinforcement layers are shown in Fig. 22(a). The total energy dissipations of reinforced columns (C1, C2, C3 and C4) were 26.90%, 79.81%, 87.54% and 86.13% higher than that of unreinforced columns (C0), respectively. It can be seen that TRC reinforcement within the range of 1 to 3 layers of textile grid layout can effectively improve the energy dissipation capacity of components, and it increases with an increase of the number of reinforcement layers, but the increase of energy dissipation capacity is limited when the number of textile grid layout layers is increased. From the aspect of energy dissipation rate, the unstrengthened column and the strengthened column are largely the same before and after reaching the yield point, which is consistent with the stiffness degradation law. However, in the later stage of displacement loading, the energy dissipation rate of the strengthened column increases, and the role of TRC is fully utilized. As the number of layers of textile grid increases, the rate of energy dissipation of the specimen increases slightly, but the increase is not obvious.
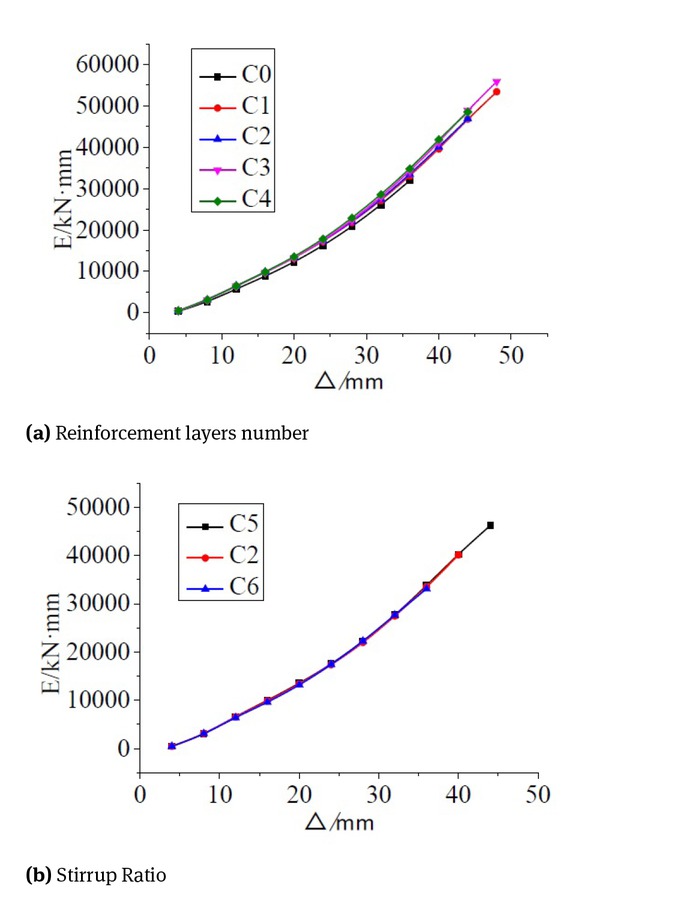
Accumulated energy dissipation curve
(2) Influence of Stirrup Ratio on TRC Columns
The energy dissipation curves of specimens with different stirrup spacing are shown in Fig. 22(b). The accumulated energy dissipation of C2 and C5 increased by 39.77% and 38.04%, respectively, compared with that of C6. This finding is observed because the cyclic displacements of C2 and C5 are slightly larger than that of C6. Therefore, increasing the stirrup ratio of a TRC strengthened column can improve the column’s deformation capacity and seismic behaviour. Except for when the accumulated energy dissipation curves of C2 and C6 at the later stage of displacement loading are different, the energy dissipation curves at other stages are largely coincident; this finding indicates that the reduction of the stirrup ratio has little influence on the energy dissipation capacity of the strengthened column within a certain range of stirrup ratios.
3 Conclusions
In this paper, the finite element analysis software ABAQUS is used to establish the finite element analysis model of RC columns strengthened by TRC. The rationality of the model is verified and analysed by modelling, selecting a constitutive relation, and determining such parameters as the element type, interface treatment and mesh generation.
Within the range of 1 to 3 layers of textile grid layout, the peak load, displacement ductility ratio and energy dissipation capacity of TRC strengthened columns increase with the increase of the number of layers, although the increased range is limited. With the increase of the number of textile grid layers, the energy dissipation rate of the specimen also increases slightly but not obviously. In addition, the number of textile grid layers has no obvious influence on the yield load and stiffness degradation rate of the specimen.
In the case of the same number of reinforcement layers and a different stirrup ratio, the yield load, peak load and ultimate load of the specimens do not change significantly with the increase of stirrup spacing, but the ductility coefficient and energy dissipation capacity of the specimens increase with the decrease of stirrup spacing.
TRC reinforcement can effectively restrain core concrete, and its constraint effect is better than the effect of a simple stirrup. When the amount of stirrup is small, TRC plays an efficient constraint role on the specimen, which can effectively improve the deformation capacity of the specimen and enhance its seismic behaviour.
Acknowledgement
The authors gratefully acknowledge the financial support from the Fundamental Research Funds for the Central Universities (2017XKZD09). The experimental work described in this paper was conducted at the Jiangsu Key Laboratory of Environmental Impact and Structural Safety in Civil Engineering in the China University of Mining and Technology. Helps during the testing from staffs and students at laboratory are greatly acknowledged.
Compliance with Ethical Standards
Funding This study was funded by the Fundamental Research Funds for the Central Universities (2017XKZD09)
Conflict of interest: The authors declare that they have no conflict of interest.
Data availability statement The datasets used or analysed during the current study are available from the corresponding author on reasonable request.
References
[1] Gao M, Hui L(2015) Experimental study of the seismic behavior of predamaged reinforced-concrete columns retrofitted with basalt fiber-reinforced polymer. Journal of Composites for Construction, 19(6): 1-1210.1061/(ASCE)CC.1943-5614.0000572Search in Google Scholar
[2] Dong ZH, Du XL,Han Q (2013) Review of the study on the seismic performance of FRP reinforced reinforced concrete pier column . Journal of architectural science and engineering, 30(2): 55-64(in Chinese)Search in Google Scholar
[3] Parvin A, Granata P (2000) Investigation on the effects of fiber composites at concrete joints. Composites Part B-Engineering, 31(6-7): 499-50910.1016/S1359-8368(99)00046-3Search in Google Scholar
[4] Lakshmi GA, Dutta A, Deb SK (2008) Numerical studies of strengthening of beam-column joint under cyclic excitation using FRP composites . Journal of Structural Engineering, 35(1): 59-65Search in Google Scholar
[5] Mahini SS, Niroomandi A, Ronagh HR (2008) Performance based assessment of FRP-retrofitted existing RC frames. Fourth International Conference on FRP Composites in Civil Engineering (CICE2008),22-24 July,Zurich, SwitzerlandSearch in Google Scholar
[6] Niroomandi A ,Maheri A ,Maheri MR ,Mahini SS (2010) Seismic performance of ordinary RC frames retrofitted at joints by FRP sheets . Engineering Structures, 32: 2326-233610.1016/j.engstruct.2010.04.008Search in Google Scholar
[7] Rizwan A, Khaled S, Jeffrey SW, Martin N (2018) Shear strengthening of RC deep beams with cement-based composites . Engineering Structures, 172: 929-93710.1016/j.engstruct.2018.06.085Search in Google Scholar
[8] Regine O, Sebastian O (2017) Textile reinforced concrete for strengthening of RC columns:A contribution to resource conservation through the preservation of structures. Construction and Building Materials, 132: 150-16010.1016/j.conbuildmat.2016.11.133Search in Google Scholar
[9] Faleschini F, Gonzalez-Libreros J, Zanini MA, Hofer L, Sneed L, Pellegrino C (2019) Repair of severely-damaged RC exterior beam-column joints with FRP and FRCM composites. Composite Structures, 207: 352-36310.1016/j.compstruct.2018.09.059Search in Google Scholar
[10] Homoro O, Xuan HV, Ferrier E (2018) Experimental and analytical study of the thermo-mechanical behaviour of textile-reinforced concrete (TRC) at elevated temperatures: Role of discontinuous short glass fibres. Construction and Building Materials, 190: 645-66310.1016/j.conbuildmat.2018.09.142Search in Google Scholar
[11] Kouris L, Alexandros S, Triantafillou TC (2019) Design methods for strengthening masonry buildings using textile-reinforced mortar. Journal of Composites for Construction, 23(1): 0401807010.1061/(ASCE)CC.1943-5614.0000906Search in Google Scholar
[12] Isabella Giorgia C, Matteo C, Marco DP, Farhang P (2018) Analytical and numerical prediction of the bending behaviour of textile reinforced concrete sandwich beams. Journal of Building Engineering, 17: 183-19510.1016/j.jobe.2018.02.012Search in Google Scholar
[13] Bournas DA, Triantafillou T (2011) Bar buckling in RC columns confined with composite materials . Journal of Composites for Construction, 15(3): 393-40310.1061/(ASCE)CC.1943-5614.0000180Search in Google Scholar
[14] Al-Salloum YA, Siddiqui NA, Elsanadedy HM, Abadel AA, Aqel MA (2011) Textile-reinforced mortar versus FRP as strengthening material for seismically deficient RC beam-column joints. Journal of Composites for Construction, 15(6): 920-93310.1061/(ASCE)CC.1943-5614.0000222Search in Google Scholar
[15] Alhaddad MS, Siddiqui NA, Abadel AA, Alsayed SH, and Al- Salloum YA (2012) Numerical investigations on the seismic behavior of FRP and TRM upgraded RC exterior beam-columnjoints . Journal of Composites for Construction, 16(3): 308-321.10.1061/(ASCE)CC.1943-5614.0000265Search in Google Scholar
[16] Yin SP, Li Y, Yang Y, Ye T (2017) Factors Affecting Seismic Performance of RC Columns Strengthened with Fiber Braided Reinforced Concrete. Journal of Zhejiang University(Engineering Science), 51(5): 904-913.(in Chinese)Search in Google Scholar
[17] Jiang JQ (1994) Collected in Works Contemporary Civil and Architectural Science and Technology. Shanxi Science and Technology Press, (in Chinese)Search in Google Scholar
[18] Liu D, Huang H, Zuo J (2017) Experimental and numerical study on short eccentric columns strengthened by textile-reinforced concrete under sustaining load . Journal of Reinforced Plastics & Composites, 36(23):1712-172610.1177/0731684417725396Search in Google Scholar
[19] Peng ZZ, Wang ZQ (2010) ABAQUS FEM Analysis on Knee Joints in Reinforced Concrete Frames. Journal of Chongqing Jiaotong University(Social Sciences Edition) , 29(5): 677-680. (in Chinese)Search in Google Scholar
[20] Park R, Paulay T(1975) Reinforced concrete structures, John Wiley & Sons, New York.10.1002/9780470172834Search in Google Scholar
[21] Feng P, Cheng S, Bai Y, Ye LP(2015) Mechanical behavior of concrete-filled square steel tube with FRP-confined concrete core subjected to axial compression, Composite Structures, 123, 312-324.10.1016/j.compstruct.2014.12.053Search in Google Scholar
[22] Deng Z C, Zeng H C, Zhang XD(2010) Seismic performance of square reinforced concrete columns strengthened with hybrid FRP, Journal of Beijing University of Technology, 36(8):1069-1076 (in Chinese).Search in Google Scholar
© 2019 Liu Ming et al., published by De Gruyter
This work is licensed under the Creative Commons Attribution 4.0 Public License.
Articles in the same Issue
- Analysis on the impact response of fiber-reinforced composite laminates: an emphasis on the FEM simulation
- Artificial neural network for predicting the flexural bond strength of FRP bars in concrete
- Cyclic behavior of GFRP strengthened infilled RC frames with low and normal strength concrete
- Durability of basalt fiber-reinforced polymer bars in wet-dry cycles alkali-salt corrosion
- Effect of B4C particle size on the mechanical properties of B4C reinforced aluminum matrix layered composite
- Enhanced dielectric properties of BaTiO3 ceramics with cerium doping, manganese doping and Ce-Mn co-doping
- Free and forced vibration analysis of rectangular/circular/annular plates made of carbon fiber-carbon nanotube-polymer hybrid composites
- Influence of nano-SiO2 on the bonding strength and wear resistance properties of polyurethane coating
- Investigation of wear behavior of nanoalumina and marble dust-reinforced dental composites
- Negative effect of clay fillers on the polyvinyl alcohol biodegradation: technical note
- Photocatalytic activity of Cu2O/ZnO nanocomposite for the decomposition of methyl orange under visible light irradiation
- Sub-surface mechanical properties and sub-surface creep behavior of wood-plastic composites reinforced by organoclay
- Surface integrity in wire-EDM tangential turning of in situ hybrid metal matrix composite A359/B4C/Al2O3
- The influence of the WC-Co composite microstructure model on stress field heterogeneity at the microstructure level: FEM based study
- Vibration-damping characterization of the basalt/epoxy composite laminates containing graphene nanopellets
- A review on nanocomposite hydrogels and their biomedical applications
- Optimization and simulation analysis of structure parameters of OPCM ultrasonic longitudinal wave actuating element
- Research Article
- Preparation of POSS-triol/wollastonite composite particles by Liquid phase mechanochemical method and its application in UV curable coatings
- Research on preload relaxation for composite pre-tightened tooth connections
- Dough moulding compound reinforced silicone rubber insulating composites using polymerized styrene butadiene rubber as a compatibilizer
- Hydration And Microstructure Of Astm Type I Cement Paste
- Effects of NiO content on the microstructure and mechanical properties of AgSnO2NiO composites
- Overall buckling behaviour of laminated CFRP tubes with off-axis ply orientation in axial compression
- UV sensing optode for composite materials environment monitoring
- On crushing characteristics of hybrid sandwich aluminum-cardboard panels reinforced with glass fiber composite rods
- Preparation and characterization of Ni-Cu composite nanoparticles for conductive paints
- A research on the preparation of oil-adsorbing hydrophobic porous resins by high internal phase emulsions (HIPEs) template
- Material characteristics of random glass-mat-reinforced thermoplastic under cryogenic thermal cycles
- Differentiation of non-black fillers in rubber composites using linear discriminant analysis of principal components
- Research Article
- Efficiency of TiO2 catalyst supported by modified waste fly ash during photodegradation of RR45 dye
- Synthesis and performance of polyurethane/silicon oxide nano-composite coatings
- Study on preparation of magnesium-rich composite coating and performance enhancement by graft modification of epoxy resin
- Research Article
- Mechanical and wear properties of polyetheretherketone composites filled with basalt fibres
- Mechanical Properties of Al 25 wt.% Cu Functionally Graded Material
- Research Article
- Weight reduction of a carbon fibre composite wheel
- Synthesis, electrical properties, and kinetic thermal analysis of polyaniline/ polyvinyl alcohol - magnetite nanocomposites film
- Seismic Behaviour of TRC-Strengthened RC Columns under Different Constraint Conditions
- Characterization of neat and modified asphalt binders and mixtures in relation to permanent deformation
- Microstructures, interface structure and room temperature tensile properties of magnesium materials reinforced by high content submicron SiCp
- Research Article
- Effect of Cutting Temperature on Bending Properties of Carbon Fibre Reinforced Plastics
- Mechanical and tribological properties of B-C-N coatings sliding against different wood balls
- Thermal conductivity of unidirectional composites consisting of randomly dispersed glass fibers and temperature-dependent polyethylene matrix
- Effects of Waste Eggshells addition on Microstructures, Mechanical and Tribological Properties of Green Metal Matrix Composite
- Investigation of porosity effect on flexural analysis of doubly curved FGM conoids
- Review Article
- Utilization of tailings in cement and concrete: A review
- Research Article
- Equivalent stiffness prediction and global buckling analysis using refined analytical model of composite laminated box beam
- Mechanochemical synthesis of zincite doped with cadmium in various amounts
- Size-dependent vibration analysis of graphene-PMMA lamina based on non-classical continuum theory
- Automated, Quality Assured and High Volume Oriented Production of Fiber Metal Laminates (FML) for the Next Generation of Passenger Aircraft Fuselage Shells
- Research Article
- An investigation of the stitching effect on single lap shear joints in laminated composites
- The low-velocity impact and compression after impact (CAI) behavior of foam core sandwich panels with shape memory alloy hybrid face-sheets
- Effect of granulometric distribution on electromagnetic shielding effectiveness for polymeric composite based on natural graphite
- The enhancement of filament winding in marine launching rubber gasbag
- Research on ELID Grinding Mechanism and Process Parameter Optimization of Aluminum-Based Diamond Composites for Electronic Packaging