Efficiency of TiO2 catalyst supported by modified waste fly ash during photodegradation of RR45 dye
-
 ,
,

Abstract
The waste fly ash (FA) material was subjected to chemical treatment with HCl at elevated temperature for a different time to modify its porosity. Modified FA particles with highest surface area and pore volume were further used as a support for TiO2 catalyst during FA/TiO2 nanocomposite preparation. The nanocomposite photocatalysts were obtained by in situ sol–gel synthesis of titanium dioxide in the presence of FA particles. To perform accurate characterization of modified FA and FA/TiO2 nanocomposite photocatalysts, gas adsorption-desorption analysis, X-ray diffraction, scanning electron microscopy, UV/Vis and Infrared spectroscopy were used. Efficiency evaluation of the synthesized FA/TiO2 nanocomposites was performed by following the removal of Reactive Red 45 (RR45) azo dye during photocatalytic treatment under the UV-A irradiation. Photocatalysis has been carried out up to five cycles with the same catalysts to investigate their stability and the possible reuse. The FA/TiO2 photocatalyst showed very good photocatalytic activity and stability even after the fifth cycles. The obtained results show that successfully modified waste fly ash can be used as very good TiO2 support.
1 Introduction
The degradation of harmful substances in water has attracted great interest in recent decades, due to the growing interest in the treatment of wastewater streams prior to their release into the environment. Effective removal of dyes from the textile industry is a serious issue, since even a small amount of dye is clearly apparent. Large quantities of synthetic dyes are widely used for dyeing processes, and about 50% of these are azo dyes [1]. Azo dyes can be converted to their intermediate products, such as aromatic amines, that can be toxic or carcinogenic compounds. The chemical structures of azo dyes have one or more azo groups (-N=N-) as a chromophore, responsible for the dye colour, and functional groups such as –NH2, –OH, –CH3, and –SO3 for the fixation of these dyes to fibres. Most azo dyes are considered to be basically non-degradable, and common degradation processes such as physicochemical treatment, active sludge, and oxidative techniques are unable to completely remove azo dyes from contaminated wastewaters [2]. As conventional methods of removing dyes have failed, alternative methods for wastewater treatment have been developed, including advanced oxidation processes (AOPs), with photocatalysis as the most popular method.
This technique is based on a promising heterogeneous photocatalytic oxidation process [3], which uses semiconducting metal oxides to produce electron-hole pairs by illumination with UV light in an aqueous medium. These charge carriers migrate to the photocatalyst surface and react with adsorbed species of suitable redox potential [4, 5, 6]. Titanium dioxide (TiO2) is one of the most used metal oxide photocatalysts, as it has high oxidative power. It is chemically stable, non-toxic, low cost and environmentally friendly. It is also active under ultraviolet (UV) light irradiation (<380 nm) and therefore widely used as a photocatalyst for the degradation of organic pollutants [7, 8]. However, fine TiO2, commonly in nanometre size, is subjected to agglomeration that reduces its surface that reflects to its catalytic efficiency. There is also a problem concerning
the separation and recovery of the photocatalyst at the end of the wastewater treatment. Therefore, supported TiO2 catalyst is one of the solutions to solve this problem. Intensive study has been carried out to immobilize the TiO2 photocatalyst on various supporting materials, such as silica [9, 10], montmorillonite [11], zeolites [12, 13] and activated carbon (AC) [14, 15, 16]. Fly ash is a waste material formed during the combustion process (coal, solid waste) that needs to be collected and recycled. As the fly ash from coal burning power plants is an aluminosilicate this makes it suitable material for use as a supporter of the catalyst. Thus, the selection of cheap waste material like fly ash as carrier of TiO2 catalyst seems to be a very good choice [17]. The enlarged specific surface of the support material provides more adsorption sites for TiO2, which then enhances its photocatalytic efficiency, i.e. increases its potential for pollutant removal.
Because of that in this study the photocatalytic efficiency of FA/TiO2 nanocomposite photocatalysts, in situ prepared by sol–gel synthesis, was evaluated by following the removal of Reactive Red 45 (RR45) azo dye in water. The stability and reuse of FA/TiO2 catalysts were also examined by studding photocatalytic efficiency in five consecutive cycles of photocatalysis.
2 Experimental
2.1 Materials
Hydrochloric acid (HCl, 37%), acetic acid (C2H4O2, 99.8%) and ethanol (C2H5OH, 99.7%) were obtained from Kemika, Croatia; tetra-n-butyl titanate (Ti(OC4H9)4, 99%) from Acros Organics and didecyl dimethyl ammonium chloride (C22H48ClN) from Lonza Ltd and were used without any further purification. All aqueous solutions were prepared with ultrapure water purified with Merc Millipore Direct-Q3 UV system. Commercial organic dye C.I. Reactive Red 45 dye (RR45) Ciba-Geigy (now BASF) was used as well as TiO2 (Aeroxide P25) ≥ 99.5%, nanopowder, 21 nm particle size from Evonik. Fly ash (FA) was supplied from Plomin Power Plant, Croatia. According to the received analysis composition of fly ash was: SiO2 (42.0%), CaCO3 (24.3%), Al2O3 (20.3%), Fe2O3 (5.5%), SO3 and K2O (2.4%), MgO (1.2%), TiO2 (0.6%) while traces of Cd, Hg and Pb were not found.
2.2 Fly ash modification
Waste fly ash (10 g) was mixed with 100 cm3 of 3.5 M HCl and heated in a water bath under reflux at 95 ∘C for 24 h with stirring. The powder was then filtered off, washed with distilled water until pH=7, dried at 120 ∘C for 12 h and the obtained modified sample was marked as FA-1. The same procedure of treatment with HCl was applied to obtain other two samples FA-2 and FA-4 that were treated 2 and 4 days, respectively.
2.3 Synthesis of FA/TiO2 nanocomposite
The sol-gel synthesis of pure TiO2 was performed as follows: Solution A, consisted of 20 mL tetra-n-butyl titanate, was dissolved in 20 mL anhydrous ethanol. 20 mL of 3 M acetic acid was added drop-wise into the solution under vigorous stirring (250 rpm) and stirred for another 15 min. Solution B consisted of 2.1 mL didecyl dimethyl ammonium chloride was mixed with 60 mL anhydrous ethanol and 20 mL distilled water and stirred for 15 min at room temperature. Finally, solution B was added drop-wise to solution A and the resultant mixture was vigorously mixed (7500 rpm) for another 45 min using disperser (IKA T25 digital TURRAX). The mixture in Erlenmeyer flask was then heated at 85 ∘C in an oven for another 24 h until the transparent sol was obtained. The obtained pure TiO2 (denoted as TiB) sample was washed with distilled water, dried at 100 ∘C for 12 h, and calcined at 400 ∘C for 3 h.
The in situ synthesis of TiO2 was carried out to prepare FA/TiO2 nanocomposite photocatalysts. The procedure of nanocomposite photocatalysts preparation was such that the modified FA1 sample was added to solution A, and then the solution was mixed with solution B according to the above procedure. Amounts of FA1 and Ti(OC4H9)4 were varied so different compositions of catalyst were obtained. Additionally commercial TiO2 Aeroxide P25 was mixed with FA1 prior to sol-gel synthesis of TiO2 and sample obtained by that procedure was named FA1/20-TiB-1. The weight ratios of FA, TiB (calculated from the amount of
Ti(OC4H9)4) and commercial TiO2 in composite photocatalysts are presented in Table 1. Since the nanoparticles of TiO2 have a tendency to agglomerate, which might lead to uneven or non-covered surface of fly ash particles, added mass of TiB was much higher than mass of FA. During the sol-gel synthesis, excess part of TiB was probably left free standing i.e. not anchored to the surface of FA and possibly lost during the washing procedure, so it was not possible to give exact composition of composite photocatalysts.
The weight ratios of components used for synthesis of FA/TiO2 nanocomposite photocatalysts
| FA/TiB samples | FA1 | TiB (TiO2) | TiO2 (P25) |
|---|---|---|---|
| wt.% | wt.% | wt.% | |
| FA1/16-TiB | 16 | 84 | - |
| FA1/20-TiB | 20 | 80 | - |
| FA1/20-TiB-1 | 19.8 | 79.2 | 1 |
2.4 Characterization methods
To determine the specific surface area (BET) and total pore volume of fly ash powder samples before and after modification, gas sorption analysis was performed using Micromeritics ASAP 2000. Samples were first degassed at 400 ∘C and then subjected to N2 adsorption. The Brunauer–Emmett–Teller (BET) surface area was calculated from theBET plot, while pore-size distribution was calculated using the BJH model. The crystal phases in prepared samples were identified by X-ray diffraction using the Shimadzu XRD 6000, with CuKα radiation of 40 kV and current of 30 mA, in the 2θ range 5–70∘ and with steps of 0.02∘. FTIR spectra were obtained by attenuated total reflectance Fourier transform infrared spectroscopy (ATR FTIR), using a Spectrum One FTIR spectrometer from Perkin Elmer, in the range from 4000 to 650 cm−1. The morphology of the studied photocatalysts was analyzed using a Tescan Vega 3 scanning electron microscope (SEM) at 20 kV. Before analysis, samples were sputter-coated with a thin layer of Au/Pd. UV/Vis reflectance measurements of the FA/TiO2 nanocomposite photocatalysts were performed in the range 200 to 800 nm at a spectral resolution of ~0.3–10 nm, using an Ocean Optics USB 2000+ Spectrometer.
2.5 Photocatalysis
All experiments were performed with simulated wastewater loaded by 30 mg/L of RR 45 azo dye and 1 g/L of photocatalyst while pH was kept at cca 7. Experiments were performed in a glass water-jacketed batch reactor equipped with the Pen-Ray UVP lamp emitting irradiation in the UVA region (at 254 nm), which was located in the middle of the reactor in a quartz tube. The total volume of the treated solution was 75 mL in all experiments. The suspension was magnetically stirred (250 rpm) in the dark for 30 min to reach the adsorption/desorption equilibrium and photocatalysis was performed for 90 minutes. Aliquots were taken from the reactor every 15 min, filtered and analysed by UV/Vis spectroscopy on Perkin Elmer Lambda EZ 201 by measuring the absorbance of the suspension at wavelength of RR 45 maximum absorbance (λ, 542 nm). To establish stability and efficiency of the studied photocatalyst, five consecutive cycles of photocatalysis under identical conditions were performed. After each cycle, samples were separated from the suspension by decantation, dried at room temperature for 12 h and reused in the next cycle. The percentage of RR45 degradation after each cycle was calculated according to the equation: removal (%) = (A0 - A)/A0 × 100%, where A0 and A are the initial absorbance and the absorbance at the specific time of RR45 degradation, respectively.
3 Results and discussion
3.1 Characterization of Fly ash
To elucidate the modified structure and chemical composition of fly ash (FA) samples the XRD analysis were used. Diffractograms yielded high mutual resemblance, and consisted of narrow diffraction lines, suggesting the presence of highly crystalline material, Figure 1a). Only, a very small hump centered at 23∘ 2𝛩 is characteristic for the presence of amorphous material, most likely silica-type amorphous material, common in fly ash systems. The untreated fly ash sample yielded crystalline phases corresponding to common crystalline compositions [18] found in fly ash material. These were: quartz (ICDD PDF#46-1045), mullite (ICDD PDF#79-1450), calcite (ICDD PDF#05-0586), calcium silicate (ICDD PDF#49-0442), minor fraction of hematite (ICDD PDF#33-0664) and magnetite (ICDD PDF#19-0629). All diffraction lines were assigned. Treated samples yielded the same phases,whereas calcium-containing phases were completely leached out (due to the chemical reaction between CaCO3 and HCl) indicated by peak located at 29.41∘ 2𝛩. Further, the modified FA (−1, −2, −4) samples showed an increase in intensity of the remaining diffraction lines, which could suggest a relative increase in the content of the remaining crystal phases as a consequence of the modification process, i.e. dissolution of calcite phases. The sample treated for only 1 day leached mostly Ca-phases, while additional 2 and 4 days of treatment yielded very small difference.

a) XRD diffractogram and b) FTIR spectra of fly ash (FA) before and after modification.
FTIR spectra given in Figure 1b) were recorded to identify the chemical composition of FA samples. In the FTIR spectra, the only visible peaks were in the range from 1600 to 650 cm−1, where the initial FA sample showed three additional
characteristic peaks of absorption bands at 1445, 715 cm−1, which correspond to asymmetric and symmetric vibrations of the carbonate group (CO3) and at 880 cm−1 of carbonate ions. The same peaks are not observed for the modified FA samples. All other peaks in the FTIR spectra were mutual and characterized bond vibrations belonging to the chemical composition of quartz, calcium silicate, mullite. The strong broad pick from 1170 to 960 cm−1 correspond to the stretching vibration of internal SiO4 tetrahedra, especially to the Si–O–Si chain structure [19]. Absorbance at 780 cm−1 is related to the symmetric stretching of Si-O-Al linkages and suggests the higher fraction of Si-O-Al linkages formed in the mullite structure [20, 21].
The SEM micrographs of the studied fly ash samples are shown in Figure 2 where the morphology of modified and initial FA is compared. The initial (unmodified) FA sample Figure 2a) exhibited a different morphology than the modified fly ash samples shown in Figure 2b) – 2d). For the FA sample, rough surface is visible on the observed globules which according to the XRD and FTIR analysis, suggests that calcite covers the surface of globules. On the other hand, all modified fly ash samples have almost smooth globular or ellipsoid smooth particles surface morphology with the particle size distribution range from 5 to 20 μm.
SEM micrographs of fly ash a) before modification (FA) and after modification b) FA-1, c) FA-2 d) FA-4.
Modification of fly ash with HCl acid altered the chemical composition and also the structure of fly ash. The change of particles size was indicated through higher specific surface area (BET) and total volume pore that
were analyzed using the nitrogen isothermal adsorption-desorption method, Table 2. The pore volume and the surface area of modified fly ash samples were greater than of initial FA. The greatest increase was observed for the FA-1 sample subjected to the hydrochloric acid modification for one day where the surface area is 3 times higher and the pore volume 2.5 times than of the initial FA. With prolonged acid exposure time surface area and pore volume decreased again. Such changes could be explained by slow reaction of HCl with Al2O3 or Fe2O3 which affects the particle surface.
Specific surface area (BET) and total volume pore of fly ash samples
| Samples | BET, m2/g | Total volume pore, cm3/g |
|---|---|---|
| FA | 3.9310 | 6.312 × 10⁻³ |
| FA-1 | 12.8021 | 16.120 × 10⁻³ |
| FA-2 | 4.7412 | 14.819 × 10⁻³ |
| FA-4 | 3.7481 | 10.102 × 10⁻³ |
Since the surface area is one of the most important parameters for efficient (photo)catalyst [22, 23, 24] the sample FA-1 was used further in preparation of FA/TiO2 nanocomposite photocatalysts. In this case large surface area would also provide possibility of higher loading of immobilized TiO2 particles as there would be more space to anchor TiO2 particles to fly ash.
3.2 Characterization of FA/TiO2 photocatalyst
Figure 3a) presents the results of XRD characterization of pure TiO2 (TiB) and FA1/TiB nanocomposite photocatalysts, with 16 wt.% and 20 wt.% fractions of fly ash. Diffractograms of TiO2 derived from Ti-butoxide show anatase (ICDD PDF#21-1272) as the only crystalline phase and the broad peaks suggest formation of nanoparticles. The FA1/TiO2 nanocomposites show also anatase as the dominant phase while the lines of the fly ash indicate quartz (ICDD PDF#46-1045) (seen 2𝛩 at 20.86∘ (100), 26.64∘ (101), as well as mullite (ICDD PDF#79-1450) (seen 2𝛩 at 25.97∘ (120), 26.27∘ (210). From the structural composition and nanostructural morphology, these materials appear to be suitable for the photocatalytic use [25].

a) XRD diffractogram, b) UV-Vis reflectance spectra.
Figure 4a) presents FTIR spectra of the FA1/TiB nanocomposite photocatalysts while 4b) presents pure TiO2 and modified fly ash (FA-1). The characteristic vibration bands of TiO2 at 3300 and 1630 cm−1 are due to the stretching and bending vibration of the OH group and water, while the peak at 524 cm−1 that corresponds to the stretching vibration of Ti-O-Ti [26] was not seen. For the FA-1 sample, there are a characteristic vibration corresponding to the internal SiO4 tetrahedra, especially to Si–O–Si chain structure at 1090 cm−1, 800 and 780 cm−1. In the composite samples, the absorbance of both TiO2 and FA-1 are well seen and especially those assigned to TiO2 as it is placed on the FA surface.

FTIR spectra of a) FA/TiO2 samples and b) fly ash and TiO2.
UV-Vis spectroscopy has been used to establish the influence of various compositions of FA1/TiB nanocomposite photocatalysts on photosensitivity by recording their reflectance spectra, Figure 3b). Initial (FA) and modified fly ash (FA1) samples show small deviation in reflectance regarding the variation in their chemical composition. As it is seen in the interval from 200 to 400 nm for both samples (FA, FA-1) reflections is low from 15 to 20% indicating good photosensitivity in the UV region. The slightly higher reflectance in the Vis light region increased up to 37% and 44%, respectively indicating lower photosensitivity. On the other hand, the UV-Vis spectra of nanocomposite photocatalysts are very similar to those of pure TiO2 (TiB) in the UV region. Thus, TiO2 and FA1/TiO2 nanocomposite photocatalysts showed very low reflectance in the range 220–390 nm (10 – 20%) with minor variations and the FA1/16-TiB sample show slightly broader band. For the same samples in the Vis range (400–800 nm) the reflectance differ and can be seen for the pure TiB is up to 80% meaning very low photosensitivity then follow the composite samples: FA1/20-TiB, FA1/20-TiB-1 and FA1/16-TiB with reflectance of: 70%, 58%, 55%, respectively. It can be concluded that the photocatalysts prepared with fly ash have higher photoactivity in the Vis region but also in UV region due to slightly broader bands. As it is well known photoactivity is result of absorbance of UV/VIS light that activates photocatalyst like TiO2 where the energy of UV light is higher than its band gap that photogenerate electrons - holes pair. Such electron transition (π - π*) from the valence to the conduction band results in its good photocatalytic activity of TiO2 catalyst [27, 28, 29, 30].
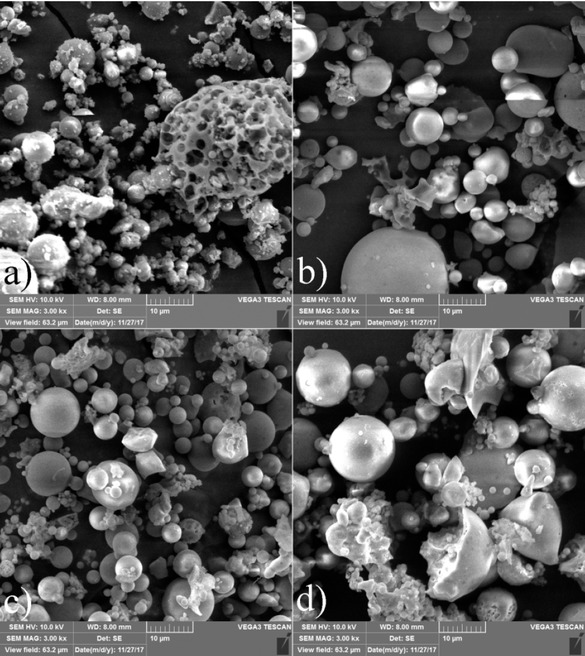
SEM micrographs in Figure 5a) present pure TiO2 and b) - c) FA1/TiB nanocomposite photocatalysts with varying concentrations of modified fly ash (16 and 20 wt.%), and micrograph d) presents the composite with additional 1 wt.% TiO2 (P25) nanoparticles. All composite samples show different morphology when compared to pure TiO2 (sample TiB). TiO2 exhibits very fine, flaky, morphology of nanoparticles while for FA/TiB samples show TiO2 covering larger fly ash particles. Because of higher concentration of TiO2 in samples FA1/20-TiB and FA1/20-TiB-1 fly ash particles of those samples show higher coverage with TiO2 as can be seen in Figures 5c) and 5d).

a) SEM micrographs; a) pure TiO2, b) FA1/16-TiB, c) FA1/20-TiB d) FA1/20-TiB-1 of nanocomposite photocatalysts.
3.3 Photocatalysis
The photocatalytic activity of the FA1/TiB nanocomposite photocatalysts was validated by performing removal of
RR45 azo dye from aqueous suspension. The experiments were performed under UV-A irradiation with catalysts concentration of 1 mg/L and RR45 dye of 30 mg/L. The efficiency of photocatalysis is influenced by several operating parameters: catalyst and contaminant concentration, pH value, treatment time and temperature. In the literature, value of pH 3 is reported as optimal for TiO2 efficiency, because its surface should be positively charged in acidic media and negatively in basic media [31, 32]. RR45 is organic azo dye that contains negatively charged sulfonate groups in its structure, so acidic solution is going to favors the strong adsorption of dye onto the TiO2 surface [33]. From the environmental and economic perspectives neutral pH is more desirable and therefore in this study the pH value was not adjusted and it was 6.8.
Initially, the experiments were started with adsorption process as it is necessary first to establish adsorption/desorption equilibrium for 30 minutes and it can be seen that adsorption of the RR45 azo dye onto catalysts is very low; from 1 to 3%, Figure 6a). The adsorption of pollutant onto the photocatalyst to certain extent is desirable, although an excessive concentration of dye molecules can lead to saturation of catalyst surface and slowing down of photocatalysis making the process less efficient [34]. Experiments

a) Discoloration rate of RR45 dye during the adsorption and photocatalysis and b) apparent rate constants of dye degradation in the presence of pure TiO2 and FA1/TiB nanocomposite catalysts under UV-A irradiation (γRR45 = 30 mg/l, γcat = 1 g/l, pH = 6.8).
were further performed to determine the actual photocatalytic activity, namely the photocatalytic degradation of RR45 azo dye in wastewater and results are given in Figure 6a).
The results of photocatalysis performed with the TiO2 (TiB) and FA1/TiB nanocomposites showed high photocatalytic activity where almost all samples had removal efficiency of 95% in 90 minutes. Although all samples had similar efficiency after 90 minutes the pure TiB photocatalyst was more efficient in the first 60 minutes of process. Slightly lower efficiency was noticed for the FA1/20-TiB catalyst which removed 90% of the dye at the end of process. The explanation of the initial lower removal of RR45 dye with nanocomposite photocatalysts in comparison to pure TiO2 lies in their composition, as they contain 16 and 20% less TiO2 resulting in lower interactions between RR45 and TiO2. The kinetics of photocatalytic degradation with semiconducting oxide of organic dyes usually follows the Langmuir-Hinshelwood mechanism [35] and can be described by the apparent first order reaction ln(C0/Ct) = kapp t, where kapp is apparent rate constant, C0 and Ct are concentration of dye after darkness adsorption of 30 min and concentration of dye at time t. Figure 6b shows the relationship between the illumination time and degradation rate of RR45 dye under UV-A light and the obtained linear correlation of the plot of ln(C0/Ct) versus time suggest a pseudo first-order reaction. The photocatalytic activity of synthesized nanocomposite can be validated by comparing the apparent rate constants (kapp), presented in Table 3. The results from Table 3 indicate that the photocatalytic activities of FA1/TiB nanocomposites (16%, 20%1) are slightly higher than those of pure TiO2. Our study shows that nanocomposites photocatalyst containing the fly ash are more effective on the discoloration of RR45 under UV-A irradiation due to higher photoactivity observed at UV-Vis spectra, Figure 3b).Hence, the FA1/TiB nanocomposites can be excited to produce more electron hole pairs, which result in efficient photocatalytic activity. It means that when FA1/TiB nanocomposites are UV-A irradiated, both TiO2 and fly ash absorb the photons at their interface, and the charge separation occurs at the interface. It is assumed that the synergetic effect between TiO2 and flay ash on the photodegradation of RR45 dye is achieved.
3.4 Consecutive cycles of photocatalysis
To evaluate possible reuse and stability of the FA1/TiB nanocomposite photocatalysts the photocatalytic efficiency during five consecutive cycles was examined. Photocatalysis was carried out under the same conditions and the catalysts after each cycle were not additionally treated or recovered. The percentage of RR45 degradation after each cycle after 90 minutes of photocatalysis is presented in Figure 7. The results showed that the pure synthesized TiO2 (TiB) sample has the equal photocatalytic active during all five repeated cycles; about 99% for each cycle. The same efficiency was noticed for the FA1/20-TiB-1 nanocomposite photocatalyst indicating higher catalytic efficiency regarding the other two nanocomposite catalysts. Generally all sample show high photocatalytic stability during wastewater treatment which enables them to be used in multiple cycles without need for thermal or chemical regeneration.
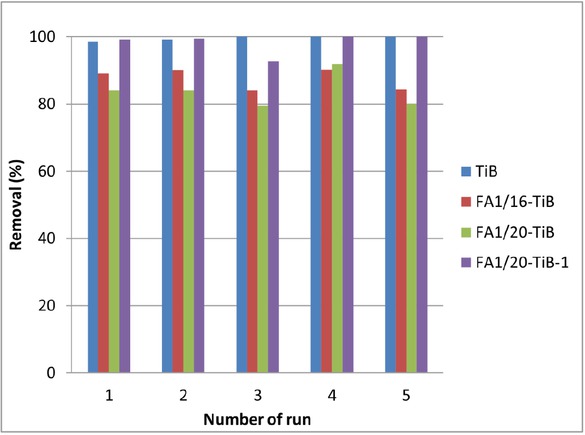
Degradation of RR45 dye in model solution after 90 minutes of photocatalysis up to five cycles for TiO2 and FA1/TiO2 photocatalysts.
4 Conclusions
X-ray diffraction analysis and FTIR spectroscopy confirmed changes in chemical composition of fly ash after modification. Additional conformation of successful modification of waste fly ash wasseen from the results obtained from the nitrogen adsorption-desorption analysis, since the significant increase of surface specific area and total pore volume was achieved. These results allowed the selection of the most successfully modified fly ash sample FA1
Apparent rate constant (kapp) of RR45 dye degradation and linear regression coefficient from plot ln(C0/Ct) = kapp t
| TiB | FA1/16-TiB | FA1/20-TiB | FA1/20-TiB-1 | |
|---|---|---|---|---|
| kapp, min−1 | 0.0304 | 0.0325 | 0.0255 | 0.0342 |
| R2 | 0.9784 | 0.9718 | 0.9816 | 0.9503 |
to use for the in situ preparation of FA1/TiO2 nanocomposite photocatalysts by sol-gel synthesis of TiO2. The validation of photocatalytic activity of such prepared nanocomposite photocatalysts has been made by determination of photodegradation efficiency of Reactive Red (RR45) azo dye during wastewater treatment. It was concluded that all studied FA1/TiB nanocomposite photocatalysts exhibit very good photosensitivity, since a discoloration of 96% of RR 45 was achieved by FA1/16-TiB and FA1/20-TiB-1 samples. These results are supported by the study of photocatalytic degradation kinetics and it can be seen that apparent rate constant (kapp) under UV-A light indicated higher photocatalytic activities of FA1/TiB nanocomposites (16%, 20%-1) than those of pure TiO2. The nanocomposites photocatalyst containing the fly ash are more effective on the discoloration of RR45 under UV-A irradiation due to higher photoactivity as was confirmed by UV-Vis spectroscopy. Further, the obtained results after five consecutive cycles indicated high stability of the studied nanocomposite photocatalysts and their good photocatalytic activity. After all, it can be concluded that successfully modified waste fly ash can be used as a very good supporter of TiO2 photocatalysts and thus significantly simplify the process of removing nanoparticles after the wastewater treatment. From this study it is apparent that the modification of the waste fly ash can be successful, and this implies a successful solution of the significant problem of its recycling.
Acknowledgement
This work was fully supported by the Croatian Science Foundation (HRZZ) under the project De-PoNPhoto IP-11-2013-5092.
References
[1] Hammami S, Bellakhal N, Oturan N, Oturan MA, Dachraoui M, Chemosphere 2008, 73, 678–684.10.1016/j.chemosphere.2008.07.010Search in Google Scholar
[2] Melgoza D, Hernandez-Ramirez A, Peralta-Hernandez JM, Photochem. Photobiol. Sci 2009, 8, 596–599.10.1039/b817287kSearch in Google Scholar
[3] Gu Y, Zhang YZ, Zhang FY, Wei JP, Wang CM, Du YL, Ye WC, Electrochim. Acta 2010, 56, 953-958.10.1016/j.electacta.2010.09.051Search in Google Scholar
[4] Dong W, Lee CW, Lu X, Sun Y, Hua W, Zhuang G, Zhang S, Chen J, Hou H, Zhao D, Appl. Catal. B 2010, 95, 197-207.10.1016/j.apcatb.2009.12.025Search in Google Scholar
[5] Wang Y, Bai X, Pan C, He J, Zhu Y, J. Mater. Chem 2012, 22, 11568-11573.10.1039/c2jm16873aSearch in Google Scholar
[6] Ohtani B, J. Photochem. Photobiol. C Photochem. Rev 2010, 11, 157-178.10.1016/j.jphotochemrev.2011.02.001Search in Google Scholar
[7] Szeifert JM, Feckl JM, Fattakhova-Rohlfing D, Liu Y, Kalousek V, Rathousky J, Bein T, J. Am. Chem. Soc 2010, 132, 12605-12611.10.1021/ja101810eSearch in Google Scholar
[8] Park K, Zhang QF, Garcia BB, Zhou XY, Jeong YH, Cao GZ, Adv. Mater 2010, 22, 2329-2332.10.1002/adma.200903219Search in Google Scholar
[9] Alemany LJ, Banares MA, Pardo E, Martin F, Galan-Fereres M, Blasco JM, Appl. Catal. B 1997, 13, 289–297.10.1016/S0926-3373(97)00006-4Search in Google Scholar
[10] Eddy DR, Puri FN, Noviyanti AR, Procedia Chemistry 2015, 17, 55-58.10.1016/j.proche.2015.12.132Search in Google Scholar
[11] Zhang T, Luo Y, Jia B, Li Y, Yuan L, Yu J, J. Environ. Sci 2015, 32, 108-117.10.1016/j.jes.2015.01.010Search in Google Scholar
[12] Fukahori S, Ichiura H, Kitaoka T, Tanaka H, Environ. Sci. Technol 2003, 37, 1048–1051.10.1021/es0260115Search in Google Scholar
[13] Hiromi Y, Masakazu A, Curr. Opin. Solid State Mater Sci. 2003, 7, 471–481.10.1016/j.cossms.2004.02.003Search in Google Scholar
[14] Alalm MG, Tawfik A, Ookawara S, J. Environ. Chem. Eng 2016, 4, 1929-1937.10.1016/j.jece.2016.03.023Search in Google Scholar
[15] Herrmann JM, Laine J, Matos J, J. Catal 2001, 200, 10–20.10.1006/jcat.2001.3191Search in Google Scholar
[16] Tsumura T, Kojitari N, Umemura H, Toyoda M, Inagaki M, Appl. Surf. Sci 2002, 196, 429–436.10.1016/S0169-4332(02)00081-8Search in Google Scholar
[17] Yang YF, Gai GS, Cai ZF, Chen QR, J. Hazard Mat 2006, 133, 276-282.10.1016/j.jhazmat.2005.10.028Search in Google Scholar
[18] Duta A, Visa M, J. Photochem. Photobiol. A 2015, 306, 21-30.10.1016/j.jphotochem.2015.03.007Search in Google Scholar
[19] Roy J, Bandyopadhyay N, Dass S, Maitra S, Iran J. Chem. Chem. Eng 2011, 30, 65-71.Search in Google Scholar
[20] Bertoluzaa A, Fagnano C, Moreli MA, Gottardi V, Guglielni MJ, J. Non-Cryst. Solids 1982, 48, 117-128.10.1016/0022-3093(82)90250-2Search in Google Scholar
[21] Sarbak Z, Kramer-Wachowiak M, Powder Technol 2002, 123, 53-58.10.1016/S0032-5910(01)00431-4Search in Google Scholar
[22] Jiang R, Shan H, Zhang Q, Li C, Yang C, Sep. Purif. Methods 2012, 95, 144-148.10.1016/j.seppur.2012.04.011Search in Google Scholar
[23] Podila S, Zaman SF, Driss H, Al-Zahrani AA, Daous MA, Petrov LA, Int. J. Hydrogen Energy 2017, 42, 8006-8020.10.1016/j.ijhydene.2017.01.044Search in Google Scholar
[24] Zhao B, Yang Z, Ran R, Guo Z, Wu X, Weng D, Catal. Commun. 2018, 104, 13-16.10.1016/j.catcom.2017.10.012Search in Google Scholar
[25] Kurajica S, Minga I,Mandić V,Matijašić G, J. Therm. Anal. Calorim 2016, 124, 645-655.10.1007/s10973-015-5188-6Search in Google Scholar
[26] Jiang D, Xu Y, Hou B, Wu D, Sun Y, Eur. J. Inorg. Chem 2008, 8, 1236-1240.10.1002/ejic.200700650Search in Google Scholar
[27] Chen X, Mao SS, Chem. Rev 2007, 107, 2891–2959.10.1021/cr0500535Search in Google Scholar
[28] Fujishima A, Zhang X, Tryk DA, Surf. Sci. Rep 2008, 63, 515–582.10.1016/j.surfrep.2008.10.001Search in Google Scholar
[29] Yang D, Liu H, Zheng Z, Yuan Y, Zhao J, Waclawik ER, Ke X, Zhu H, J. Am. Chem. Soc 2009, 131, 17885–17893.10.1021/ja906774kSearch in Google Scholar
[30] Sun Q, Lu Y, Zhang H, Zhao H, Yu H, Xu J, Fu Y, Yang D, Liu Y,Mater. Chem. Phys 2012, 133, 253– 258.10.1016/j.matchemphys.2012.01.018Search in Google Scholar
[31] Daneshvar N, Salari D, Khataee AR, J. Photochem. Photobiol. A 2004, 162, 317–322.10.1016/S1010-6030(03)00378-2Search in Google Scholar
[32] Daneshvar N, Salari D, Khataee AR, J. Photochem. Photobiol. A 2003, 157, 111–116.10.1016/S1010-6030(03)00015-7Search in Google Scholar
[33] Peternel I, Koprivanac N, Lončarić Božić A, Kušić H, J. Hazard. Mat 2007, 148, 477–484.10.1016/j.jhazmat.2007.02.072Search in Google Scholar PubMed
[34] Peternel I, Koprivanac N, Kušić H, Water. Res 2006, 40, 525–532.10.1016/j.watres.2005.11.029Search in Google Scholar PubMed
[35] Sadollahkhani A, Kazeminezhad I, Lu J, Nur O, Hultman L, Willander M, RSC Adv 2014, 4, 36940-36950.10.1039/C4RA05247ASearch in Google Scholar
© 2019 V. Gilja et al., published by De Gruyter
This work is licensed under the Creative Commons Attribution 4.0 Public License.
Articles in the same Issue
- Analysis on the impact response of fiber-reinforced composite laminates: an emphasis on the FEM simulation
- Artificial neural network for predicting the flexural bond strength of FRP bars in concrete
- Cyclic behavior of GFRP strengthened infilled RC frames with low and normal strength concrete
- Durability of basalt fiber-reinforced polymer bars in wet-dry cycles alkali-salt corrosion
- Effect of B4C particle size on the mechanical properties of B4C reinforced aluminum matrix layered composite
- Enhanced dielectric properties of BaTiO3 ceramics with cerium doping, manganese doping and Ce-Mn co-doping
- Free and forced vibration analysis of rectangular/circular/annular plates made of carbon fiber-carbon nanotube-polymer hybrid composites
- Influence of nano-SiO2 on the bonding strength and wear resistance properties of polyurethane coating
- Investigation of wear behavior of nanoalumina and marble dust-reinforced dental composites
- Negative effect of clay fillers on the polyvinyl alcohol biodegradation: technical note
- Photocatalytic activity of Cu2O/ZnO nanocomposite for the decomposition of methyl orange under visible light irradiation
- Sub-surface mechanical properties and sub-surface creep behavior of wood-plastic composites reinforced by organoclay
- Surface integrity in wire-EDM tangential turning of in situ hybrid metal matrix composite A359/B4C/Al2O3
- The influence of the WC-Co composite microstructure model on stress field heterogeneity at the microstructure level: FEM based study
- Vibration-damping characterization of the basalt/epoxy composite laminates containing graphene nanopellets
- A review on nanocomposite hydrogels and their biomedical applications
- Optimization and simulation analysis of structure parameters of OPCM ultrasonic longitudinal wave actuating element
- Research Article
- Preparation of POSS-triol/wollastonite composite particles by Liquid phase mechanochemical method and its application in UV curable coatings
- Research on preload relaxation for composite pre-tightened tooth connections
- Dough moulding compound reinforced silicone rubber insulating composites using polymerized styrene butadiene rubber as a compatibilizer
- Hydration And Microstructure Of Astm Type I Cement Paste
- Effects of NiO content on the microstructure and mechanical properties of AgSnO2NiO composites
- Overall buckling behaviour of laminated CFRP tubes with off-axis ply orientation in axial compression
- UV sensing optode for composite materials environment monitoring
- On crushing characteristics of hybrid sandwich aluminum-cardboard panels reinforced with glass fiber composite rods
- Preparation and characterization of Ni-Cu composite nanoparticles for conductive paints
- A research on the preparation of oil-adsorbing hydrophobic porous resins by high internal phase emulsions (HIPEs) template
- Material characteristics of random glass-mat-reinforced thermoplastic under cryogenic thermal cycles
- Differentiation of non-black fillers in rubber composites using linear discriminant analysis of principal components
- Research Article
- Efficiency of TiO2 catalyst supported by modified waste fly ash during photodegradation of RR45 dye
- Synthesis and performance of polyurethane/silicon oxide nano-composite coatings
- Study on preparation of magnesium-rich composite coating and performance enhancement by graft modification of epoxy resin
- Research Article
- Mechanical and wear properties of polyetheretherketone composites filled with basalt fibres
- Mechanical Properties of Al 25 wt.% Cu Functionally Graded Material
- Research Article
- Weight reduction of a carbon fibre composite wheel
- Synthesis, electrical properties, and kinetic thermal analysis of polyaniline/ polyvinyl alcohol - magnetite nanocomposites film
- Seismic Behaviour of TRC-Strengthened RC Columns under Different Constraint Conditions
- Characterization of neat and modified asphalt binders and mixtures in relation to permanent deformation
- Microstructures, interface structure and room temperature tensile properties of magnesium materials reinforced by high content submicron SiCp
- Research Article
- Effect of Cutting Temperature on Bending Properties of Carbon Fibre Reinforced Plastics
- Mechanical and tribological properties of B-C-N coatings sliding against different wood balls
- Thermal conductivity of unidirectional composites consisting of randomly dispersed glass fibers and temperature-dependent polyethylene matrix
- Effects of Waste Eggshells addition on Microstructures, Mechanical and Tribological Properties of Green Metal Matrix Composite
- Investigation of porosity effect on flexural analysis of doubly curved FGM conoids
- Review Article
- Utilization of tailings in cement and concrete: A review
- Research Article
- Equivalent stiffness prediction and global buckling analysis using refined analytical model of composite laminated box beam
- Mechanochemical synthesis of zincite doped with cadmium in various amounts
- Size-dependent vibration analysis of graphene-PMMA lamina based on non-classical continuum theory
- Automated, Quality Assured and High Volume Oriented Production of Fiber Metal Laminates (FML) for the Next Generation of Passenger Aircraft Fuselage Shells
- Research Article
- An investigation of the stitching effect on single lap shear joints in laminated composites
- The low-velocity impact and compression after impact (CAI) behavior of foam core sandwich panels with shape memory alloy hybrid face-sheets
- Effect of granulometric distribution on electromagnetic shielding effectiveness for polymeric composite based on natural graphite
- The enhancement of filament winding in marine launching rubber gasbag
- Research on ELID Grinding Mechanism and Process Parameter Optimization of Aluminum-Based Diamond Composites for Electronic Packaging