The influence of the WC-Co composite microstructure model on stress field heterogeneity at the microstructure level: FEM based study
-
Witold Ogierman
 and
Wojciech Grzegorzek
and
Wojciech Grzegorzek

Abstract
The paper is devoted to finite element method based study of stress field heterogeneity at microstructure level of two-phase cemented carbides. Special attention is put on investigation of influence of the microstructure model type on the stress field distributions. Two- and three-dimensional models of the microstructures have been generated. Moreover, two different representations of the microstructure have been considered. The first one assumes uniformly distributed cobalt phase forming continuous boundaries between tungsten carbide particles. The second one assumes that the cobalt phase shape and distribution are created in a way that allows for no differentiation of continuous boundaries between tungsten carbide grains. Finite element analyses have been carried out with different microstructure models. The results of the simulations are stress distributions in each phase of the material. Furthermore, a numerical homogenization has been conducted to investigate the phase properties’ influence on the effective elastic constants of the cemented carbide.
1 Introduction
At present, the finite element method is the most popular numerical method for evaluating the microfields of discrete micromechanical models [1], [2], [3], [4], [5]. It allows to consider a wide range of microstructural complexities, such as irregular shape and inhomogeneous spatial distribution of the phases, interactions between the phases, etc. On the other hand, very often simplifications of the numerical models are made to make the analysis feasible and computationally efficient. Typically, the finite element analysis is carried out on the basis of a representative volume element (RVE) that is a statistical representation of material properties. RVEs should contain enough information at the microstructure level, including all significant microstructural features. Volume elements could be obtained, for example, from microscopic observations or tomography data [6], [7], [8]. This approach guarantees that the obtained microgeometries are as close as possible to the part of a given sample. The other way is to generate artificial microgeometries by using computer simulations [9], [10], [11]. In this case, phases arrangements are not identical to the given material sample but rather are statistically equivalent to the target material [1].
Tungsten carbide (WC)/cobalt (Co) composites, commonly known as cemented carbides, are widely used in industry due to their unique properties. There are many publications devoted to finite element analysis of the cemented carbides, many of them focusing on advanced material modelling including, for example, damage phenomenon. On the other hand, they concentrate on mostly simplified microgeometries, and the analyses are carried out in two-dimensional (2D) space. Different ways of microgeometries descriptions are presented in literature.
One of the most popular approaches assumes uniformly distributed cobalt phase forming continuous boundaries between tungsten carbide particles. This approach has been presented by Mishnaevsky et al. [12], who performed 2D finite element analysis of damage initiation and growth within the cobalt phase. Similar issue has been raised in the work of Dȩbski and Sadowski who also have applied 2D microstructure model [13]. Recently, they extended their model to the third dimension by extruding previously obtained 2D microgeometry [14] (this approach is sometimes referred to as 2.5D modelling [15]). Finally, they noticed significant differences between the results obtained by using 2D and 3D models. McHugh and Connolly [16] studied ductile crack growth in the cobalt phase. In this case, simplified 2D geometry representing the material phases have been accounted for. Livescu et al. [17] generated 3D microgeometry of cemented carbide including continuous boundaries between tungsten carbide. However, the introduced phases geometries are highly simplified.
Another approach of the cemented carbide microgeometry representation assumes that the cobalt phase shape and distribution are created in a way that allows for no differentiation of continuous boundaries between tungsten carbide grains and the introduction of the so-called cobalt islands. This approach is widely used by basing on the images obtained from the microscopy observations. The 2D microgeometries created in such a way can be found, for example, in the work of Chawla and Chawla [18], who have determined elastic properties and thermal stresses of cemented carbide. Sadowski and Nowicki [19] investigated the elastic-plastic response of the material by using 2D microstructure model. Özden et al. [20] also performed numerical analysis on the basis of 2D microgeometry including cobalt islands and simulated fatigue crack propagation. Recently, Kayser et al. [15] created artificial 3D microgeometries by using Digimat-FE software [21] in order to simulate residual stresses. The geometrical shape of the tungsten carbides was taken as truncated prisms. A 3D microstructure with a small extension in thickness direction was generated and therefore the authors described their model as 2.5D.
Thus, while various kinds of microstructure models of WC/Co composites are presented in literature, it is 2D models that are used the most frequently. On the other hand, some results reported in literature throw into question the suitability of using 2D models in some cases [22], [23], [24]. Therefore, the aim of this paper is to investigate the differences between the stress distributions in the material phases obtained by considering different modelling approaches. Furthermore, investigation of the phases properties’ influence on effective elastic constants of cemented carbide has been conducted by performing numerical homogenization and considering different microgeometry models. During this study two-phase cemented carbides with two different cobalt contents have been accounted for.
2 Microstructure modelling
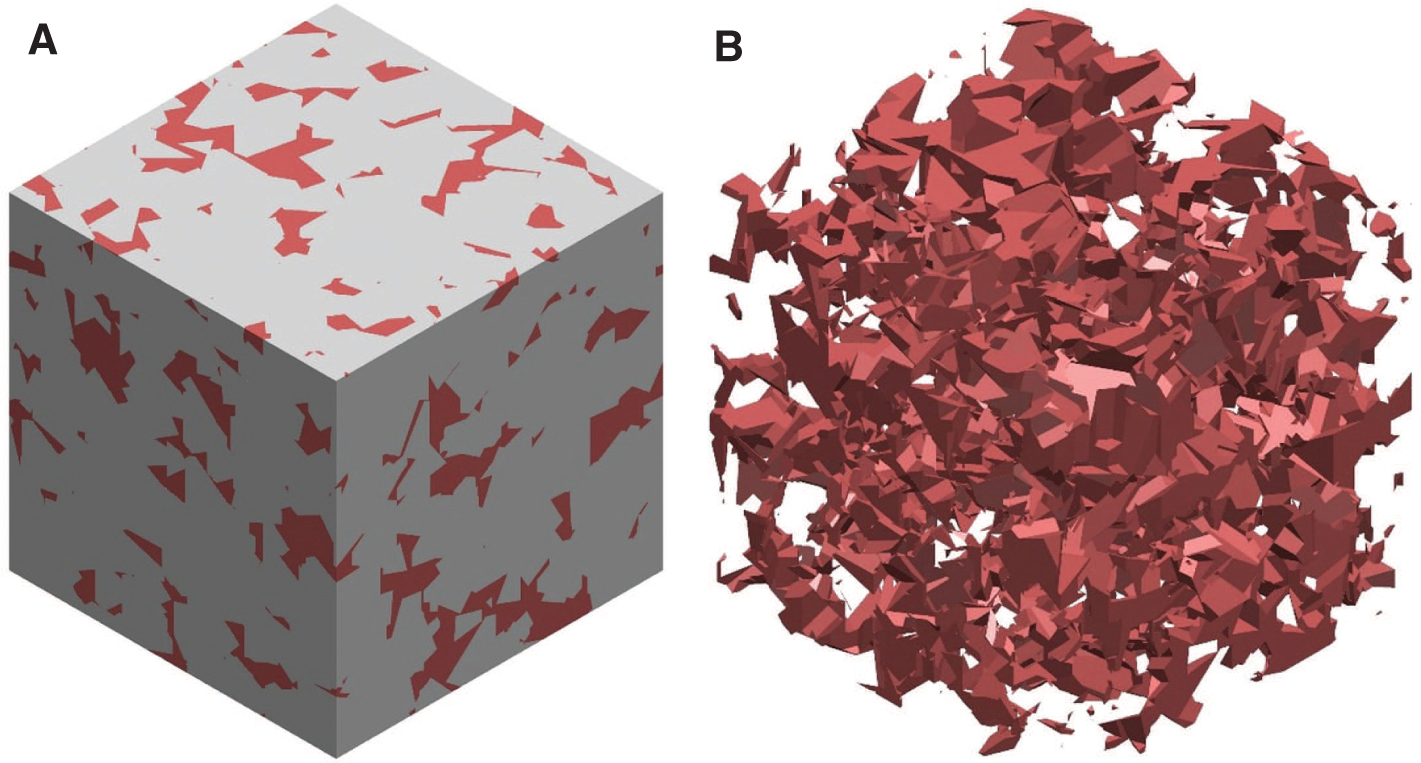
Cemented carbides with 6% and 9% mass contents of cobalt phase were considered; micrographs of these materials are presented in Figure 1. Two-dimensional microgeometries equivalent to the considered cemented carbides are presented in Figures 2 and 3. Figure 2 shows the microgeometries created directly from micrographs presented in Figure 1 by performing image binarization. The image binarization uses a contrast of colors from the micrograph in order to separate it into a domain of each material phase [25]. In order to obtain a proper image segmentation, the threshold at which the ratio of black to white pixels equals the target volume fraction of the cobalt phase was selected. Figure 3 presents microgeometries also generated on the basis of image binarization, however before the image processing continuous boundaries between tungsten carbide particles have been introduced artificialy. In this case, the volume fraction of cobalt phase depends on the thickness of the grain boundaries. Afterwards, 3D microgeometries were created with commercial software Digimat-FE [21]. The shape of the carbides was accounted for in a similar way as Kayser et al. [15] who considered an average shape of the carbides (truncated prisms) proposed by Lay et al. [26]. In this case the 3D microgeometry generation procedure is based on sequential placement of the carbides of the same shape in the RVE by considering their random position and orientation; moreover, carbide size reduction of 25% from the initial value has been allowed. At first the microgeometry with cobalt islands was generated (similarly to 2D microgeometry presented in Figure 2). Microgeometries obtained in such a way for the materials with different cobalt content are presented in Figures 4 and 5. Then, consequently, 3D microgeometries including continuous boundaries between tungsten carbide particles were created (similarly to 2D microgeometry presented in Figure 3). In order to achieve the continuous boundaries between tungsten carbide particles, the particles with previously attached cobalt coatings was used in the procedure of the RVE generation conducted by applying Digimat-FE software. Microgeometries obtained in such a way as to represent the materials with different cobalt content are presented in Figures 6 and 7.
In order to perform finite element computations, the creation of finite element mesh discretizing microgeometries is essential. In the case of 2D model, pixel-based mesh was generated by converting pixels from microgeometry to quadrilateral finite elements. Each 2D RVE has been divided to 250,000 finite elements in a way presented in Figures 8 and 9. In the case of 3D model, voxel-based mesh was generated by converting voxels from microgeometry to hexahedral finite elements. Each 3D RVE has been divided to 1,000,000 finite elements in a way presented in Figures 10 and 11.
Simulations have been conducted by considering linear-elastic behavior of the material. In the case of 2D models, plane strain assumption has been taken into consideration. The considered elastic constants of the tungsten carbide phase are as follows: Young modulus equals 714 GPa and Poisson ratio equals 0.19 [16]. The considered elastic constants of the cobalt phase are as follows: Young modulus equals 211 GPa and Poisson ratio equals 0.31 [16]. Simulations were performed with the assumption of perfect bonding between the phases.
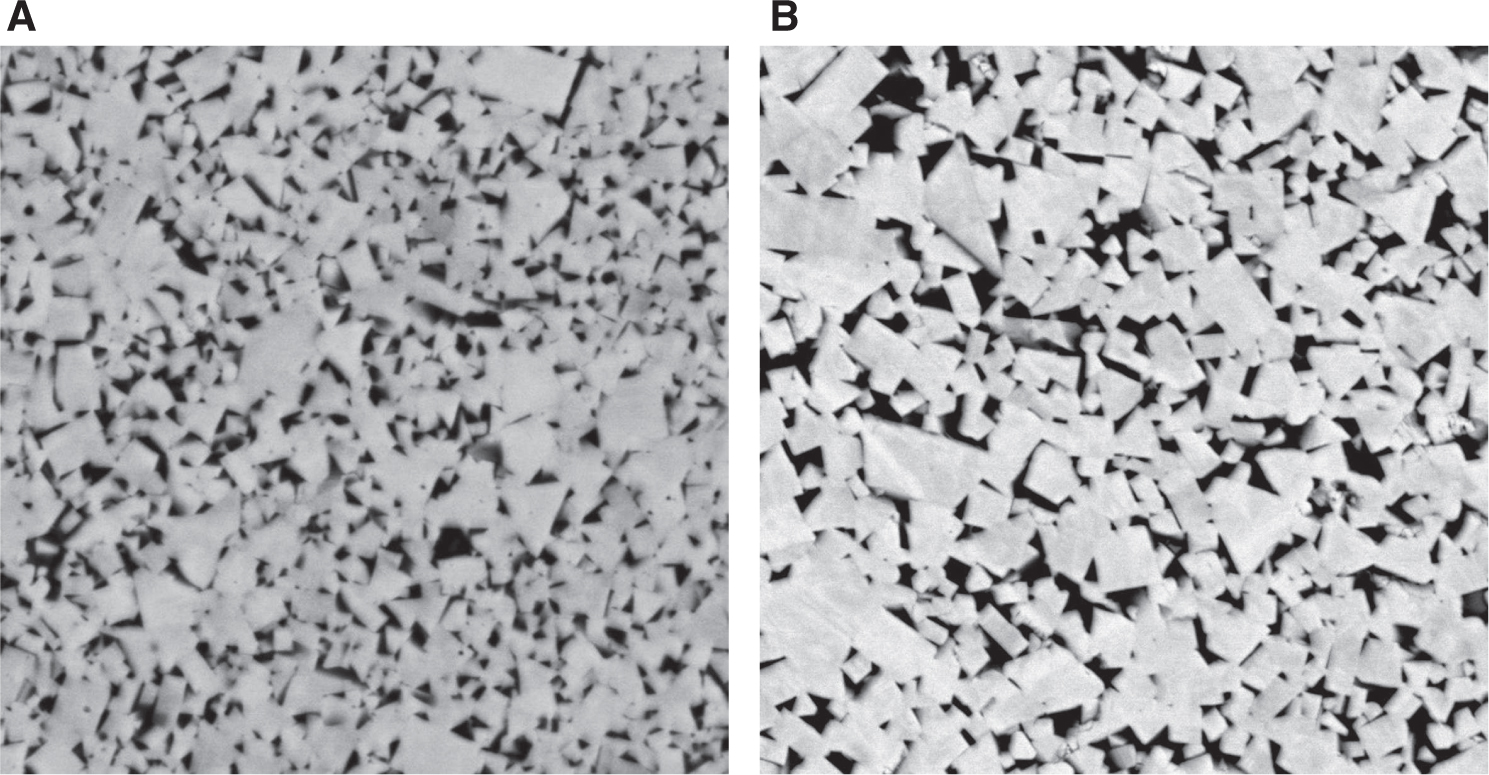
Micrographs of cemented carbide containing (A) 6% of cobalt and (B) 9% of cobalt.
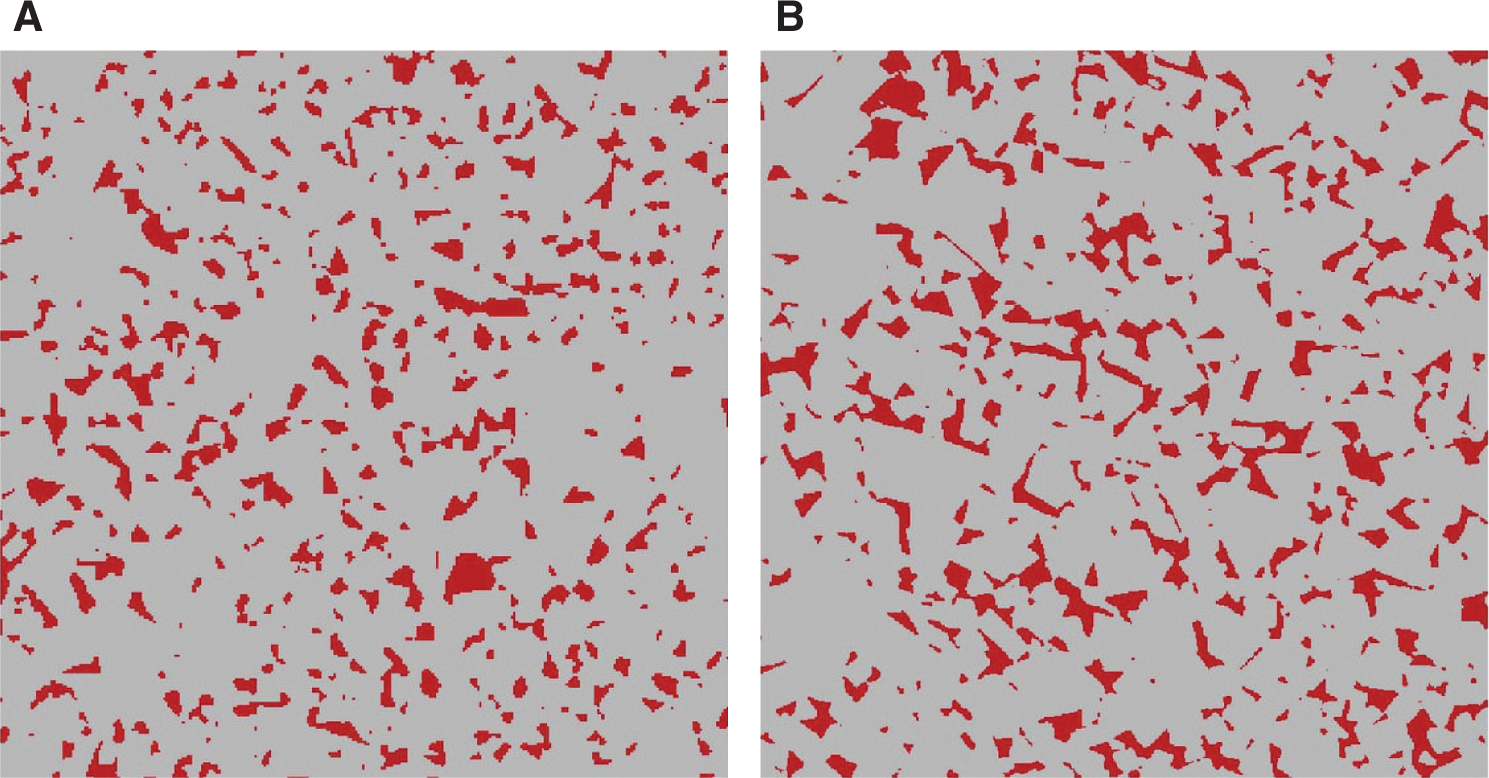
Two-dimensional microgeometries created based directly on micrographs of cemented carbide containing (A) 6% of cobalt and (B) 9% of cobalt.
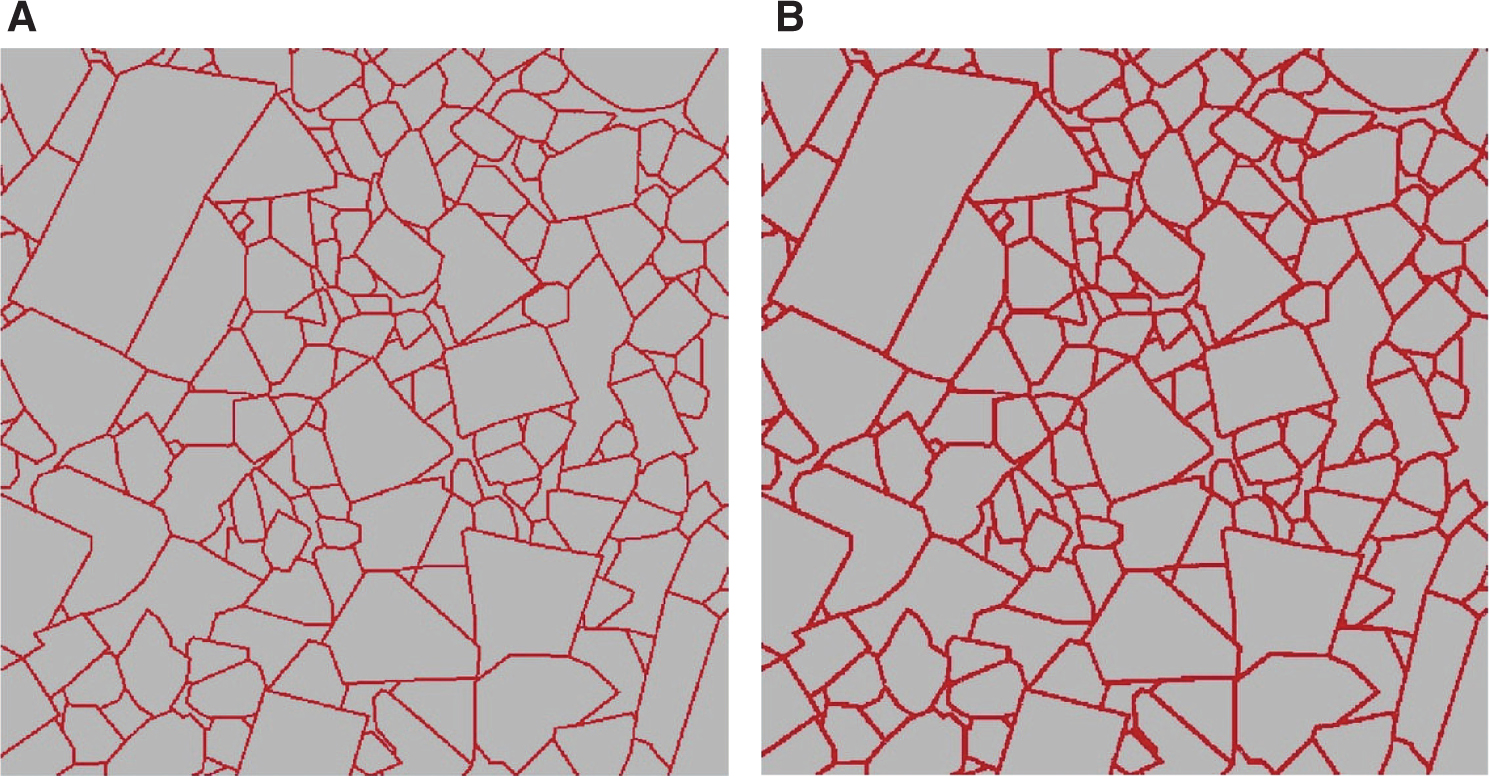
Two-dimensional microgeometries created by introducing continuous boundaries between tungsten carbide particles containing (A) 6% of cobalt and (B) 9% of cobalt.
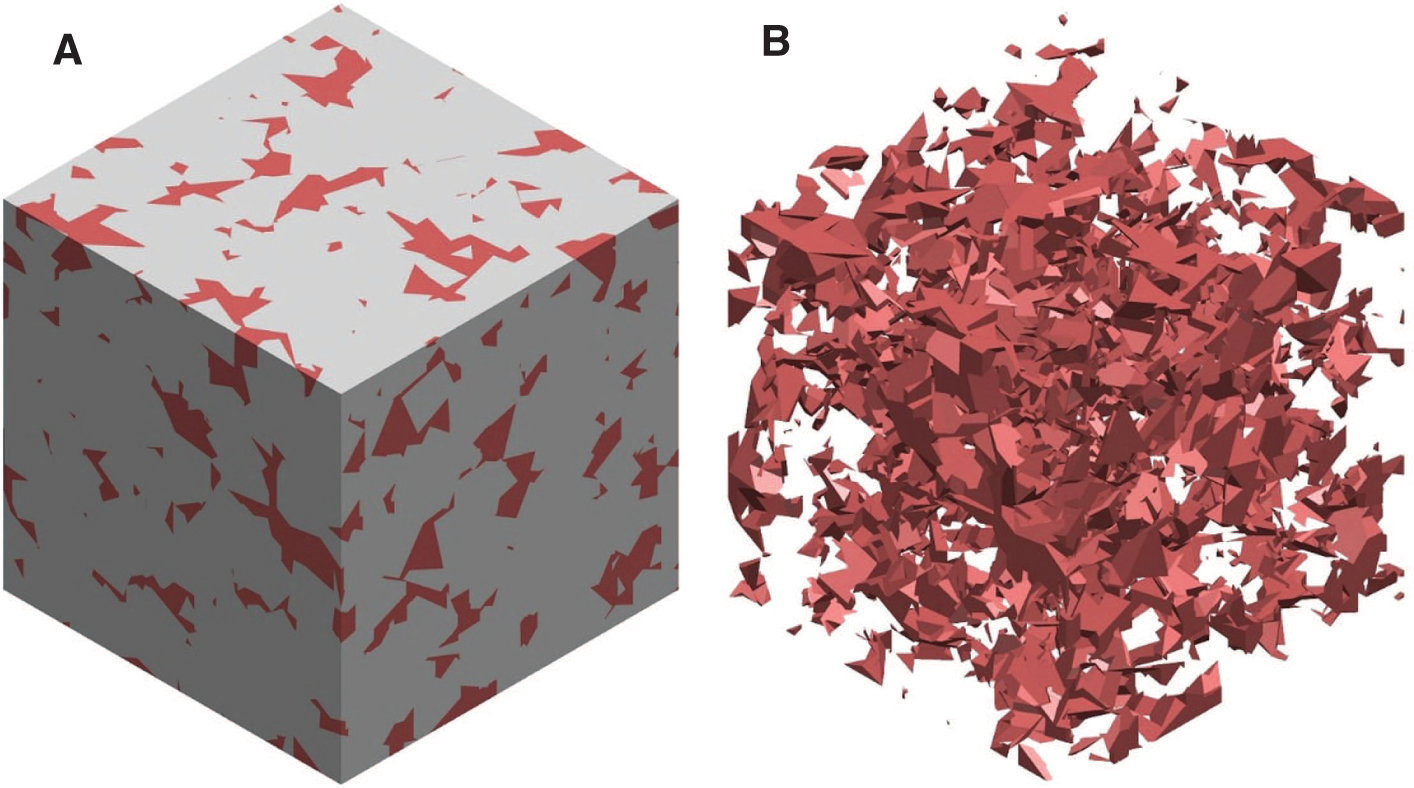
Three-dimensional microgeometry containing 6% Co and cobalt islands: (A) isometric view and (B) detailed view on the cobalt phase.
Three-dimensional microgeometry containing 9% Co and cobalt islands: (A) isometric view and (B) detailed view on the cobalt phase.
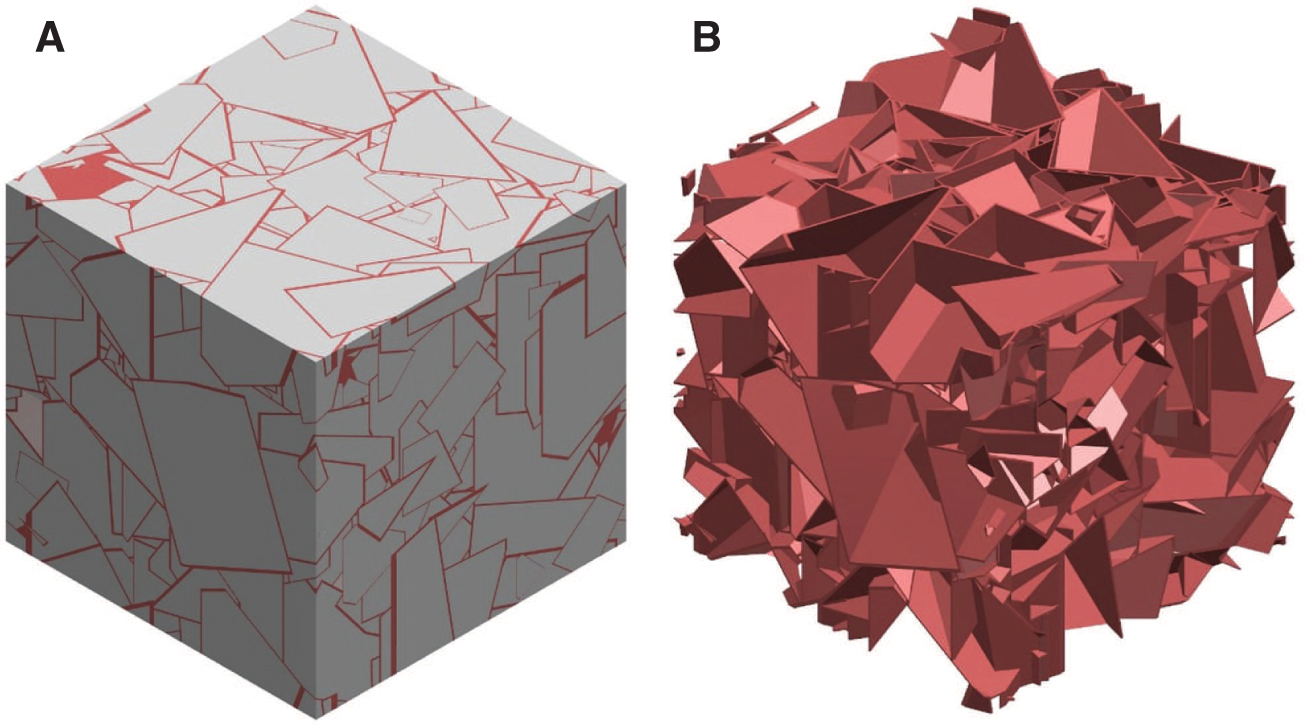
Three-dimensional microgeometry containing 6% Co and continuous boundaries between tungsten carbide particles: (A) isometric view and (B) detailed view on the cobalt phase.
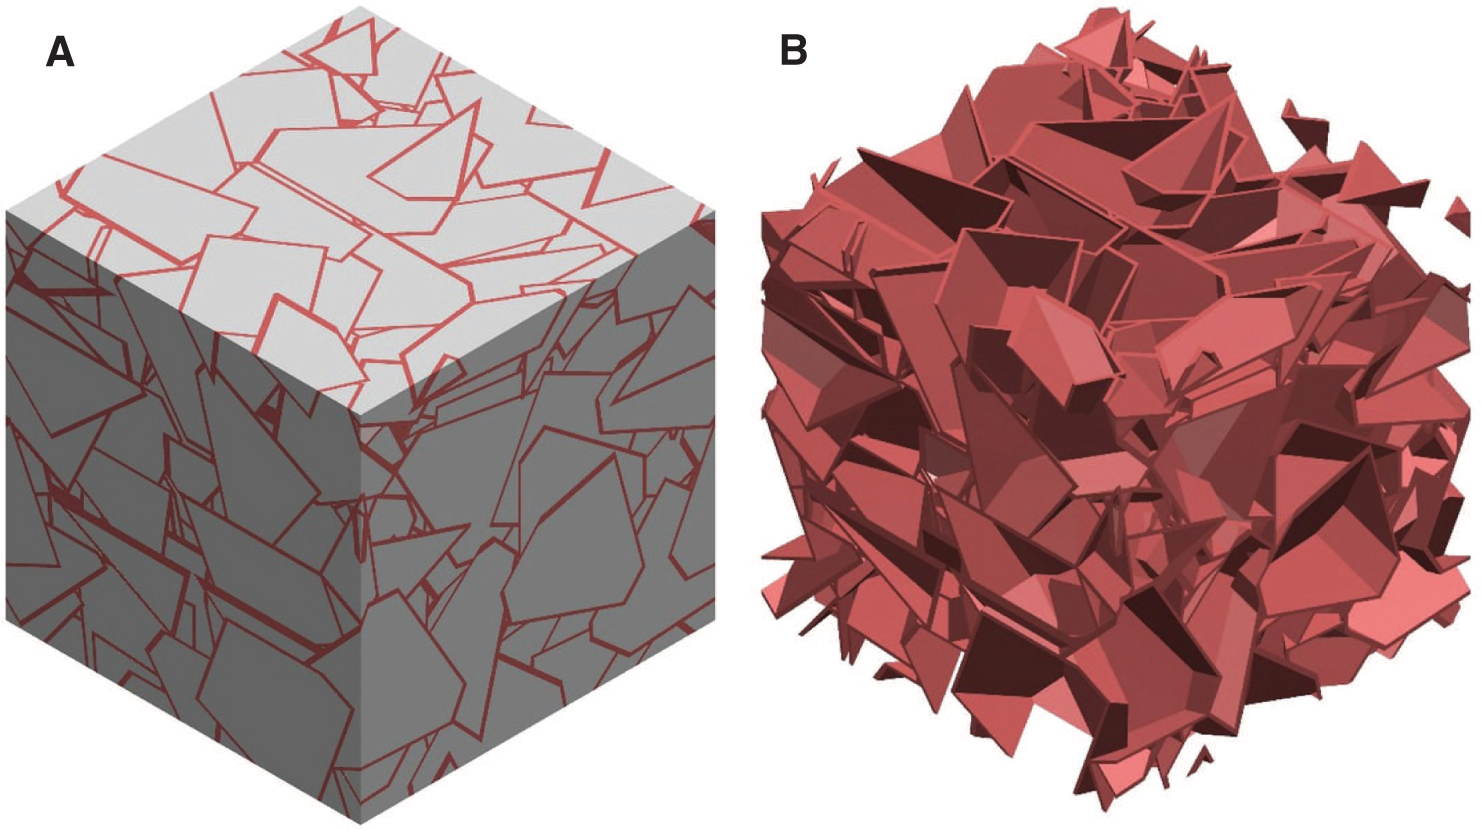
Three-dimensional microgeometry containing 9% Co and continuous boundaries between tungsten carbide particles: (A) isometric view and (B) detailed view on the cobalt phase.
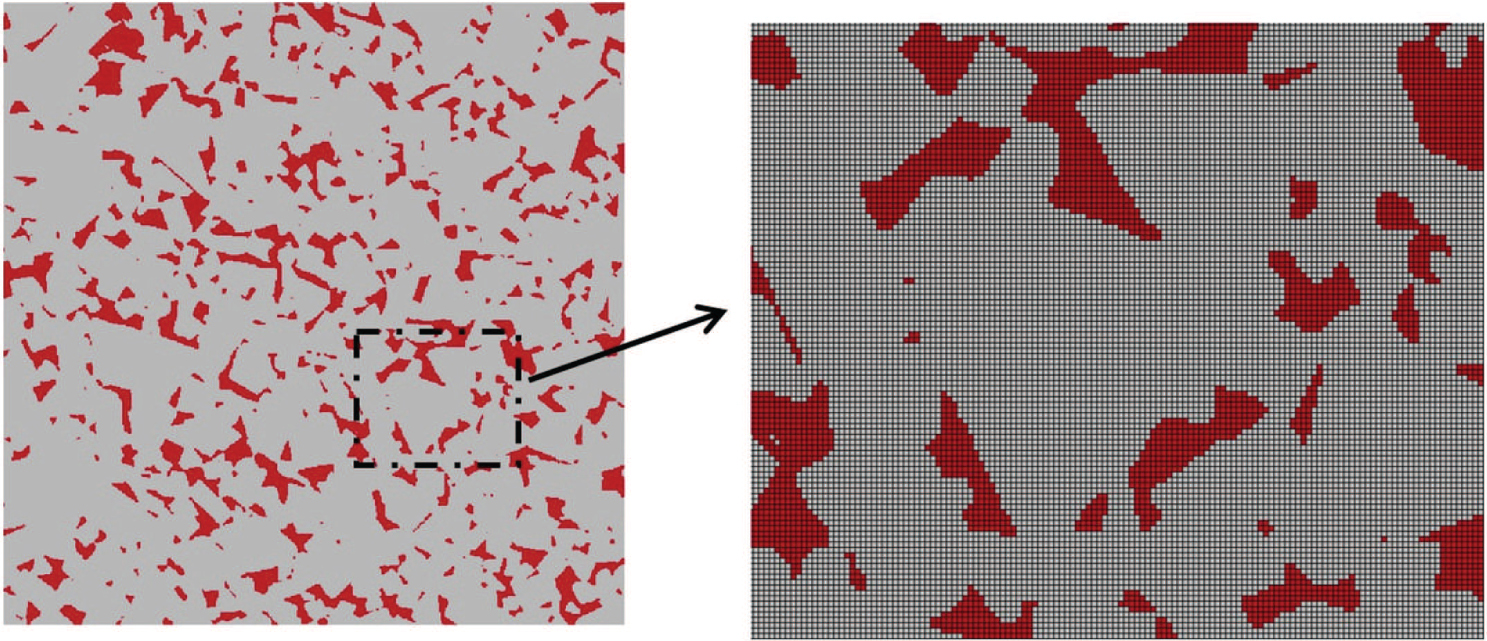
Finite element discretization of two-dimensional microgeometry including cobalt islands.
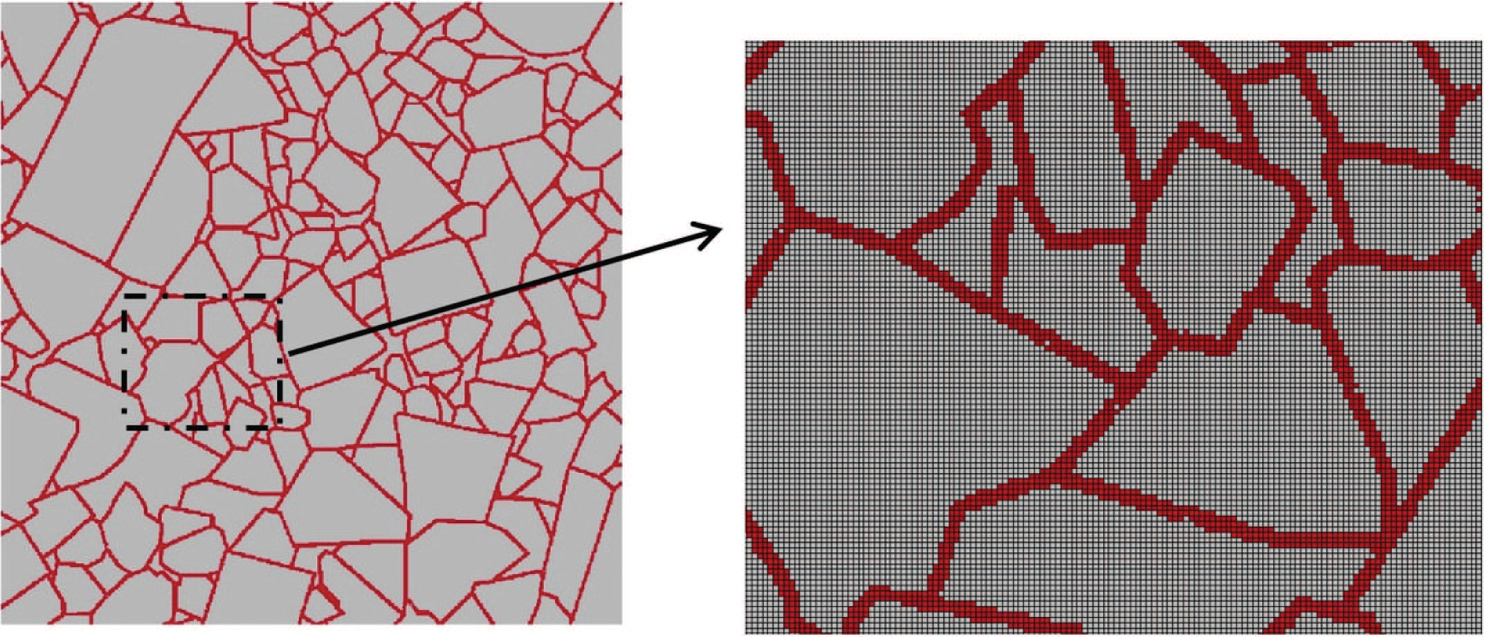
Finite element discretization of two-dimensional microgeometry including continuous boundaries between tungsten carbide particles.
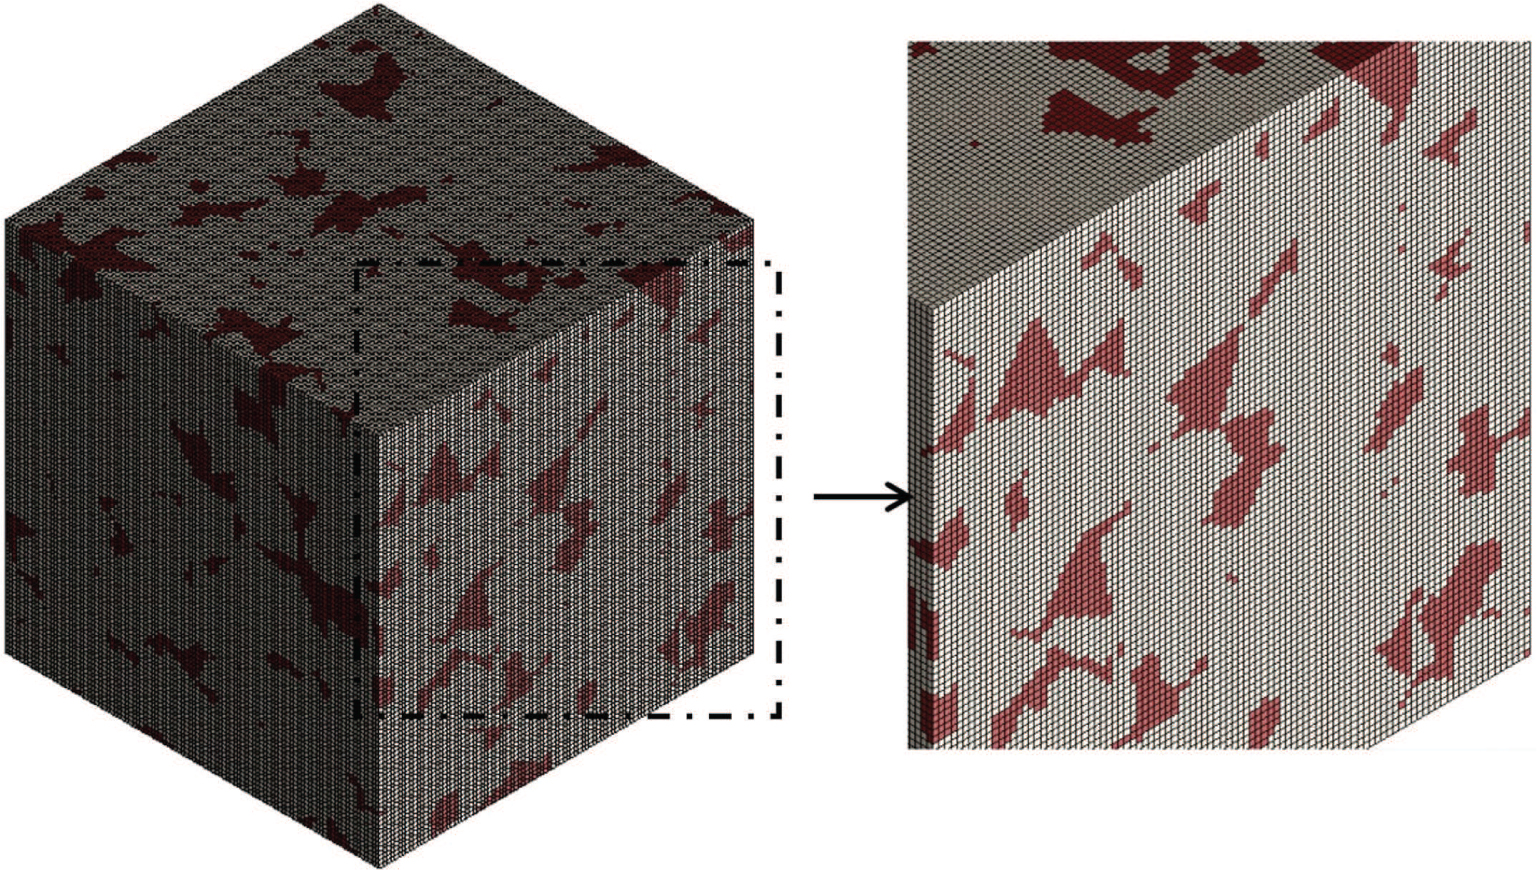
Finite element discretization of three-dimensional microgeometry including cobalt islands.
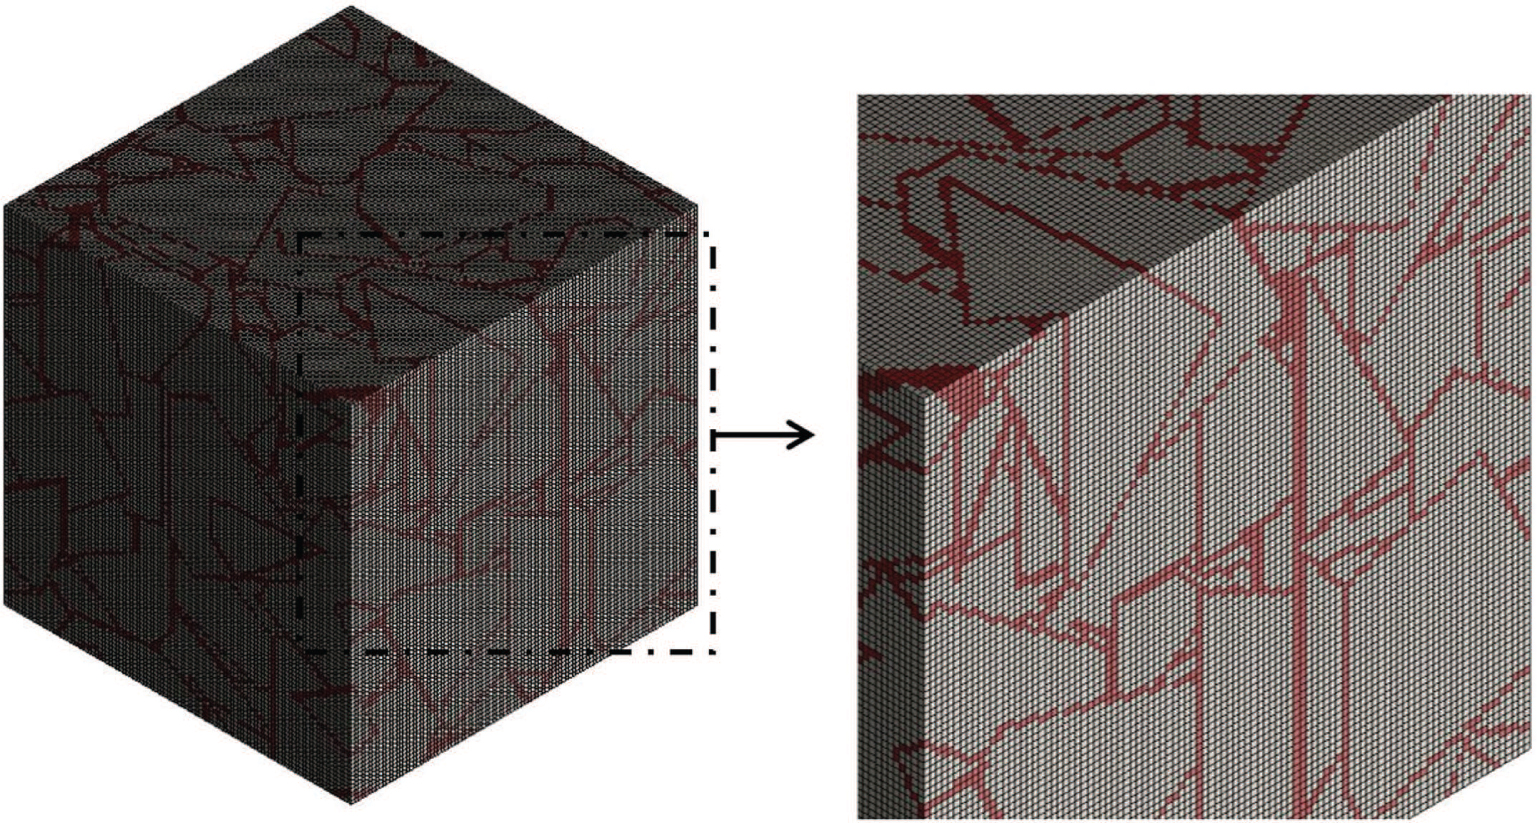
Finite element discretization of three-dimensional microgeometry including continuous boundaries between tungsten carbide particles.
3 Determination of effective elastic properties
To calculate the effective stiffness tensors of heterogeneous materials, the usage of homogenization procedure is essential [27], [28]. Calculation of the equivalent material properties requires solving three RVE boundary value problems in the 2D case and six RVE boundary value problems in the 3D case. For each RVE a prescribed strain is applied by enforcing displacement boundary conditions in accordance with Equation (1) in the 2D case and Equation 2 in the 3D case (a superscript indicates the number of analysis) [29]:
After solving the required boundary value problems, stresses are averaged in the post-processing stage of the analysis in the following way:
where <σ>RVE is average stress, σ is stress in the RVE, and V is volume of the RVE. The relation between applied macro strain εij and averaged stress <σij> can be expressed via stiffness tensor C as follows:
The results of the conducted numerical homogenization are effective stiffness tensors which have been determined on the basis of the different microgeometries (components of the stiffness tensors are expressed in GPa):
Two-dimensional microgeometry including cobalt islands, 0.06 cobalt mass fraction (Figure 2A)
Two-dimensional microgeometry including cobalt islands, 0.09 cobalt mass fraction (Figure 2B)
Two-dimensional microgeometry including continuous boundaries between tungsten carbide particles, 0.06 cobalt mass fraction (Figure 3A)
Two-dimensional microgeometry including continuous boundaries between tungsten carbide particles, 0.09 cobalt mass fraction (Figure 3B)
Three-dimensional microgeometry including cobalt islands, 0.06 cobalt mass fraction (Figure 4)
Three-dimensional microgeometry including cobalt islands, 0.09 cobalt mass fraction (Figure 5)
Young moduli E and Poisson ratios v with respect to different cobalt content and different microgeometry model.
| Microgeometry model | 6% of Co | 9% of Co | ||
|---|---|---|---|---|
| E (GPa) | v | E (GPa) | v | |
| 2D, cobalt islands | 651.629 | 0.2672 | 612.359 | 0.2793 |
| 2D, continuous boundaries | 640.580 | 0.2722 | 596.227 | 0.2873 |
| 3D, cobalt islands | 642.220 | 0.2038 | 610.054 | 0.2086 |
| 3D, continuous boundaries | 646.453 | 0.1987 | 611.391 | 0.2043 |
Three-dimensional microgeometry including continuous boundaries between tungsten carbide particles, 0.06 cobalt mass fraction (Figure 6)
Three-dimensional microgeometry including continuous boundaries between tungsten carbide particles, 0.09 cobalt mass fraction (Figure 7)
The analysis of symmetry type of the determined stiffness tensors led to a conclusion that the considered microgeometries exhibit isotropic behavior. Therefore, averaged Young moduli and Poisson ratios have been determined and introduced in Table 1.
In the case of estimated Young modulus, the biggest differences were noticed between the results obtained on the basis of different 2D models (maximum percentage difference equals 2.7%). In the case of estimated Poisson ratios, the differences are more significant than in the case of Young moduli. In general, Poisson ratios obtained by using 3D models differ significantly from the ones obtained by using 2D models (maximum percentage difference equals 31.2%).
4 Stress distribution at microstructure level
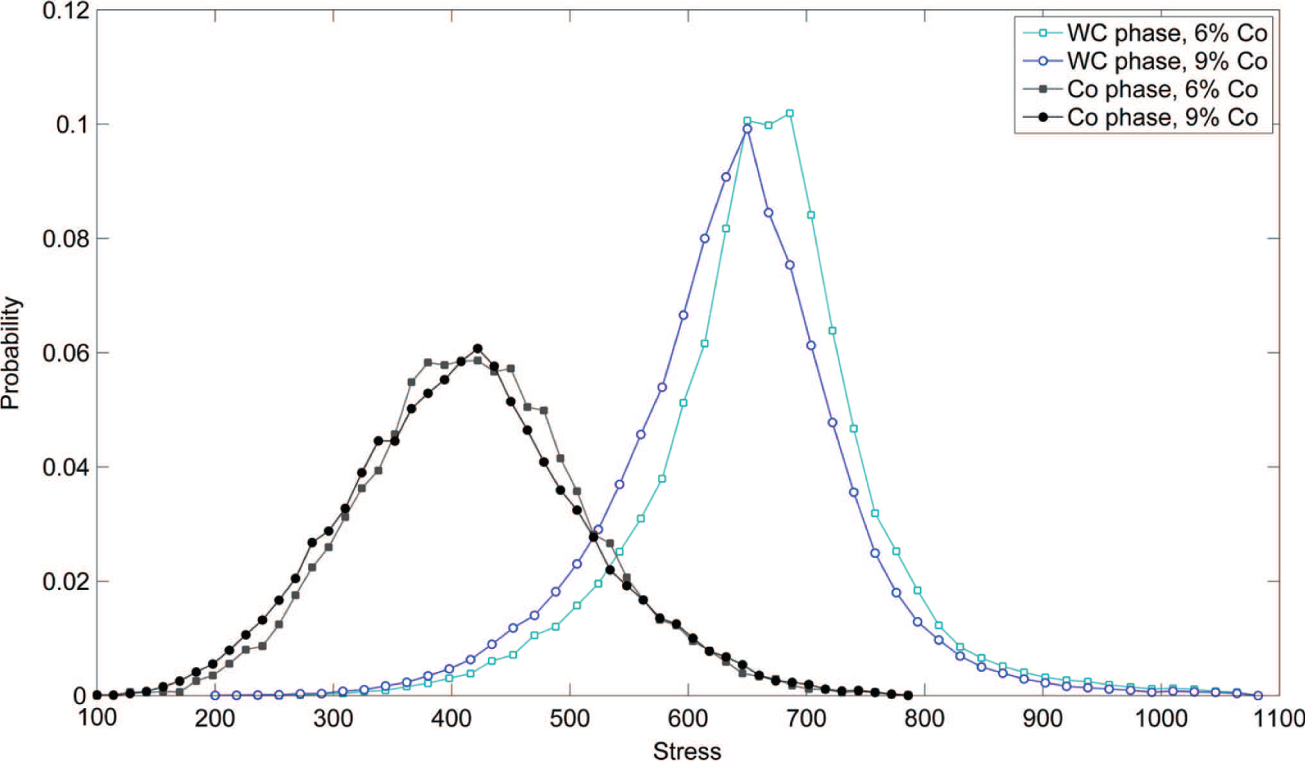
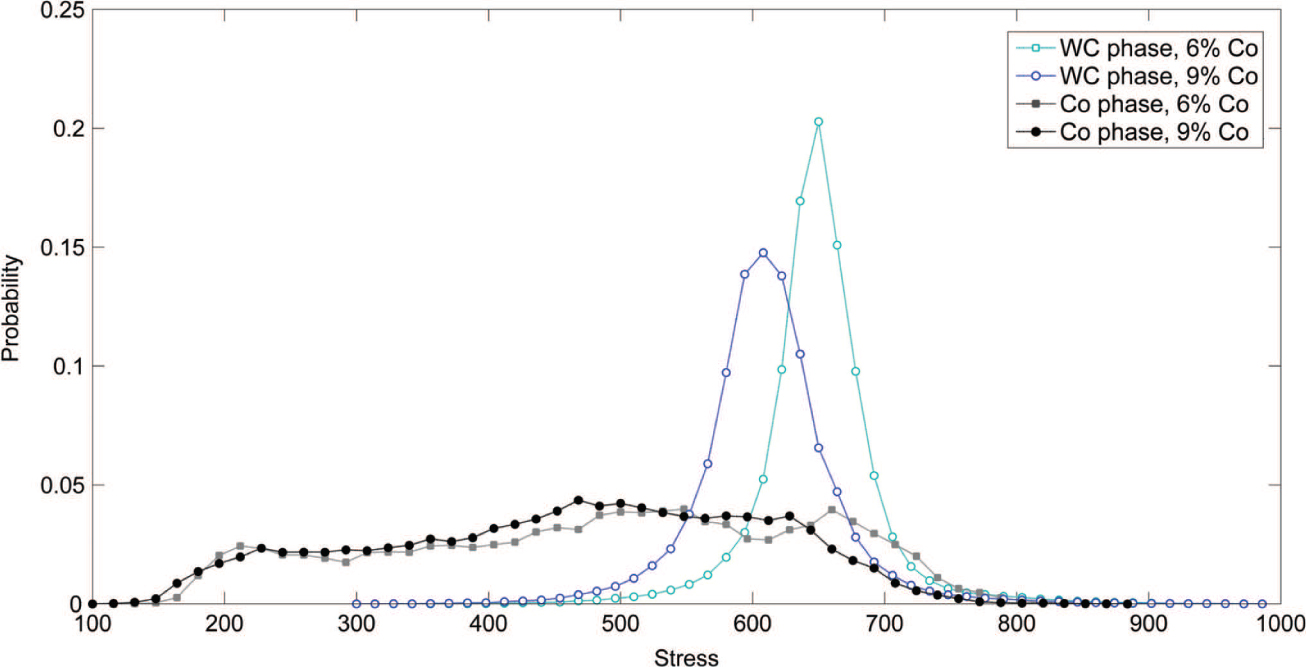
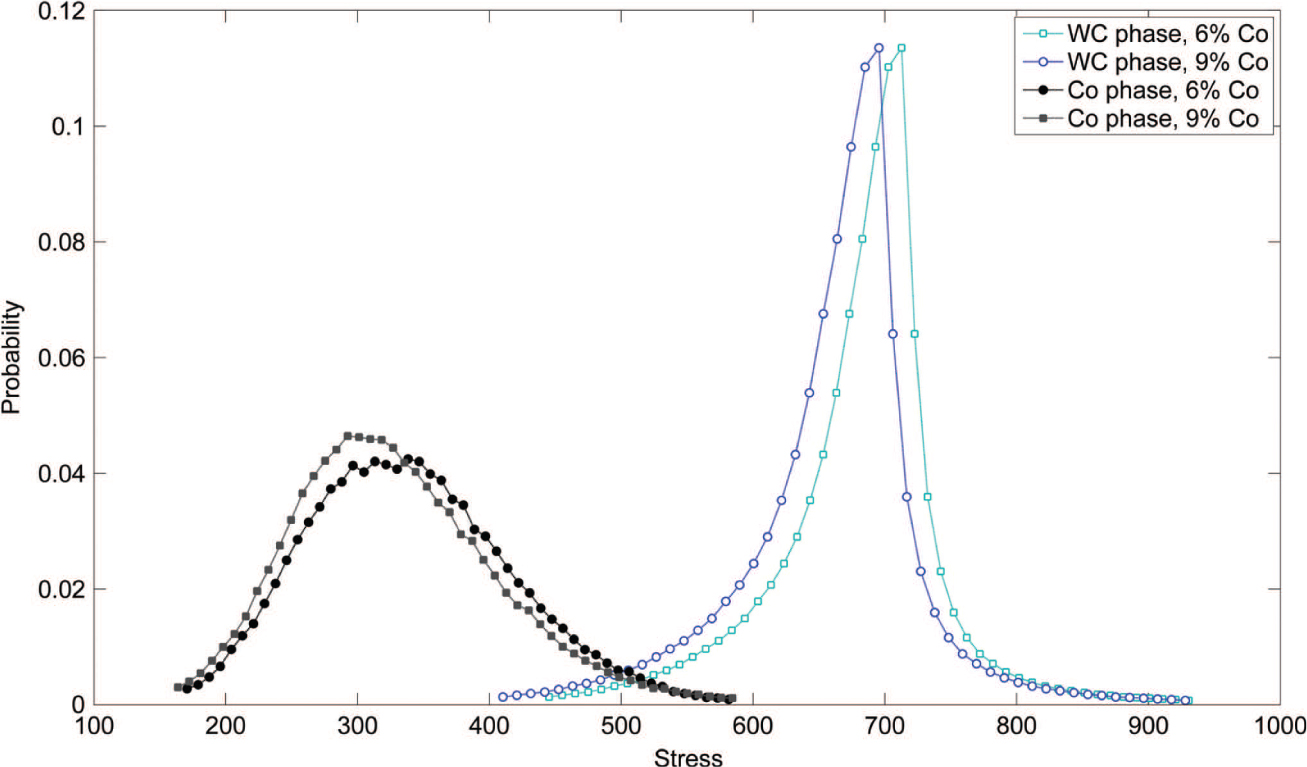
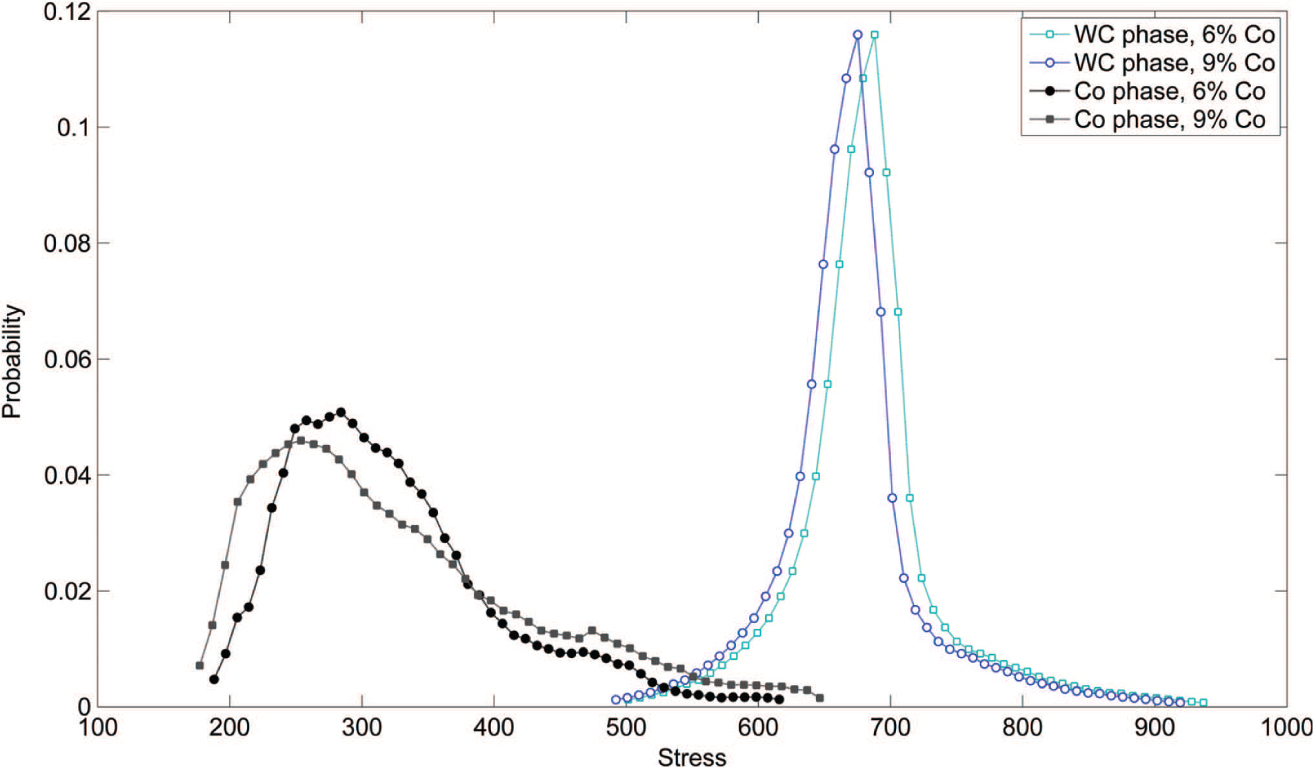
Stress field heterogeneity at microstructure level has been investigated with the use of finite element method. Uniaxial strain ε11 = 0.001 has been prescribed by applying displacement boundary conditions. The results of the performed analyses are presented in the form of distributions of stresses σ11 corresponding to the individual material phases (stress values are expressed in MPa). Figure 12 presents the results obtained by using plane strain model including cobalt islands, Figure 13 illustrates the results obtained by using plane strain model including continuous grain boundaries between tungsten carbide particles, Figure 14 shows the results obtained by using 3D model including cobalt islands and Figure 15 presents the results obtained by using 3D model including continuous grain boundaries between tungsten carbide particles.
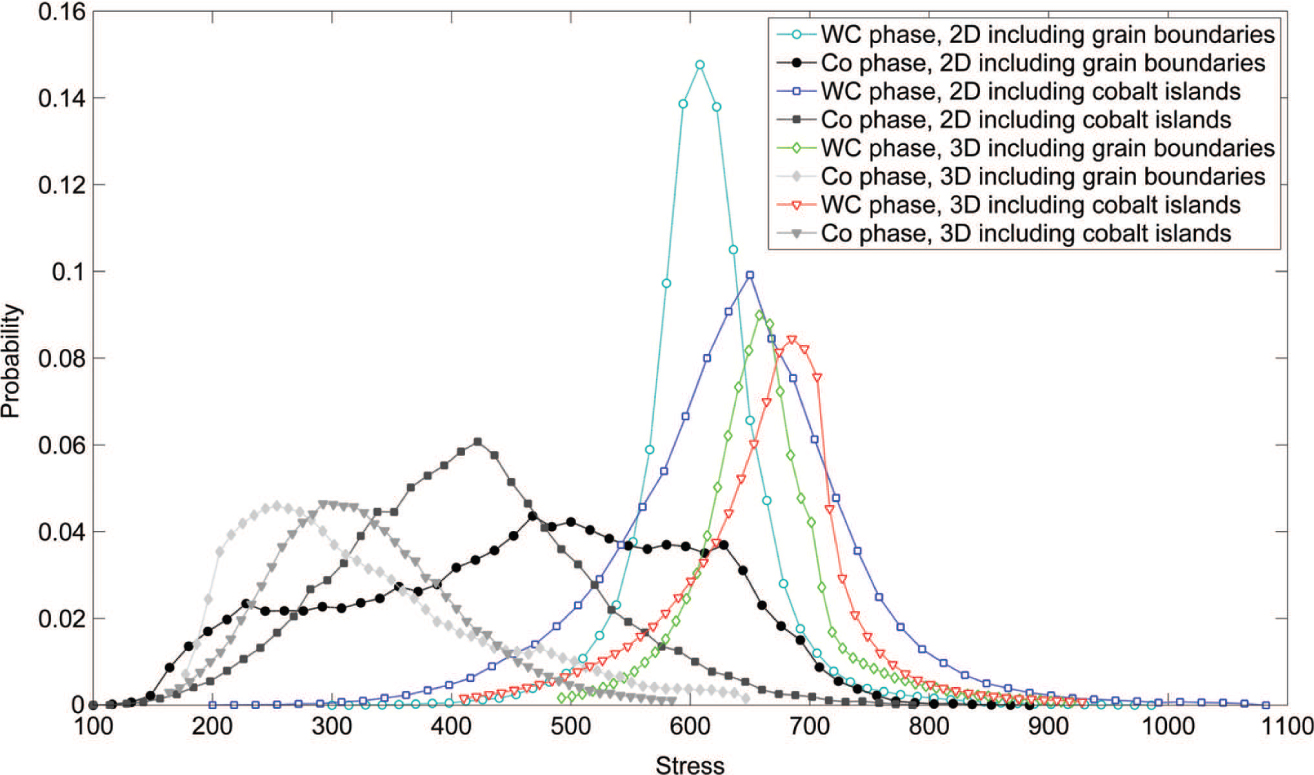
In addition, in order to present the differences between different modelling approaches, stresses distributions obtained by accounting for different models have been presented separately for material with 6% (Figure 16) and 9% (Figure 17) cobalt content. Table 2 collects the σ11 stress averages computed with respect to the cobalt content, dimensionality and microgeometry type.
To illustrate the stress distribution at the microstructure level, the results have been presented in the form of colored contours representing stress levels (results for the material containing 9% of Co have been presented). Consequently, Figure 18A and B present the stress field obtained on the basis of 2D microgeometry models, Figure 19 shows stress field determined by using 3D microgeometry with cobalt islands and Figure 20 presents stress field determined by using 3D microgeometry with continuous boundaries between the tungsten carbide particles.
Distributions of the stresses σ11 in the individual material phases with respect to the cobalt content, 2D model including cobalt islands.
Distributions of the stresses σ11 in the individual material phases with respect to the cobalt content, 2D model including continuous grain boundaries.
Distributions of the stresses σ11 in the individual material phases with respect to the cobalt content, 3D model including cobalt islands.
Distributions of the stresses σ11 in the individual material phases with respect to the cobalt content, 3D model including continuous grain boundaries.
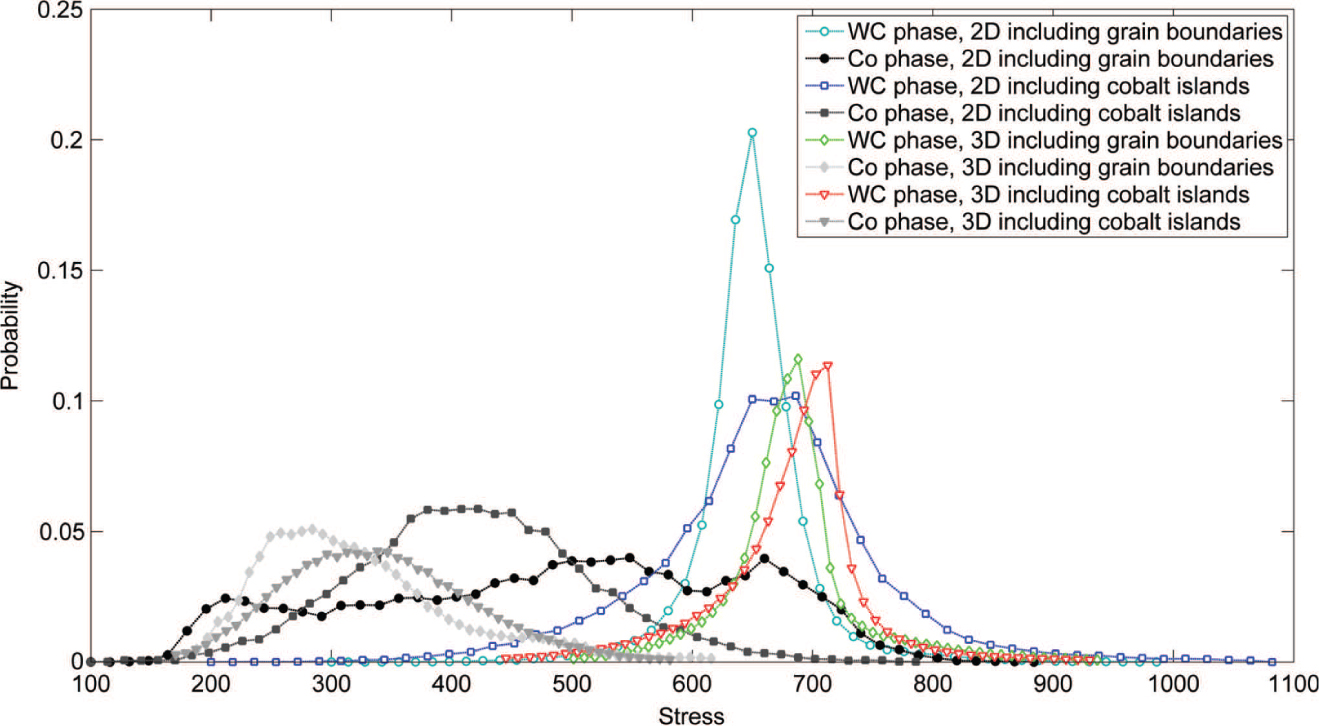
Distributions of the stresses σ11 in the individual material phases of the material with 6% of cobalt with respect to different modelling approaches.
Distributions of the stresses σ11 in the individual material phases for the material with 9% of cobalt with respect to different modelling approaches.
Stress averages computed with respect to the cobalt content, dimensionality and microgeometry type.
| Microgeometry model | Average stress in material with 6% of Co (MPa) | Average stress in material with 9% of Co (MPa) | ||
| Co phase | WC phase | Co phase | WC phase | |
| 2D, cobalt islands | 426.45 | 669.88 | 419.86 | 646.13 |
| 2D, continuous boundaries | 492.14 | 655.70 | 466.93 | 617.18 |
| 3D, cobalt islands | 336.04 | 674.20 | 324.71 | 652.48 |
| 3D, continuous boundaries | 319.30 | 675.94 | 324.08 | 653.67 |
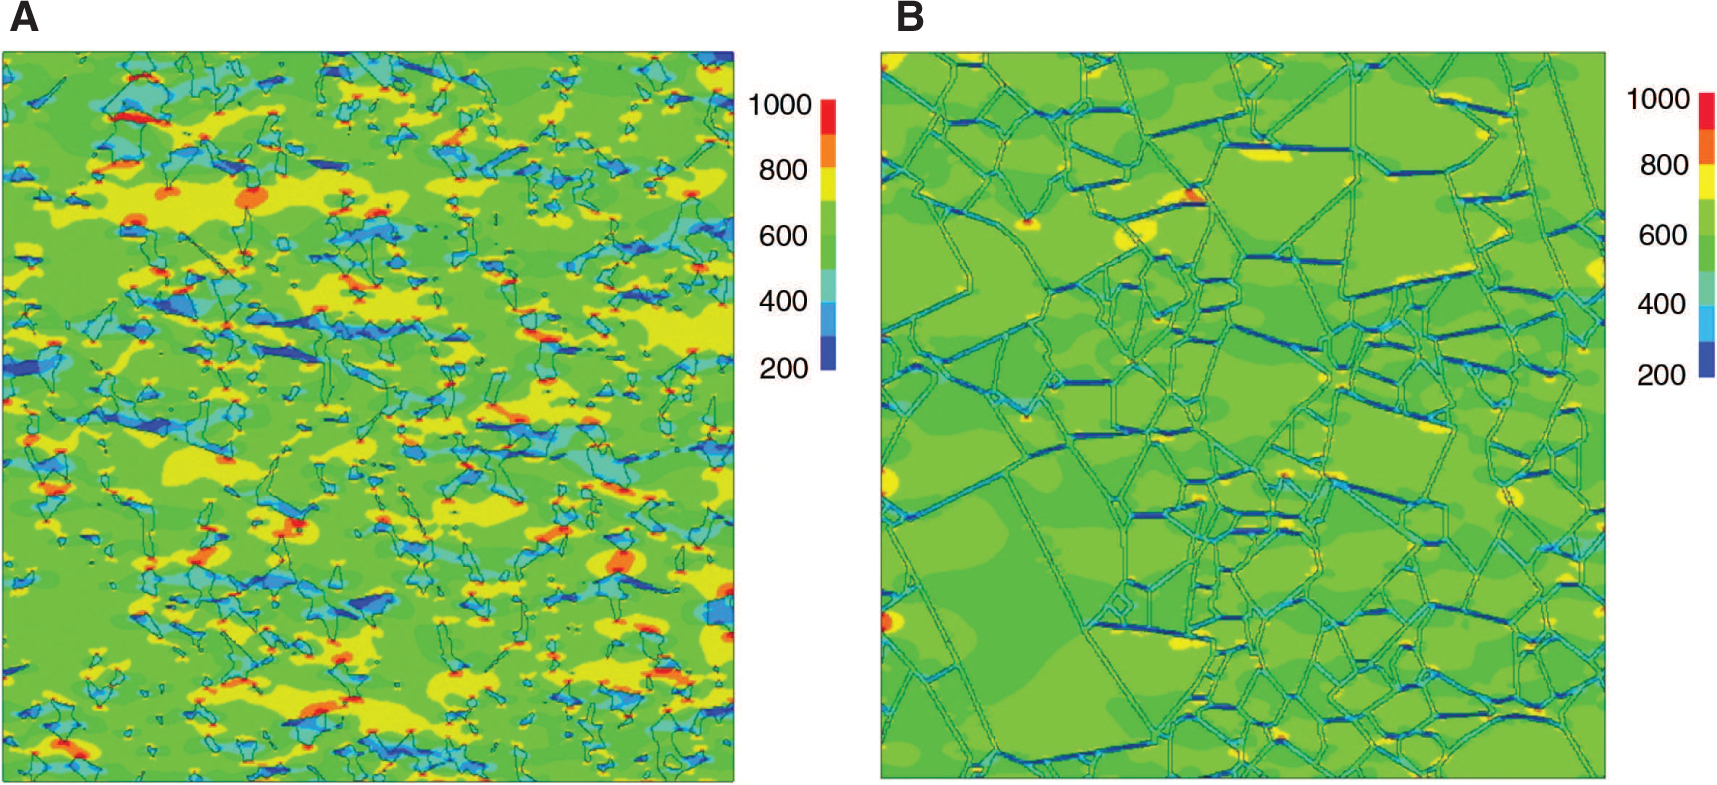
Stress field obtained on the basis of 2D microgeometry containing (A) cobalt islands and (B) continuous boundaries between the tungsten carbide particles (MPa).
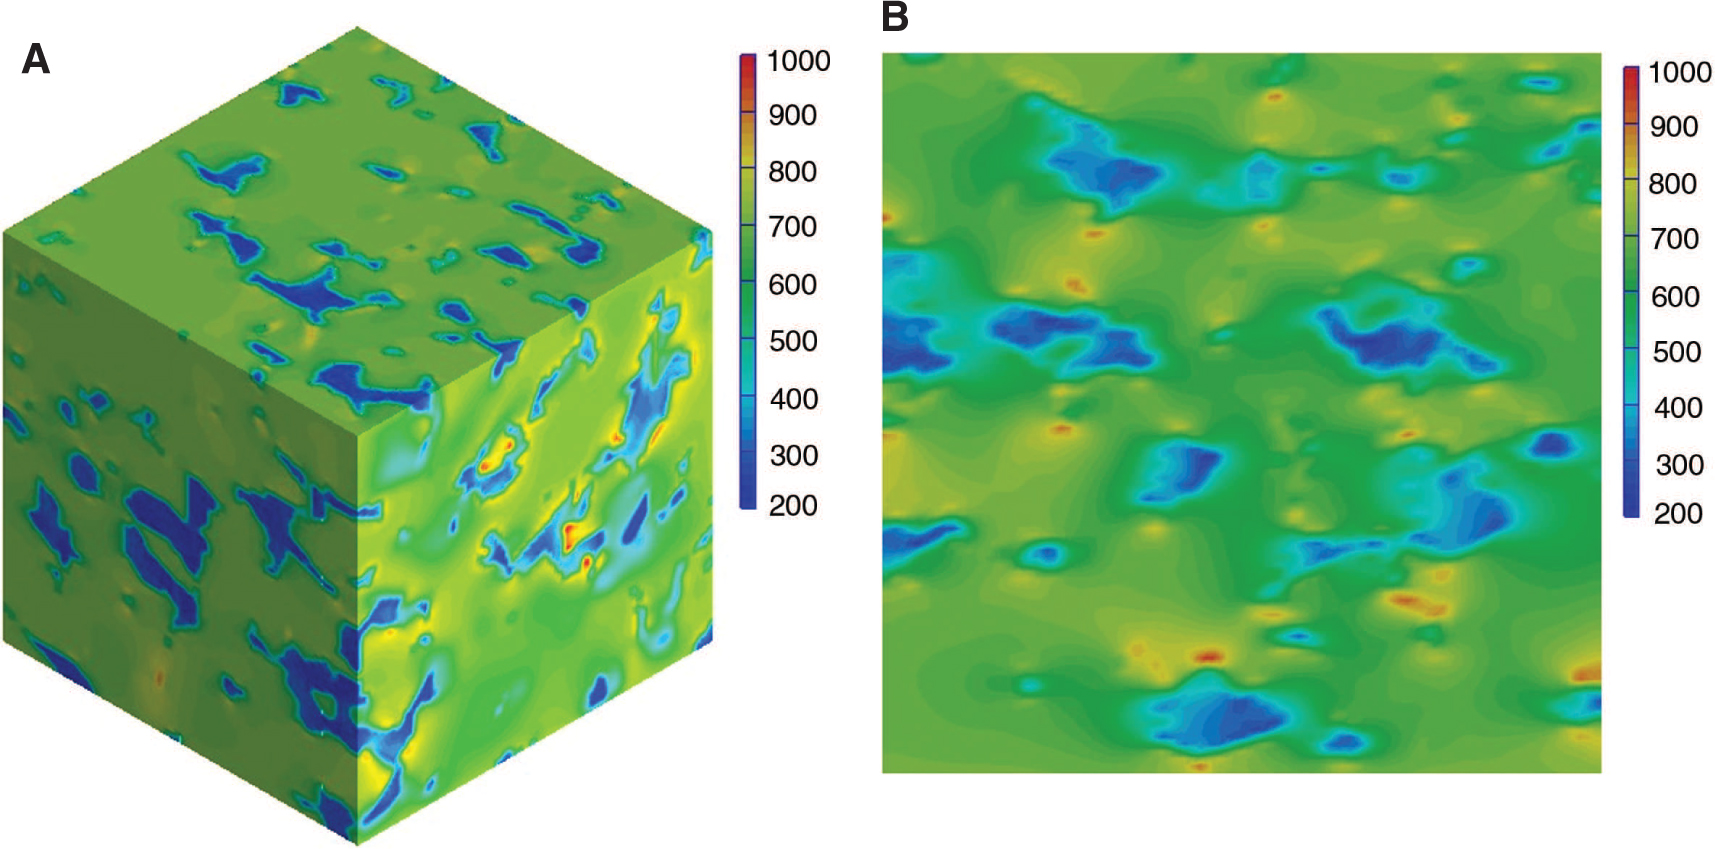
Stress field obtained on the basis of 3D microgeometry containing cobalt islands: (A) isometric view on the RVE and (B) exemplary section view (MPa).
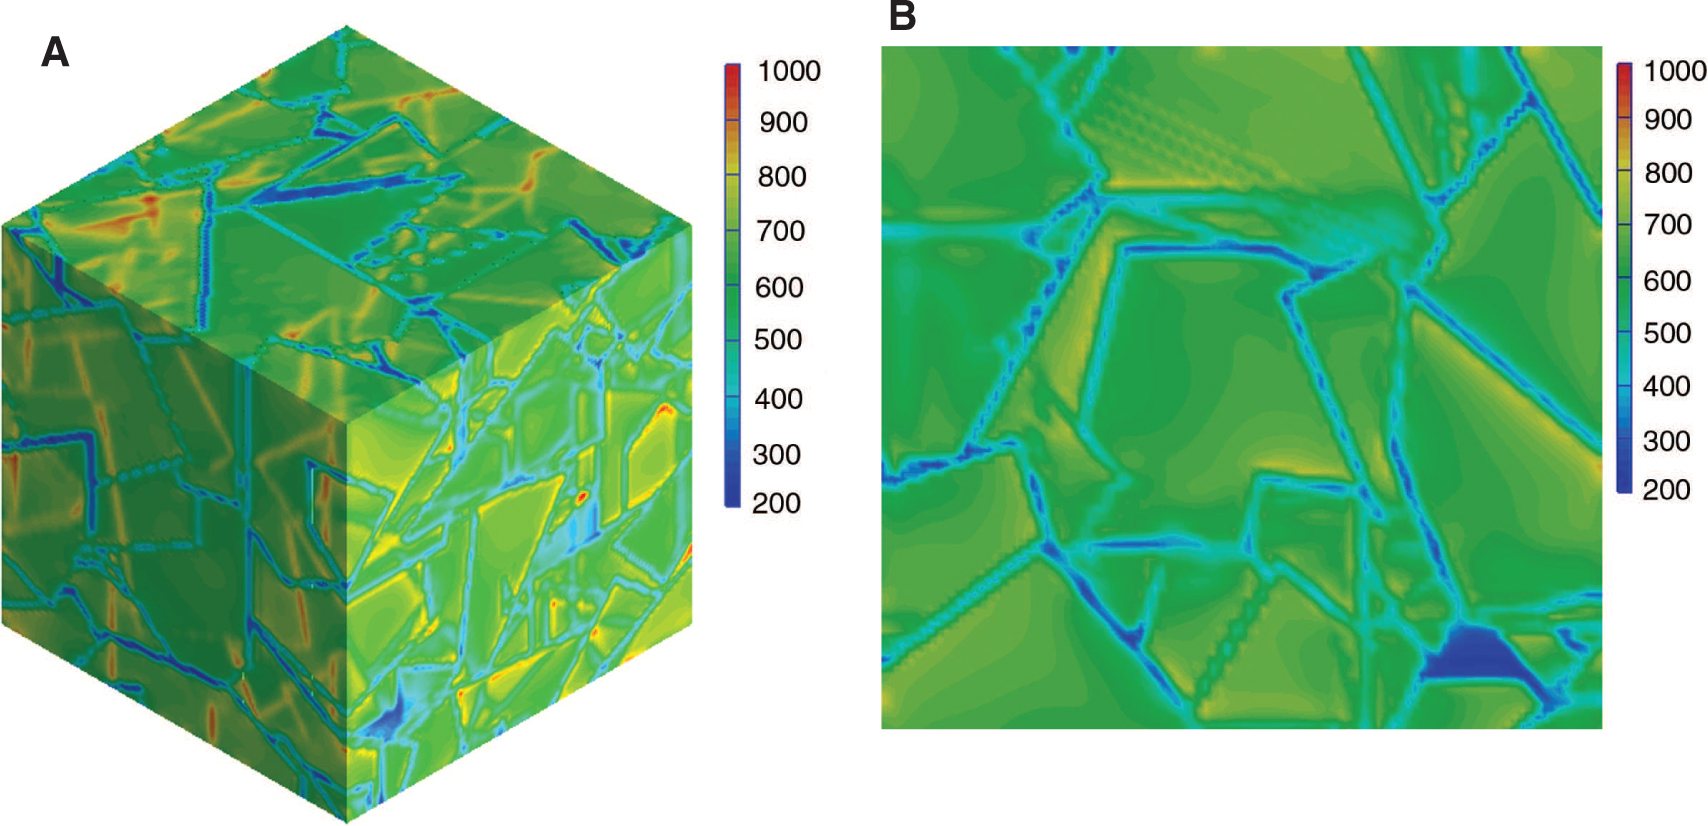
Stress field obtained on the basis of 3D microgeometry containing continuous boundaries between the tungsten carbide particles: (A) isometric view on the RVE and (B) exemplary section view (MPa).
Stress distributions obtained by using different microgeometry models show a high degree of variability. In general, regardless of the model dimensionality, the microgeometries containing cobalt islands lead to higher stress concentration in the tungsten carbide phase than microgeometries containing continuous boundaries between the tungsten carbide particles. Moreover, the microgeometries containing continuous boundaries between the tungsten carbide particles show a tendency to provide smaller widths of the stress distributions in tungsten carbide phase. The usage of 2D models makes high stress level in cobalt phase more likely than in the case of 3D models. The analysis of the stress averages collected in Table 2 leads to a conclusion that the averages computed for all 3D models are similar, regardless of the microgeometry description. A different situation is in the case of stress averages computed for 2D models which differ significantly depending on the microgeometry description. In general, 2D models show a tendency to provide higher stress average in cobalt phase and lower stress average in tungsten carbide phase than 3D models.
5 Conclusions and further work
The main goal of this study is to compare the stress distributions at the microstructure level and effective elastic constants obtained by using different models of WC/Co composites microgeometries. The paper focuses on the application of different microgeometry modelling approaches presented in literature and reveals the differences between the results that they provide. Four models of the RVEs were tested: 2D with cobalt islands, 2D with continuous boundaries between tungsten carbide particles, 3D with cobalt islands and 3D with continuous boundaries between tungsten carbide particles. Moreover, two different cobalt contents have been taken into account. The performed numerical homogenization based on the finite element analysis of the RVEs allowed to determine the effective elastic constants. In general, the biggest differences were noticed between Poisson ratios obtained by using 3D models and 2D models. In the case of the investigation of the stresses distribution, the results obtained by different models show a high degree of variability. The stress concentration levels, widths of the stress distributions and stress portioning between the phases strongly depend on the microgeometry model. The presented variability of the results shows clearly that special attention must be paid to selection of microgeometry model in the case of analysis of cemented carbides and especially in the case of investigating local material behavior, such as damage initiation and propagation. It must be underlined that the 2D models were created on the basis of micrographs of the real materials while the 3D models, which are statistically equivalent to the real materials, have been obtained by assuming the average shape of the carbide particles and using a computational method for the RVE generation. Therefore, further work is connected with the use of microtomographyin order to capture the actual 3D material microgeometry. The results of the finite element analysis carried out on the basis of the microgeometry obtained from microtomography examination will be compared with the results obtained by using the simplified models described in this paper.
Acknowledgement
The publication was partially financed by a statutory grant from the Faculty of Mining and Geology, Silesian University of Technology.
References
[1] Böhm HJ. A Short Introduction to Basic Aspects of Continuum Micromechanics. TU Wien: Vienna, 2014.Search in Google Scholar
[2] Segurado J, Llorca J. J. Mech. Phys. Solids 2002, 50, 2107–2121.10.1016/S0022-5096(02)00021-2Search in Google Scholar
[3] Böhm HJ, Rasool A. Int. J. Solids Struct 2016, 87, 90–101.10.1016/j.ijsolstr.2016.02.028Search in Google Scholar
[4] Geers MGD, Kouznetsova VG, Brekelmans WAM. J. Comput. Appl. Math. 2010, 234, 2175–2182.10.1016/j.cam.2009.08.077Search in Google Scholar
[5] Matsui K, Terada K, Yuge K. Comput. Struct. 2004, 82, 593–606.10.1016/j.compstruc.2004.01.004Search in Google Scholar
[6] Madi K, Forest S, Boussuge M, Gailliègue S, Lataste E, Buffière JY, Bernard D, Jeulin D. Comput. Mater. Sci. 2007, 39, 224–229.10.1016/j.commatsci.2006.01.033Search in Google Scholar
[7] Makowski P, Kuś W. Acta Mech. 2016, 227, 139–149.10.1007/s00707-015-1421-4Search in Google Scholar
[8] Caty O, Maire E, Youssef S, Bouchet R. Acta Mater. 2008, 56, 5524–5534.10.1016/j.actamat.2008.07.023Search in Google Scholar
[9] Hitti K, Laure P, Coupez T, Silva L, Bernacki M. Comput. Mater. Sci. 2012, 61, 224–238.10.1016/j.commatsci.2012.04.011Search in Google Scholar
[10] Schneider K, Klusemann B, Bargmann S. Adv. Eng. Softw. 2016, 99, 177–188.10.1016/j.advengsoft.2016.06.001Search in Google Scholar
[11] Ogierman W, Kokot G. Int. J. Solids Struct. 2017, 113–114, 230–240.10.1016/j.ijsolstr.2017.03.008Search in Google Scholar
[12] Mishnaevsky L, Dong M, Hönle S, Schmauder S. Comput. Mater. Sci. 1999, 16, 133–143.10.1016/S0927-0256(99)00055-5Search in Google Scholar
[13] Dȩbski H, Sadowski T. Comput. Mater. Sci. 2014, 83, 403–411.10.1016/j.commatsci.2013.11.045Search in Google Scholar
[14] Debski H, Sadowski T. Compos. Struct. 2017, 159, 121–127.10.1016/j.compstruct.2016.09.062Search in Google Scholar
[15] Kayser W, Bezold A, Broeckmann C. Int. J. Refract. Met. Hard Mater. 2017, 63, 55–62.10.1016/j.ijrmhm.2016.04.001Search in Google Scholar
[16] McHugh PE, Connolly PJ. Comput. Mater. Sci. 2003, 27, 423–436.10.1016/S0927-0256(03)00045-4Search in Google Scholar
[17] Livescu V, Clausen B, Paggett JW, Krawitz AD, Drake EF, Bourke MAM. Matr. Sci. Eng. A. 2005, 399, 134–140.10.1016/j.msea.2005.02.024Search in Google Scholar
[18] Chawla N, Chawla KK. J. Mater. Sci. 2006, 41, 913–925.10.1007/s10853-006-6572-1Search in Google Scholar
[19] Sadowski T, Nowicki T. Comput. Mater. Sci. 2008, 43, 235–241.10.1016/j.commatsci.2007.07.030Search in Google Scholar
[20] Özden UA, Mingard KP, Zivcec M, Bezold A, Broeckmann C. Int. J. Refract. Met. Hard Mater. 2016, 49, 261–267.10.1016/j.ijrmhm.2014.07.022Search in Google Scholar
[21] Digimat software documentation, e-Xstream engineering, 2015.Search in Google Scholar
[22] Böhm HJ, Han W. Model. Simul. Mater. Sci. Eng. 2001, 9, 47–65.10.1088/0965-0393/9/2/301Search in Google Scholar
[23] Huang Y, Yan D, Yang Z, Liu G. Eng. Fract. Mech. 2016, 163, 37–54.10.1016/j.engfracmech.2016.06.018Search in Google Scholar
[24] Zeleniakiene D, Griskevicius P, Leisis V. Mechanika 2005, 3, 1392–1207.Search in Google Scholar
[25] Kikuchi K, Kang Y, Kawasaki A, Nishida S, Ichida A. Mater. Trans. 2004, 45, 542–549.10.2320/matertrans.45.542Search in Google Scholar
[26] Lay S, Allibert CH, Christensen M, Wahnström G. Mater. Sci. Eng. A. 2008, 486, 253–261.10.1016/j.msea.2007.09.019Search in Google Scholar
[27] Burczyński T, Kuś W, Brodacka A. J. Theor. Appl. Mech. 2010, 48, 855–870.Search in Google Scholar
[28] Ptaszny J. Comput. Mech. 2015, 56, 477–490.10.1007/s00466-015-1182-xSearch in Google Scholar
[29] Ogierman W, Kokot G. Acta Mech. 2016, 183, 173–183.10.1007/s00707-015-1417-0Search in Google Scholar
©2019 Walter de Gruyter GmbH, Berlin/Boston
This work is licensed under the Creative Commons Attribution 4.0 Public License.
Articles in the same Issue
- Analysis on the impact response of fiber-reinforced composite laminates: an emphasis on the FEM simulation
- Artificial neural network for predicting the flexural bond strength of FRP bars in concrete
- Cyclic behavior of GFRP strengthened infilled RC frames with low and normal strength concrete
- Durability of basalt fiber-reinforced polymer bars in wet-dry cycles alkali-salt corrosion
- Effect of B4C particle size on the mechanical properties of B4C reinforced aluminum matrix layered composite
- Enhanced dielectric properties of BaTiO3 ceramics with cerium doping, manganese doping and Ce-Mn co-doping
- Free and forced vibration analysis of rectangular/circular/annular plates made of carbon fiber-carbon nanotube-polymer hybrid composites
- Influence of nano-SiO2 on the bonding strength and wear resistance properties of polyurethane coating
- Investigation of wear behavior of nanoalumina and marble dust-reinforced dental composites
- Negative effect of clay fillers on the polyvinyl alcohol biodegradation: technical note
- Photocatalytic activity of Cu2O/ZnO nanocomposite for the decomposition of methyl orange under visible light irradiation
- Sub-surface mechanical properties and sub-surface creep behavior of wood-plastic composites reinforced by organoclay
- Surface integrity in wire-EDM tangential turning of in situ hybrid metal matrix composite A359/B4C/Al2O3
- The influence of the WC-Co composite microstructure model on stress field heterogeneity at the microstructure level: FEM based study
- Vibration-damping characterization of the basalt/epoxy composite laminates containing graphene nanopellets
- A review on nanocomposite hydrogels and their biomedical applications
- Optimization and simulation analysis of structure parameters of OPCM ultrasonic longitudinal wave actuating element
- Research Article
- Preparation of POSS-triol/wollastonite composite particles by Liquid phase mechanochemical method and its application in UV curable coatings
- Research on preload relaxation for composite pre-tightened tooth connections
- Dough moulding compound reinforced silicone rubber insulating composites using polymerized styrene butadiene rubber as a compatibilizer
- Hydration And Microstructure Of Astm Type I Cement Paste
- Effects of NiO content on the microstructure and mechanical properties of AgSnO2NiO composites
- Overall buckling behaviour of laminated CFRP tubes with off-axis ply orientation in axial compression
- UV sensing optode for composite materials environment monitoring
- On crushing characteristics of hybrid sandwich aluminum-cardboard panels reinforced with glass fiber composite rods
- Preparation and characterization of Ni-Cu composite nanoparticles for conductive paints
- A research on the preparation of oil-adsorbing hydrophobic porous resins by high internal phase emulsions (HIPEs) template
- Material characteristics of random glass-mat-reinforced thermoplastic under cryogenic thermal cycles
- Differentiation of non-black fillers in rubber composites using linear discriminant analysis of principal components
- Research Article
- Efficiency of TiO2 catalyst supported by modified waste fly ash during photodegradation of RR45 dye
- Synthesis and performance of polyurethane/silicon oxide nano-composite coatings
- Study on preparation of magnesium-rich composite coating and performance enhancement by graft modification of epoxy resin
- Research Article
- Mechanical and wear properties of polyetheretherketone composites filled with basalt fibres
- Mechanical Properties of Al 25 wt.% Cu Functionally Graded Material
- Research Article
- Weight reduction of a carbon fibre composite wheel
- Synthesis, electrical properties, and kinetic thermal analysis of polyaniline/ polyvinyl alcohol - magnetite nanocomposites film
- Seismic Behaviour of TRC-Strengthened RC Columns under Different Constraint Conditions
- Characterization of neat and modified asphalt binders and mixtures in relation to permanent deformation
- Microstructures, interface structure and room temperature tensile properties of magnesium materials reinforced by high content submicron SiCp
- Research Article
- Effect of Cutting Temperature on Bending Properties of Carbon Fibre Reinforced Plastics
- Mechanical and tribological properties of B-C-N coatings sliding against different wood balls
- Thermal conductivity of unidirectional composites consisting of randomly dispersed glass fibers and temperature-dependent polyethylene matrix
- Effects of Waste Eggshells addition on Microstructures, Mechanical and Tribological Properties of Green Metal Matrix Composite
- Investigation of porosity effect on flexural analysis of doubly curved FGM conoids
- Review Article
- Utilization of tailings in cement and concrete: A review
- Research Article
- Equivalent stiffness prediction and global buckling analysis using refined analytical model of composite laminated box beam
- Mechanochemical synthesis of zincite doped with cadmium in various amounts
- Size-dependent vibration analysis of graphene-PMMA lamina based on non-classical continuum theory
- Automated, Quality Assured and High Volume Oriented Production of Fiber Metal Laminates (FML) for the Next Generation of Passenger Aircraft Fuselage Shells
- Research Article
- An investigation of the stitching effect on single lap shear joints in laminated composites
- The low-velocity impact and compression after impact (CAI) behavior of foam core sandwich panels with shape memory alloy hybrid face-sheets
- Effect of granulometric distribution on electromagnetic shielding effectiveness for polymeric composite based on natural graphite
- The enhancement of filament winding in marine launching rubber gasbag
- Research on ELID Grinding Mechanism and Process Parameter Optimization of Aluminum-Based Diamond Composites for Electronic Packaging