Deep Mapping the Asklepieion of Pergamon: Charting the Path Through Challenges, Choices, and Solutions
-
Alexandra Katevaini


Abstract
Deep mapping is a recent concept in the humanities that approaches the “thick descriptions” of place, i.e., the complexity of human interactions with space and the many narratives arising as a result. Sacred places are particularly suitable for deep mapping, as they triangulate space with the authority of the divine but also key moments in the lives of humans. With its embrace of the variety of dynamics of space, its multi-vocality and temporal depth, and the fuzziness of data, this approach has much to offer for the ancient world, but until now has rarely been applied. In this article, we discuss deep mapping as a holistic approach and its use with archaeological and historical data. We apply the concept to the sanctuary of Asklepios near Pergamon (in western Turkey). After examining its long history as a central sacred place for over 700 years, we then discuss our implementation of GIS and especially the transformation of the mass of data – archaeological, epigraphic, literary – from the sanctuary into information layers (shapefiles) for GIS. At the core of this article are the deliberations and decisions taken to structure the data for the GIS, but also in presenting it via story maps, as a public outreach tool, with a reflection on the entire process at the end.
1 Introduction
Space is never neutral but is charged with meaning by each user, whether occupant or visitor, whether through individual or collective performance, and the retention of memories (Lefebvre, 1974; Massey, 1994; Tuan, 1977). Space has a compound depth that is at the same time personal, social, cultural, and temporal. While this may be argued for every type of space, religious sites form a very special case. Beyond the everyday, they are by definition charged with meaning and perceptions linked to the deity concerned, whose presence is especially felt within the boundaries of these delimited sacred spaces, heightened through landscape, ritual, and shared experiences (Burkert, 1977; Scully, 1962; Smith & Brookes, 2001; Williamson, 2024). Sanctuaries in the ancient world exhibit all of these factors, but comprehending their complexity depends to a large degree on the level of archaeological preservation, and even in the best cases, it is a challenge to move from material to mindset (Anderson et al., 2022; Hoskins, 2006; Pitts & Versluys, 2021; Renfrew & Scarre, 1998). The concept of “deep mapping,” which refers to the complex sense of place created through a multiplicity of localized stories over time (e.g., Bodenhamer et al., 2022, discussed further below), can lift us over some of these obstacles by focusing on the spatial narratives that material and textual remains can transmit. Rarely applied until now, deep mapping has a great potential for unlocking the variety of meanings that sacred sites in the ancient world held for those who frequented them. But charting a deep map is not without its own challenges. Combining data that widely differ in kind and quality and ensuring that the deep map will deliver more than what is put into it requires careful planning and processes that may out of necessity be more selective than one would want. Our larger project focuses on the sanctuary of Asklepios near Pergamon (Figure 1), a regional sacred center in use for hundreds of years. In this project, we apply deep mapping in the first place to identify and interpret the wide variety of interactions at this sanctuary, between humans, nature, and the divine, and across space and through time, and in the second place to understand how these narratives influenced each other (see deepmappingsanctuaries.org; also askperg.org). The configuration of the deep map of the Asklepieion centers on the use of a Geographic Information System (GIS) as a spatial repository for material and textual artifacts, providing a rich and varied source for a wide range of stories, compiled and communicated through story maps – a process that is still ongoing. In this present article, we trace the path that we have taken toward creating the deep map, providing an open and transparent view into our deliberations, the decisions taken, and the awareness of the impact that this may have on the outcome. In this way we aim to contribute to a broader application of deep mapping for the ancient world, and more specifically with regard to sanctuaries.
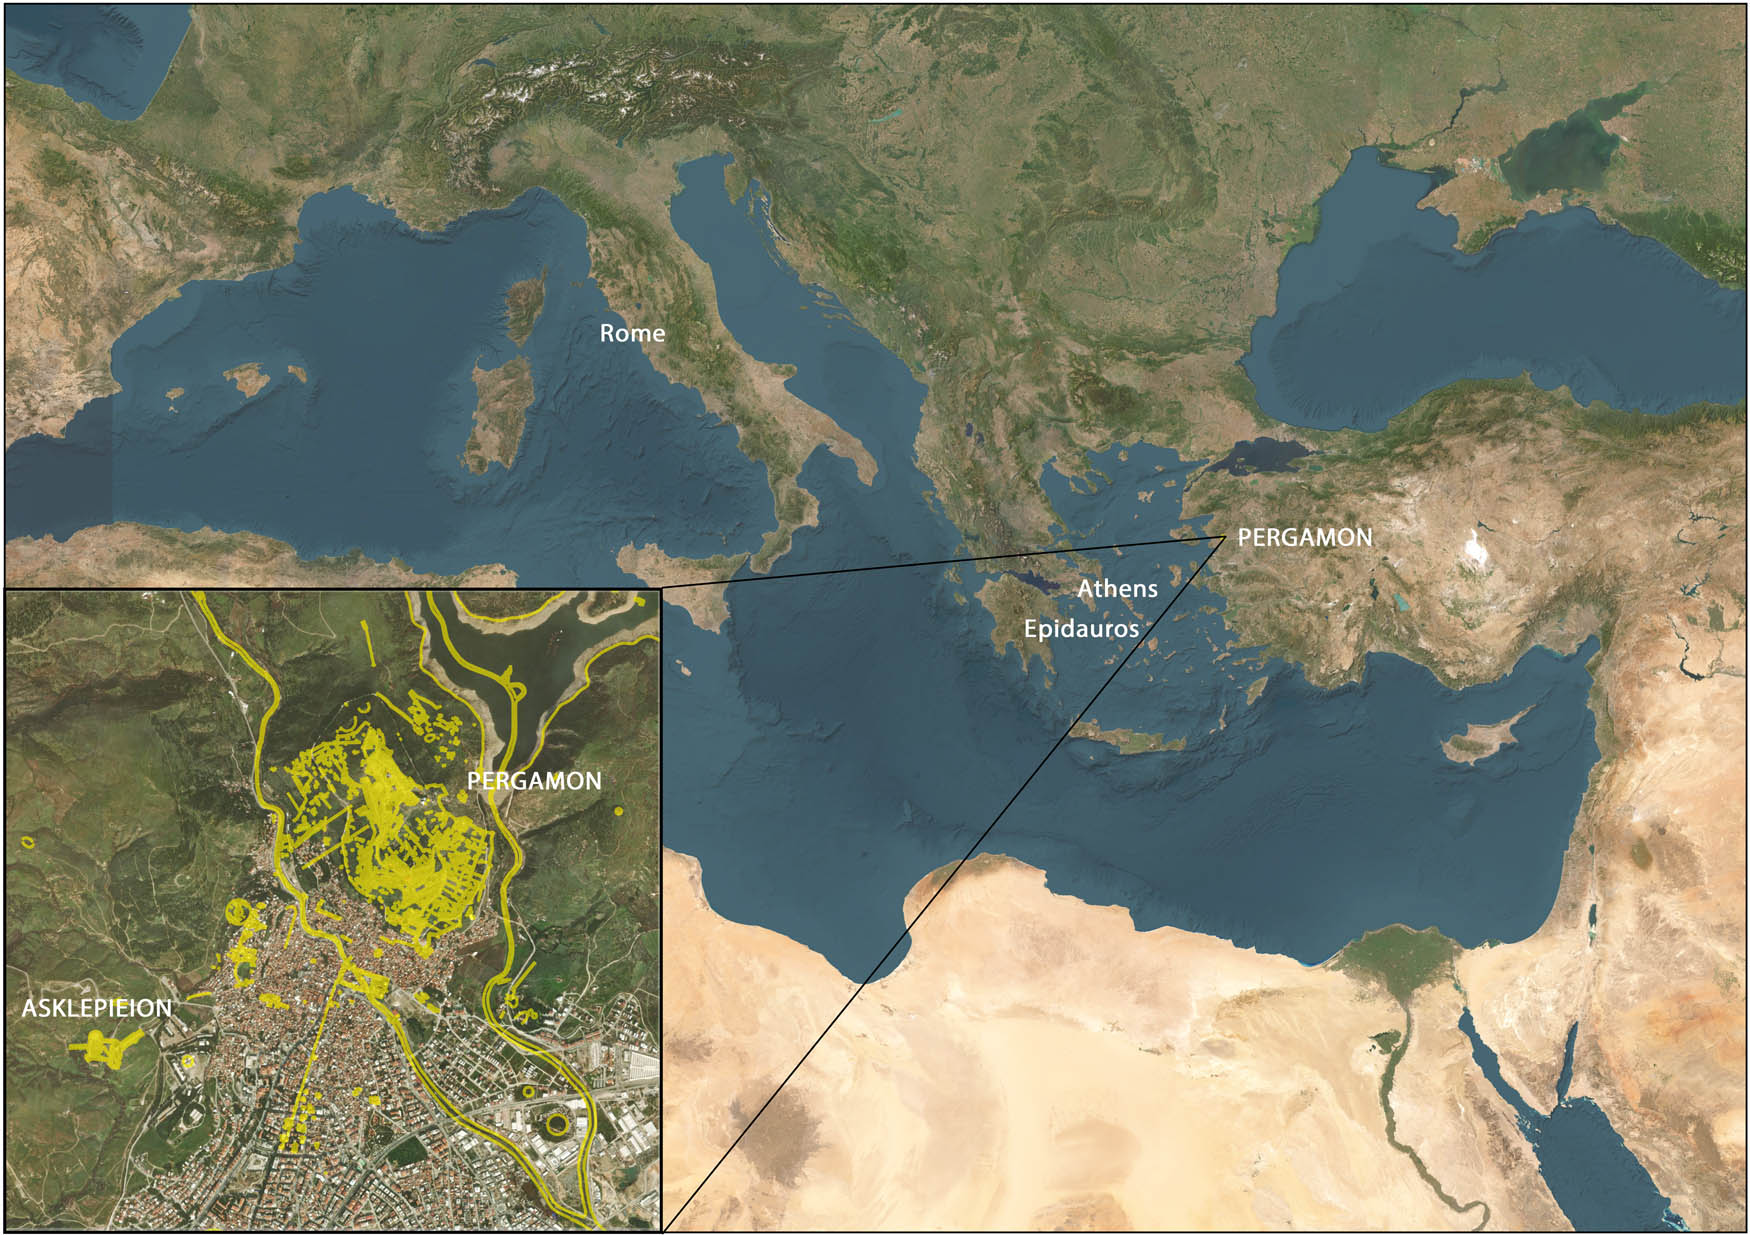
General map with an inset on the area of Pergamon and the Asklepieion (image: A. Katevaini, using ArcGIS Pro and basemap of ESRI World Imagery, in yellow a layer from Pergamon Digital Map 1.1).
Sanctuaries offer a particularly rich opportunity for deep mapping through the tight bond that they embody between people, gods, and place. Besides the authority of the divine, their importance is due to the accumulation of narratives of human and divine encounters, created by individual and collective rituals and other actions. The resulting residue of material and textual culture accumulated, often for very long periods of time, in an increasingly thick sediment of human history in a compact space. This potentially gives us a kaleidoscope of narratives of encounters between divine and human agents, told through social, economic, and political as well as religious dialogs. Their temporal depth surely led to an increased sense of authority and a heightened sense of place, forming a unique gravitational pull at sanctuaries (Williamson, in press, with references). Such was the case at the sanctuary of Asklepios near Pergamon (western Turkey), active as a religious center over a span of some 700 years that ranged from the late Classical period through to the Early Christian era. Well known from the writings of the orator Aelius Aristides in the second century AD, the sanctuary has also yielded a wealth of material culture through the excavations by the German Archaeological Institute (DAI) that took place in the twentieth century – including architecture, sculpture, inscriptions, coinage, and the large quantities of ceramics.
These different types of data each indicate a wide range of narratives that can be related to the spaces in which they resonated through applying deep mapping as a conceptual tool. According to David Bodenhamer: “Deep maps are not confined to the tangible or material, but include the discursiveness and ideological dimensions of place, the dreams, hopes, and fears of residents – they are, in short, positioned between matter and meaning” (Bodenhamer et al., 2015, p. 3). Deep maps can especially amplify the many voices that gave meaning to space, rather than prioritizing just one or a few. Tiffany Earley-Spadoni argues that: “Deep maps are, in other words, meant to promote dialog rather than represent reified social or geographical ‘facts’” (Earley-Spadoni, 2017, p. 97). In our view, these spatial dialogs take on even deeper significance where sacred places are concerned, in which intangible forces play a guiding role in the perception of and hence interaction with these spaces, both through ephemeral performances and the material traces they left behind. Recovering narratives told through the diversity of objects and texts that remain allows us to come to a better, more nuanced understanding and appreciation of the profound complexity of engagements at sanctuaries.
There are many different kinds of deep maps and many different ways to make them (see the contributions in Bodenhamer et al., 2022). Since one of our aims with the Asklepieion project is to identify and assess the great diversity of stories that sanctuaries can provoke, we must search beyond those delivered to us through literary sources. A major challenge is to extract multi-dimensional narratives from both textual and non-textual, i.e., material sources. To this end, we agreed to compile all of the data, tangible and intangible, together in a geodatabase that can further be explored using GIS software. In a subsequent step, we have made this environment available to the public at large through an online interface (see askperg.org, now under construction). We realize, nonetheless, that this is not without risk. The normalization demanded by the structure of databases necessarily entails an essentialization of data, which seems at first glance contrary to our goal of opening up its complexity. To counter this, we have included as much information as possible per object from the available excavation records. This, however, leads to the next caveat, the methodology on which our knowledge of the archaeology of the site relies. The Altertümer von Pergamon volume XI (AvP XI) parts 1–5 cover the excavations that took place in different periods in the twentieth century, largely ranging in time from the 1930s to the 1980s. This represents a variety of approaches and insights, as well as a long span of time from excavation to documentation and publication, all of which will have impacted the level and quality of information that has come down to us regarding the material data.
In the following, we first discuss deep mapping as a conceptual tool in more detail, after which we outline our general approach. Following this, we present our main case study, the Asklepieion of Pergamon, and go into more detail regarding the decisions taken in implementing the deep map. We then present some of the insights gained, but also ways that we have used the Deep Map of the Asklepieion to reach a wider audience. Finally, we give a critical reflection on both the results and the process of making deep maps in this way, with suggestions for future directions.
2 Deep Mapping: Between Quantitative and Qualitative Space
Deep mapping has emerged as a heuristic concept particularly in the last two decades, with a significant impulse in 2015 through the publication of Deep Maps and Spatial Narratives, by David Bodenhamer, John Corrigan, and Trevor Harris, as well as their volumes preceding and following it (Bodenhamer et al., 2010, 2022). The term “deep map” became popular with William Least Heat-Moon’s PrairyErth. A Deep Map (1991), which presents a collage of different narratives, from different perspectives, concerning the past and future of Chase County, in southeast Kansas. Keith Basso’s observations on the tight relationship between the landscape and language of the Apaches follow a similar vein (Wisdom Sits in Places, 1996), as do the place-associative narratives of W.G. Sebald (Die Ringe des Saturn, 1995) in walking the countryside of Suffolk, England. Yet, the concept underlying deep maps, i.e., a sense of place, and the many layers of cultural meaning attributed to a particular space have been around for much longer. Bodenhamer (2022, esp. pp. 1–6) gives a historiographical arc that traces the roots of “deep mapping” back to Bakhtin’s “chronotopes” of the 1930s (Bakhtin, 2008[1937]), the Annales school emphasis of “thick descriptions” (also Geertz, 1973), and the “affective geography” of the Situationists in the 1950s (also Giaccardi & Fogli, 2008; Harris, 2022; Johnson 2020), among several others (including Ptolemy’s “chorographies”). Such works were revisited in the 1990s with the “spatial turn” in the humanities, giving rise among others to the literary and scholarly works referenced above. Touchstones in this vein are also major studies in philosophy and the social sciences concerning the social production of “space,” its complex layeredness and impact on the human condition, as emphasized by Lefebvre (1974) and de Certeau (1984), or Casey (1996) and Massey (1994, 2005), with these latter authors focusing on place-making processes (see also Lätzer-Lasar & Williamson, 2024, with references).
Maps are by nature subjective and narrative, drawn from a particular point of view. This can be observed from the earliest maps onward. The mappa mundi of medieval Europe portrays the world through biblical narratives, exemplified by the T–O schemes attributed to Isidore of Seville (560–636) in his De Natura Rerum and Etymologiae. These show an “O,” or a circle representing the ocean, divided by a “T” representing three bodies of water – the spaces within are the three known continents, each one populated by one of the sons of Noah after the great flood (Mauntel, 2021). This model remained influential throughout the medieval period, often focused on locating Paradise. An exquisitely detailed version is found in the Ebstorf map, from the thirteenth century and found in a convent in Ebstorf (Germany). Stretching to a monumental 3.6 m × 3.6 m, the map was painted on 30 goatskins (Figure 2). An adaptation of the T–O scheme, this map shows the world embodied by Christ, whose head emerges at the top (East), feet at the bottom (West), hands on either side, and Jerusalem at the center. Points in between are fully covered with labeled images of walls and towers and other structures, animals, some mythical, and (mostly naked) humans, and texts relaying stories that draw them into the larger narrative of the world and its creation. This may certainly be considered a deep map. Space prohibits further exploration of cartography, but suffice it to state that approach this continued into the early modern period, at least until the known world began to expand in the Early Modern era and cartography was more focused on navigation (Buisseret, 2003; Murrieta-Flores et al., 2022).
Cartography underwent another major shift in the eighteenth and nineteenth centuries, coinciding with the rise of the nation-state and the developing reproductive technologies of industry. The recent attention to spatial narratives, as Bodenhamer (2022) argues, may be linked to the “flat maps” that have since come to dominate the western view of the world over the past two centuries. Objective on the surface, these maps typically essentialize space to an array of elevation lines contained in a matrix of longitude and latitude coordinates which outline the boundaries of legal entities and political regimes. In the 1990s, around the same time as the “spatial turn,” this Euclidean kind of cartography advanced even further with the advent of digital geographical information system (GIS) that, along with global positioning systems (GPS), took mapping – and with real-time navigation – to a new dimension. The hyper-accuracy of indexed space readily offered by such systems, as well as the “god view,” was the exact opposite approach to the experience of space that many of the scholars mentioned above were after. In their view, GIS, as a quantitative tool, is simply not designed nor equipped to answer qualitative and subjective questions. GIS thus quickly became a line of division between physical and phenomenological approaches to space, especially concerning the perception of landscape (Tilley, 1994, 2008), even though landscape archaeologists themselves often saw no reason for such a divide (Wheatley, 2014; Wheatley & Gillings, 2000). Even in the 2010s, GIS was considered capable of offering only static sequences of “flat” or “shallow” maps, focused on spatial patterns with time merely as an attribute, and therefore useless for explaining change (Dunn et al., 2013; Oxx et al., 2013). This attitude is palpable in Bodenhamer et al. (2013), in which GIS is positioned as inherently “based on positivist epistemologies often ill-suited to the humanities” (p. 170). Elements still linger in Bodenhamer’s more recent statement that GIS “tells us nothing of meaning of what we see” and that it is “not the means for constructing a deep map,” although he immediately adds that it is “part of the solution” (Bodenhamer, 2022, pp. 3–4), stating further that “deep mapping fuses the humanities’ traditional focus on nuance, voice, experience, text, and image with the systematic approaches of spatial science, computer modeling, and virtual reality. Its aim is to link time, space, and culture dynamically” (Bodenhamer, 2022, p. 6).
Deep mapping has been applied in a variety of different ways – from maps, to podcasts, to art works and installations (see Michael Shanks – https://web.stanford.edu/∼mshanks/MichaelShanks/62.html and Clifford McLucas – deep maps https://cliffordmclucas.info/deep-mapping.html). Scholars have long admitted the difficulty of defining what a deep map is with any precision (Modeen & Biggs, 2021, also citing McLucas). Tiffany Earley-Spadoni touches on the core of the deep map with its affordance for complexity, emphasizing the process at least as much as the end result, if not more so. A deep map is “a complex construction composed of layers of meaning and process” (Earley-Spadoni, 2017, p. 96). It embraces flexibility and complexity, as it incorporates multiple perspectives and a variety of human interactions and interpretations:
Deep maps, unlike traditional maps, allow for dissent and discussion of contested geographies, and furthermore permit multi-vocality. (Earley-Spadoni, 2017, p. 97)
This coincides with Bodenhamer’s observations, who closes in on this definition:
Perhaps the simplest definition is this one: Deep maps are fluid cartographic representations that reveal the complex, contingent, and dynamic context of events within and across time and space. They express the results of research but the answers they provide are not final and the map itself is always open to revision. (Bodenhamer, 2022, pp. 6–7)
Following this, and based on the varieties of applications of deep maps, he observes five basic types of deep maps: (1) archival, historical applications (historical GIS, or HGIS); (2) descriptive, “thick maps,” densely layered; (3) narrative, with emphasis on place-making; (4) exploratory, dynamic and path-traceable, connecting Linked Open Data; and (5) immersive/experiential, user-centric and fostering an emotional experience of place (Bodenhammer, 2022, pp. 7–10).
GIS applications are at the heart of most of these types, as Bodenhamer observes.[1] This is not without reason. GIS has long been used by archaeologists both in situating archaeological finds and interpreting distribution patterns over time, initially in landscape archaeology, and later in excavations (Gillings, 2012; Gillings et al., 2019; Wheatley & Gillings, 2000). GIS has meanwhile also become a tool for spatial historians, with a rise since the 2000s in applications known as HGIS (Gregory & Geddes, 2014), generally showing changes at local, regional, or national levels. In the Netherlands one can think of the various urban “time machines,” such as the Amsterdam Time Machine (https://www.amsterdamtimemachine.nl), regional projects such as HisGIS Fryslân (https://hisgis.nl/projecten/fryslan/), or “Topotijdreis,” a temporal and regional map (https://www.topotijdreis.nl). HGIS projects, especially at the local or regional level, are frequently based on cadaster data, largely showing the outlines of properties, sometimes with lists of their owners over time. Such maps show the layering of time in space, which can lead to narratives although these are not depicted directly on the map. Closer to our project is the Izmir Time Machine portal (https://izmirtimemachine.com), which includes 3D visualizations of ancient cities in the region of Izmir, with a separate section for Pergamon, including the Asklepieion.
GIS applications are capable of layering many different types of data, stored in a geodatabase. The capacity of GIS to handle large quantities and varying types of information, and to connect these to a common spatial attribute, uniquely positions the tool to yield insights into the multi-layered overlap of space produced by various actors with often widely differing aims. Like a kaleidoscope, GIS can at the very least make visible the rich differentiation of spatial narratives, as well as changing patterns over time, leading the user to ask new questions, which in turn lead to new avenues of pursuit that may reveal many more narratives. Moreover, as a tool, GIS has significantly evolved in response to such questions from the humanities. The potential to highlight spatial narratives has exponentially increased with the advent of “story maps,” a means of producing a spatial narrative online, told with maps but also with a variety of media, including images, videos or audio, or other embedded materials (Caquard & Dimitrovas, 2017; Dickinson & Telford 2020; Robertson & Mullen, 2022; ESRI Digital Storytelling with GIS-Based Map, also discussed in Section 6). The tool is geared toward an immersive experience for the visitor. Story maps also allow for multiple stories to be housed within the tooling, and navigating them need not always be directional – “explore” features allow visitors to be more actively engaged, navigating their own path through the story content.
As stated above, GIS is receiving wide acceptance as a tool for deep mapping, especially through its connection with story maps. For archaeology and studies of the ancient world, however, this is still new terrain, even though archaeologists were among the first to embrace the use of GIS. While some have made advancements with phenomenological or embodied GIS (Eve, 2014; Gillings, 2012; Wheatley, 2014), few archaeologists have openly applied the concept of deep mapping or spatial narratives to their data (but see Lewis, 2015). Another exceptional aspect of our project is the micro-scale at which we are working. Deep mapping and GIS projects gravitate toward landscapes and rarely work within such a limited, predefined area as ours. Yet, as stated above, the temporal depth and compact space at sanctuaries, with many intensely vested interests, make them rich spaces where a plethora of stories overlap and collide and are uniquely suitable for deep mapping.
GIS is the foundation of our deep map, providing a solid base for analysis and a platform for academic data exchange, while story maps especially allow spatial narratives to be communicated to a wider audience, including students and other scholars. In this vein, our project is innovative but especially exploratory in seeking the best approach to deep mapping, always with the aim of interpreting human interactions and extracting narratives in space and over time.
Deep maps, as Bodenhamer states, “are framed as a conversation and not a statement” (Bodenhamer, 2022, p. 4). We could not agree more.
3 Archaeological and Textual Data in Deep Maps
As discussed in the previous section, advancements in GIS software in recent years have increased its capacity to deal with qualitative, as well as quantitative data, making it a viable approach as a deep map. This is crucial for our project of the Deep Map of the Asklepieion of Pergamon, which aims to trace the broad spectrum of spatial narratives at the sanctuary using a large and heterogeneous dataset, consisting of information that strongly varies in both kind and quality. The core of the deep map incorporates archaeological, literary, and historical evidence that spans several periods in the lifespan of the site. These kinds of data can be integrated in GIS and subjected to computer-generated queries that can highlight relationships, such as visual analyses or network analyses. For standard desktop research, we use QGIS (https://qgis.org/en/site), as this allows us to easily exchange data layers with the DAI, which is committed to using open-source software. For online applications and public outreach, we use ESRI ArcGIS in combination with ESRI StoryMaps (discussed further in Section 6).
But our data, as with all data, come with a past of its own, and it is important to first come to terms with how the assemblage of evidence was construed. Archaeology is the science of studying the material past. However, archaeological data are the result of a long process of different depositional and survival factors and so do not give a full representation of the past; some materials survive better than others, and some soils are less stable than others. Also, post-depositional factors, such as erosion and other natural or human disturbances of the soil, play a role in the survival of material culture (Renfrew & Bahn, 2013, pp. 45–68). The fieldwork process itself is another factor with strategies that determine which kinds of extant materials even can be recovered. The research objectives, approaches, and extent of excavation directly affect the recording of data and the quality of spatial (horizontal) and temporal (vertical) observations (Yarrow, 2003). Over the last century, the level of information recorded in the excavation field has changed in accordance with ongoing developments regarding the kind of research questions being asked of the data (Lucas, 2001). An important factor is how the data are recorded and communicated to the public. Ideally, each excavation leads to a scientific publication, which typically includes an interpretation of the site, based on the archaeological data. However, the targeted audience usually consists of other specialists (Renfrew & Bahn, 2013, pp. 102–114). For archaeological excavations that yield large amounts of evidence and documentation (e.g., reports, photographs, samples, objects), only a selection of items deemed representative makes it to the final publication, just a fraction of the material recovered. These few handpicked items stand, pars pro toto, for the (often) tons of material collected during the excavation. Our project incorporates only the published archaeological data, and we have to accept that there is a reduction of information at every step of the process from the original context to our project database, with human decisions impacting each turn (the lower flow in Figure 3). Effectively, our database represents a series of complicated processes of survival, selection, and interpretation, and the many levels of abstraction in data representation.
![Figure 2
A medieval mappa mundi – the Ebstorf map, attributed to Gervase of Tilsbury, dated to 1234–1240 (image: wikimedia [reproduction of original], public domain).](/document/doi/10.1515/opar-2025-0037/asset/graphic/j_opar-2025-0037_fig_002.jpg)
A medieval mappa mundi – the Ebstorf map, attributed to Gervase of Tilsbury, dated to 1234–1240 (image: wikimedia [reproduction of original], public domain).
Moreover, to utilize the archaeological data in our deep map, we had to understand the spatial and temporal attributes of the data. The spatial attributes of the archaeological data are ideally recorded either by means of textual description of their location, which cannot always be accurately replicated in the present or more ideally through geo-coordinates of their location in situ, using GPS devices, with accuracy depending on the device. Publications generally present the spatial attributes of the data as recorded in the field and conceptualized during the excavation process. It is worth mentioning that the excavation strategy can alter how the spatial attributes of the data are perceived. Strategies often associate field data with architectural features, which are not always unproblematic. Finally, excavation only represents the moment of the final deposition of finds. Most archaeological objects are highly mobile, and the previous stages of life, especially their usage, are typically a matter of interpretation by specialists in typological studies.
Temporal attributes of the archaeological data are established through different methodologies. As very few archaeological objects have actual dates on them, researchers use different methodologies to establish a chronology. Archaeologists distinguish between relative and absolute chronology. Relative chronologies use methods like stratigraphy, seriation, and association of artifacts to determine temporal contingencies. Absolute chronologies involve exact dating, with methods such as radiochronology methods (C14) or dendrochronology to situate an object within an externally “fixed” sequence of years (Renfrew & Bahn, 2013, pp. 115–172; for a critical discussion, see Harman & Witmore, 2023). The majority of archaeological features are dated through relative chronologies, being representative of a known style (“diagnostic”) or found in the same context as items that can be dated through more exact methods. Object temporalities are thus typically represented by conventional periods (e.g., Late Bronze Age, or early Geometric), with wide or narrow date ranges.
Textual data (e.g., literary and epigraphic testimonies) undergo similar processes, from reconstructing texts based on fragmented data to the final edition, and complete with commentaries (the upper section in Figure 3). Such texts have long been subjected by historians to a kind of temporal mapping, in which they are situated within a fixed chronological framework according to calendrical years. This framework has traditionally been linked to regimes of power, e.g., kingdoms and empires, but also to moments such as wars or revolutions. This led to a path dependency in interpreting the past that ascribed a centralizing role to politics, much to the detriment of other agencies of historical processes, such as social, economic, or religious practices. Scholars especially of the twentieth century began to search for other lines of inquiry. The Annales School greatly influenced both historians and archaeologists through the proponent Fernand Braudel (1902–1985), who envisaged three principle scales or tempos of historical events: the evenement, i.e., specific events or turning points such as warfare or regime changes, long the main object of historical studies; the conjoncture, middle time, which addresses longer-term developments, especially social or economic processes; and, most famously, the longue durée, concerning the temporalities of underlying structures, such as geology and climate, with their slower yet massive processes of change.[2] This approach also led to the World-Systems Theory, developed by Immanuel Wallerstein in the 1970s, focusing on the planetary scale of historical developments. More recently, however, there has been growing interest for the opposite end of the spectrum as scholars become more and more attuned to microhistories, asking “large questions in small places” (Joyner, 1999, p. 1), but also small questions in large places. This approach frequently concerns localizing agencies, e.g., communities, families, or individual concerns, and is also often linked to historical studies of material culture, sometimes zooming in on object biographies (Deetz, 1977; Gosden & Marshall, 1999; Quirós Castillo, 2024).
Such micro and macro temporal scales determine the research questions asked by the historian and subsequently the selection of texts or data considered relevant. Meanwhile, the physical location of the sources is increasingly being recognized as a relevant factor, especially since the “spatial turn” in the humanities in the 1990s. Historians have long been concerned with geographical questions, particularly regarding regional histories and globalism (and now localism); yet, spatial analysis is still a marginal if expanding field of inquiry as GIS becomes part of the “historians” toolbox of scholars of the past (see the HGIS approaches discussed in the previous section). Moreover, while the temporal specificity of historical sources is not always as straightforward as it may seem, pinpointing their spatialities is at times even more problematic. Literary texts may reference places with varying degrees of precision, and sometimes with descriptions of places that can no longer be identified today. Inscriptions often belonged to monuments, intentionally designed for a specific space and audience, but have rarely been found in situ. In some cases, they actually state where they were to be inscribed, e.g., in a sanctuary or marketplace (although often this is only included as epiphanestatos topos, “the most prominent place”). In any case, a close reading of the textual sources, or the conditions in which they survive, is necessary to incorporate them in GIS at whatever level of spatial resolution they allow (e.g., site, zone, city, region, sometimes even just kingdom, or empire).
The last category of data is not based on texts or objects but is virtual. This regards computer-generated layers created by spatial analysis tools within the GIS environment, based on the shapefiles (the central square in Figure 3). Virtual data may include visibility analyses, least-cost paths, or in the case of our deep map, network (line) tools (e.g. Figures 16 and 17 below). These visualize the wider geographical connections that may be observed using the spatiality of the various sources mentioned above. Concepts such as origin and destination are defined by researchers to show a directional relationship between entities at various scales. Identifying clusters that share an attribute, e.g., source type, location, temporality, or agencies, may allow us to interpret a meaningful network and define it as a layer within GIS for further analysis. The nodes in the networks obviously inherit the same challenges as the data used to generate them, and so the representation has varying degrees of accuracy as a result.
Being aware of the strengths but also the limitations of these approaches is a necessary step in assessing the data for a deep map (Figure 3). The fuzziness of data and its representation in GIS present both the challenge and the charm of deep maps. Limiting ourselves to evidence that can precisely be located within a matrix of space and time might allow us to answer some technical questions regarding plan and elevation, but we would be able to say very little about the lived reality, the messy complexity, that nonetheless fostered a logic of place in the minds of those who inhabited them, especially places high in gravity such as the Asklepieion of Pergamon.
4 The Asklepieion of Pergamon
The deep map centers on the sanctuary of Asklepios, near Pergamon (in western Turkey, Figures 1 and 4). By the second century AD, the Asklepieion had become one of the most renowned sanctuaries of the Roman empire, drawing the attention of emperors and other visitors near and far. Pergamon evolved into one of the foremost cities of the Roman province of Asia, and as it did so, the Asklepieion became one of its prime political, but also religious centers. Asklepios was the god of healing in antiquity and his sanctuaries could attract a wide variety of people for an equally wide variety of reasons. The principal shrine of Asklepios in the late Classical period was at Epidauros in the Peloponnese, but by the Roman era, this was overshadowed by his sanctuary at Pergamon. The chronological depth of the shrine and its intensive presence in the archaeological, epigraphic, and literary record, with a broad cross-section of the population, make it an excellent case study for examining the complexity of narratives woven together through a place of cult.
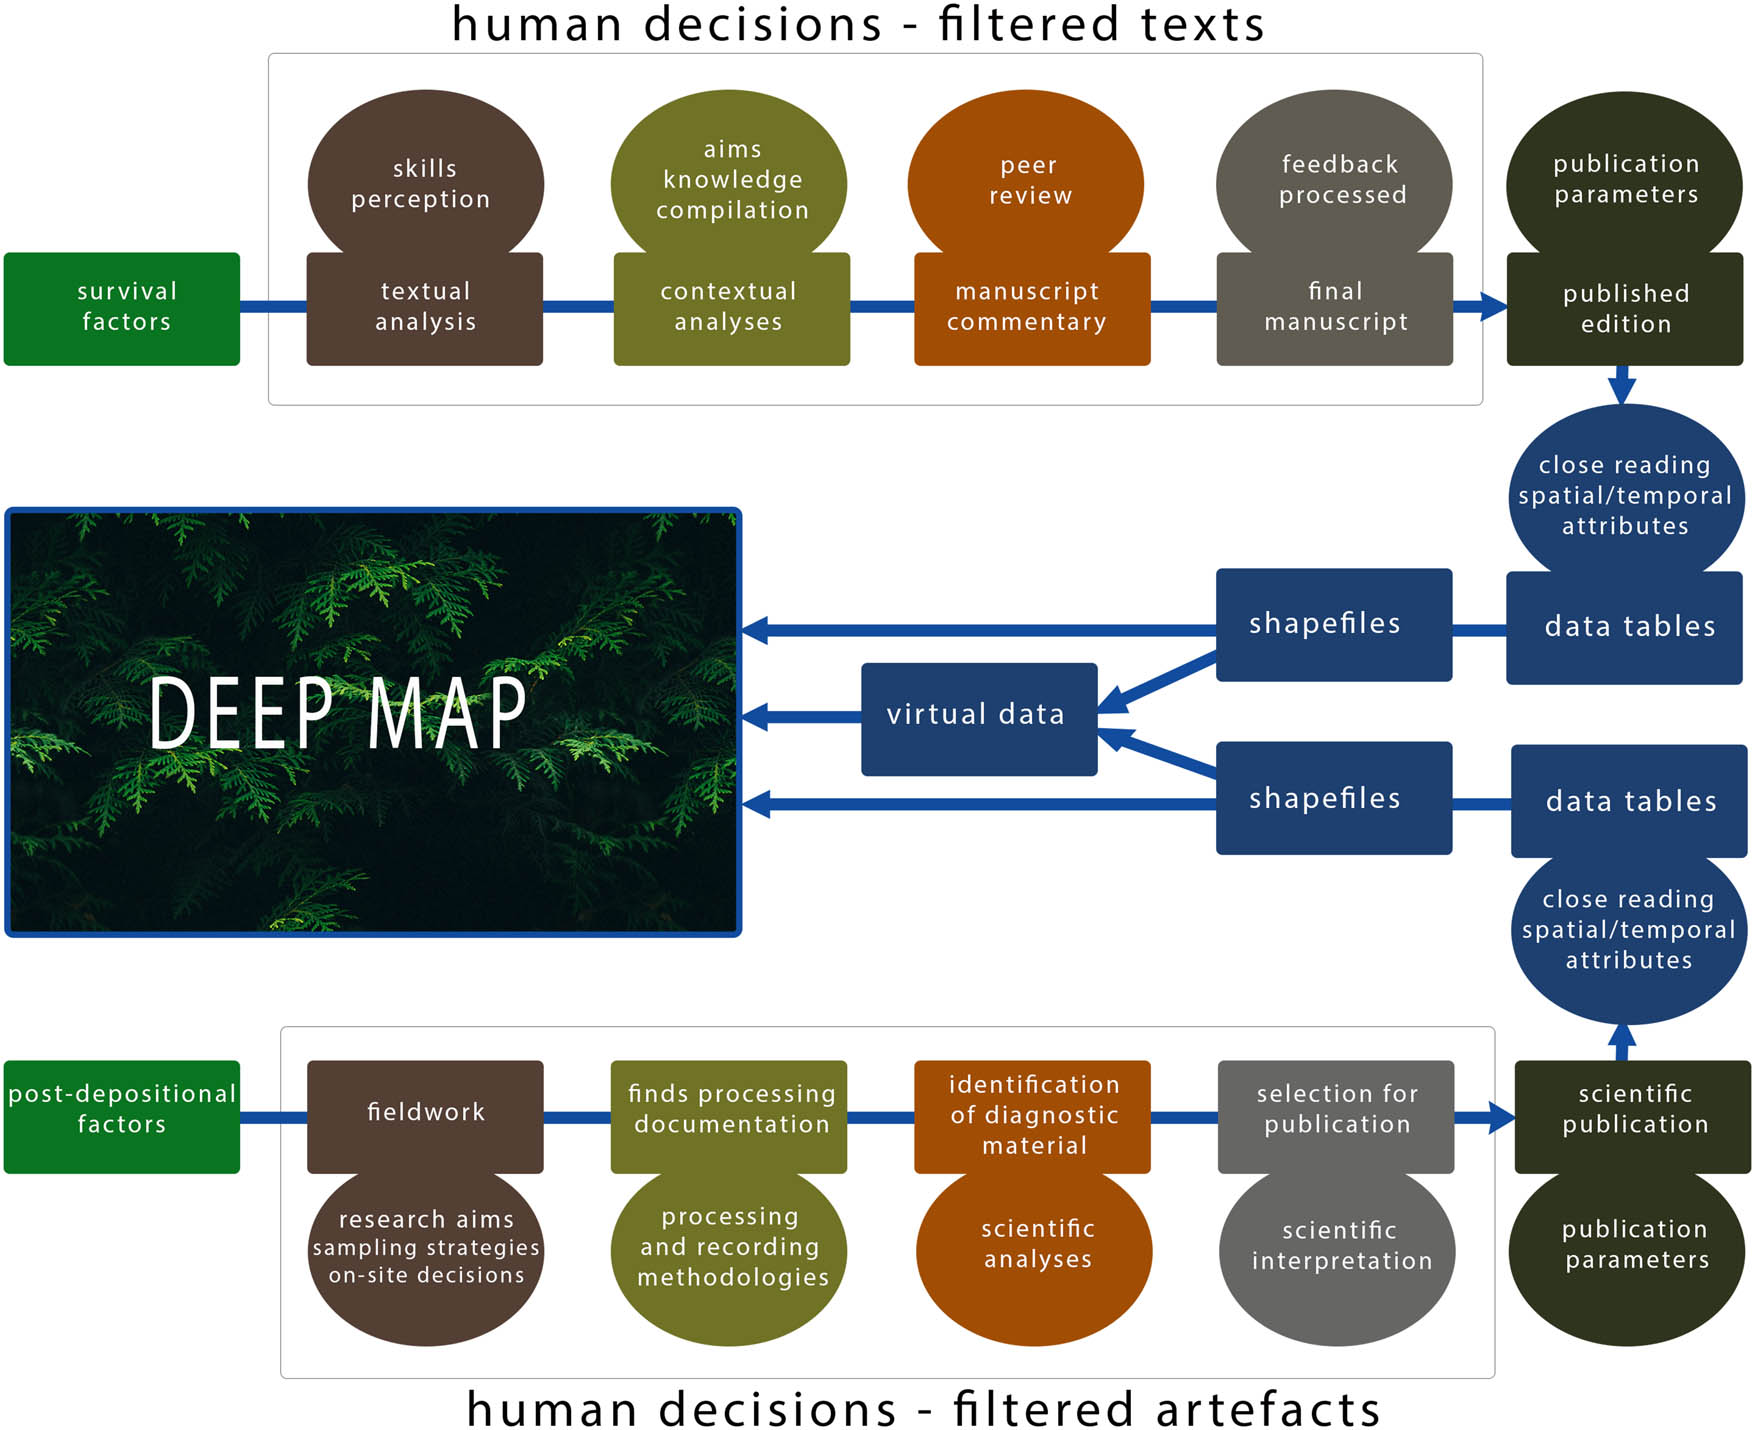
Flow chart showing selective processes of archaeological artifacts and textual evidence resulting in publications that serve as input for the deep map. Rectangles represent stages and filtered results; ovals represent human decisions. Each stage represents a reduction of input for the deep map (image: C. G. Williamson).
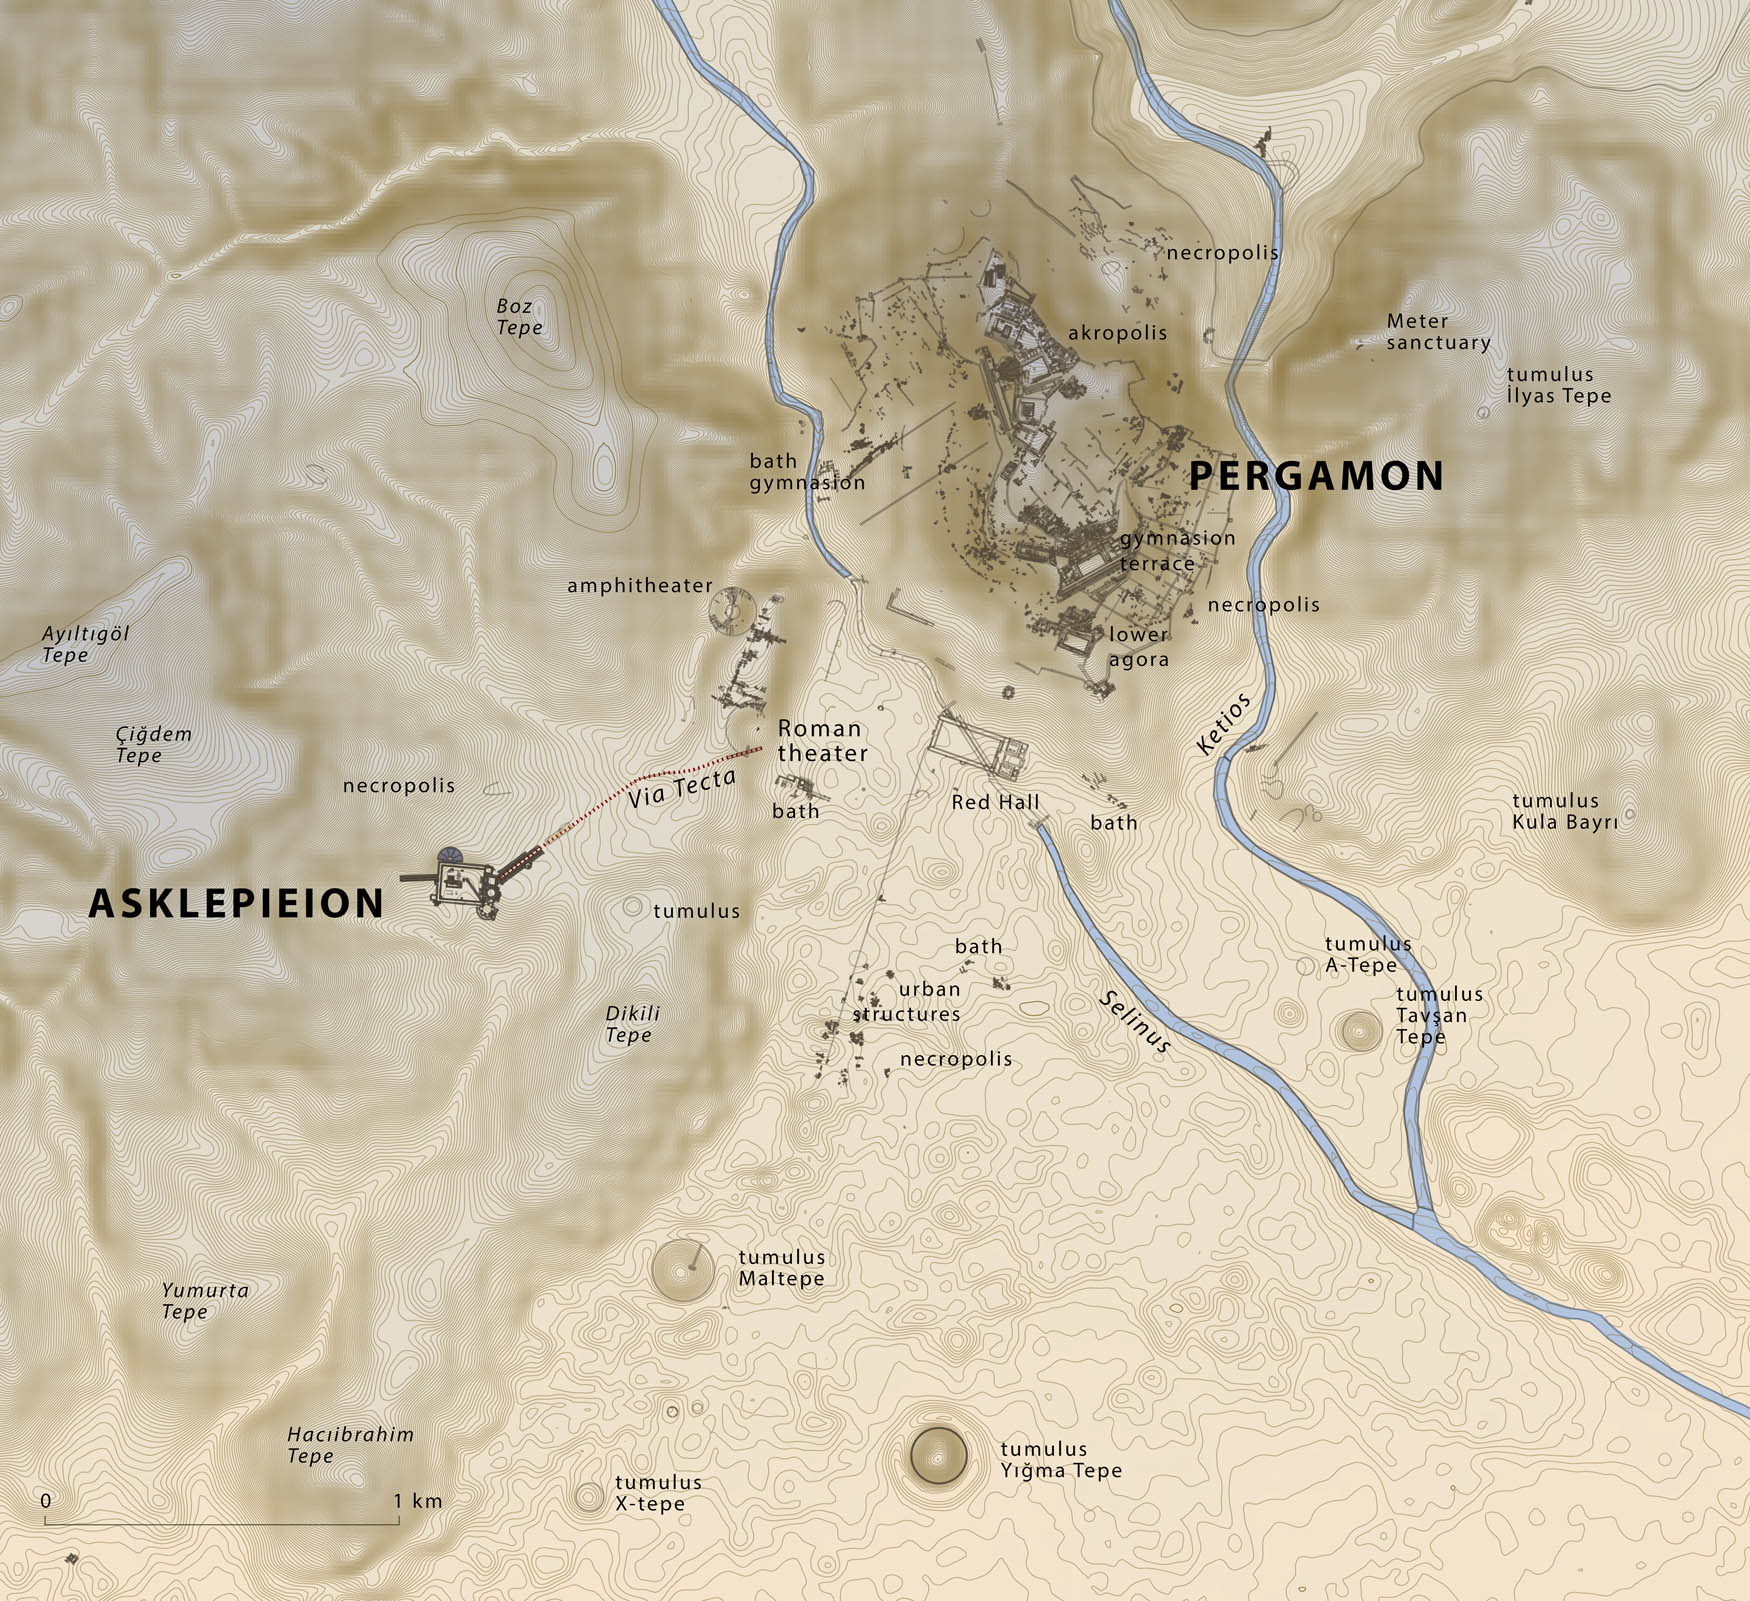
Map of Pergamon, showing the location of the Asklepieion (image: C. G. Williamson, using QGIS and the Pergamon Digital Map 1.1).
By the imperial era, the sanctuary already boasted a long history extending back several centuries (for overviews of the Asklepieion: Deubner, 1938; Jones, 1998; Mania, 2021; Mania & Pirson, 2022; Mania & Pirson, 2023; Melfi, 2016; Riethmüller, 2011). The shrine developed in a natural, fertile, and well-watered basin on a hillside a few kilometers southwest of the city hill (Figure 5). Human activity at the site is attested from the prehistoric era onward, but the cult of Asklepios is archaeologically testified from at least the third century BC on, although stories place it earlier in time. Pausanias, who in the second century AD wrote travel narratives of Greece focusing on sacred sites, relates that the cult of Asklepios was founded by a certain Archias, who injured himself while hunting in the mountains near Pergamon and went to the famous sanctuary of Asklepios at Epidauros, where he was healed; Archias subsequently brought the cult of Asklepios back to Pergamon with him and also introduced democratic government to Pergamon as first prytane (Paus. 2.26.8–9). This presumably took place in the mid-fourth century BC. Archias as the founder’s name is in itself interesting as it implies “beginnings.” An inscription from Pergamon (IvP 251, dated to the second century BC), mentions another Archias whose descendants were to fulfill the priesthood “forevermore” – this was possibly the same Archias mentioned as an envoy from Pergamon in an inscription at Epidauros (IG IV², 1.60). In any case, Archias’ descendants appear to have indeed become the Asklepiades, who held the priesthood throughout the imperial era and formed one of the more influential voices in the shrine.
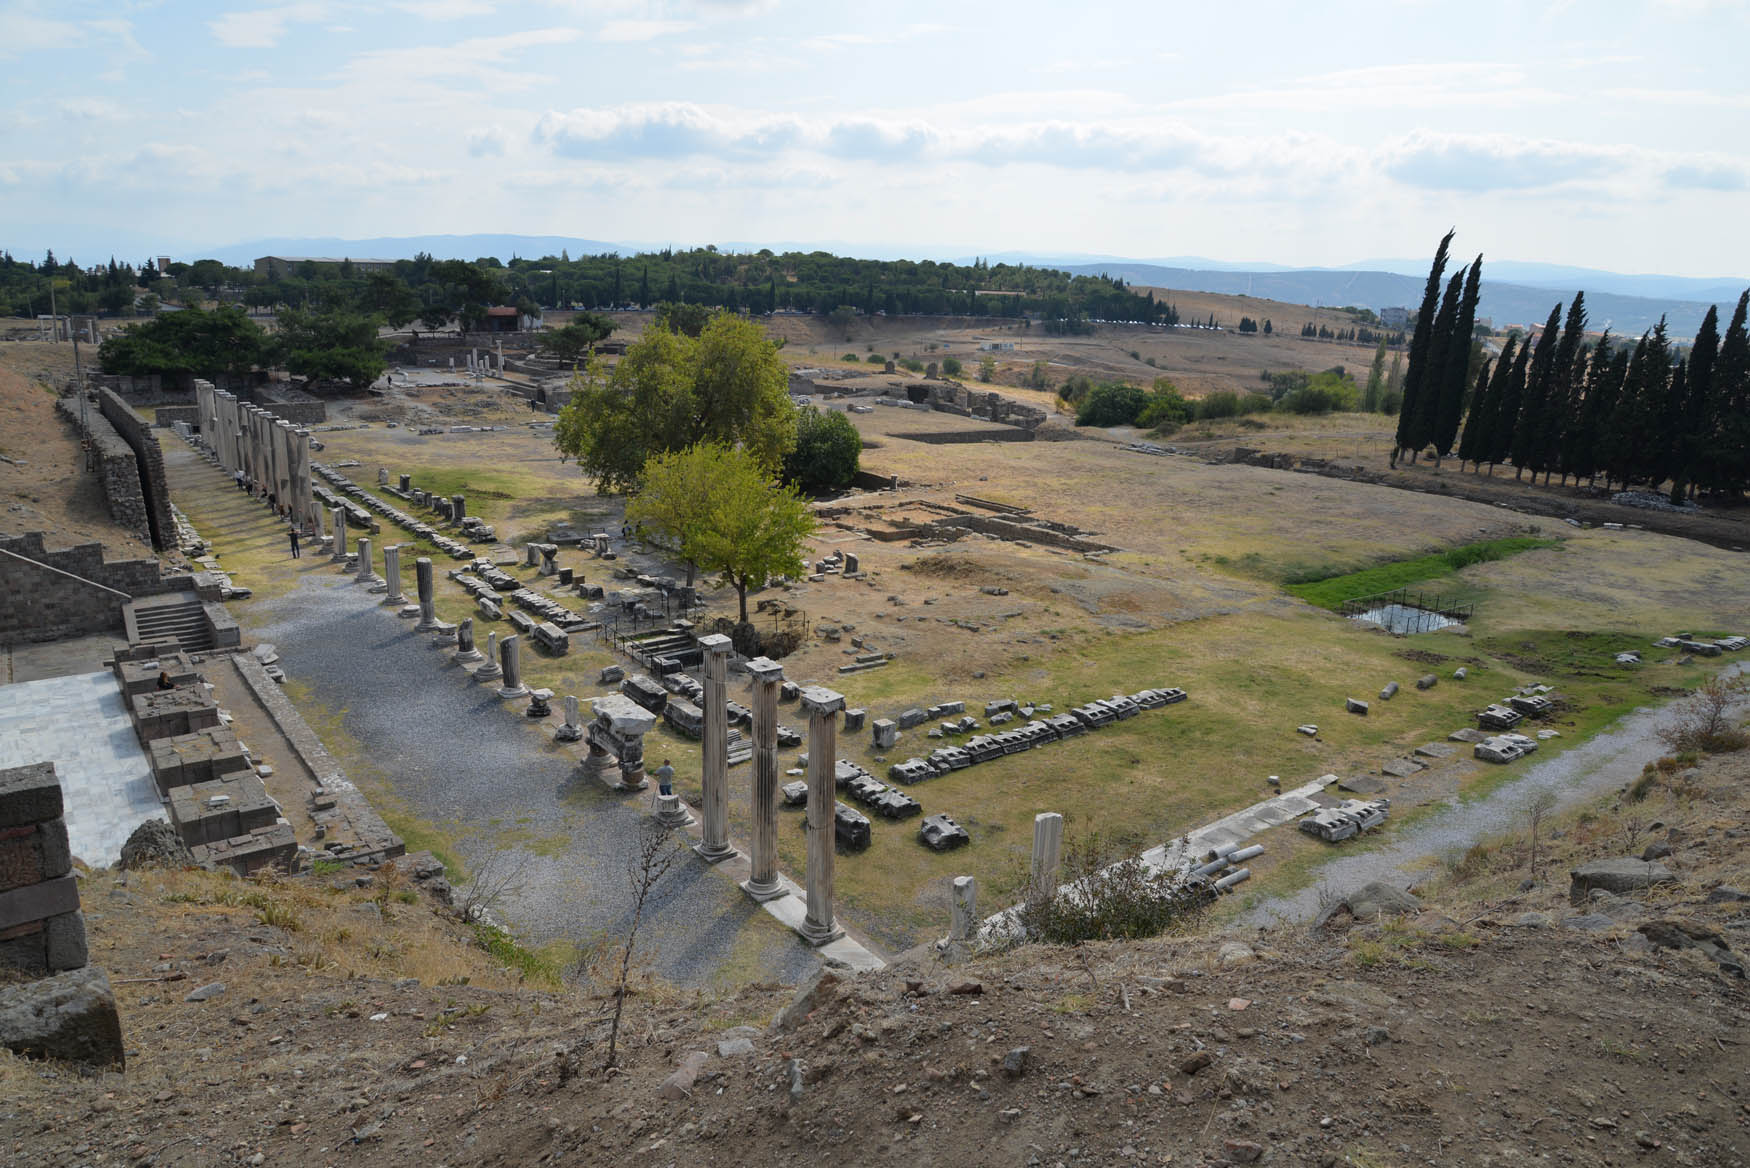
View of the Asklepieion, seen from the theater (image: C. G. Williamson).
A more remarkable story of origins, however, is told by the orator Aelius Aristides, who also wrote in the mid-second century AD, around the same time as Pausanias. Of the sanctuary, he proclaims:
Different gods have been indigenous to different places from the beginning – and these places too, I think, should seem honored in the very fact that gods were allotted them –, but this place is more honored because when the god came here from Epidauros itself, he fell greatly in love with the spot, as is clear in that when he selected it and preferred it to the others, he remained here for the future. But what a god, and the gentlest and most generous of gods, has judged superior, how can we, and at that his servants, say other than that it is the best? (Ael. Arist. Or. 39.5 [“In praise of the Sacred Well”] transl. Behr, 1981)
Aelius Aristides, who lived in Smyrna, suffered from a number of chronic illnesses and spent some years at the Asklepieion of Pergamon – this formed the base for his Sacred Tales (Hieroi Logoi) in which he describes his treatments, meanwhile providing unique insights into the functioning of the shrine as both a healing center, cultural-intellectual center, and its political relevance to the relations between Pergamon and Rome. This is also when the sanctuary was at the height of its fame, comprising a spectacular architectural complex, and when Asklepios became the main deity of Pergamon, Pergameus Deus (Kranz, 2004; Strocka, 2012). The Asklepieion has received the most scholarly attention from this period, not only due to the spectacular architecture but also the rare insights afforded by the orator Aelius Aristides, who spent some years here during his chronic afflictions (Jones, 1998; Petridou, 2016; Petsalis-Diomidis, 2010).
Much less attention, however, has been given to the four centuries of cultic life at the shrine that predates the imperial era. The sanctuary, along with the excavations of Pergamon, falls within the realm of the German Archaeological Institute. The Asklepieion was discovered in 1871 by Carl Humann, but Berlin was preoccupied with the monumental sculpture of the Great Altar on the acropolis of Pergamon; applications by Ernst Curtius and Theodor Mommsen to excavate the Asklepieion were in vain. As Erich Boehringer discusses (in Ziegenhaus & De Luca, 1968, pp. v–vi), the large round building (“Rotunda”) in the southeast, and the theater in the northwest were both visible, with a tobacco field in between, with unusual flows of water. However, it was not until 1928 that Theodor Wiegand obtained permission to commence excavation, beginning with the lower Rotunda. In 1934, the focus shifted toward the central “Festplatz” and the identification of the pre-Roman phases of the sanctuary. Excavations continued until 1938 and were fortunately provisionally published by Ottfried Deubner in 1938, in a small but excellent and highly informative book, still referenced today (Deubner, 1938). Extensive publications of the sanctuary were interrupted by World War II, but excavations resumed sometime afterward, in 1958, under the direction of Erich Boehringer and Oskar Ziegenhaus, with the pottery largely examined by Gioia De Luca (Ziegenhaus & De Luca, 1968, pp. 1–5). Due to the excavated strata and her careful observations, the pottery from the Asklepieion served for a long time as a reference point for Hellenistic and Roman pottery in general; only in recent years has her dating of the material been subjected to further fine-tuning (discussed in Keweloh-Kaletta, in press, 3.2.1, and the tables in pp. 183–189). For the excavations of the Asklepieion, the pottery was principally used to determine the chronology of the architecture, which was the main focus. The excavators identified 18 different construction phases that range from the Archaic period to early imperial times. As they note, this is not a closed sequence but is based on walls marked by destruction layers (Ziegenhaus & De Luca, 1968 in AvP XI.1, also Taf. 84).
As the physical form of the sanctuary serves both as the backbone of the excavations and also framed the space of human activity and ritual practices, it is worth a brief discussion, with a few comments on the material culture. The 18 phases of construction (Bauphasen) may be largely clustered together in five global periods (Figure 6, based on AvP XI.1 Taf. 84). The first three Bauphasen comprise the longest period of the shrine, continuing into the early Hellenistic era. The earliest traces of human occupation in the area date from the Early Bronze Age (third millennium BC) and stem from the area west of the later sanctuary (the Olivenhain, published AvP XI.2; see the orange area in Figure 6). Later ceramic material consists largely of Aeolian Gray Ware (also Keweloh-Kaletta, in press, 3.2.1). Otherwise, the earliest finds related to cult appear to center on the rocky outcrop, with a spring at the northern end of the rock elevation. Known as the Felsbarre in the archaeological reports, this elevation appears to have been worked on its sides to form a kind of plateau, prior to the placement of temples on its surface. The recipients of initial cult practices here have been suggested as the nymphs (in the fertile, spring-rich basin) or possibly Apollo. Early evidence of this is hardly certain, although their cults are attested in later periods. In its early days, the cult for Asklepios appears to have been a private initiative, but one that would soon become state-controlled under the Attalids (Habicht in IvP III, pp. 1–18; also Riethmüller, 2005, Vol I, pp. 230–240).
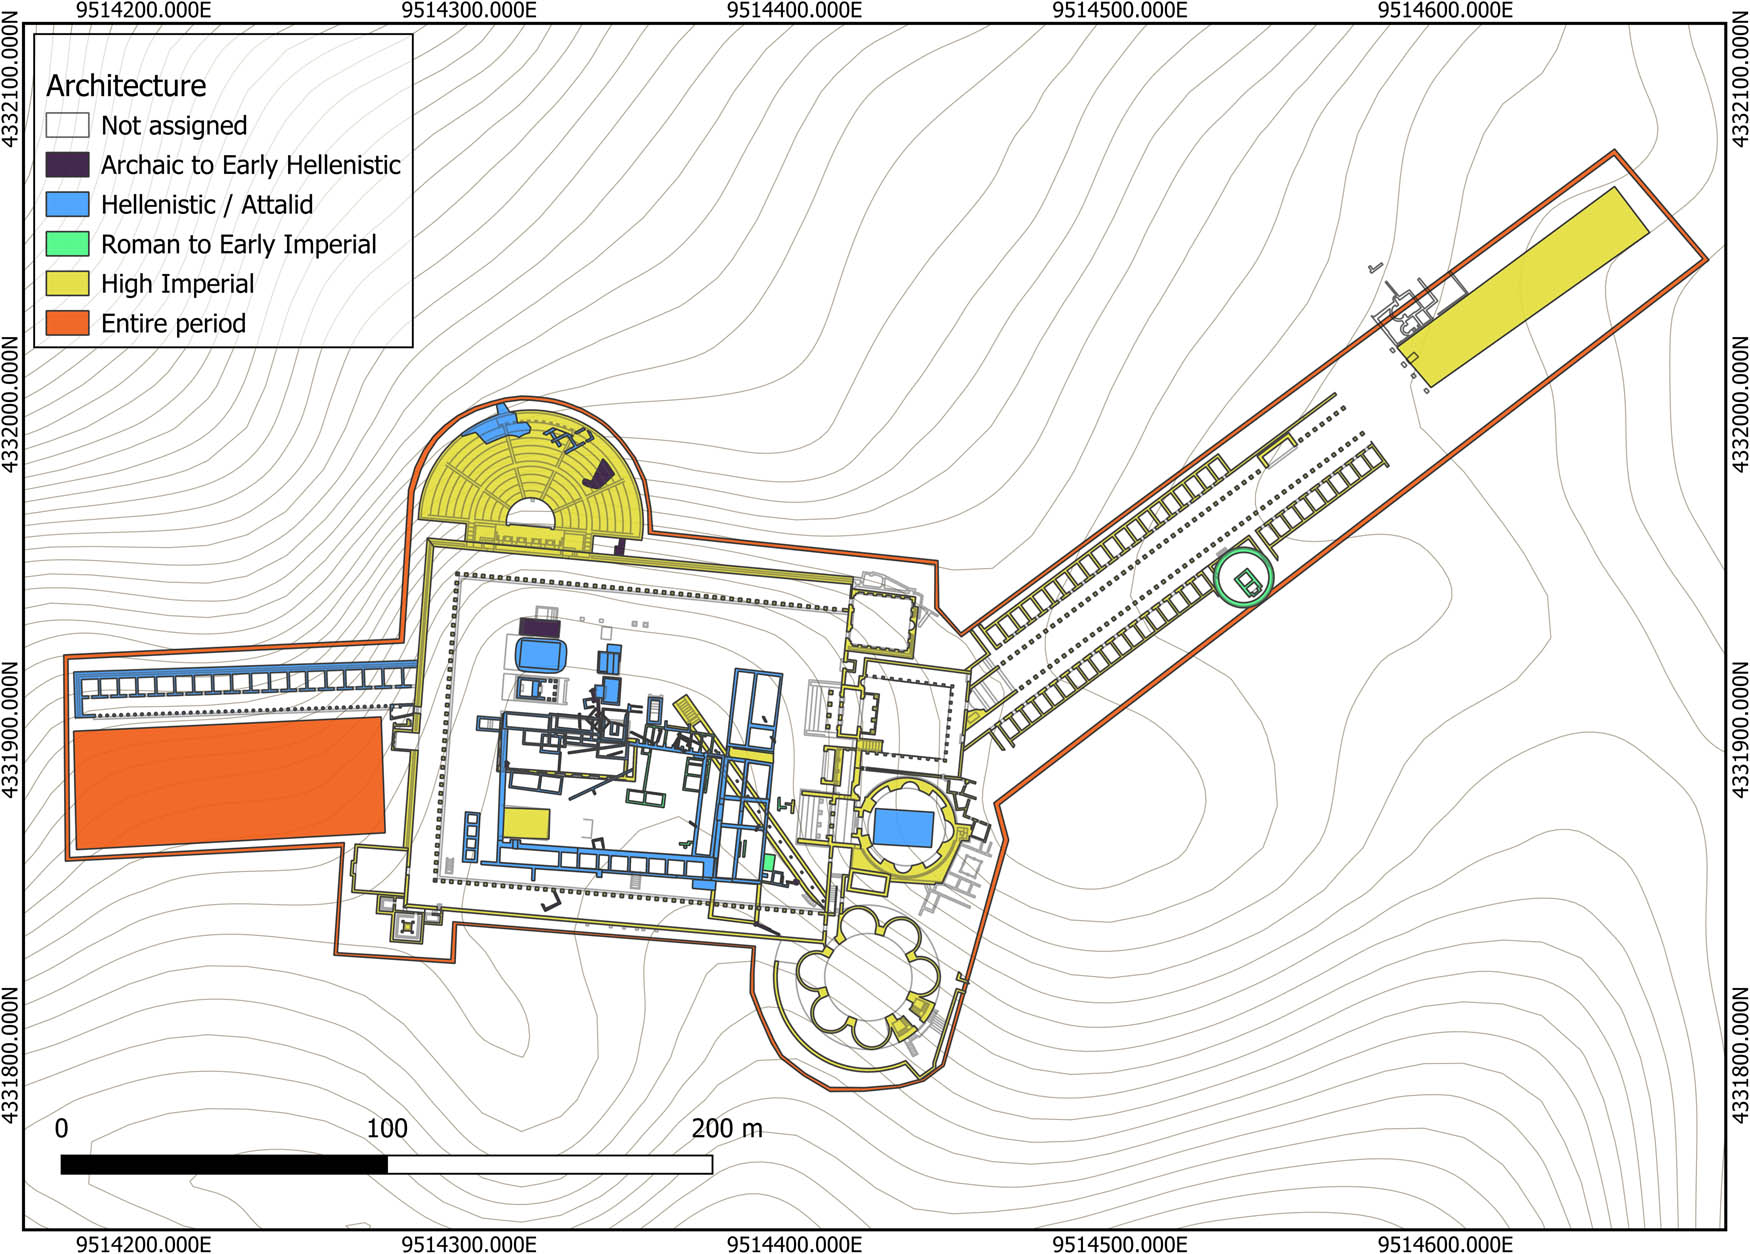
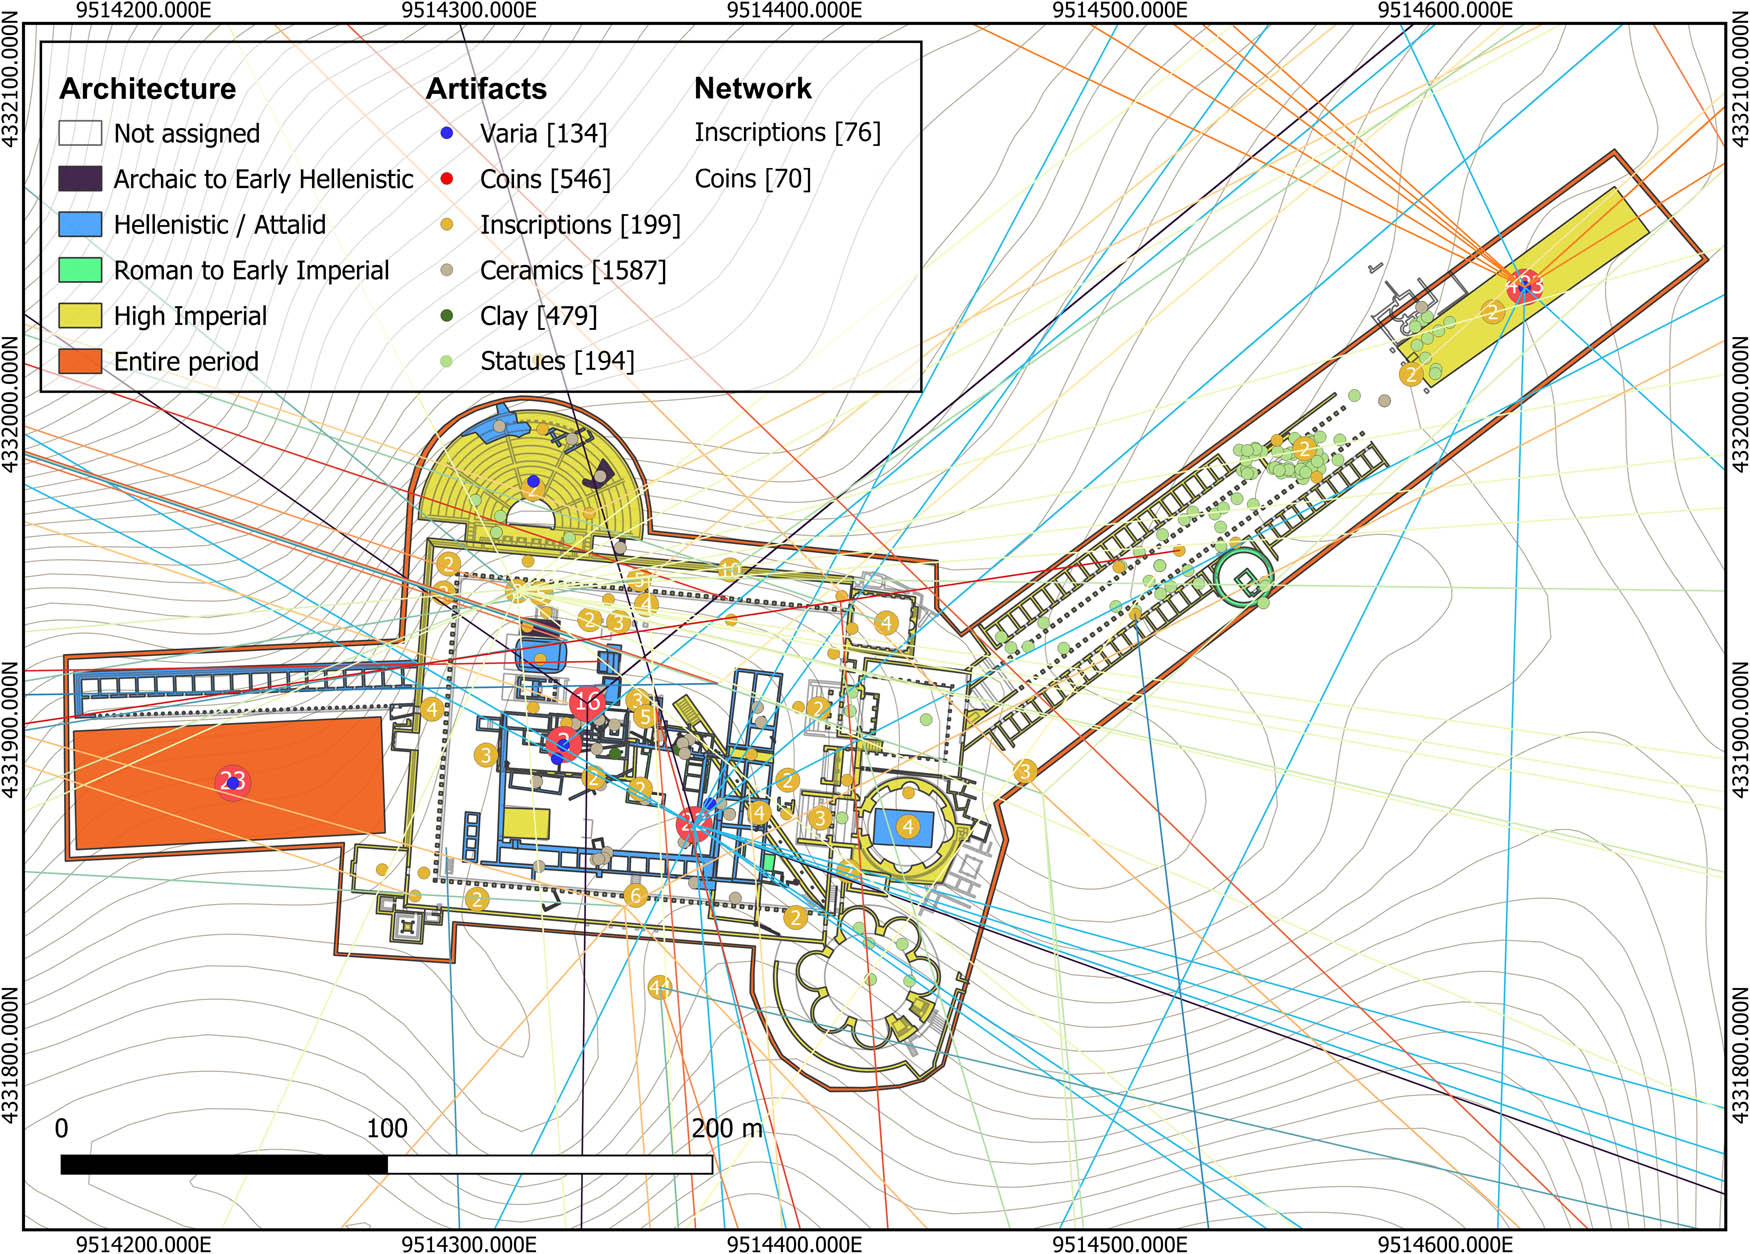
The QGIS environment with the layers related to architecture divided into global historical phases. Purple: Archaic to Early Hellenistic; blue: Hellenistic/Attalid; green: Roman to Early Imperial period; yellow: High Imperial and Orange summary features that cover the entire period, the outline of is the entire “Asklepieion” as an entity, and the square to the West is a summary feature for the general area described as “Olivehain” (image: A. Katevaini; the period division largely conforms with AvP XI.1, Taf. 84).
Tangible evidence for cult practices related to Asklepios does not appear until the third century BC, although the cult may well predate this. This second period (Bauphasen 4–8, Figure 6, also in dark purple), covering the period 275–240 BC, focuses on the heart of the healing sanctuary, the incubation structure, and where pilgrims underwent sleep rituals, receiving instructions in their dreams on what to do to be healed. The incubation complex is subsequently expanded several times, pointing to its central role in the cult throughout the life of the Asklepieion. By the mid-third century BC, the sanctuary itself was extended to the east and was further embellished with two temples on the Felsbarre, one of which, according to the sources, held a cult image of Asklepios sculpted by Phyromachos of Athens (Polyb. 32.15.3–4 and Diod. Sic. 31.35). Destruction marks the end of this period.
The third major period (Bauphasen 9–12) follows in the second century (c. 200–125 BC, Figure 6, in blue) and is especially related to the Attalid kings (who reigned from 282 to 133 BC), and the long west stoa specifically bearing roof tiles stamped with BAΣIΛEYΣ (“king”) is generally connected with Eumenes II (r. 197–159 BC). This period also comprises the formal arrangement of enclosed space, marked by the incubation area in the northwest, and stoa architecture to the east and south, with the long royal stoa providing an entry point into the sanctuary behind the temple. To the east, the shrine was connected to Pergamon by a sacred road that crossed a funerary zone (several sculptures from which were found below the later pavement, discussed in the next section). Regarding material culture, some coins and most of the tableware and terracottas found from the site are dated to either this period or the preceding one.
The sequence of construction phases stops for over a century. Meanwhile, the last Attalid king (Attalos III, r. 138–129) had bequeathed his kingdom to Rome. Roman rule was initially met with resistance by the usurper Aristonikos, defeated in 129 BC. From this time on the Attalid kingdom, which covered much of what is now western Turkey, became the Roman province of Asia, with a steady influx of Romans. Another widespread revolt against Rome was instigated in the 80s BC across Asia and Greece by Mithridates VI of Pontos. Appian (Mithr. 4.23) tells us that during the Mithridatic wars, Roman residents, in fear for their lives, fled to the Asklepieion for refuge, where they were slaughtered by their neighbors. After this massacre, the Asklepieion unsurprisingly lost the privileged status of asylum, but this was regained at the initiative of some individuals from Pergamon (IvP III 1), quickly seeking to restore relations with Rome.
Construction activity resumed in the first century AD (Figure 6, in green) and includes a heroon (the round structure near the sacred road) and a third temple in the southwest corner, as well as a few other structures. Most of the epigraphic data from the shrine, particularly the honorific decrees, date from the imperial period. The fifth and final period (Figure 6, in yellow) is marked by the great reconstructions of the later first and second centuries AD, largely associated with the reign of Hadrian, who visited Pergamon (an alternative dating sequence is given in Strocka (2012), who ascribes more implicates Domitian as much as Hadrian). The sacred road was reconfigured with a colonnaded street leading down to the new propylaia, and into the shrine, now roughly four times larger than the previous. The complex of temples, altars, and incubation area to the west remained the old cultic center. Yet, the rest of the shrine underwent massive earthworks, with the terrace expanded, carved out of the hillside to make way for the North Stoa (Figures 6 and 7), with the “Sacred Theater” and library. To the south, the old Hellenistic shrine was covered and the terrace was built up and expanded with a large stoa complex with cult rooms and even latrines. The eastern façade mirrors Rome (Melfi, 2016), especially with the façade of the propylaia and the temple of Zeus Asklepios, modeled on the Pantheon in Rome. The rotunda in the southeast corner and the cryptoporticus leading to it, the very first targets of excavation, were added somewhat later in the second century.
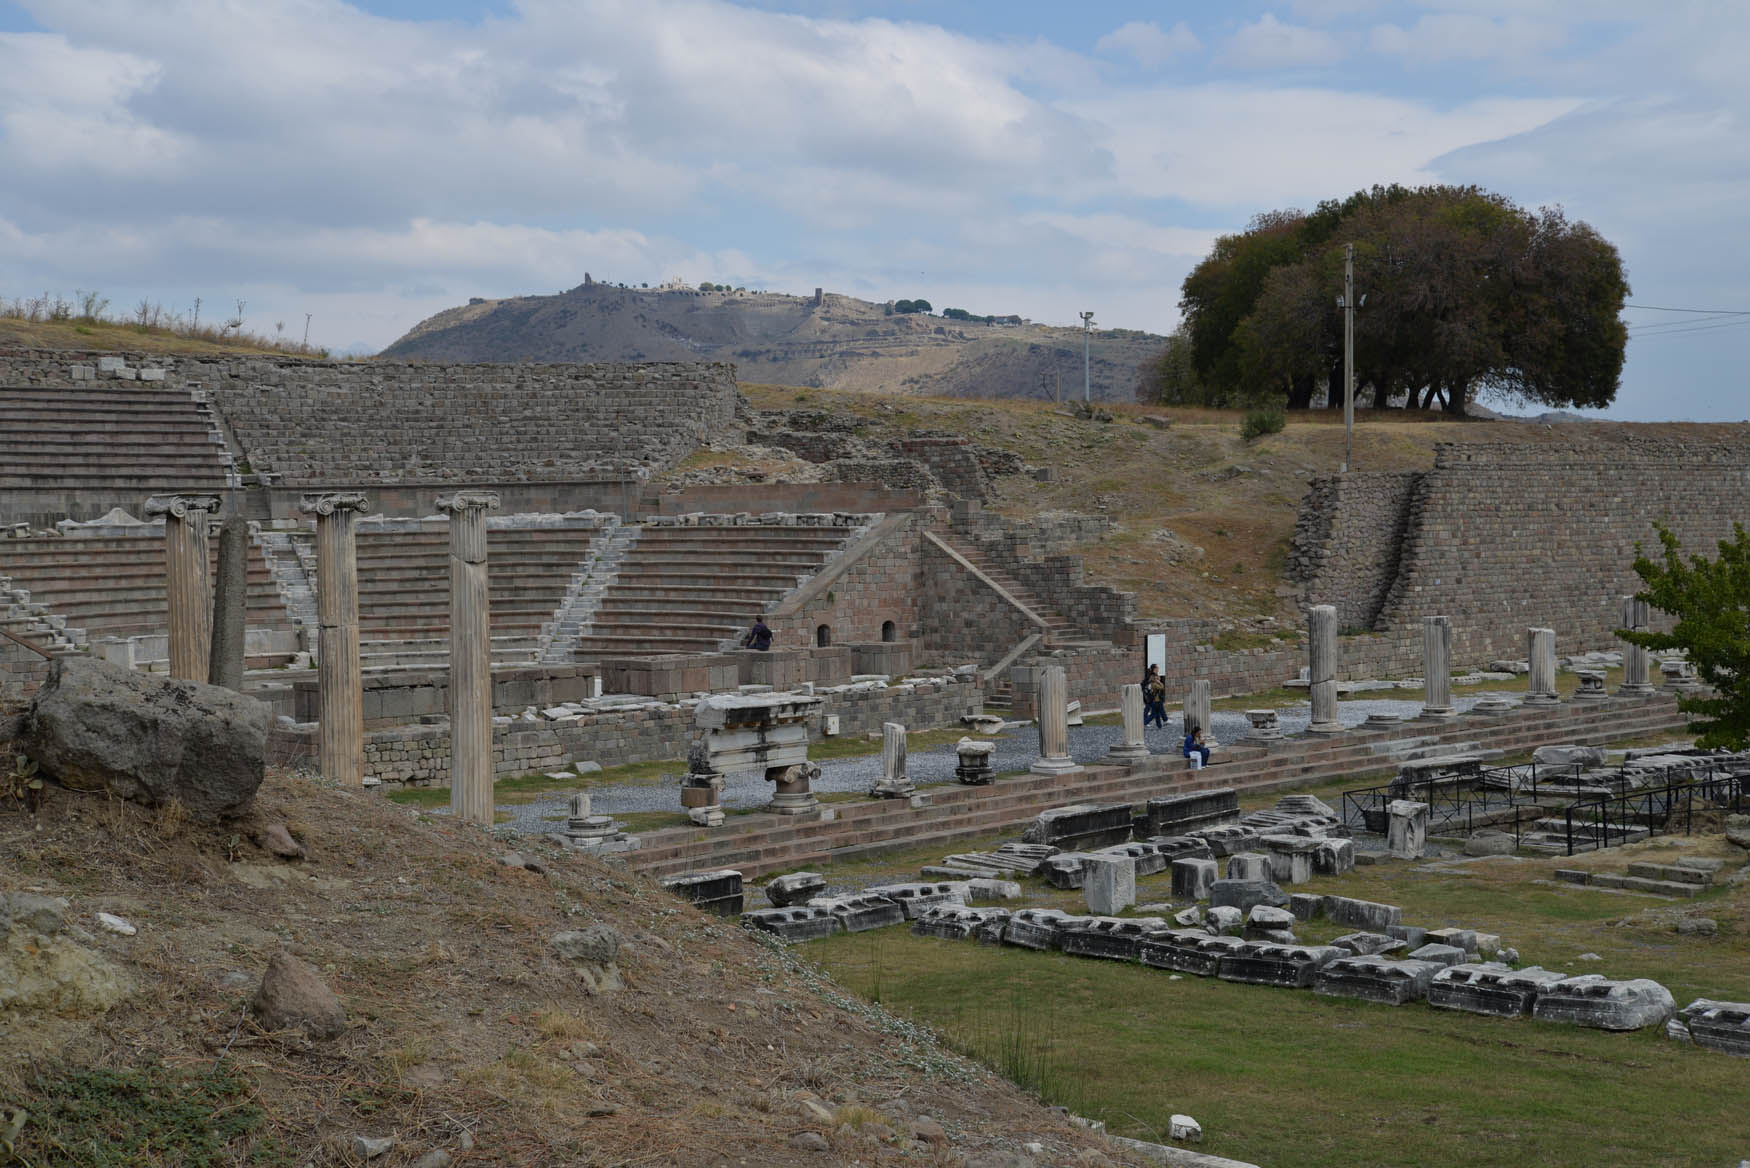
The cavea of the “Sacred Theater” and North Stoa, both of which abut the hillside. Pergamon is visible in the background (image: C. G. Williamson).
This fifth phase, the High Imperial era (Figure 6, in yellow), is indeed a spectacular era, in which the healing center was turned into a showcase of architecture and the prime civic shrine of Pergamon, at the hands of the local elite. With their close ties to Rome, they turned the shrine into an intimate space of connection with the center of the empire. This is also the era when Aelius Aristides wrote his extensive diaries and speeches, mentioning the Asklepieion. Not without reason, this is where the focus of most scholarly narratives of the shrine start and end. Yet, the preceding four to five centuries of intensive use, when the cult place moved from a private enterprise to one that rapidly gained attention from the Attalids, and its role as contested space, but especially its ongoing use as a center of healing for a large cross-section of society, has long been understudied. On the other end, scholars tend to stop at the high imperial period, even though the Late Roman to Byzantine period comprises an even larger assemblage of tableware ceramics and oil lamps as well as numerous coins, indicating a long and ongoing use of the area.
As with the early excavations, a central aim of the deep map is to bring especially the underappreciated aspects to light, showing the rich complexity of the shrine as a kaleidoscope of material and sources that were amassed over centuries of human use.
5 Deep Mapping the Asklepieion – Structuring the Data
Our deep map consists of archaeological, historical, and literary sources, and their derived networks (as virtual data), that concern the sanctuary of Asklepieion in Pergamon. At present, this comprises 3,176 objects (Figure 8). All of these are extracted from publications that are readily available; yet, these are generally used only by specialists in the field. One of our aims with the deep map is to open up the data to a wider audience and thereby blur the disciplinary divides, encouraging a more holistic approach to the sanctuary. As discussed in Section 3 (Figure 3), this entails a close reading of these specialist publications to extract the spatial and temporal information as well as the descriptive content of the object concerned. Through this, we can structure the sources as data for GIS, useable in cross-type queries. This led to discussions on how to best incorporate different divisions of time simultaneously. Also, we needed to manage ways of filtering through features that remain active across different phases of time (e.g., altar, temple), or multiple phases of activity within the same structure (incubation house). An extra challenge was finding a way to make these divisions comprehensible to a public audience.
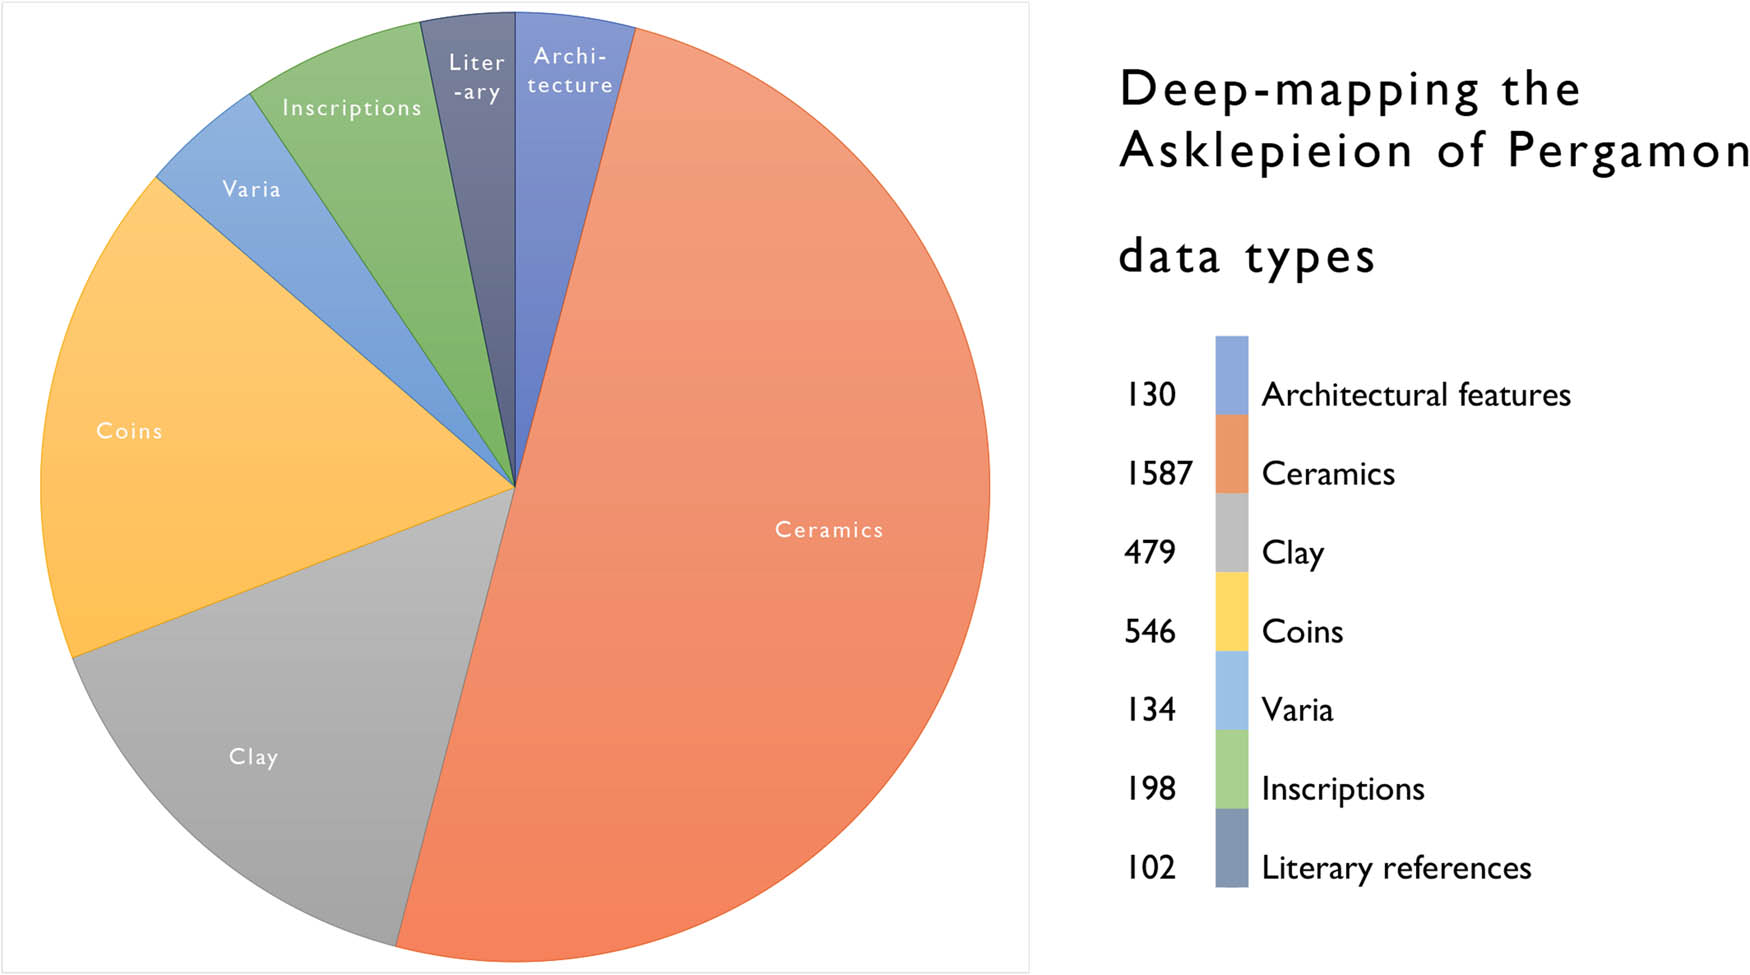
A proportional breakdown of the published data objects (3176 in total) included the deep map of the Asklepieion (image: C. G. Williamson).
Before presenting the decisions we made, it is essential to discuss the structure and origin of this data. The structure of the archaeological recording and data collection processes affects the temporal and spatial attributes recorded. The site was discovered in 1871, with some structures from the imperial era still partially standing. The later excavations of the twentieth century explored the areas of the court, theater, sacred road, and the area west of the sanctuary. Little information was published regarding the recording and excavation methodology, so we do not know exactly how data were collected in the field. The excavation was published in five volumes of the Altertümer von Pergamon XI, which focused on different areas of the sanctuary. The first publication presents the results of the excavation of the inner sanctuary. The volume is divided based on case-specific architectural phases and the archaeological data are presented based on the building and the architectural phase (Ziegenhaus & de Luca, 1968). The second volume presents the phases in the northern part of the sanctuary, and the finds associated with the trenches under the theater and the area to the west (the long stoa and the Olivenhain). The finds from the theater area are organized per trench and then according to typology. The typology structure is adopted in the west area (Ziegenhaus & de Luca, 1975). The third volume is focused on the Roman architecture on the east side of the sanctuary, as well as the sculptures with their location in association with the architectural features (Ziegenhaus, 1981). The fourth volume discusses the results of the excavation of the area further east of the sanctuary, especially the Via Tecta (the sacred road, which was vaulted). The finds are organized typologically (de Luca, 1984). The final publication is mainly focused on the architectural features of the Roman imperial stoai, their chambers (e.g., “library,” latrines, exedra), and their attributes (Hoffmann & de Luca, 2011). As a result, the spatial and temporal attributes of all the excavated archaeological data are organized according to the architecture, although it is recognized that the temporal horizon of the finds may extend beyond that of the architectural feature in question (de Luca, in Ziegenhaus & de Luca, 1968, pp. 93–94).
Our first step was to create a set of data tables, starting with the architecture and material published in the Altertümer von Pergamon XI. Das Asklepieion, volumes 1–5 (AvP), and Altertümer von Pergamon VIII, comprising the Inschriften von Pergamon (IvP) especially volume 3 which gives a full discussion of most of the inscriptions from the Asklepieion; other publications of more recently discovered inscriptions of relevance are also included (Meier, 2009). The literary sources focus at present on the spatial data in Aelius Aristides, especially the Hieroi Logoi (Sacred Tales) (Behr, 1968, 1981), largely written while he was in Pergamon in the mid-second century AD. Through a close reading of these published sources, we collected the kind of descriptive and narrative information as well as the spatial and temporal attributes that we deemed necessary for the deep map.
The sources were thus transformed into tables: architecture, ceramics, clay, varia, coins, sculpture, inscriptions, and literary sources. Figure 9 gives a sample of the data in the table for ceramics. The structure of this table is shown in Figure 10 and was also applied to the tables of clay and varia due to their similar attributes. The other tables are more tailored to the specific characteristics of the objects that they represent.
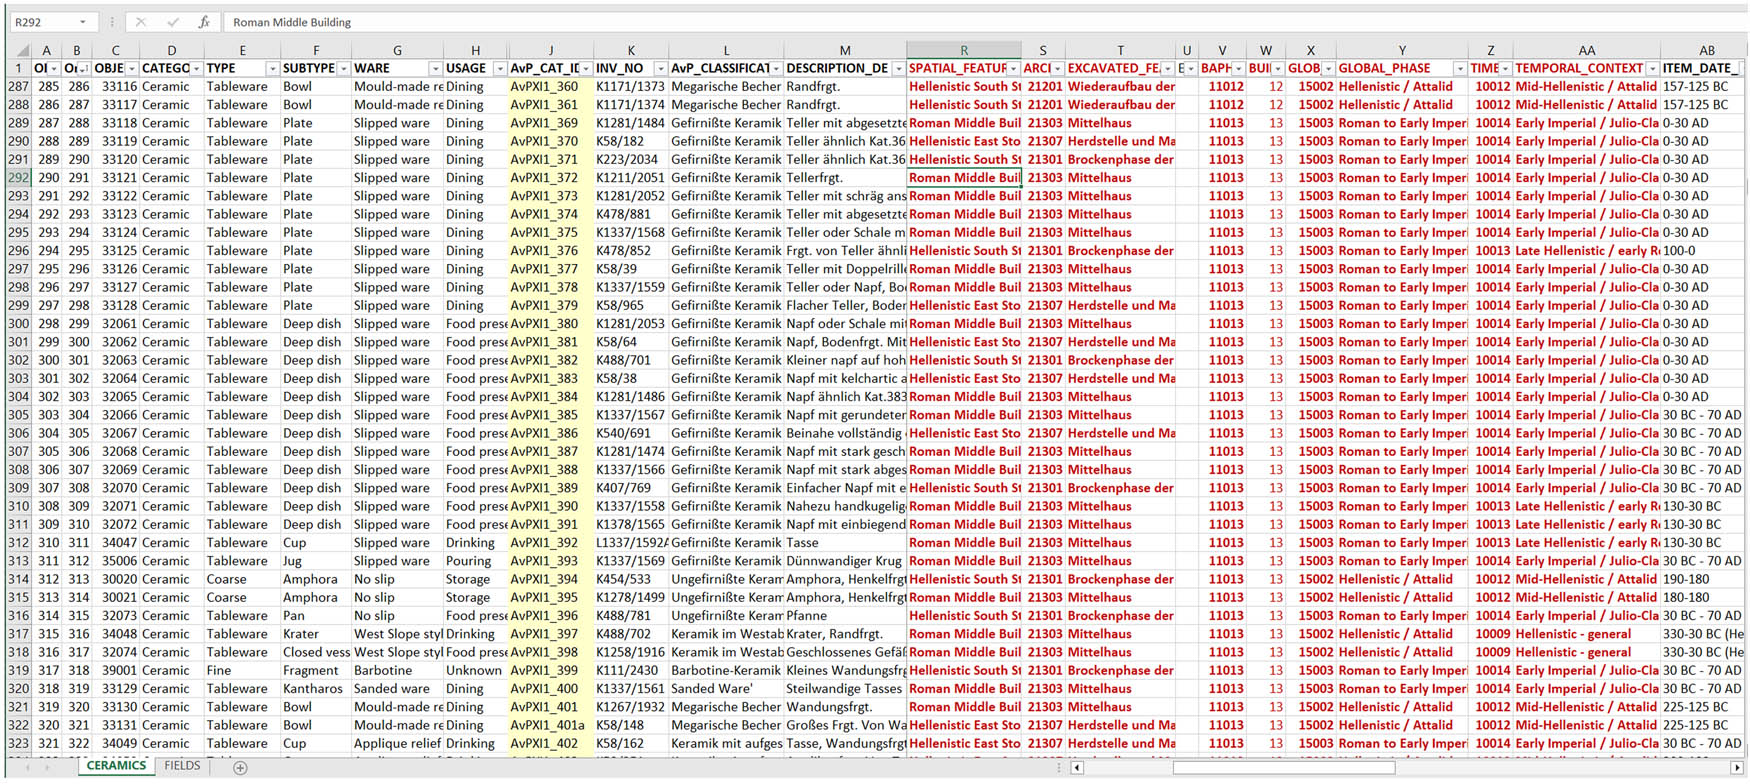
Sample of the data table of the ceramics, indicating the kind of data that is incorporated in the deep map (image: authors).
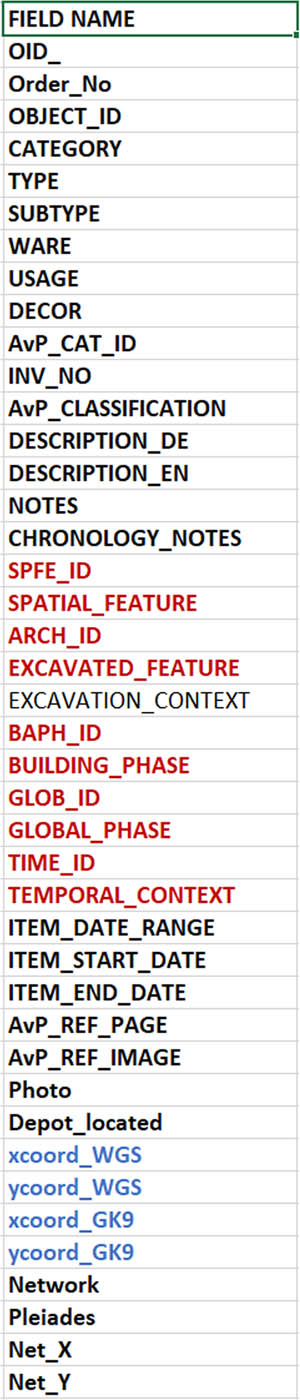
Data structure of the ceramics – a similar structure is applied to the clay and varia tables (image: authors).
A vital feature of the deep map is the capacity to search across the data types, looking for relationships and parallel narratives. In a regular data environment, this could be facilitated through a relational database. However, this structure would negatively impact the performance of GIS. Instead, we opted for flat files that include categories of time and space that are common to all the tables. Applying uniform values in these categories allows for cross-table queries.[3] The fields and data shown in red in Figures 9 and 10 contain these common reference attributes that show a relationship to a specific spatial feature or chronological period. For example, while each object is assigned a unique date range, at the same time it also falls into broader, historically or archaeologically recognized chronological periods that are worth investigating. Three tables at different temporal resolutions were created (Figure 11): the “Global Phase” represents broad divisions of time (e.g., applied to Figure 6); the “Temporal Phase,” is at a higher resolution, with historical periods; while the “Building Phase” indicates the 18 archaeological contexts of construction (Bauphasen) identified by the excavators, to which we added an initial phase for the preclassical era and another for “unknown.” Regarding their spatial attributes, all of the objects are geo-referenced with coordinates (Figure 10, fields in blue – the determination of coordinates is discussed below), and they are linked to specific, excavated architectural features, following the publication. Yet, at the same time, objects may also be more generally associated with certain areas of meaning. We assimilated such areas in a table called “Spatial Features,” as shown in Figure 12. This allows for zone-oriented queries that may include summarized architectural features on site (e.g., “the South Temple” rather than South Temple 1 or South Temple 2), as well as non-architectural areas (e.g., the rock ridge, or Felsbarre, that served as a platform for the temples). Yet, another degree of spatial interaction is with features outside the Asklepieion, both those in Pergamon and in the region (Figure 12, third column). These common spatial and temporal attributes with uniform values allow for broad queries that can show, for example, everything on the map, or a selection linked to a specific place or time – for example, all of the objects spatially related to the “incubation complex,” or all of the objects related to Building Phase 9.
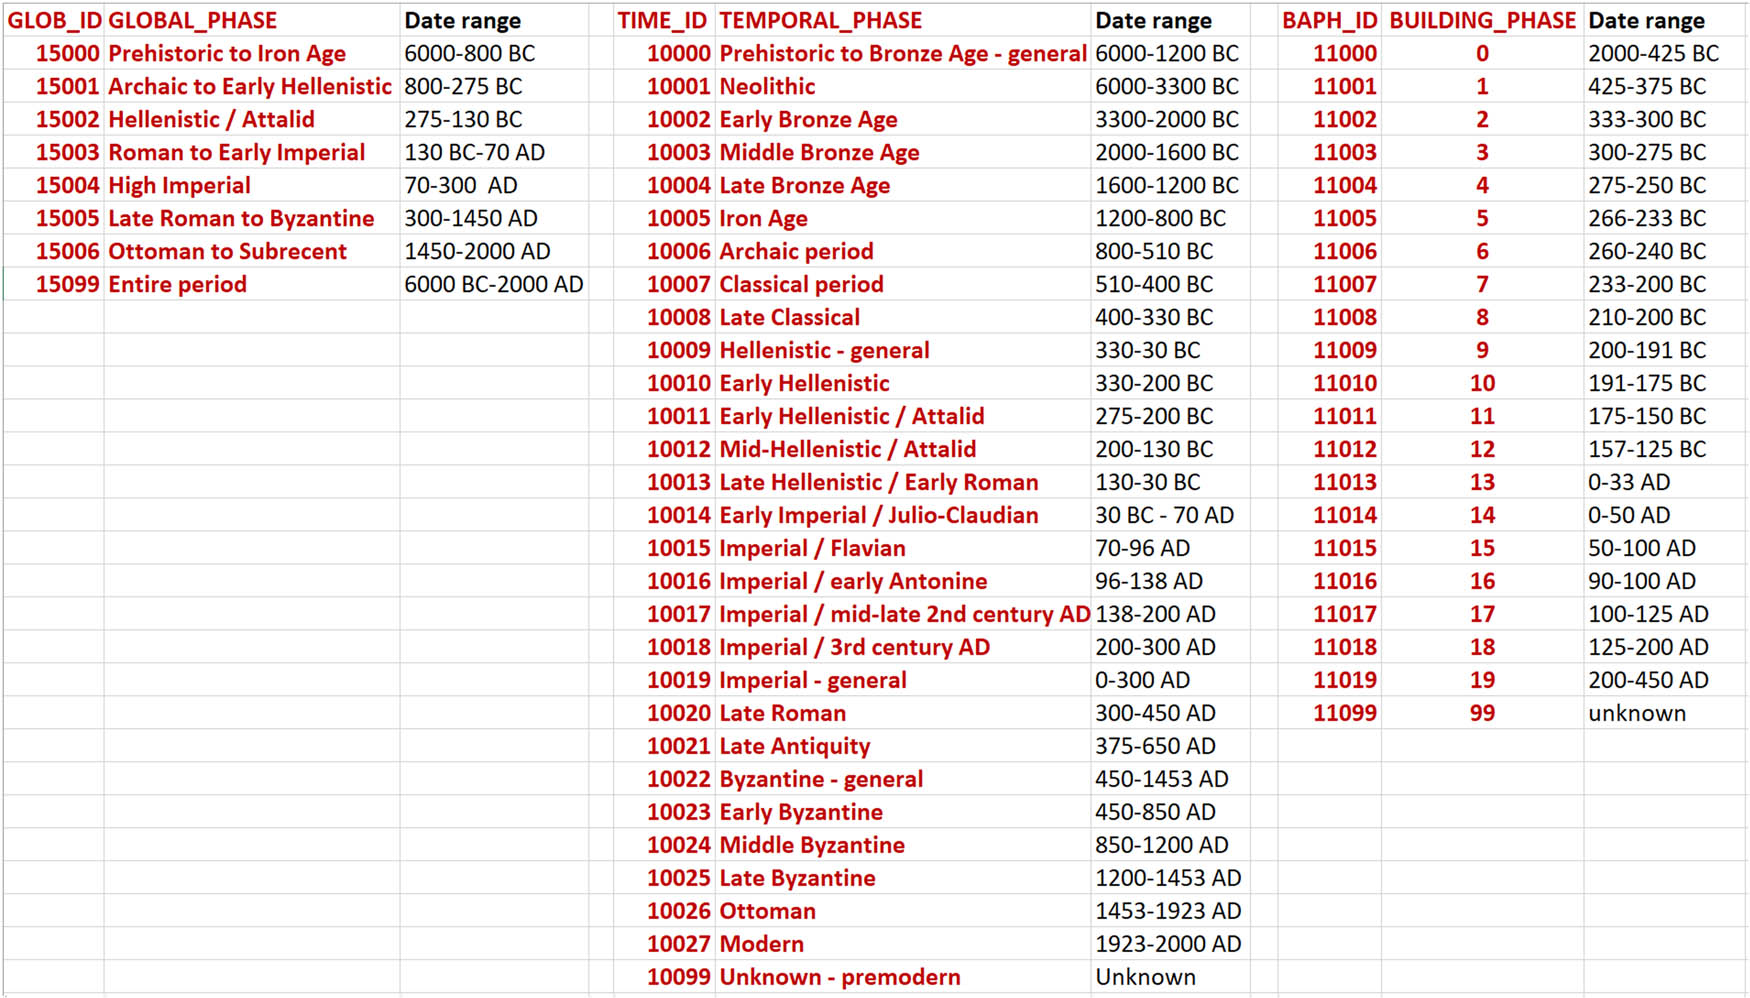
The temporal values commonly applied across the data tables (image: authors).
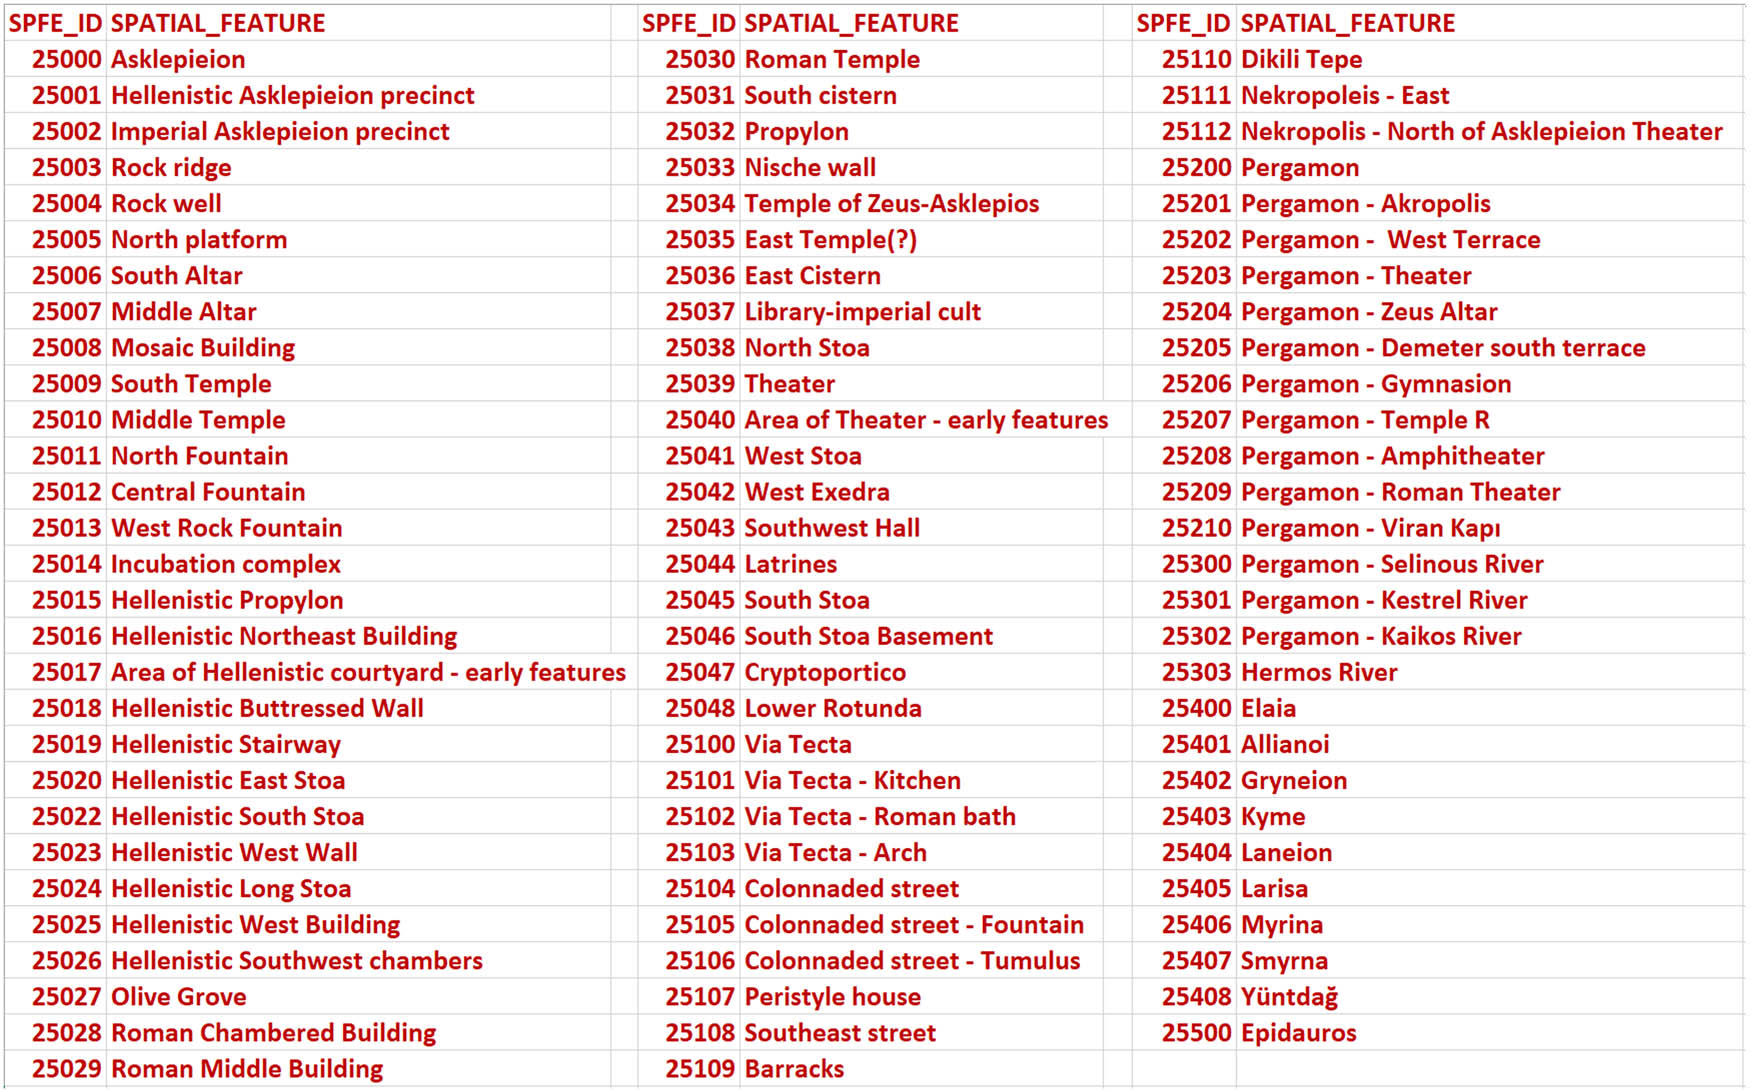
The spatial values commonly applied across the data tables (image: authors).
The data tables, and the “Spatial Features” table, were then converted into vector layers (shapefiles) for GIS, where queries can be run to allow for spatial and temporal analysis across the different data types. Each object type, however, presented different spatial and temporal challenges in structuring the data to make the map accessible and meaningful to both academic and public audiences. In the rest of this part, we discuss some of the challenges that were specific to data types.
5.1 Architecture
Architectural features were the focal point of both the excavations and the publication, with the material culture being brought into a relationship with the individual phases of certain structures. The architectural features of all the phases are drawn as polygon shapefiles in one summary layer (e.g., shown in Figure 6). The layer is created from two sources. The architecture of the imperial phase, some of which was still standing at the beginning of the excavation, is recorded in the iDAI geoserver, where they can be accessed and downloaded.[4] The second source is the plans in the AvP XI publications, which were imported and georeferenced based on the iDAI layer. The attribute table includes the name of the features, chronological descriptions (including the common tables mentioned above), and the unique project identification for all of the features that were excavated, named in German (conforming to the publication), but also translated in English.
Architectural features are a significant frame of human activity, but not the only one. In micro-analyzing the architectural features, we realized that spatial relations also occur over time and that it is helpful to link objects not only to specific structures (e.g., South Temple 2) but also to areas, or zones of meaning. This led to the creation of the abstract layer, across the data tables, called “spatial features,” discussed above.
The longevity, chronology, sequence, and characteristics of structures as described in the excavation reports were transferred to the architecture table for the deep map. Yet, this was not unproblematic. The lifespan of most of the individual structures, particularly from the pre-imperial phase, has been a challenge to represent. A close reading of the text allowed us to identify destruction phases, or phases when new walls ran over older ones. In the end, we built a tentative sequence for each structure across the eighteen phases, which will allow us to better understand the development of the sanctuary throughout its own lifespan. This is largely built into the desktop environment but is not yet integrated into the data for the online deep map (askperg.org) due to the complexity of the queries, but it is planned for the near future.
However, it must also be noted that the timeframes of these features are not absolute, and alternative chronologies with plausible interpretations have been suggested for some of the structures, especially from the high imperial era (Strocka, 2012). For this project, we adhere in the first place to the chronologies of the publications of the Altertümer von Pergamon XI, since these provide a common point of reference among scholars. In the future, however, we plan to add fields to the table that can accommodate alternative dates since this would allow for a deeper level of comparative analyses, providing different hypothetical scenarios.
5.2 Excavation of Material Culture
Material culture comprises a further degree of abstraction, with a wide variety of objects that directly indicate the function of the site and the experiences of those who frequented. Such objects are subsequently reduced to simple “dots on the map,” situated between and among the architectural features. The clue is to find a way to preserve their informative value for the narratives. The material culture of the Asklepieion is compiled from the five volumes of the AvP XI and is categorized according to material and type: ceramics; clay (e.g., terracottas, lamps); coins; statues; and “varia,” clusters of objects made from other materials (metal, stone, glass, bone, etc.). This division, and further sub-categories of type, follows the excavation reports as far as possible, with the exception of the category of “varia,” since this is a grouping of smaller distinct categories that were too few in number to warrant a table of their own; this data table includes a filtering field for the material. As mentioned above, the ceramics, clay, and “varia” tables otherwise largely follow a similar structure. These data were exported to a point shapefile in our GIS environment.
The spatiality of the objects is not straightforward. The excavation reports broadly associate the finds with the architectural features from the different excavated strata and building phases, rarely moving beyond this first level of spatial information. An exception is formed by the statues found during the excavations of the colonnaded street (Hallenstrasse). This was excavated in quadrants that were shown on plans published in the reports (AvP XI.4, 70). While exact locations were given for only a few statues (AvP XI.4, Taf. 69, near the fountain, below the paving), the locations of the rest are recovered from the descriptions that include the quadrant of the findspot. By georeferencing these plans, we were able to map out statues with a reasonable degree of accuracy (Figures 13 and 14). Unfortunately, the statues were not provided with a chronology and so we have had to postpone their inclusion in the online deep map until we find a solution. By contrast, the other object types are generally given some chronological framework, but the spatial indicators are vague, other than the architectural layer with which they were associated; a few cases may include descriptors such as “close to a wall” or “in the center of the room,” but in most instances, this level of detail is omitted. With the available descriptive spatial information, we could only identify general points on the architectural plans of the site. However, without any additional media, especially an actual plan of the excavation trenches, these points could not be plotted with any high degree of resolution.
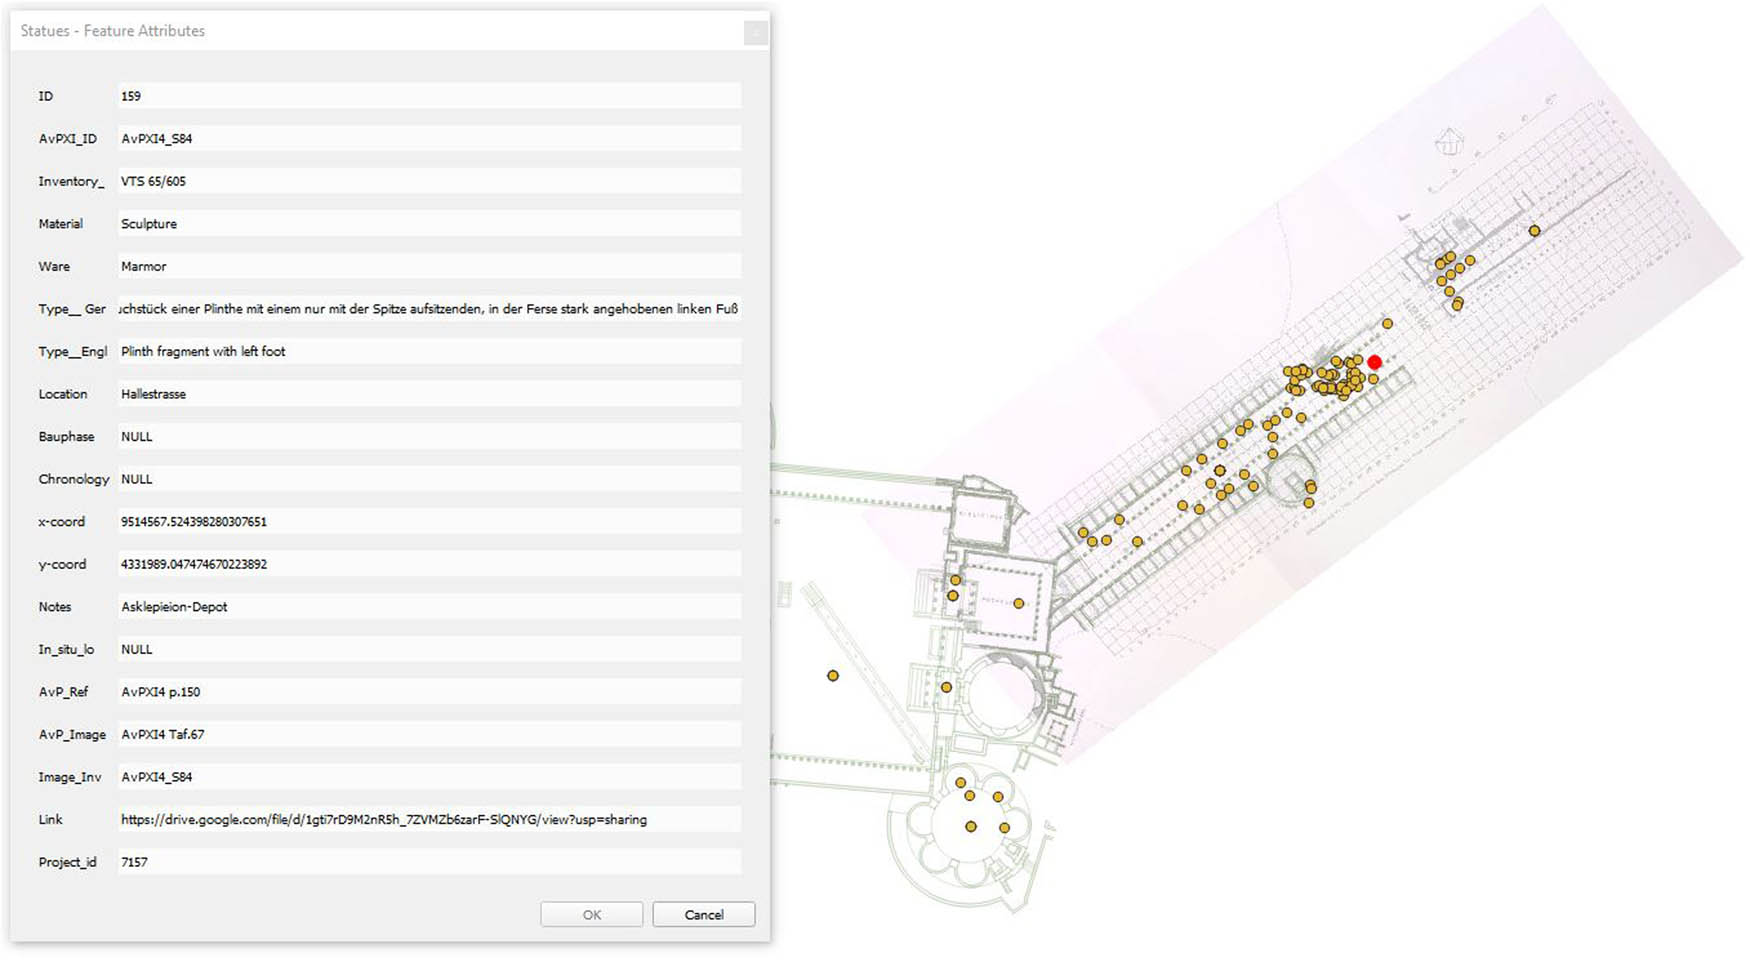
Screenshot of the QGIS environment with the statues layers (points and georeferenced archaeological plan), including the feature attribute table of one of the entries (project ID 7157) (image: A. Katevaini).
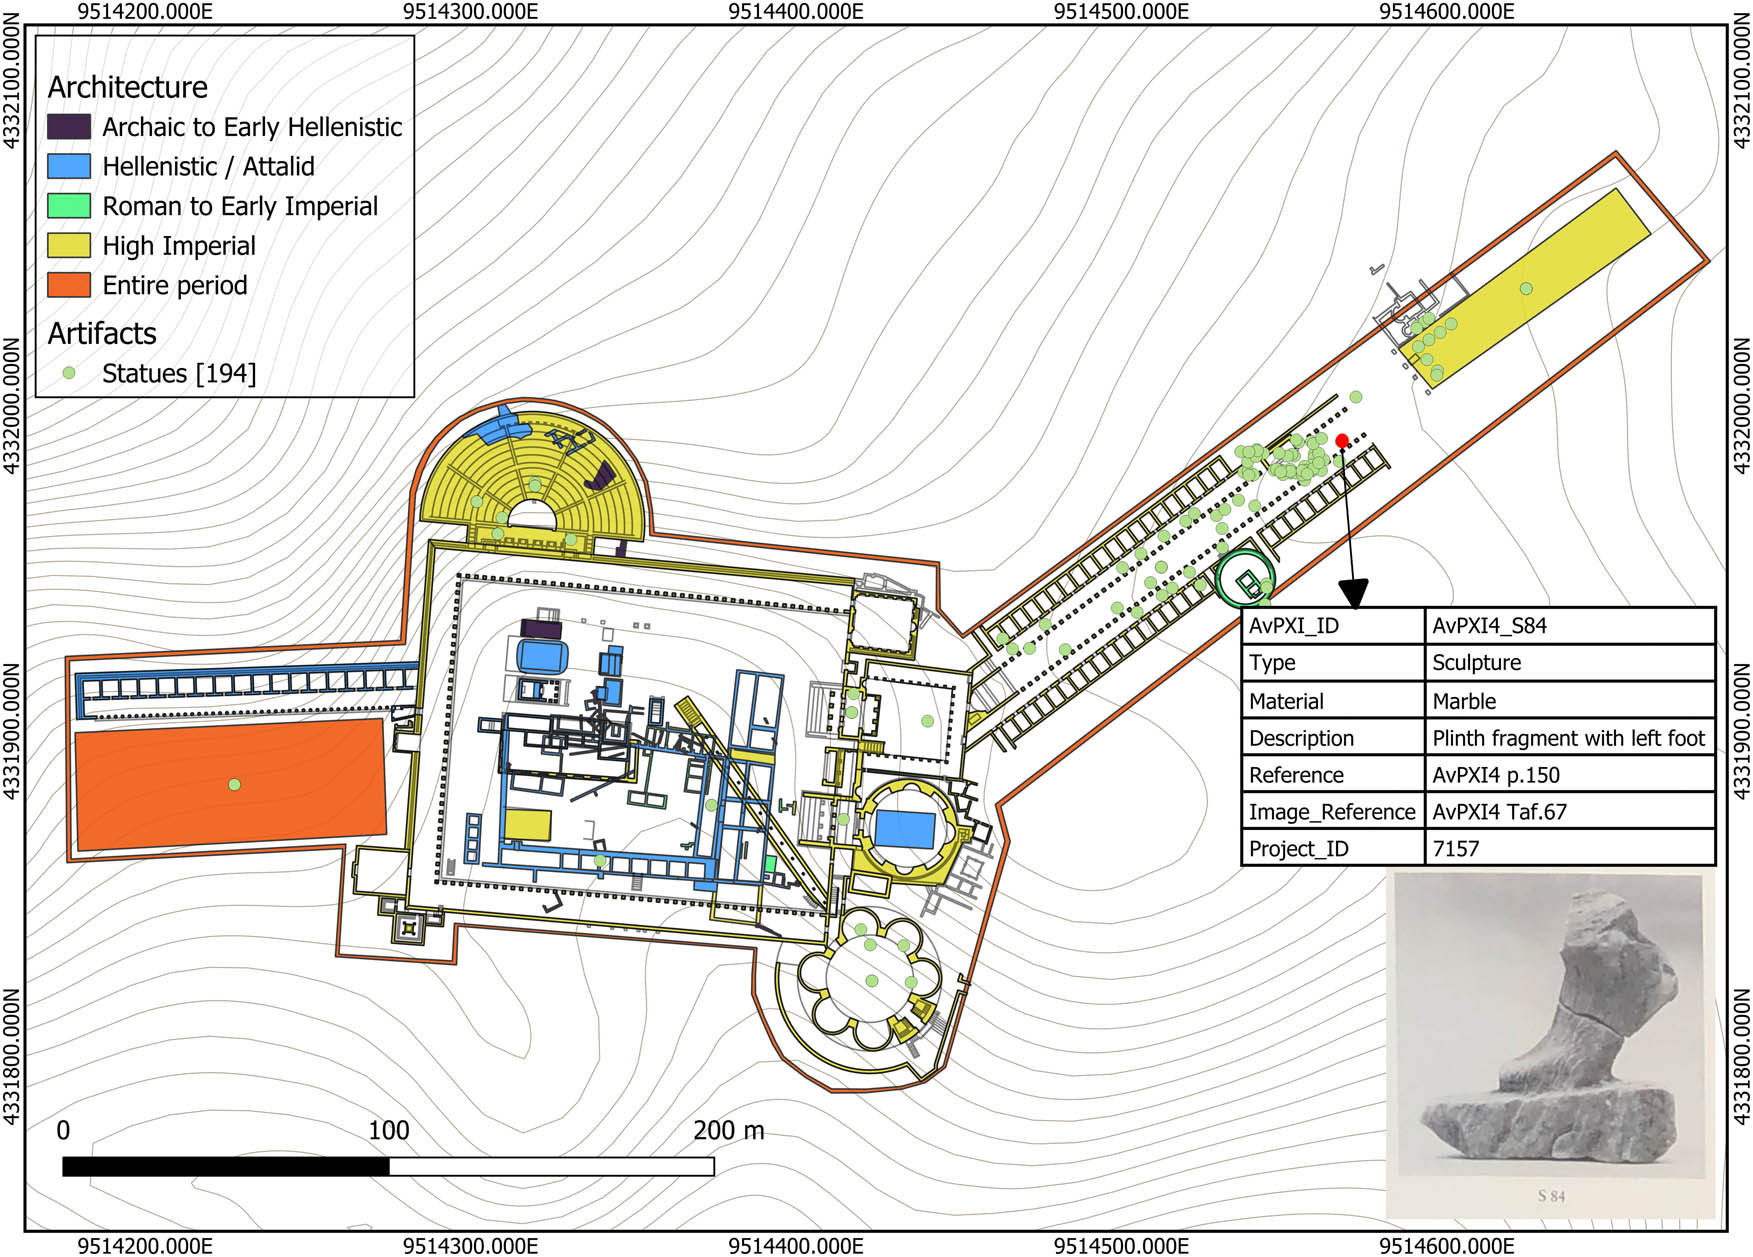
The statues layer in the QGIS environment, with the same entry highlighted in red (project ID 7157) (image: A. Katevaini).
This led to the problem of how to systematically represent the fuzzy spatiality of the objects from the Asklepieion in GIS, which employs vector files (shapefiles) based on geocoordinates that in themselves are highly accurate.[5] Additionally, we realized that while generating random points within or around a building would allow us to better visualize the different features, it would also create a false sense of accuracy. Our solution was to generate a centroid at the center of the architectural features and then “stack” all the finds on this point. This way we felt that we conceptualized those points through a schematic method that transparently shows the bias of the excavation strategy, in relating mobile objects to static buildings (Harman & Witmore, 2023). This symbology decision meant that in large-scale excavations such as the colonnaded street (Hallenstrasse) and the Via Tecta (the covered sacred road), we had summary points sometimes containing over 600 items; see for example the 483 coins found in the Via Tecta (Figure 15).[6] Piling all the data on top of each other certainly causes problems with visualizing different groups at the same time, since only the symbology of the top layer is shown (Figure 18). To overcome this, we utilized heatmaps and cluster symbology as well as called-out legends. Although heatmaps are useful as a research tool, we concluded that these were not legible enough for the public outreach of this project. No permanent solution has been reached yet.
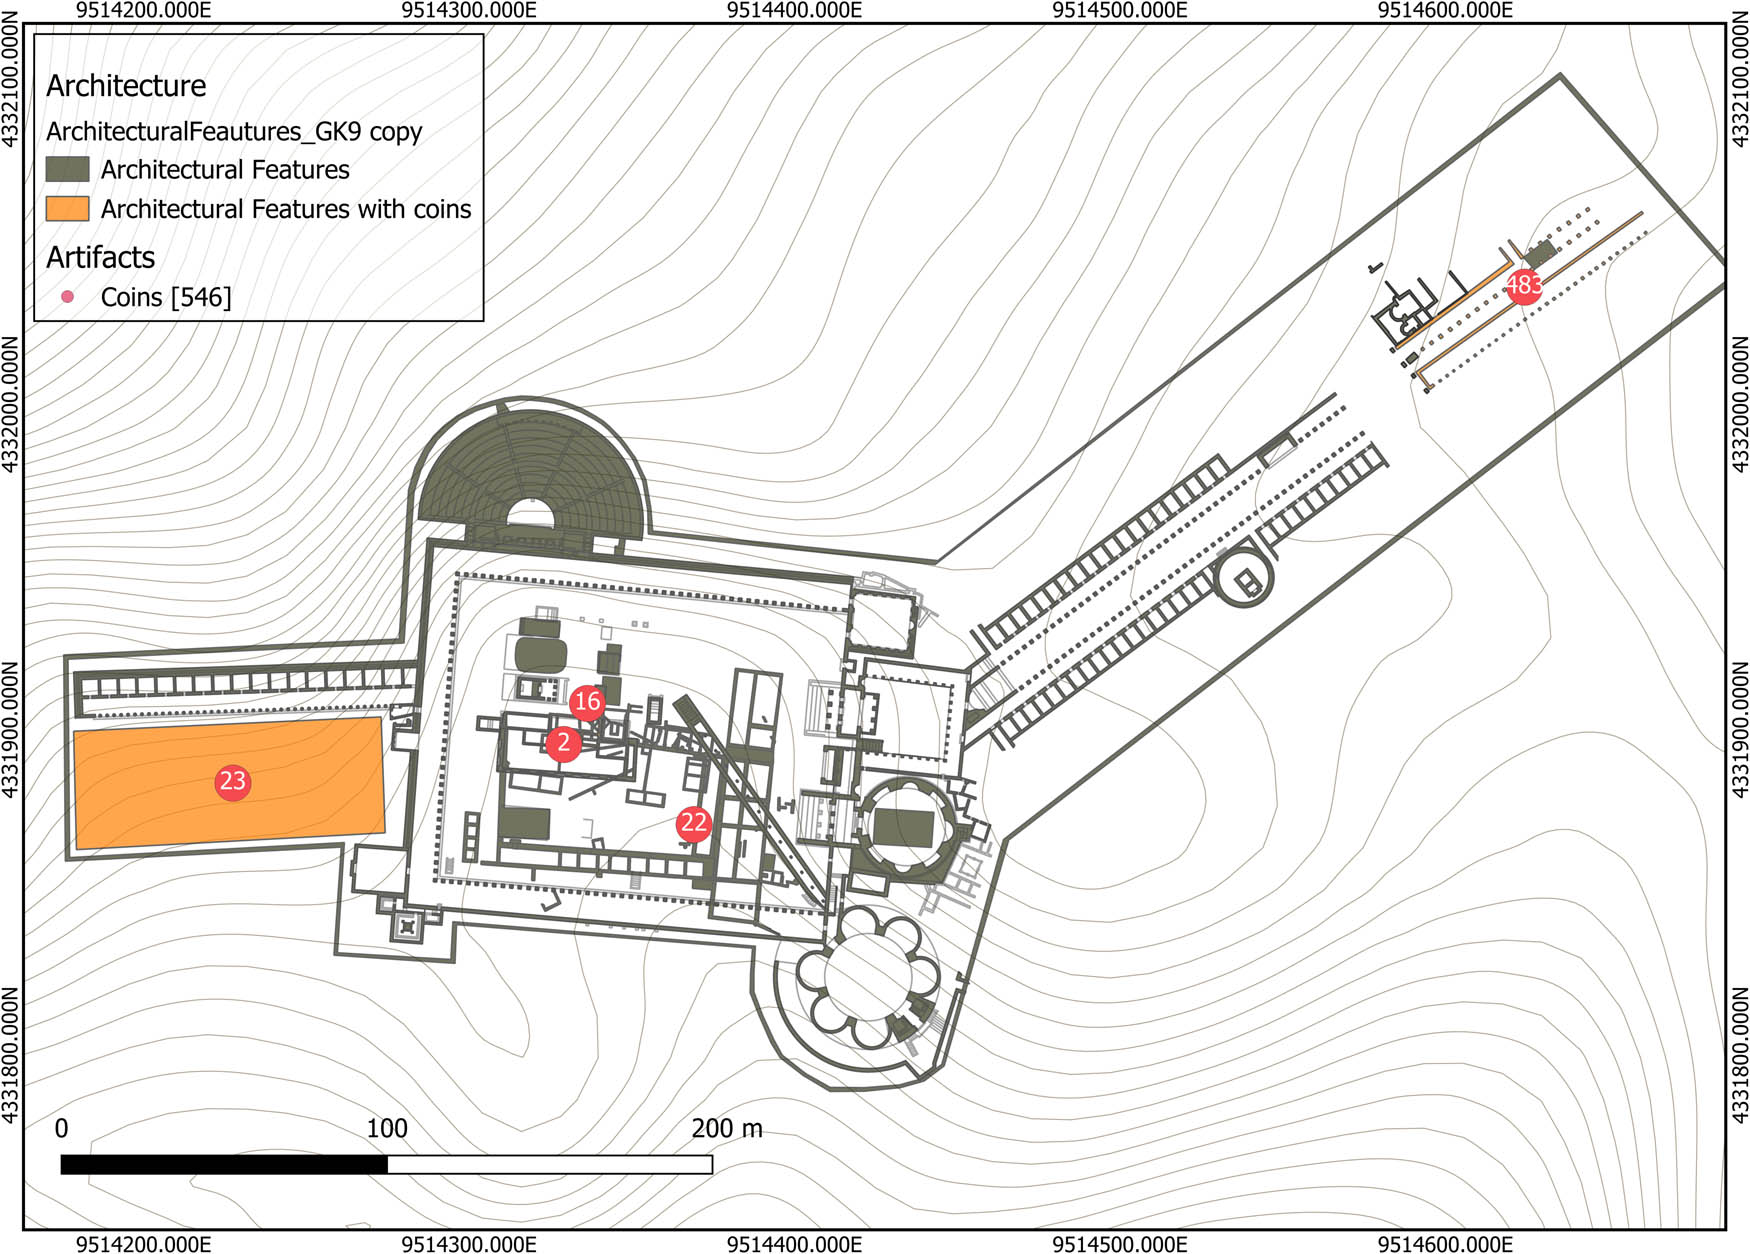
Association between architecture and coins, highlighted in orange are the architectural features associated with coins (image: A. Katevaini).
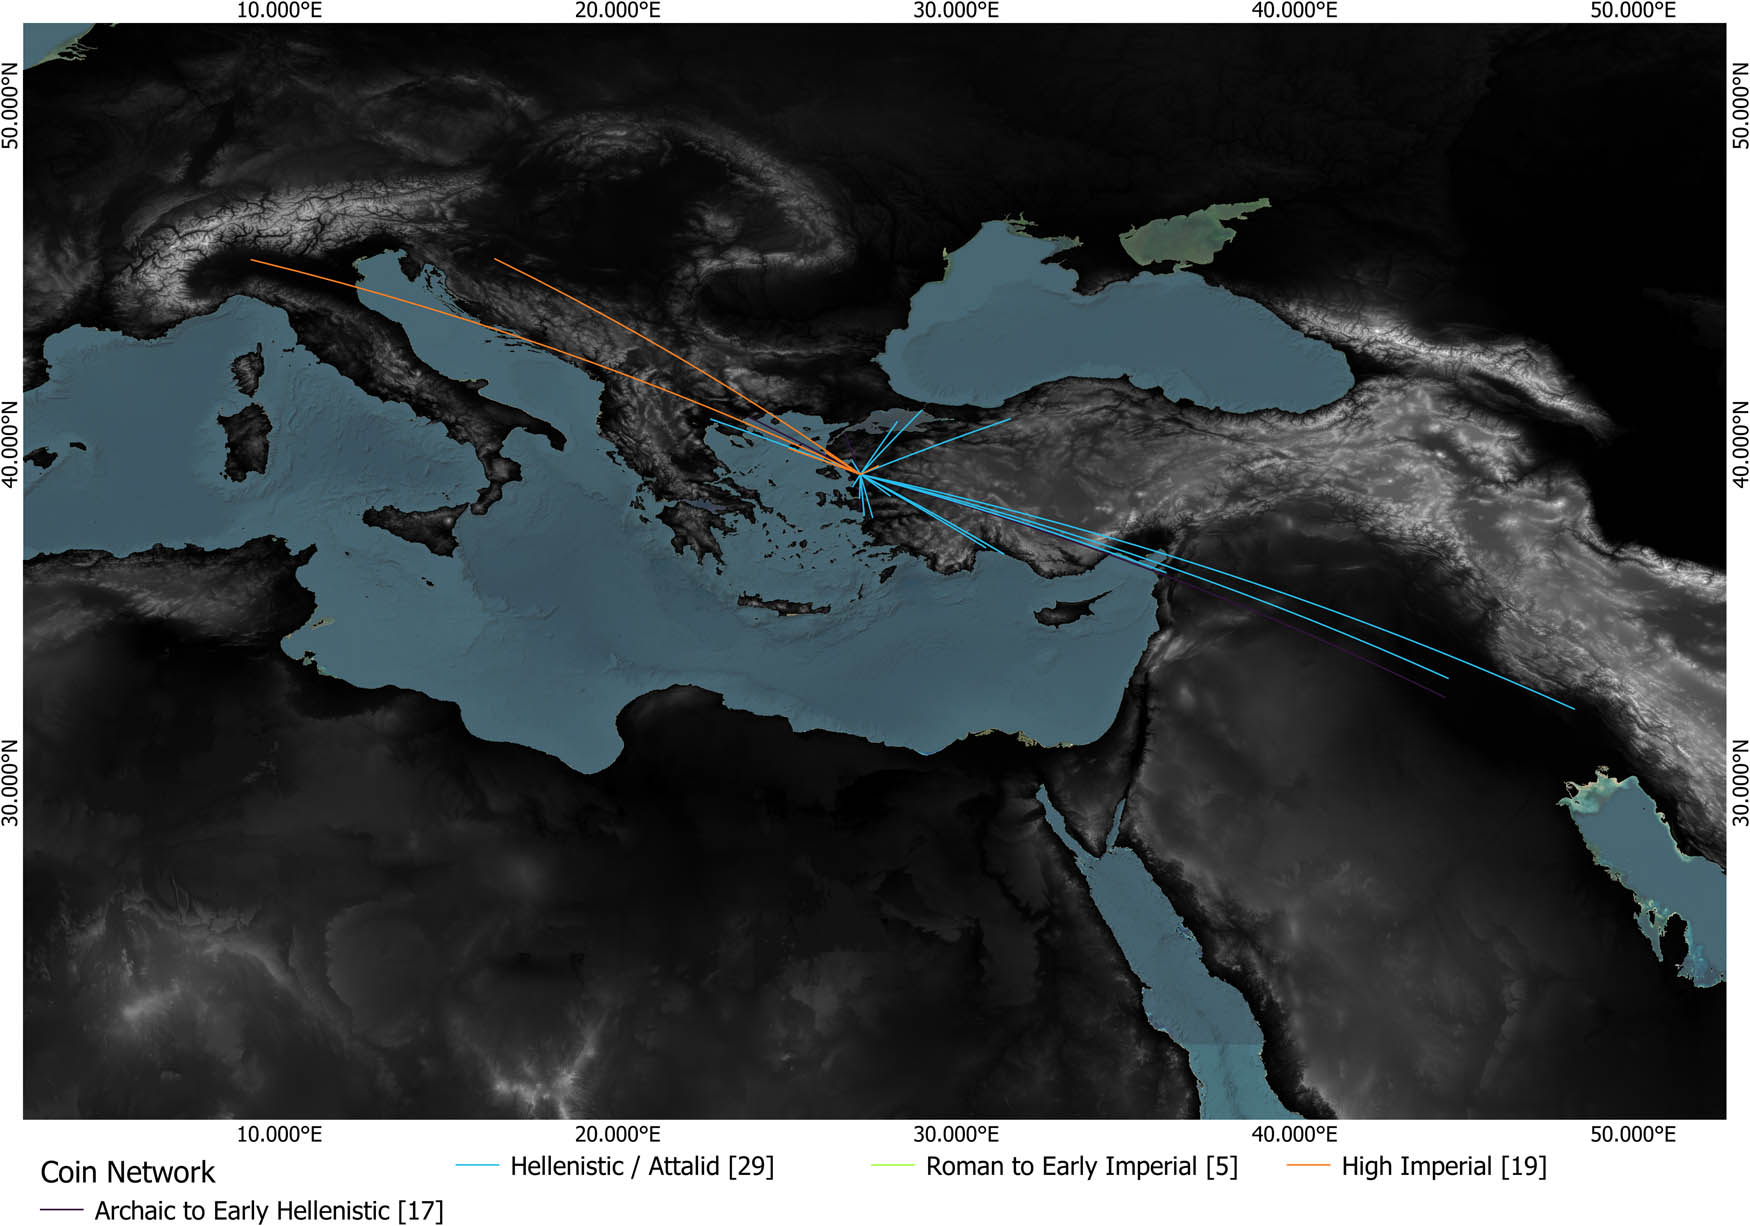
Extent part of the coin network, divided into the general historical phases. Purple: Archaic to Early Hellenistic; blue: Hellenistic/Attalid; green: Roman to Early Imperial period; yellow: High Imperial (image: A. Katevaini).
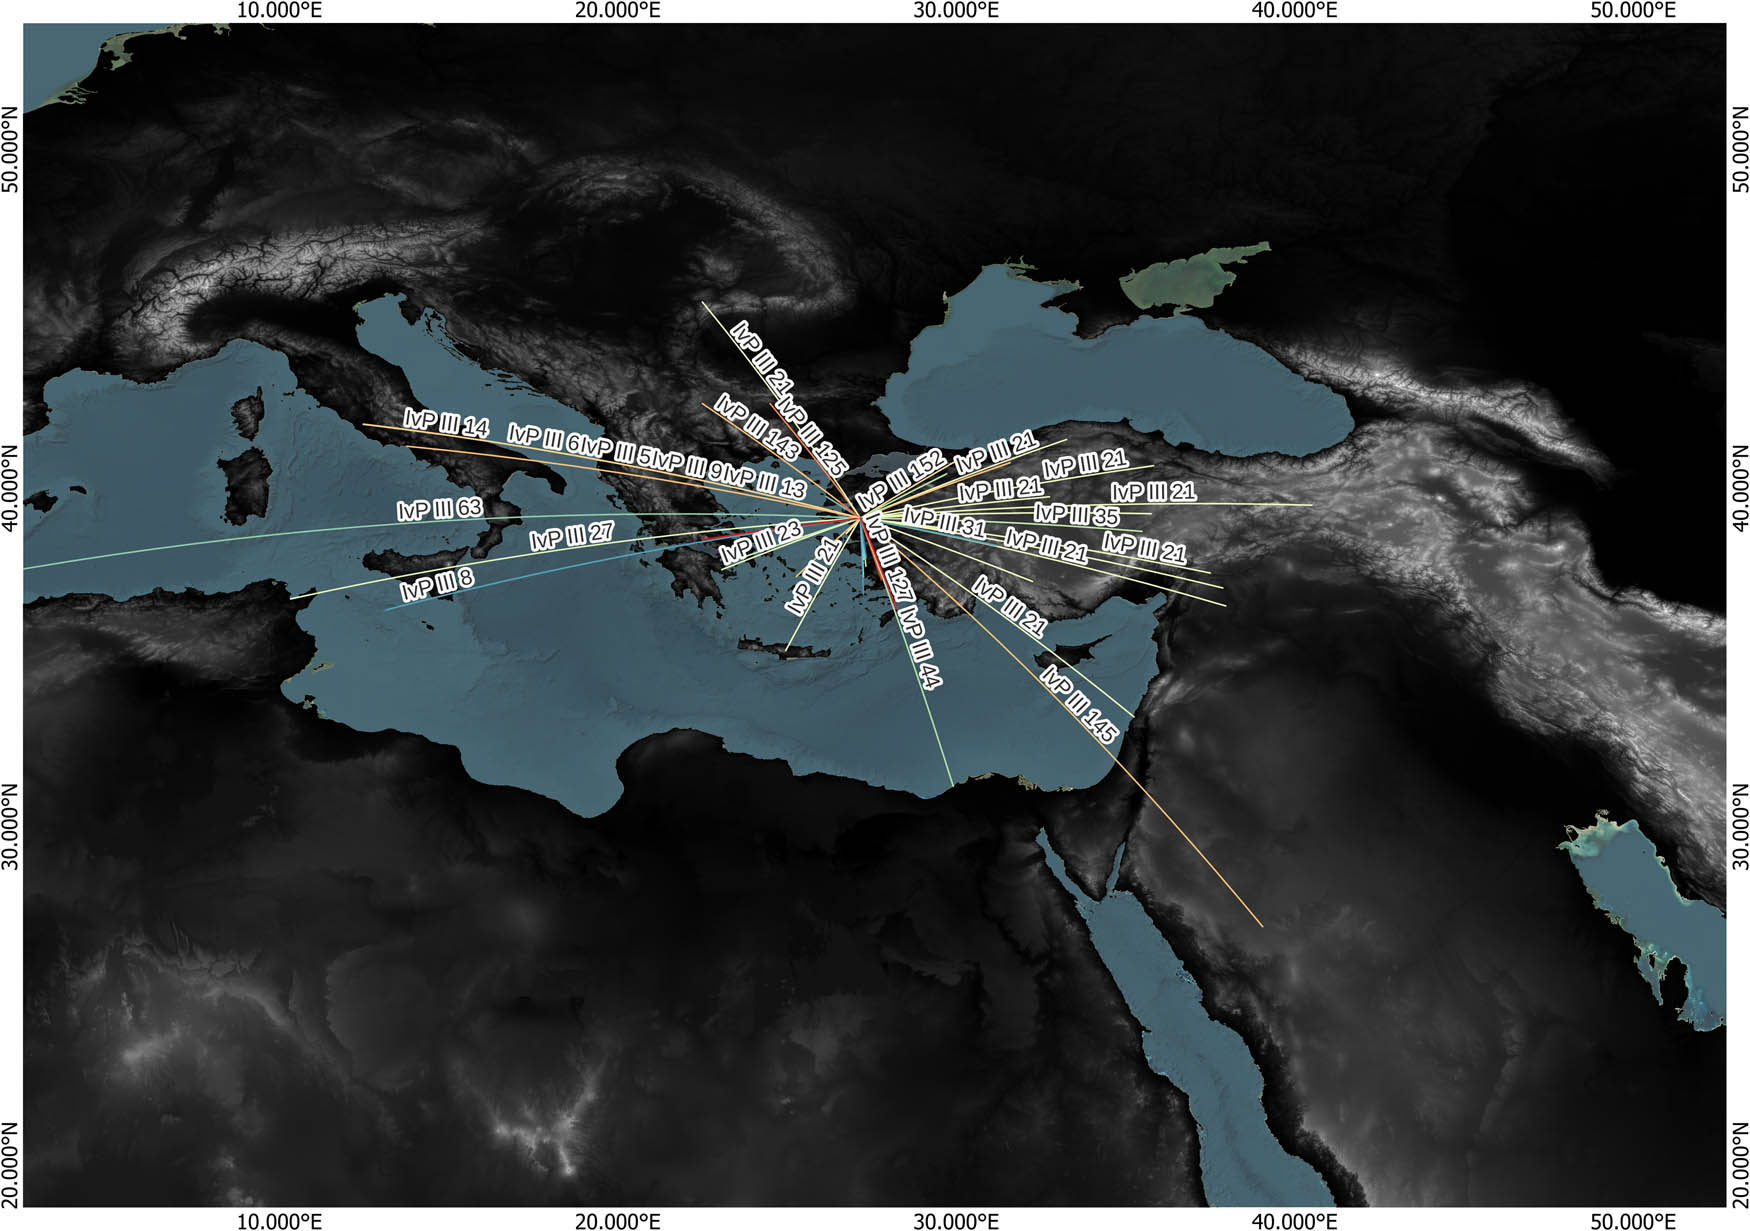
Extent of the inscription network, labeled with the main identifier of each inscription (image: A. Katevaini).
Temporality produces other challenges. The moment of excavation only reveals the last phase of an object, the final resting place in the sometimes very long life of an object (Hoffmann, 2023; Hoskins, 2006; Martinón-Torres, 2002). Yet, objects are by nature mobile, leading to a confrontation with a fundamental tenet of deep mapping, as the spatial narratives of objects should ideally include their shifting places over time in a trajectory of agencies that we can approach only by speculation. The chronology of the object itself is also often a concern, what chronological framework should we assign to statues that the excavators themselves did not date? How should we deal with objects that clearly predate the construction phase in which they were recorded? And, as with the architecture, interpretations of chronologies can change with advances in research, as is the case for some of the ceramics (Keweloh-Kaletta, in press); here too, we plan to incorporate alternative date ranges for more advanced analyses. For the time being, however, we will follow the excavation reports and include absolute dates so that we can filter their ranges while relating them to the relative periods of the common tables of global phases, temporal phases with historical periods, and building phases, as discussed above.
Finally, virtual data could be derived from published coinage, as it yielded information for network analysis. Network lines connected the location of the coin in its findspot in the sanctuary (as the centroid) to the location of the origin of the coin, usually an ancient city located with coordinates extracted from Pleiades (pleiades.stoa.org). Figure 16 shows the wide extent of the coinage found at the Asklepieion. Of course, this kind of coin network does not directly translate to a social network – coins may have changed hands multiple times en route. But unlike other objects in our dataset, coins at least provide a starting point as well as an ending point, affording us a glimpse into their biographies, and an indication of larger patterns of circulation.
5.3 Inscriptions
As a data type, inscriptions intersect the disciplines of archaeology and history. As objects, they have physical attributes, such as material, size, typology, and spatial attributes (point coordinates). Yet, they also have textual and personal information that indicate personal experiences, including devotional objects but also public honors and decrees of state. These textual objects are vital to a variety of narratives, including reconstructing ego-networks (networks of individuals) showing social and geographical networks, as well as spheres of influence of individuals commemorated in the Asklepieion.
Most of the inscriptions from the Asklepieion were published by Christian Habicht in IvP III (Habicht, 1969), as a corpus of inscriptions that were initially published elsewhere in preliminary reports (Conze & Schuchhardt, 1899; von Prott & Kolbe, 1902; Hepding, 1907; Wiegand & Weber, 1932; Deubner, 1938; Boehringer, 1966; and early findings from the Via Tecta excavations). A few more have since been published by Ludwig Meier (2009). The inscriptions from Pergamon, including the Asklepieion, are currently under review within the framework of the project Inschriften von Pergamon at the University of Zürich, directed by Andreas Victor Walser and Ursula Kunnert.[7]
As with the other material data, the inscriptions in our project are mapped based on their descriptions in the official publications. With the IvP III inscriptions, Habicht cited verbatim the notes from the original publications, even though the identifications of certain buildings had meanwhile changed (e.g., the “Temple of Asklepios”). The data tables record as much spatial information as possible, recording their intended locations as far as this is known, and otherwise their findspots. As with the other data types, inscriptions are represented as points in a shapefile, following the same method of “stacking” points on top of each other (see previous). Inscriptions with no indicated location, or those that could only be ascribed to sanctuary in general, are stacked in a conventional location outside the sanctuary, near the modern depot (immediately south of the temenos). In this way, they are made visible without impairing the view of the sanctuary itself. The Zürich project collected the coordinates of the current location of inscriptions in and around Pergamon, including the Asklepieion, and has shared these with us; these are also included in our dataset. We could show these locations, as many of the inscriptions are now located within the site, not far from their findspots. However, these locations largely represent current management decisions at the archaeological site. Moreover, we know that some of the inscriptions were already moved around in antiquity to create spatial narratives at the time, an interesting feature in itself. One spatial narrative that we could incorporate in the future could reflect the “wanderings” of these monumental inscriptions, but for the main map, we are adhering to the findspots recorded by the excavators and mentioned in Habicht in IvP III.
In our project, the textual evidence of the inscriptions is used in multiple ways. We can use them to narrate their stories individually but also to create more virtual data, presenting the networks that they reflect (Figure 17). The networks are created based on the mentions of other places within the inscription. Personal networks are referred to as ego-networks. One inscription can thus have multiple network lines and those can be used to create a narrative about the personal stories and more general stories that span the Mediterranean (e.g., the story maps of Julius Quadratus Bassus, see deepmappingsanctuaries.org). Finally, these texts often give us personal information about the individuals, family names, activities that were taking place, and the deities that were honored, as well as relations to political institutions, such as the council of Pergamon, local elite who were connected to Rome, even members of the Senate in Rome. But just as important, they also create a local network of worshipers of Asklepios, yielding insights into public and private cult practices, rituals of healing, and even dreams that people had, affording highly unique and valuable insights into the experiences at the shrine.
5.4 Literary Sources
Besides material objects, our project also incorporates contemporary references to the Asklepieion in literary testimonies. The largest source by far is the exceptional body of work by Aelius Aristides, an orator from the second century AD who was chronically ill and spent some years at the sanctuary. Aristides describes his long route to recovery and the healing practices that took place along the way in his Hieroi Logoi (“Sacred Tales”), a narrative in six volumes in which the Asklepieion at Pergamon functions as prime mise en scène for his memories and encounters with the god Asklepios. This work provides invaluable insights into the spatiality of rituals and potential experiences that the sanctuary could provoke.
For this, we have used the edition and translations in Behr (1968, 1981), following his passage numbering. Aristides’ texts elaborate on his experiences in the sanctuary, his encounters with others, his encounters with Asklepios, and the many rituals and cures of healing that he endured, often in graphic detail. Meanwhile, his narratives offer a good deal of references to the Asklepieion as they are framed in space and time. He sometimes refers to specific buildings (e.g., the temple, the propylaia, or a statue) and a general spatial feature (e.g., river, city), but most often he refers to the sanctuary as a whole. This gives a mostly low degree of resolution to the spatial data. Regarding the temporal element, however, the opposite is true as he includes months and even years in his stories, thus allowing for a higher degree of chronological resolution than most of the other datasets. To make them comparable, we included the absolute dates as a field, so the data can be filtered and compared.
From a technical perspective, we made these data compatible with the rest, by adhering to the same common temporal and spatial fields (discussed at the beginning of this section), and by mapping the passages with a spatial attribution. Yet, textual data represent a different kind of information than an object that has a direct spatial attribute of its own, rather than one by general reference. The shapefile we used for this dataset therefore is a polyline as this can represent fuzzy data across continuous spatial features, such as “the Temple,” or “the Sacred Theater”; also, it is more user friendly, allowing selections over other layers of features as well. We created conventions for the different types of spatial references: for architectural features, we just created outlines (polylines) of the features included; for linear elements in the landscape (the Kaikos river), we created a polyline based on the maps of modern rivers. Finally, for general references to the Asklepion, we created a polyline outlining the inner court.
Figure 18 shows the combination of all of the layers in the GIS environment, indicating the density of artifacts, their spatial and temporal attributes, and some of the network connections (virtual data). Converting real-world objects and lived experiences into data and structuring it accordingly are always a reduction of some kind into a reference system. Also, the types of data can bring challenges by their nature or according to their unique path toward becoming published objects. The choices made along the way will inevitably impact the outcome; to create a deep map one must be not only aware of these choices, but also open to learning from the data types, what they have to offer, and to adapt the structure of the map as needed.
The deep map in the QGIS environment, with all of the layers active. Note that the predominance of yellow (High imperial period) reflects the position of this layer in the arrangement of layers, obscuring the layers below (image: A. Katevaini).
6 Applications of our Deep Map – Story Maps
The objects in the dataset clearly have stories of their own to tell, but having their spatial and temporal attributes roughly in place allows us to include them in structured narratives that can contribute to the greater understanding of what the Asklepieion meant to different people.
As mentioned above (in Section 3), we use QGIS for desktop analysis and data exchanges with colleagues. Yet, we are also communicating our project to a wider audience, especially as a teaching tool to engage students and as an academic solution of interest to other scholars. StoryMaps are an excellent means as they provide an immersive platform, both for recording spatial narratives and experiences, as well as communicating them in an accessible way (Caquard & Dimitrovas, 2017; Dickinson & Telford, 2020; Earley-Spadoni, 2017). By highlighting the relationship between spatial geographies and place-bound meaning, story maps allow for the integration of both quantitative data and qualitative interpretations. Beyond accumulating these sources of information, this approach not only presents a narrative but also encourages active engagement, inviting the viewer to participate in the story by exploring its components. Digital story mapping has expanded since its early beginnings over a decade ago, along with the rise of GIS for the humanities, qualitative GIS, and narrative cartography (Bodenhamer et al., 2010; Caquard & Dimitrovas, 2017; Gregory & Geddes, 2014; Kemp, 2022; Mukherjee, 2019; Robertson & Mullen, 2022). A number of web applications allow for story mapping (Caquard & Dimitrovas, 2017), such as MapStory, Neatline, and GeoStory, which are open source. Since our project also makes use of advanced and complex spatial data, we are using ArcGIS StoryMaps from ESRI (ESRI – https://www.esri.com/en-us/arcgis/products/arcgis-storymaps/overview). This tool allows for the incorporation of maps, filter options, as well as texts, images, and other media, in a guided or exploratory narrative.
Our involvement with story maps began in 2020 with a project grant from the Geodienst (Geo-services) at the University of Groningen (blog, Williamson, 2020). The overarching concern was how best to integrate a wide variety of data, varying in kind and quality, in GIS for a sensible comparable analysis. A key dilemma, however, was how non-tangible data – especially literary sources – could best be incorporated into the deep map, specifically how to visualize them, connect them to space, and make them searchable. The first project focused on the writings of Aelius Aristides (see previous section), which were subject to close reading for spatially related data, compiled in a data table that linked passages to places that mentioned in the text. With this initial project, the Geodienst introduced us to ArcGIS StoryMaps and provided ways of integrating this with “regular” vector data (shapefiles) which may then be imported into ArcGIS Online. Story maps have since been our main method of presenting our work in conferences and academic presentations, but also for education and public outreach. In designing these, we draw on the deep map, using comparative spatial and temporal analyses to produce data for narratives. Further contextual analyses are needed to develop a storyboard (i.e., texts, maps, and other media), which can then be incorporated into the story map (Figure 19). Some of the stories we have experimented with are directly drawn from individual objects, such as inscriptions, while others are fictional narratives compiled from real objects, epigraphic narratives, and representations given in literary sources. The project story maps are grouped together in a collection that is accessible online (Figure 20; Williamson & Katevaini, 2023a, also https://deepmappingsanctuaries.org/deep-mapping-the-asklepieion-in-story-maps/).
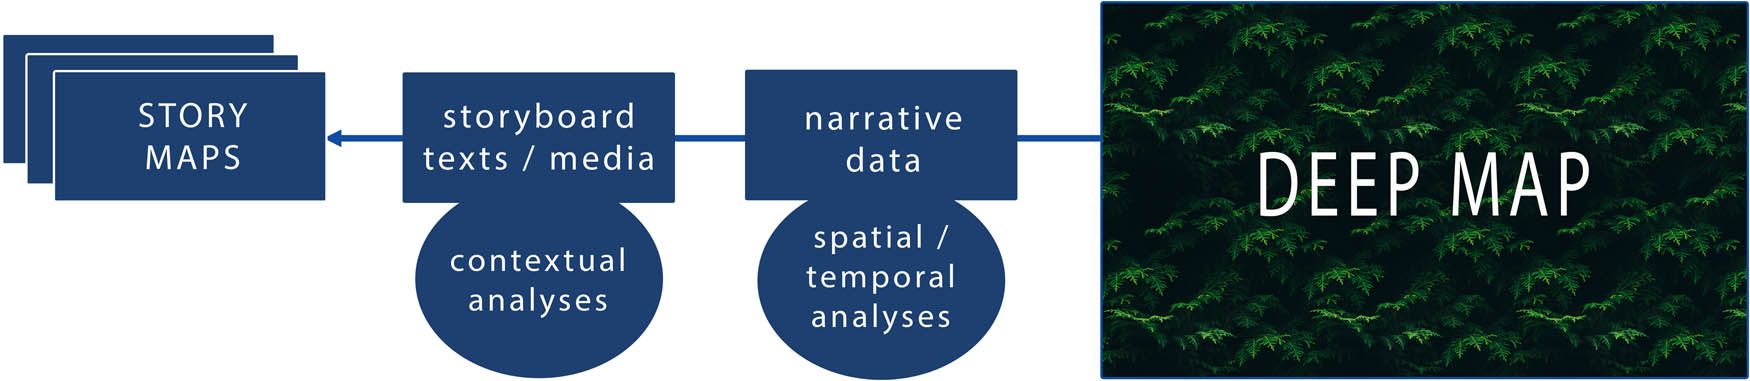
From deep maps to story maps – a workflow (moving from right to left) (image: authors).
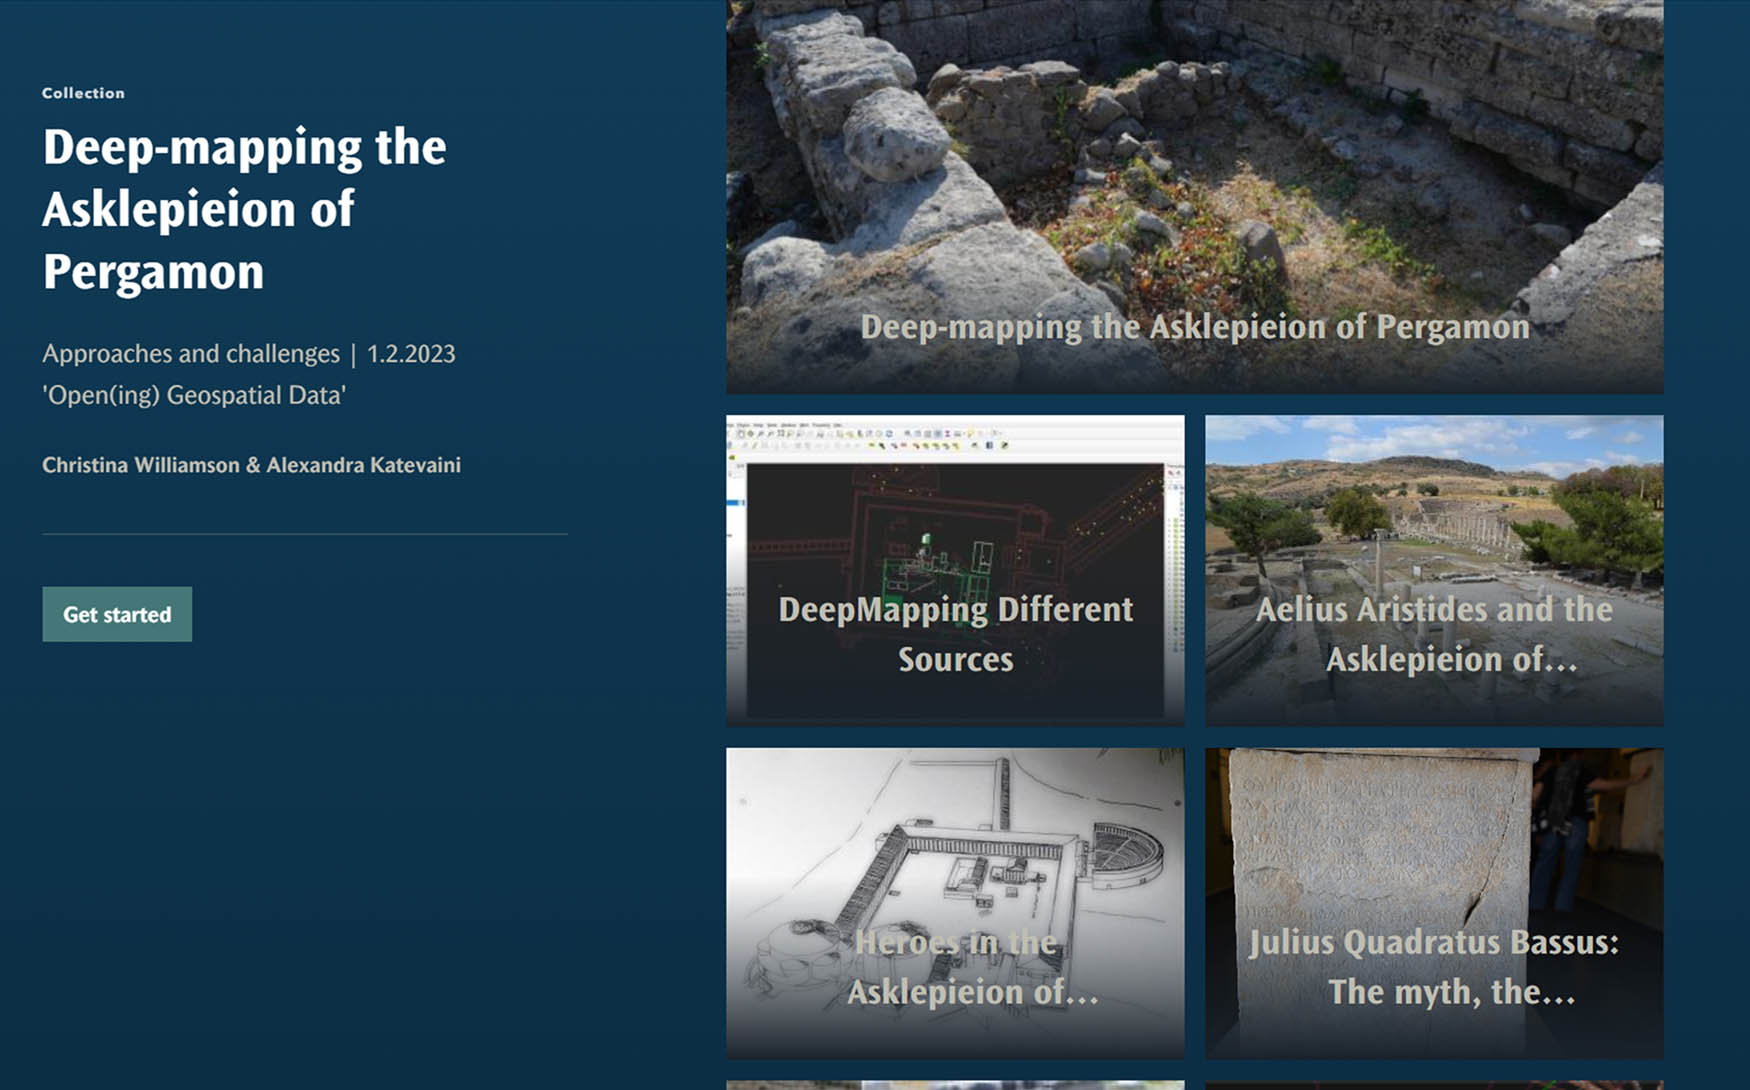
StoryMap collection of stories drawn from the Deep Map of the Asklepieion (link to collection) (image: authors).
The Deep Map of the Asklepieion has also been a rich source for teaching students about digital approaches in spatial history (blog, Williamson & Katevaini, 2023b). In different MA courses at the University of Groningen, we have used elements from the map to show students how they can create story maps. For 3 years, we have run a class with different data, storyboards, and text, and allowed students to work with the stories from inscriptions to make maps of their own, with ours as an example (see our stories on Heroes of the Asklepieion, The myth, the inscription, the network, and On the Road to Healing). The students were given different ready-made components drawn from the deep map – networks, shapefiles, texts, and images – to compose a story map as they saw fit. As part of our public outreach, we also organized an immersive activity for the Arts Festival at the University of Groningen in 2022, sponsored by the Faculty of Arts, in which various humanities projects engaging with the public were selected from different disciplines. Our project “Tales from the Asklepieion” had as goal to present our methodology while providing the public with an entertaining and educational activity, related to a historical topic (blog, Williamson & Katevaini, 2022). We recreated a corner of the sanctuary, the area north of the temples and altars. This became a prime spot during the Roman period with the construction of the theater and the North Stoa – the area was also curated by relocating older inscriptions from other parts of the shrine to this new area, creating a historical showcase of monuments to the local elite. We defined the spatial and temporal attributes within this perimeter and selected all the features that fell within that area (inscriptions, literary sources, architecture). Each element was provided with an individual story maps. Furthermore, we set up a large projection of this corner of the sanctuary in the exhibition space, with rotating images of the Asklepieion on a separate screen. We printed cards with color-coded QR codes linking to the various story maps (Figure 21). These were scattered around the room for the audience to discover and interact with, using their cell phones. The stories were thus shared as a kind of game that the public could engage with while learning about religious experiences at an ancient Greek sanctuary.
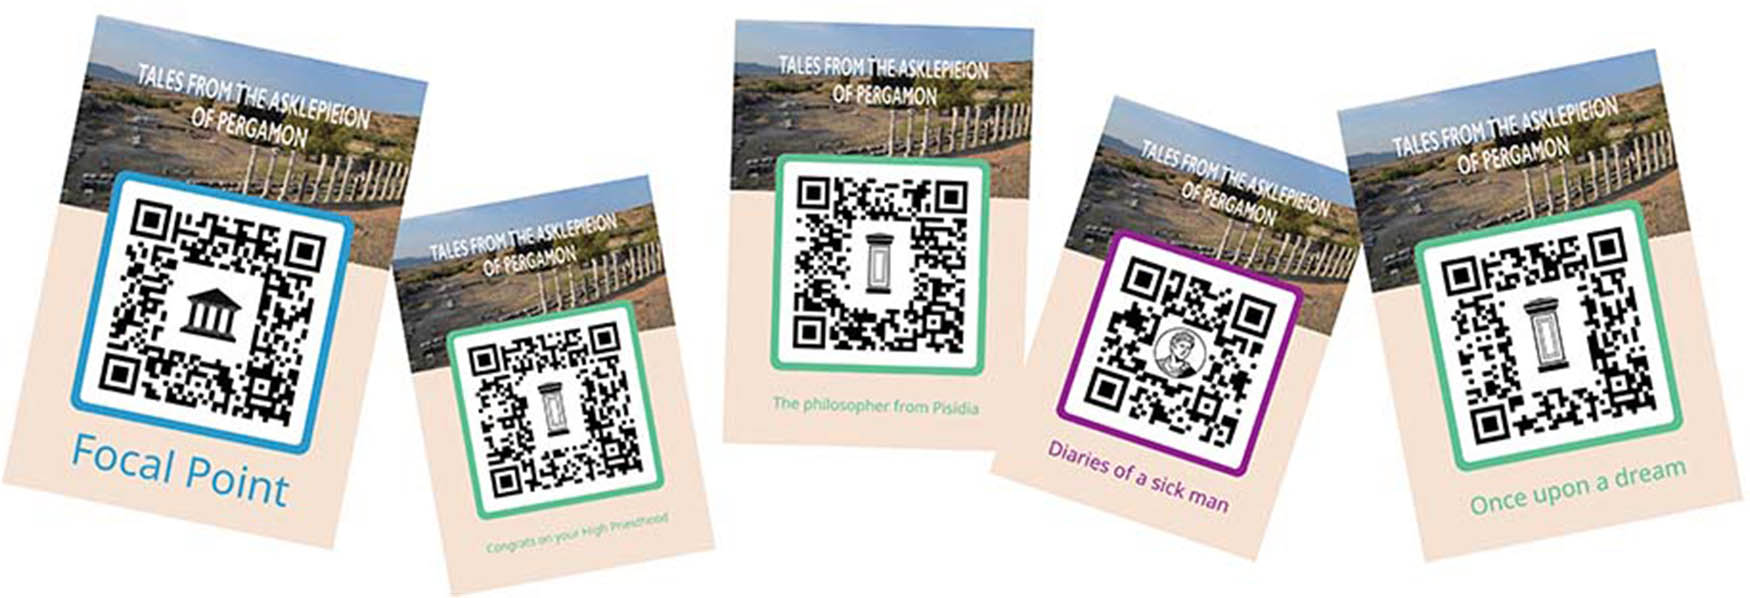
QR codes used to access story maps during the event “Tales from the Asklepieion” project, during the Festival of Arts (2022) at the University of Groningen (note: the codes are no longer active, but the story maps can be accessed through the link to the collection) (image: A. Katevaini).
Our latest outreach endeavor involves opening up the Deep Map of the Asklepieion for use by the public at large. The Geodienst is once again helping us realize an online environment – http://askperg.org – in which the deep map becomes a public tool, enabling users to browse, analyze, and even download the different shapefiles related to the data (Figure 22). This ensures compliance with the FAIR principles of data sharing (Findability, Accessibility, Interoperability, Reusability, see https://www.go-fair.org/fair-principles/). The primary interface is story maps that makes use of ArcGIS Experience Builder, providing dashboards that help users navigate over 3,000 objects while affording an immersive experience (Figure 23). This online environment currently focuses on making the data available to the public. Users who wish to browse the data may do this comprehensively, as Figure 21 shows, or more specifically according to type (e.g., architecture, ceramics, inscriptions). They may also browse some of the individual stories that we provide through story maps. In the next phase, we plan to design an environment that encourages visitors to explore the sanctuary in an even more immersive manner, assembling stories of their own, based on the data, or their own experiences. More in the future lies the potential to engage on-site visitors at the Asklepieion with stories from the online deep map (perhaps through codes), giving them a glimpse of how the sanctuary was experienced by different people.
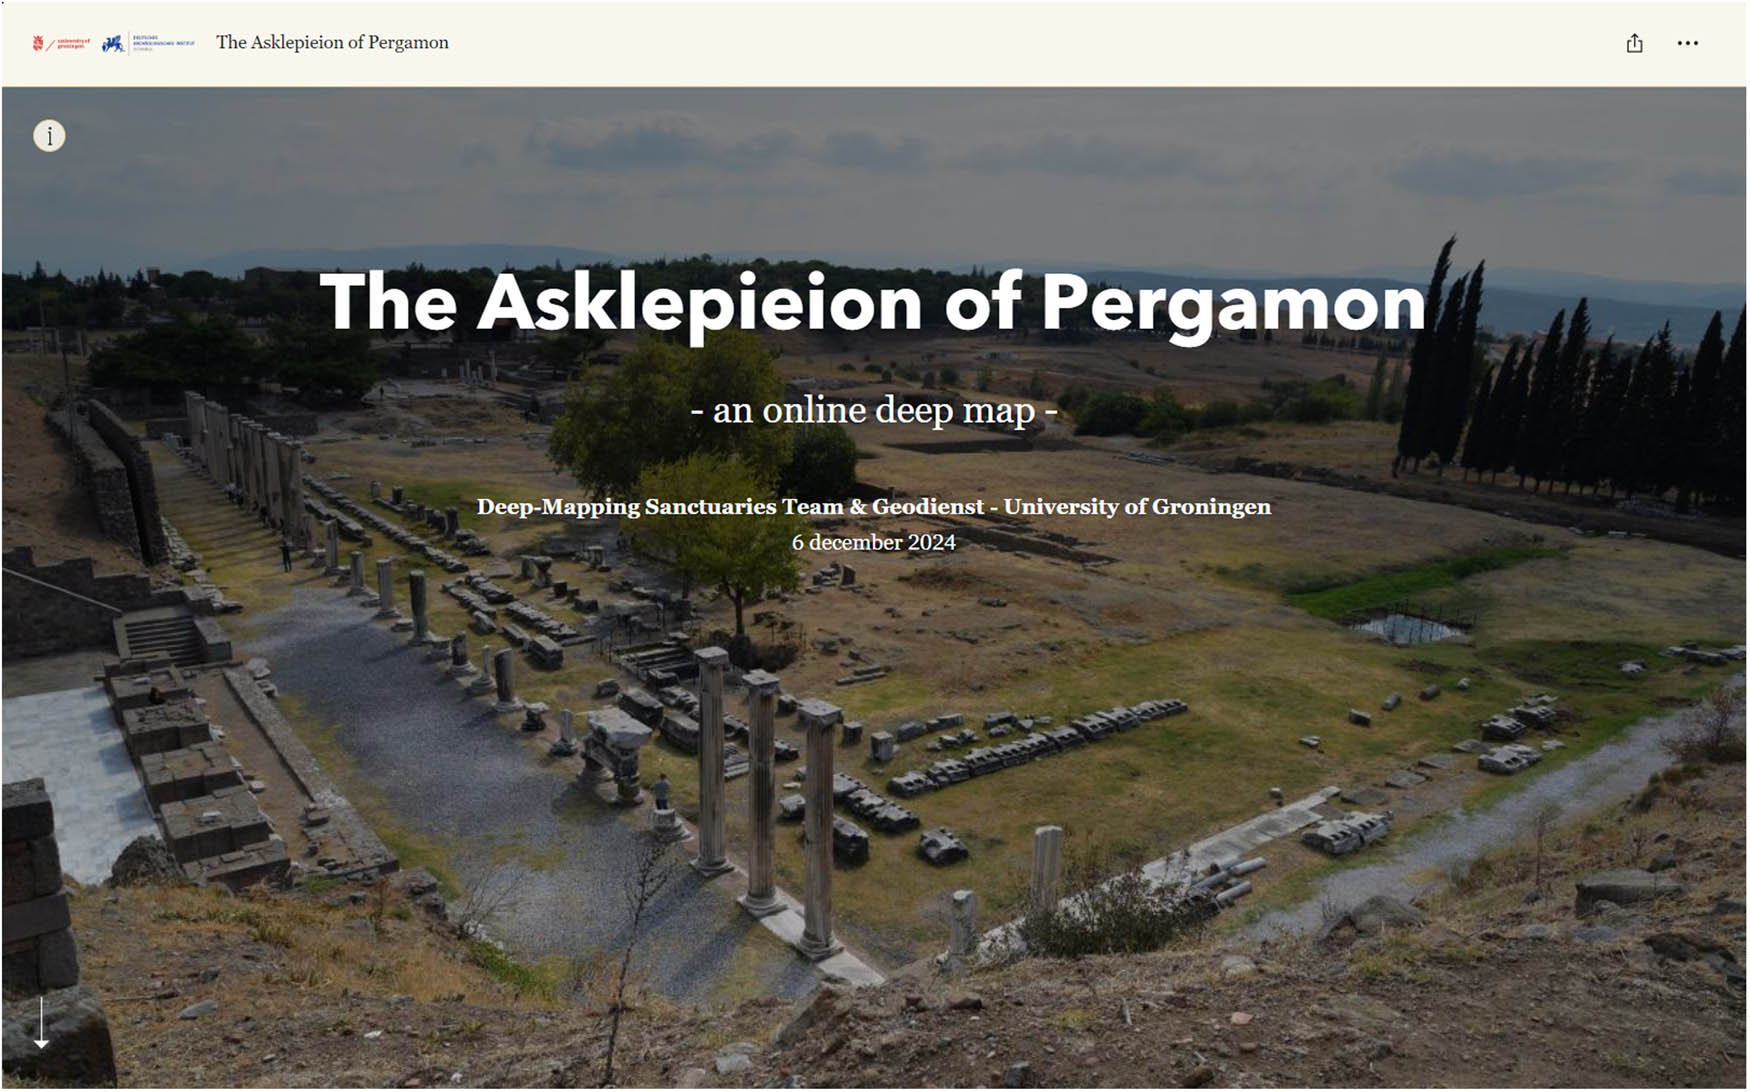
The Deep Map of the Asklepieion (askperg.org) (image: authors and the Geodienst, University of Groningen).
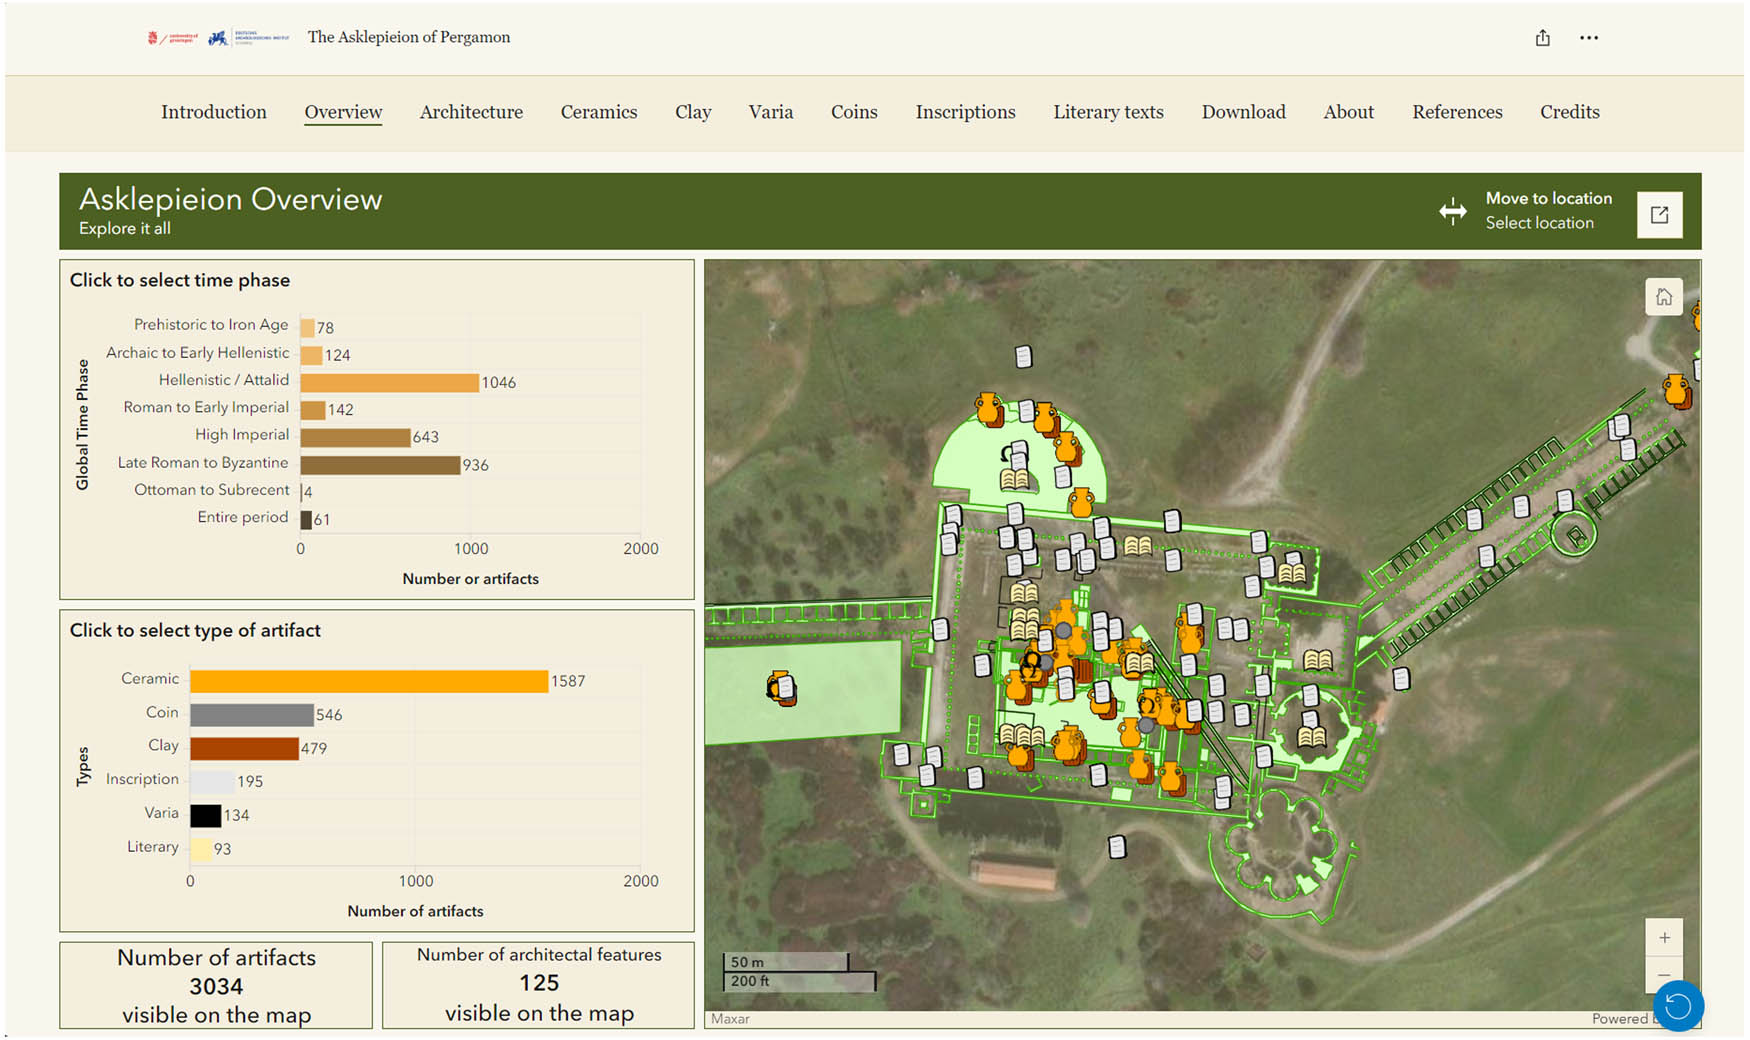
The Deep Map of the Asklepieion (askperg.org) – overview map showing the main dashboards for users to explore the spatial and temporal attributes of the data. Similar maps are available for the categories shown at the top, each with more specific and detailed parameters according to the data (image: authors and the Geodienst, University of Groningen).
Making the Deep Map of the Asklepieion openly available will be of interest for a variety of reasons, to a variety of people. Academics will be able to visualize their object of focus within a larger context, deepening their interpretations while raising new questions. The deep map will also be educational, helping students and interested members of the public to come to terms with the complexity of objects that sanctuaries could help generate, but especially the complexity of human interchanges and narratives that they could inspire. Finally, it is our hope that our deep map will inspire others to engage in similar endeavors to bring ancient real-world places to life again.
7 Reflections on Our Experience with the Deep Map
To our knowledge, this is the first application of a deep map approach to a sanctuary in the ancient world, as well as the first to reintegrate the complexity of data into a single environment, which is then opened up to the public. Apart from the results of using deep mapping as a methodological tool, this project challenged us in several technical aspects which we have discussed here. Incorporating all of the data together in a comprehensible fashion has not been unproblematic. On the whole, this thought-provoking endeavor forced us to reflect upon historical approaches in the disciplines of archaeology, history, and literary analyses, observing their strengths and limitations. The path taken, issues encountered, the rethinking, and the new decisions made along the way are an integral part of any research project – but only rarely are these openly shared. Here we present the main challenges that we encountered and solutions that we found to address them. While we do not intend this as a diary entry, we do believe that it is important to be transparent and openly reflect on the processes that take place during an innovative project, full of unknowns, such as ours.
One of the things that we were confronted with at every step of our research was the actual nature of our data, their creation process, and how the data ultimately had to be “essentialized” to be incorporated into a deep map in a GIS environment – losing some information at each step. As discussed above, archaeological and historical data are products of real-world (erosion, affordances of material, chance of survival) and academic processes (recovery, analysis, publication). By incorporating these data into a deep map, we really had to reconsider the “metadata” and creation processes of the sources of our project, as discussed above. In the disciplines of archaeology and history, data should also be understood and analyzed, not as self-explanatory representations of the past, but as products of manipulation, part of a pipeline that includes processes of selection, grouping, analysis, and manipulation (visualized in Figure 3). The conventions widely used by scholars were one of the main reasons we adhered to the published description and classification of the data; this increases its findability level, at least for other scholars. Additionally, for this project, we challenged the sources even more by structuring and transforming the data (archaeological and historical) to accommodate a computer-generated GIS environment, geared for comparative analyses. This meant that artifacts and sources had to be defined based on common spatial and temporal aspects, either as an inherited or a forced attribute, and transformed into data tables and vector files. Lastly, the analysis and visualization that can be created by that data, by grouping them and filtering them, presents a version of the past that is at best a representation of an imagined reality – one that might not have been experienced, observed, or even acknowledged by every contemporary visitor of the day.
Another focus of several discussions was the story-telling that we present through the story maps, both the extent and depth of the stories. We spent a lot of time discussing viable ways of telling stories, taking into account the quality of the data, and most importantly the overwhelming amount of data in the deep map (Figures 8 and 17). Since one of our aims is to highlight sources less well-known, it required a good deal of discipline to go beyond “low-hanging fruit,” such as the juicy tales of Aelius Aristides, or some of the lengthy epigraphic narratives. The strength of the deep map is that it allows us to expand on the more simple objects too, e.g., the context of an inscription with only the name of the god, besides those that already have a detailed back story, or highlighting courseware pottery besides an imported pot, or elaborating on a single Byzantine coin besides the Hellenistic coin hoard. While these are rich stories, the deep map approach invites us to weigh the story value of each object with equal consideration and to create stories that make several voices heard, however small, mundane, and everyday they may seem. This is why it will never be finished. At the end of the day, although numerous wealthy and powerful people visited the sanctuary and left an outspoken mark (buildings, monuments, literary texts), it was the everyday people, the cross-section of society, who went there in search of healing, that made the sanctuary shine. They were the ones who, by performing the simple rituals time and time again, gave it an audience and an enduring collective voice, made up of thousands of individuals as a community of worshipers, across generations and even centuries. To make the circle full in our discussion, using a computer-generated environment for this analysis (GIS and datasets) actually allows us this degree of equality and multivocality among the data, without automatically leaning to the more vociferous sources at the cost of others.
If there is a conclusion to be drawn from this backstage discussion of this project, it is that sincere honesty and transparency, reflection on the data, self-control, and humility are essential tools in this project, as they are in any research project. Honesty and transparency are not only about your own practices but also about the data you use, their attributes, as well as their limitations. Reflection on the data, its quality, how it was collected, the choices made in its publication, but also in the “accuracy” level of its presentation in time and space in the deep map. Self-control to not chase endlessly after every data point and disappear “down the rabbit hole.” Humility in the realization that the work will never be finished, and you will never completely know all or even most of the stories of those for whom this sanctuary meant so much. But getting close is a reward in itself. These challenges, as formidable as they are, only made us more excited about this project and enthusiastic about how we can use the deep map to reintegrate the data, interpret the variety of human experiences, and open this up for others to further explore.
Abbreviations
- Ael. Arist.
-
Aelius Aristides, Ἱεροὶ λόγοι (Sacred Tales)
- Appian, Mithr.
-
Appian, Mιθριδάτειος (Mithridates)
- AvP XI.1
-
Ziegenhaus and de Luca, 1968
- AvP XI.2
-
Ziegenhaus and de Luca, 1975
- AvP XI.3
-
Ziegenhaus, 1981
- AvP XI.4
-
De Luca, 1984
- AvP XI.5
-
Hoffmann and de Luca, 2011
- Diod. Sic.
-
Diodoros Siculus, Bιβλιοθήκη Ἱστορική (Historical Library)
- IG IV², 1
-
Hiller von Gaertringen, 1929
- IvP
-
Fränkel, 1890/1895
- IvP III
-
Habicht, 1969
- Paus.
-
Pausanias, Ἑλλάδος περιήγησις (Travels through Greece)
- Polyb.
-
Polybios, Ἱστορίαι (Histories)
Acknowledgments
We are grateful for the assistance of Pim Schievink in structuring the epigraphical data from IvP III and Hannah Jonkers for assisting with the GIS shapefiles. Thanks are also due to Paul Haan for introducing story maps to the project and to Peter Merx from the Geodienst in Groningen, whose enthusiasm and insights were invaluable for advancing this project to an online environment. We are indebted to Felix Pirson, director of the German Archaeological Institute (DAI) Abt. Istanbul and the Pergamon fieldwork, to Ulrich Mania, who directed the surveys in the vicinity of the Asklepieion, and to the Pergamon team in general for their insights and support. Finally, we would like to thank the editors and the anonymous peer reviewers for their helpful comments, all of which made this a stronger paper. Any remaining errors are entirely our own.
-
Funding information: This research has been made possible through funding from the Dutch Research Council (NWO), for the project “Sanctuaries as festival hubs,” part of the larger project “Connecting the Greeks. Multi-scalar festival networks in the Hellenistic world,” which Christina Williamson co-directed with Onno van Nijf at the University of Groningen (2019–2022). The use of story maps in this project was initiated through an additional support grant from the Geodienst at the University of Groningen in 2020, applying it to the literary work of Aelius Aristides (blog, Williamson, 2020). Continued work on this project has further been made possible through fellowships at the Max-Weber-Kolleg in Erfurt, within the project “Religion and Urbanity. Reciprocal Formations” (FOR 2779), and at the University of Uppsala, in the Department of Classical Archaeology and Ancient History. Finally, the project would not have been possible without the full support of the German Archaeological Institute (DAI) Abt. Istanbul and the assistance of the Pergamon team.
-
Author contributions: All authors have accepted responsibility for the entire content of this manuscript and approved its submission. A.K. designed the GIS environment to accommodate the Deep Map of the Asklepieion, a project conceived by C.W., in the framework of the NWO-funded project “Sanctuaries as festival hubs” (see Funding information). C.W. is responsible for the content and informational level of the data. A.K. is responsible for compiling the data for the vector files in the geodatabase. Together they have had numerous brainstorming sessions on the structure and integration of this complex set of data in GIS, as well as how best to extract narratives from them. A.K. has pioneered the advancement of the project into the public sphere using story maps with QR codes, and the contribution to the Festival of the Arts was her brainchild. Together they have used this as a teaching tool for university students.
-
Conflict of interest: Authors state no conflict of interest.
-
Data availability statement: The datasets generated and analysed during the current study are published as CC-BY-ND-4.0 and available for download via the Dutch repository for scientific data DANS, see C. Williamson, 2025, “Replication Data for: Deep-mapping the Asklepieion of Pergamon”, https://doi.org/10.17026/AR/NMJPGP, DANS Data Station Archaeology, V1 [https://doi.org/10.17026/AR/NMJPGP]. There are also plans to publish the data on the repository of the German Archaeological Institute (iDAI.repo) in the near future.
References Blogs
Williamson, C. G. (2020, March 30). Support Grant from the Geodienst. Deep-mapping sanctuaries. Mapping experiences at festival hubs in the Hellenistic world. Retrieved 6 December, 2024 from https://deepmappingsanctuaries.org/2020/03/. Search in Google Scholar
Williamson, C. G., & Katevaini, A. (2022, September 29). ‘Tales from the Asklepieion of Pergamon’ at the Arts Festival – 17 September 2022. Mapping experiences at festival hubs in the Hellenistic world. Retrieved 6 December, 2024 from https://deepmappingsanctuaries.org/2022/09/.Search in Google Scholar
Williamson, C. G., & Katevaini, A. (2023b, March 20). Story Maps in the Classroom. Mapping experiences at festival hubs in the Hellenistic world. Retrieved 6 December, 2024, from https://deepmappingsanctuaries.org/story-maps-in-the-classroom/.Search in Google Scholar
Story mapsSearch in Google Scholar
Williamson, C. G., & Katevaini, A. (2023a). Deep-mapping the Asklepieion of Pergamon. Approaches and challenges (collection of story maps). Retrieved 6 December, 2024, from https://storymaps.arcgis.com/collections/d2cd28e6081e4edd8579bf48fd3216c9.Search in Google Scholar
Websites
Amsterdam Time Machine – Retrieved 29 November, 2024, from https://www.amsterdamtimemachine.nl/data/.Search in Google Scholar
The Asklepieion of Pergamon. An online deep map – Retrieved 29 November 2024, from http://askperg.org.Search in Google Scholar
Clifford McLucas – deep maps. Retrieved 29 November, 2024, from https://cliffordmclucas.info/deep-mapping.html.Search in Google Scholar
Deep-mapping sanctuaries. Mapping experiences at festival hubs in the Hellenistic world. Retrieved 29 November, 2024, from https://deepmappingsanctuaries.org.Search in Google Scholar
ESRI Digital Storytelling with GIS-Based Maps | ArcGIS StoryMaps. Esri – Retrieved 29 November, 2024, from https://www.esri.com/en-us/arcgis/products/arcgis-storymaps/overview.Search in Google Scholar
Fundmünzen von Pergamon (Chameroy & Weisser) – Retrieved 14 November, 2025, from http://ikmk.smb.museum/mk_pergamon/.Search in Google Scholar
GoFAIR – Retreived 29 November, 2024, from https://www.go-fair.org/fair-principles/.Search in Google Scholar
HisGIS Fryslân – Retrieved 29 November, 2024, from https://hisgis.nl/projecten/fryslan/.Search in Google Scholar
Inschriften von Pergamon, Universität Zürich, Historisches Seminar (Prof.dr. A.V. Walser) – Retrieved 29 November, 2024, from https://www.hist.uzh.ch/de/fachbereiche/altegeschichte/lehrstuehle/walser/forschung/pergamon.html.Search in Google Scholar
Izmir Time Machine 2.0. Bergama – Retrieved 29 November, 2024, from https://www.izmirtimemachine.com/bergama.html.Search in Google Scholar
Lancaster project ‘Geospatial Innovation in the Digital Humanities – Deep-mapping the English Lake District’ – Retrieved 29 November, 2024, from https://wp.lancs.ac.uk/lakesdeepmap/.Search in Google Scholar
Michael Shanks – Retrieved 29 November, 2024, from https://web.stanford.edu/∼mshanks/MichaelShanks/62.html.Search in Google Scholar
Pergamon Digital Map 1.1 – Retrieved 29 November, 2024, from https://geoserver.dainst.org/catalogue/#/map/5548, with instructions available at https://www.dainst.blog/transpergmikro/pergamon/pergamon-map/.Search in Google Scholar
Pleiades – Retrieved 29 November, 2024, from https://pleiades.stoa.org.Search in Google Scholar
QGIS – Retrieved 29 November, 2024, from https://qgis.org/en/site.Search in Google Scholar
Topotijdreis – Retrieved 29 November, 2024, from https://www.topotijdreis.nl/.Search in Google Scholar
Bibliography
Anderson, M., Cairns, D., & Sprevak, M. (Eds.). (2022). Distributed cognition in classical antiquity. Edinburgh University Press.Search in Google Scholar
Bakhtin, M. (2008[1937]). Forms of time and of the chronotope in the novel (Фopмы вpeмeни и xpoнoтoпa в poмaнe). In M. Holquist (Ed.), The dialogic imagination (pp. 84–258). University of Texas Press.Search in Google Scholar
Basso, K. H. (1996). Wisdom sits in places. Landscape and language among the Western Apache. University of New Mexico Press.Search in Google Scholar
Behr, C. A. (1968). Aelius aristides and the sacred tales. Hakkert.Search in Google Scholar
Behr, C. A. (1981). P. Aelius Aristides. The complete works. Volume II. Orations XVII-LII. Brill.Search in Google Scholar
Bodenhamer, D. J. (2022). The varieties of deep maps. In D. J. Bodenhamer, J. Corrigan, & T. M. Harris (Eds.), Making deep maps. Foundations, approaches, and methods (pp. 1–16). Routledge.10.4324/9780367743840-1Search in Google Scholar
Bodenhamer, D. J., Corrigan, J., & Harris, T. M. (Eds.). (2010). The spatial humanities. GIS and the future of humanities scholarship. Indiana University Press.10.2979/5864.0Search in Google Scholar
Bodenhamer, D. J., Corrigan, J., & Harris, T. M. (Eds.). (2013). Deep mapping and the spatial humanities. International Journal of Humanities and Arts Computing, 7(1–2), 170–175. doi: 10.3366/ijhac.2013.0087.Search in Google Scholar
Bodenhamer, D. J., Corrigan, J., & Harris, T. M. (Eds.). (2015). Deep maps and spatial narratives. Indiana University Press.10.2307/j.ctt1zxxzr2Search in Google Scholar
Bodenhamer, D. J., Corrigan, J., & Harris, T. M. (Eds.). (2022). Making deep maps. Foundations, approaches, and methods. Routledge.10.4324/9780367743840Search in Google Scholar
Boehringer, E. (1966). Die Ausgrabungsarbeiten zu Pergamon im Jahre 1965. Archäologischer Anzeiger, 1966/4, 415–503.10.1515/9783112320211-001Search in Google Scholar
Buisseret, D. (2003). The mapmaker’s quest. Depicting new worlds in Renaissance Europe. Oxford University Press.Search in Google Scholar
Burkert, W. (1977). Griechische Religion der archaischen und klassischen Epoche. Kohlhammer.Search in Google Scholar
Caquard, S., & Dimitrovas, S. (2017). Story Maps & Co. The state of the art of online narrative cartography. Mappe Monde. Revue trimestrielle sur l’image géographique et les formes du territoire, 121, 1–16.10.4000/mappemonde.3386Search in Google Scholar
Casey, E. S. (1996). How to get from space to place in a fairly short stretch of time. Phenomenological prolegomena. In S. Feld & K. H. Basso (Eds.), Senses of place (pp. 13–52). School of American Research Press.Search in Google Scholar
Conze, A., & Schuchhardt, C. (1899). Vorläufiger Bericht über die Arbeiten zu Pergamon, 1886–1898. Barth & von Hirst.Search in Google Scholar
De Certeau, M. (1984). The practice of everyday life. University of California Press.Search in Google Scholar
Deetz, J. (1977). In small things forgotten. The archaeology of early American life. Anchor Books.10.2307/1594120Search in Google Scholar
De Luca, G. (1984). Das Asklepieion. Teil 4. Via Tecta und Hallenstraße. Die Funde, Altertümer von Pergamon XI. Walter de Gruyter.Search in Google Scholar
Deubner, O. (1938). Das Asklepieion von Pergamon; kurze vorläufige Beschreibung. Verlag für Kunstwissenschaft.Search in Google Scholar
Dickinson, S., & Telford, A. (2020). The visualities of digital story mapping. Teaching the ‘messiness’ of qualitative methods through story mapping technologies. Journal of Geography in Higher Education, 44, 441–457.10.1080/03098265.2020.1712686Search in Google Scholar
Dunn, S., Kadish, L., & Pasquier, M. (2013). A religious centre with a civic circumference. Towards the concept of a deep map of American religion. International Journal of Humanities and Arts Computing, 7(1–2), 190–200. doi: 10.3366/ijhac.2013.0089.Search in Google Scholar
Earley-Spadoni, T. (2017). Spatial history, deep mapping and digital storytelling. Archaeology’s future imagined through an engagement with the Digital Humanities. Journal of Archaeological Science, 30, 95–102. doi: 10.1016/j.jas.2017.05.003.Search in Google Scholar
Eve, S. (2014). Dead men’s eyes. Embodied GIS, mixed reality and landscape archaeology. Archaeopress.10.30861/9781407312910Search in Google Scholar
Fränkel, M. (1890/1895) Altertümer von Pergamon VIII. Die Inschriften von Pergamon. Teil 1. Bis zum Ende der Königzeit (1890). Teil 2. Römische Zeit. Inschriften auf Thon (1895). Von Spemann.Search in Google Scholar
Geertz, C. (1973). The interpretation of cultures. Basic Books.Search in Google Scholar
Giaccardi, E., & Fogli, D. (2008). Affective geographies. Toward a richer cartographic semantics for the geospatial web. Proceedings of the Workshop on Advanced Visual Interfaces AVI 08 Naples, ITA 2008 05 28 – 2008 05 30 (pp. 173–180).10.1145/1385569.1385598Search in Google Scholar
Gillings, M. (2012). Landscape phenomenology, GIS and the role of affordance. Journal of Archaeological Method & Theory, 19(4), 601–611. doi: 10.1007/s10816-012-9137-4.Search in Google Scholar
Gillings, M., Hacigüzeller, P., & Lock, G. R. (2019). Re-mapping archaeology. Critical perspectives, alternative mappings. Routledge.10.4324/9781351267724Search in Google Scholar
Gosden, C., & Marshall, Y. (1999). The cultural biography of objects. World Archaeology, 31(2), 169–178.10.1080/00438243.1999.9980439Search in Google Scholar
Gregory, I. N., & Geddes, A. (2014). Toward spatial humanities. Historical GIS and spatial history. Indiana University Press.10.2979/6100.0Search in Google Scholar
Habicht, C. (1969). Die Inschriften von Pergamon. Teil 3. Die Inschriften des Asklepieions, Altertümer von Pergamon VIII. Walter de Gruyter.Search in Google Scholar
Harman, G., & Witmore, C. L. (2023). Objects untimely. Object-oriented philosophy and archaeology. Polity Press.Search in Google Scholar
Harris, T. M. (2022). Deep-mapping the lived word. Immersive geographies, agency, and the virtual umwelt. In D. J. Bodenhamer, J. Corrigan, & T. M. Harris (Eds.), Making deep maps. Foundations, approaches, and methods (pp. 112–131). Routledge.10.4324/9780367743840-7Search in Google Scholar
Hepding, H. (1907). Die Arbeiten zu Pergamon 1904-1905, II. Die Inschrifiten, III. Die Einzelfunde, Mitteilungen des Deutschen Archäologischen Instituts, Athenische Abteilung, 32, 241–377, 378–415.Search in Google Scholar
Hiller von Gaertringen, F. (1929). Inscriptiones Graecae IV. Inscriptiones Argolidis, 2nd edn. Fasc. 1, Inscriptiones Epidauri. Berlin-Brandenburgische Akademie der Wissenschaften.Search in Google Scholar
Hoffmann, A., & De Luca, G. (2011). Das Asklepieion. Teil 5. Die Platzhallen und die zugehörigen Annexbauten in römischer Zeit, Altertümer von Pergamon XI. Walter de Gruyter.Search in Google Scholar
Hoffmann, S. (2023). Between deity and dedicator. The life and agency of Greek votive terracotta figurines. De Gruyter.10.1515/9783110770223Search in Google Scholar
Hoskins, J. (2006). Agency, biography and objects. In C. Y. Tilley, W. Keane, S. Küchler, M. Rowlands, & P. Spyer (Eds.), Handbook of material culture (pp. 74–84). SAGE.10.4135/9781848607972.n6Search in Google Scholar
Johnson, P. M. (2020). Affective geographies. Cervantes, emotion, and the literary Mediterranean. University of Toronto Press.10.3138/9781487536398Search in Google Scholar
Jones, C. P. (1998). Aelius Aristides and the Asklepieion. In H. Koester (Ed.), Pergamon citadel of the gods. Archaeological record, literary description, and religious development (pp. 63–77). Trinity Press International.Search in Google Scholar
Joyner, C. W. (1999). Shared traditions. Southern history and folk culture. University of Illinois Press.Search in Google Scholar
Kemp, K. (2022). Convergence: GIScience turns to the spatial humanities. In D. J. Bodenhamer, J. Corrigan, & T. M. Harris (Eds.), Making deep maps. Foundations, approaches, and methods (pp. 175–180). Routledge.10.4324/9780367743840-11Search in Google Scholar
Keweloh-Kaletta, A. (in press). Pergamenische Keramik im Kontext. Keramik aus späthellenistichen bis kaiserzeitlichen Siedlungsstraten am Osthang von Pergamon. Humboldt Universität, Berlin.Search in Google Scholar
Kranz, P. (2004). Pergameus Deus. Archäologische und numismatische Studien zu den Darstellungen des Asklepios in Pergamon während Hellenismus und Kaiserzeit. Bibliopolis.Search in Google Scholar
Lätzer-Lasar, A., & Williamson, C. G. (Eds.). (2024). Making place in the ancient city. Journal of Urban Archaeology, 9 (Special Issue).10.1484/J.JUA.5.137198Search in Google Scholar
Least Heat-Moon, W. (1991). PrairyErth (a deep map). Houghton Mifflin.Search in Google Scholar
Lefebvre, H. (1974). La production de l’espace. Anthropos.10.5565/rev/papers/v3n0.880Search in Google Scholar
Lewis, C. (2015). Archaeological excavation and deep mapping in historic rural communities. Humanities, 4, 393–417.10.3390/h4030393Search in Google Scholar
Lucas, G. (2001). Critical approaches to fieldwork: Contemporary and historical archaeological practice. Routledge.10.4324/9780203170007Search in Google Scholar
Mania, U. (2021). Der Survey im Umfeld des Asklepieions. In F. Pirson (Ed.), ‘Pergamon. Die Arbeiten in der Kampagne 2020’, Archäologischer Anzeiger 2021/2 (pp. 1–203, 249–258).Search in Google Scholar
Mania, U., & Pirson, F. (2022). Das Umfeld des Asklepieions. Untersuchungen an der Heiligen Straße. In F. Pirson (Ed.), “Pergamon. Die Arbeiten in der Kampagne 2021,” Archäologischer Anzeiger 2022/2 (pp. 302–391; 324–326).Search in Google Scholar
Mania, U., & Pirson, F. (2023). Das Umfeld des Asklepieions. Geophysikalische Untersuchungen an der Heiligen Straße und 3D-modellierung. In F. Pirson (Ed.), “Pergamon. Die Arbeiten in der Kampagne 2022,” Archäologischer Anzeiger 2023/2 (pp. 201–283; 234–236).Search in Google Scholar
Martinón-Torres, M. (2002). Chaîne opératoire. The concept and its applications within the study of technology. Gallaecia, 21, 29–43.Search in Google Scholar
Massey, D. (1994). Space, place and gender. University of Minnesota Press.Search in Google Scholar
Massey, D. (2005). For space. SAGE Publications Ltd.Search in Google Scholar
Mauntel, C. (2021). The T-O diagram and its religious connotations. A circumstantial case. In C. Mauntel (Ed.), Geography and religious knowledge in the medieval world (pp. 57–84). Walter de Gruyter.10.1515/9783110686159-003Search in Google Scholar
Meier, L. (2009). Inschriften aus dem Asklepieion von Pergamon. Chiron, 39, 395–408.Search in Google Scholar
Melfi, M. (2016). The archaeology of the Asclepieum of Pergamon. In D. A. Russell, M. Trapp, & H.-G. Nesselrath (Eds.), In praise of Asclepius. Aelius Aristides, selected prose hymns (pp. 89–114). Mohr Siebeck.Search in Google Scholar
Modeen, M., & Biggs, I. (2021). Deep mapping and slow residency. In Creative engagements with ecologies of place. Geopoetics, deep mapping and slow residencies (pp. 50–74). Routledge.10.4324/9781003089773-4Search in Google Scholar
Mukherjee, F. (2019). Exploring cultural geography field course using story maps. Journal of Geography in Higher Education, 43, 201–223.10.1080/03098265.2019.1597031Search in Google Scholar
Murrieta-Flores, P., Favila-Vásquez, M., & Flores-Morán, A. (2022). Indigenous deep mapping. A conceptual and representational analysis of space in Mesoamerica and New Spain. In D. J. Bodenhamer, J. Corrigan, & T. M. Harris (Eds.), Making deep maps. Foundations, approaches, and methods (pp. 78–111). Routledge.10.4324/9780367743840-6Search in Google Scholar
Oxx, K., Brimicombe, A., & Rush, J. (2013). Envisioning deep maps. Exploring the spatial navigation metaphor in deep mapping. International Journal of Humanities and Arts Computing, 7, 201–227. doi: 10.3366/ijhac.2013.0090.Search in Google Scholar
Petridou, G. (2016). Aelius aristides as informed patient and physician. In G. Petridou & C. Thumiger (Eds.), Homo patiens. Approaches to the patient in the ancient world (pp. 451–470). Brill.10.1163/9789004305564_020Search in Google Scholar
Petsalis-Diomidis, A. (2010). Truly beyond wonders. Aelius Aristides and the cult of Asklepios. Oxford University Press.Search in Google Scholar
Pitts, M., & Versluys, M. J. (2021). Objectscapes. A manifesto for investigating the impacts of object flows on past societies. Antiquity, 95, 367–381.10.15184/aqy.2020.148Search in Google Scholar
von Prott, H., & Kolbe, W. (1902). Die Arbeiten zu Pergamon 1900-1901, I. Die Inschriften, Mitteilungen des Deutschen Archäologischen Instituts, Athenische Abteilung, 27, 44–151.Search in Google Scholar
Quirós Castillo, J. A. (Ed.). (2024). Special issue: Microhistory and archaeology. Open Archaeology, February 2024. De Gruyter. https://www.degruyter.com/journal/key/opar/html#latestIssue.10.1515/opar-2024-0006Search in Google Scholar
Renfrew, C., & Bahn, P. G. (Eds.). (2013). Archaeology: the key concepts. Routledge: Taylor & Francis.10.4324/9780203491096Search in Google Scholar
Renfrew, C., & Scarre, C. (Eds.). (1998) Cognition and material culture. The archaeology of symbolic storage. McDonald Institute for Archaeological Research.Search in Google Scholar
Riethmüller, J. W. (2005). Asklepios. Heiligtümer und Kulte, 2 Bd., Studien zu antiken Heiligtümern, 2.1 & 2.2. Verlag Archäologie und Geschichte.Search in Google Scholar
Riethmüller, J. W. (2011). Das Asklepieion von Pergamon. In R. Grüßinger, V. Kästner, A. Scholl, I. Geske, & J. Laurentius (Eds.), Pergamon. Panorama der antiken Metropole. Begleitbuch zur Ausstellung (pp. 228–234). Imhof.Search in Google Scholar
Robertson, S., & Mullen, L. A. (2022). Navigating through narrative. In D. J. Bodenhamer, J. Corrigan, & T. M. Harris (Eds.), Making deep maps. Foundations, approaches, and methods (pp. 132–147). Routledge.10.4324/9780367743840-8Search in Google Scholar
Scully, V. J. (1962). The earth, the temple, and the gods. Greek sacred architecture. Yale University Press.Search in Google Scholar
Sebald, W. G. (1995). Die Ringe des Saturn. Eine englische Wallfahrt. Eichborn Verlag. (transl. English 1998, The Rings of Saturn, London).Search in Google Scholar
Smith, A. T., & Brookes, A. (2001). Holy ground. Theoretical issues relating to the landscape and material culture of ritual space objects. Archaeopress.10.30861/9781841712475Search in Google Scholar
Steketee, H. (2022, September 2). De grote versnelling. Hoe de ene crisis de volgende aanjaagt. Nieuwe Rotterdamse Courant (NRC). Retrieved from https://www.nrc.nl/nieuws/2022/09/02/de-grote-versnelling-hoe-de-ene-crisis-de-volgende-aanjaagt-a4140638.Search in Google Scholar
Strocka, V. M. (2012). Bauphasen des kaiserzeitlichen Asklepieions von Pergamon. Istanbuler Mitteilungen, 62, 199–287.Search in Google Scholar
Tilley, C. Y. (1994). A phenomenology of landscape. Places, paths, and monuments. Berg.Search in Google Scholar
Tilley, C. Y. (2008). Phenomenological approaches to landscape archaeology. In B. David & J. Thomas (Eds.), Handbook of landscape archaeology (pp. 271–276). Left Coast Press.Search in Google Scholar
Tuan, Y.-F. (1977). Space and place. The perspective of experience. University of Minnesota Press.Search in Google Scholar
Wheatley, D. (2014). Connecting landscapes with built environments. Visibility analysis, scale and the senses. In E. Paliou, U. Lieberwirth, & S. Polla (Eds.), Spatial analysis and social spaces. Interdisciplinary approaches to the interpretation of historic and prehistoric built environments (pp. 115–134). De Gruyter.10.1515/9783110266436.115Search in Google Scholar
Wheatley, D., & Gillings, M. (2000). Vision, perception and GIS. Developing enriched approaches to the study of archaeological visibility. In G. Lock (Ed.), Beyond the map. Archaeology and spatial technologies (pp. 1–27). IOS Press.Search in Google Scholar
Wiegand, T., & Weber, W. (1932). Zweiter Bericht über die Ausgrabungen in Pergamon 1928–32. Das Asklepieion, Abhandlungen der preussischen Akademie der Wissenschaften. Philosophisch-historische Klasse, 5, 1–55.Search in Google Scholar
Williamson, C. G. (2024). Making place with the divine. Urban ritual practices at regional sanctuaries in the Graeco-Roman world. Journal of Urban Archaeology, 9, 51–80.10.1484/J.JUA.5.137201Search in Google Scholar
Williamson, C. G. (in press). Timeless communities. Sanctuaries and the media of temporal belonging. In A. Lichtenberger & F. Mazzilli (Eds.), Belonging and sacred places in antiquity. Brill.Search in Google Scholar
Yarrow, T. (2003). Artefactual persons. The relational capacities of persons and things in the practice of excavation. Norwegian Archaeological Review, 36, 65–73. doi: 10.1080/00293650307296.Search in Google Scholar
Ziegenhaus, O. (1981). Das Asklepieion. Teil 3. Die Kultbauten aus römischer Zeit an der Ostseite des Heiligen Bezirks, Altertümer von Pergamon XI. Walter de Gruyter.Search in Google Scholar
Ziegenhaus, O., & de Luca, G. (1968). Das Asklepieion. Teil 1. Der südliche Temenosbezirk in hellenistischer und frührömische, Altertümer von Pergamon XI. Walter de Gruyter.Search in Google Scholar
Ziegenhaus, O., & de Luca, G. (1975). Das Asklepieion. Teil 2. Der nördliche Temenosbezirk und angrenzende Anlagen in hellenistischer und frührömischer Zeit, Altertümer von Pergamon XI. Walter de Gruyter.Search in Google Scholar
© 2025 the author(s), published by De Gruyter
This work is licensed under the Creative Commons Attribution 4.0 International License.
Articles in the same Issue
- Research Articles
- Etched in Stone: The Kevermes Stone Stela From the Great Hungarian Plain
- Waste Around Longhouses: Taphonomy on LBK Settlement in Hlízov
- Raw Materials and Technological Choices: Case Study of Neolithic Black Pottery From the Middle Yangtze River Valley of China
- Disentangling Technological Traditions: Comparative Analysis of Chaînes Opératoires of Painted Pre-Hispanic Ceramics From Nariño, Colombia
- Ancestral Connections: Re-Evaluating Concepts of Superimpositioning and Vandalism in Rock Art Studies
- Disability and Care in Late Medieval Lund, Sweden: An Analysis of Trauma and Intersecting Identities, Aided by Photogrammetric Digitization and Visualization
- Assessing the Development in Open Access Publishing in Archaeology: A Case Study From Norway
- Decorated Standing Stones – The Hagbards Galge Monument in Southwest Sweden
- Geophysical Prospection of the South-Western Quarter of the Hellenistic Capital Artaxata in the Ararat Plain (Lusarat, Ararat Province, Armenia): The South-West Quarter, City Walls and an Early Christian Church
- Lessons From Ceramic Petrography: A Case of Technological Transfer During the Transition From Late to Inca Periods in Northwestern Argentina, Southern Andes
- An Experimental and Methodological Approach of Plant Fibres in Dental Calculus: The Case Study of the Early Neolithic Site of Cova del Pasteral (Girona, Spain)
- Bridging the Post-Excavation Gaps: Structured Guidance and Training for Post-Excavation in Archaeology
- Everyone Has to Start Somewhere: Democratisation of Digital Documentation and Visualisation in 3D
- The Bedrock of Rock Art: The Significance of Quartz Arenite as a Canvas for Rock Art in Central Sweden
- The Origin, Development and Decline of Lengyel Culture Figurative Finds
- New “Balkan Fashion” Developing Through the Neolithization Process: The Ceramic Annulets of Amzabegovo and Svinjarička Čuka
- From a Medieval Town to the Modern Fortress of Rosas (Girona-Spain). Combining Geophysics and Archaeological Excavation to Understand the Evolution of a Strategic Coastal Settlement
- Technical Transfers Between Chert Knappers: Investigating Gunflint Manufacture in the Eastern Egyptian Desert (Wadi Sannur, Northern Galala, Egypt)
- Early Neolithic Pottery Production in the Maltese Islands: Initiating a Għar Dalam and Skorba Pottery Fabric Classification
- Revealing the Origins: An Interdisciplinary Study Into the Provenance of Sacral Microarchitecture–The Unique Case of the Church Model From Žatec in Bohemia
- An Analogical and Analytical Approach to the Burçevi Monumental Tomb
- A Glimpse at Raw Material Economy and Production of Chipped Stones at the Neolithic (Starčevo) Site of Svinjarička Čuka, South Serbia
- Archaeological Lithotheques of Siliceous Rocks in Spain: First Diagnosis of the Lithotheque Thematic Network
- Mapping Changes in Settlement Number and Demography in the South of Israel from the Hellenistic to the Early Islamic Period
- Review Article
- Structural Measures Against the Risks of Flash Floods in Patara and Consequent Considerations Regarding the Location of the Oracle Sanctuary of Apollo
- Commentary Article
- A Framework for Archaeological Involvement with Human Genetic Data for European Prehistory
- Special Issue on Digital Religioscapes: Current Methodologies and Novelties in the Analysis of Sacr(aliz)ed Spaces, edited by Anaïs Lamesa, Asuman Lätzer-Lasar - Part II
- Goats and Goddesses. Digital Approach to the Religioscapes of Atargatis and Allat
- Conceiving Elements of Divinity: The Use of the Semantic Web for the Definition of Material Religiosity in the Levant During the Second Millennium BCE
- Deep Mapping the Asklepieion of Pergamon: Charting the Path Through Challenges, Choices, and Solutions
- Special Issue on Engaging the Public, Heritage and Educators through Material Culture Research, edited by Katherine Anne Wilson, Christina Antenhofer, & Thomas Pickles
- Inventories as Keys to Exploring Castles as Cultural Heritage
- Hohensalzburg Digital: Engaging the Public via a Local Time Machine Project
- Monastic Estates in the Wachau Region: Nodes of Exchange in Past and Present Days
- “Meitheal Adhmadóireachta” Exploring and Communicating Prehistoric Irish Woodcraft Through Remaking and Shared Experience
- Community, Public Archaeology, and Co-construction of Knowledge Through the Educational Project of a Rural Mountain School
- Valuing Material Cultural Heritage: Engaging Audience(s) Through Development-Led Archaeological Research
- Engaging the Public Through Prehistory: Experiences From an Inclusive Perspective
- Material Culture, the Public, and the Extraordinary – “Unloved” Museums Objects as the Tool to Fascinate
- Archaeologists on Social Media and Its Benefits for the Profession. The Results and Lessons Learnt from a Questionnaire
- Special Issue on Network Perspectives in the Archaeology of the Ancient Near East and Eastern Mediterranean, edited by Maria Gabriella Micale, Helen Dawson, & Antti A. Lahelma
- Networks of Pots: The Usage of Ceramics in Network Analysis in Mediterranean Archaeology
- Networks of Knowledge, Materials, and Practice in the Neolithic Zagros
- Weak Ties on Old Roads: Inscribed Stopping-Places and Complex Networks in the Eastern Desert of Graeco-Roman Egypt
- Mediterranean Trade Networks and the Diffusion and Syncretism of Art and Architecture Styles at Delos
- People and Things on the Move: Tracking Paths With Social Network Analysis
- Networks and the City: A Network Perspective on Procopius De Aed. I and the Building of Late Antique Constantinople