Modeling and simulation sedimentation process using finite difference method
-
Mohammed Abed Naser
 and
Khalid Adel Abdulrazzaq
and
Khalid Adel Abdulrazzaq

Abstract
The goal of this research is to develop a numerical model that can be used to simulate the sedimentation process under two scenarios: first, the flocculation unit is on duty, and second, the flocculation unit is out of commission. The general equation of flow and sediment transport were solved using the finite difference method, then coded using Matlab software. The result of this study was: the difference in removal efficiency between the coded model and operational model for each particle size dataset was very close, with a difference value of +3.01%, indicating that the model can be used to predict the removal efficiency of a rectangular sedimentation basin. The study also revealed that the critical particle size was 0.01 mm, which means that most particles with diameters larger than 0.01 mm settled due to physical force, while most particles with diameters smaller than 0.01 mm settled due to flocculation process. At 10 m from the inlet zone, the removal efficiency was more than 60% of the total removal rate, indicating that increasing basin length is not a cost-effective way to improve removal efficiency. The influence of the flocculation process appears at particle sizes smaller than 0.01 mm, which is a small percentage (10%) of sieve analysis test. When the percentage reaches 20%, the difference in accumulative removal efficiency rises from +3.57% to 11.1% at the AL-Muthana sedimentation unit.
1 Introduction
Sedimentation basins are one of the most important units of a water treatment plant (WTP), with the goal of removing the greatest amount of suspended solids in the water by passing it through a sedimentation basin in a specific amount of time [1]. The presence of suspended solids in water has a negative impact on water quality and its uses because it provides suitable conditions for the absorption of biological and chemical substances. These conditions provide microorganisms with a barrier against the chemical effect of chlorine, and the removal of these substances is an important process that receives a lot of attention in WTPs [2]. The concept of sedimentation process is based on the idea that if the weight of the suspended particles in water was greater than the buoyancy force, the particles would fall freely to the bottom of the basin and if the weight force was insufficient to achieve free settling, in this case the flocculation process would appear to improve the sedimentation process by flocculating the collided particles to form a large mass [3].
Since the nature of water is variable in terms of properties, the mathematical modeling process provides a good alternative for observing the dynamic behavior of water in sedimentation basins and predicting the performance of treatment units by describing flow patterns based on momentum and continuity equations and then these models are tested using simulation tools [4]. Simulating the operation of a real-world process or system over time is known as a simulation where the models are required for simulations in which the model represents the key characteristics or behaviors of the selected system or process, whereas the simulation represents the model’s evolution over time [5]. Due to the importance of the sedimentation process, many numerical models have been developed to simulate the sedimentation process, providing a better understanding of flow characteristics and sediment transport, as well as studying the factors that affect the sedimentation process by solving flow governing equations using the finite element method and the finite difference method [6]. The goal of this research is to create a numerical model that can be used to simulate sedimentation and flocculation units and predict removal efficiency using the finite difference method and Matlab software.
2 Materials and methods
The Leibniz integral rule was used to derive the main equations governing the flow process.
Depth-averaged continuity flow equation:
(1)Depth-averaged momentum flow equation:
(2)Sediment transport equation:
(3)Sediment carrying capacity
(4)Sediment continuity equation:
(5)The finite differential method was used to solve the unknown limits in momentum and sediment transport equations using Taylor series.
The experimental model’s results were compared to the results of an operating model using the same data and conditions [7].
The simulation process was applied on the sedimentation unit of Al-Muthanna WTP using two scenarios; the first flocculation unit is operational, while the second is not.
Operational and coded models’ data.
Table 1 and Figure 1 listed the input data of operating model and definition sketch of operation model that come from ref. [7], while the input data of operating model of AL-Muthana WTP were same except for the basin dimensions which were: length: L = 46 m, width: B = 11 m, longitudinal slope 0.01%, total tank elevation = 4.5 m, tank elevation at bottom: zg = 2 m, actual water depth: h = 2 m, manning coefficient: n = 0.012 and flow rate for one basin was 0.231
Data form operational model [7]
| Data input | Data description | Value | |||
|---|---|---|---|---|---|
| Coefficient | n | Mining coefficient reference | 0.011 | ||
| k | Represents the flow’s ability to carry sediment | 0.01 | |||
| k 1 | Empirical coefficient | 0.513 | |||
| k 2 | Empirical coefficient | 0.008 | |||
| nd | Between 1.8 and 2.0 empirical exponent | 1.9 | |||
| dr | Represents a reference diameter ranging from 0.011 to 0.022. | 0.022 | |||
| r | Empirical exponent between 3 and 5 | 4.65 | |||
| S P | 1.5 | ||||
| B | The ratio of deposited material at tank bottom to the remaining matter in the flow | 1.2 | |||
| ∆t | Time interval | 65 (s) | |||
| ∆x | Space interval | 0.1 (m) | |||
| Dimensions | B | Tank width | 3 (m) | ||
| L | Tank length | 30 (m) | |||
| h | Tank elevation | 4 (m) | |||
| H | Actual water depth | 2 (m) | |||
| zg | Tank elevation at bottom | 2 (m) | |||
| Flow characteristics | Q | Influent discharge to units | 0.088 (m3/s) | ||
| S | Influent suspended solid concentration | 0.5 (kg/m3) | |||
|
|
Dry sediment mass density | 1,200 (kg/m3) | |||
|
|
Water mass density | 1,000 (kg/m3) | |||
| Group | D (mm) | Partial settling velocity (m/s) | PSD% |
|---|---|---|---|
| 1 | <0.0052 | 0.0000095 | 2 |
| 2 | 0.0052–0.01 | 0.0000536 | 8 |
| 3 | 0.01–0.026 | 0.000299 | 17 |
| 4 | 0.026–0.05 | 0.00134 | 22 |
| 5 | 0.05–0. 12 | 0.00536 | 20 |
| 6 | 0. 12–0. 26 | 0.0172 | 14 |
| 7 | 0. 26–0.52 | 0.0404 | 11 |
| 8 | 0.52–1 | 0.0828 | 6 |
![Figure 1
Definition sketch [7].](/document/doi/10.1515/jmbm-2022-0028/asset/graphic/j_jmbm-2022-0028_fig_001.jpg)
Definition sketch [7].
3 Results and discussion
Depending on the previous steps, the removal efficiency of the rectangular sediment basin was predicted using Matlab software in which the flow and design characteristics represent the main influence factor to build this model. The applied part consisted of: first ensuring the accuracy of the model’s work by comparing with an operational model, and second simulating the sedimentation unit of AL-Muthanna WTP to predict the removal efficiency with and without flocculation unit. This model will aid researchers in predicting the removal efficiency and amount of sludge generated in the rectangular sedimentation basins.
Table 2 and Figures 2–5 list the results of comparison in removal efficiency between coded model and operational model for each dataset of particle size and the results were very close with small difference indicating that the models can be used to predict the removal efficiency of rectangular sedimentation basin, so that the total accumulative removal efficiency for these models were 73.76 and 76.77%, respectively.
Removal efficiency for each particle size of operational and coded models with and without flocculation unit
| Data | Particle size (mm) | RE operation (%) | RE develop (%) | RE with floc. |
|---|---|---|---|---|
| 1 | <0.005 | 1.03 | 1.135 | 17.69 |
| 2 | 0.005–0.01 | 6.4 | 6.36 | 25.67 |
| 3 | 0.01–0.025 | 30.76 | 30.73 | 31.26 |
| 4 | 0.025–0.05 | 80.69 | 80.87 | 82.15 |
| 5 | 0.05–0.1 | 99.86 | 99.87 | 99.89 |
| 6 | 0.1–0.25 | 100 | 100 | 100 |
| 7 | 0.25–0.5 | 100 | 100 | 100 |
| 8 | 0.5–1 | 100 | 100 | 100 |
| Total | 73.76% | 74.5% | 76.77% |

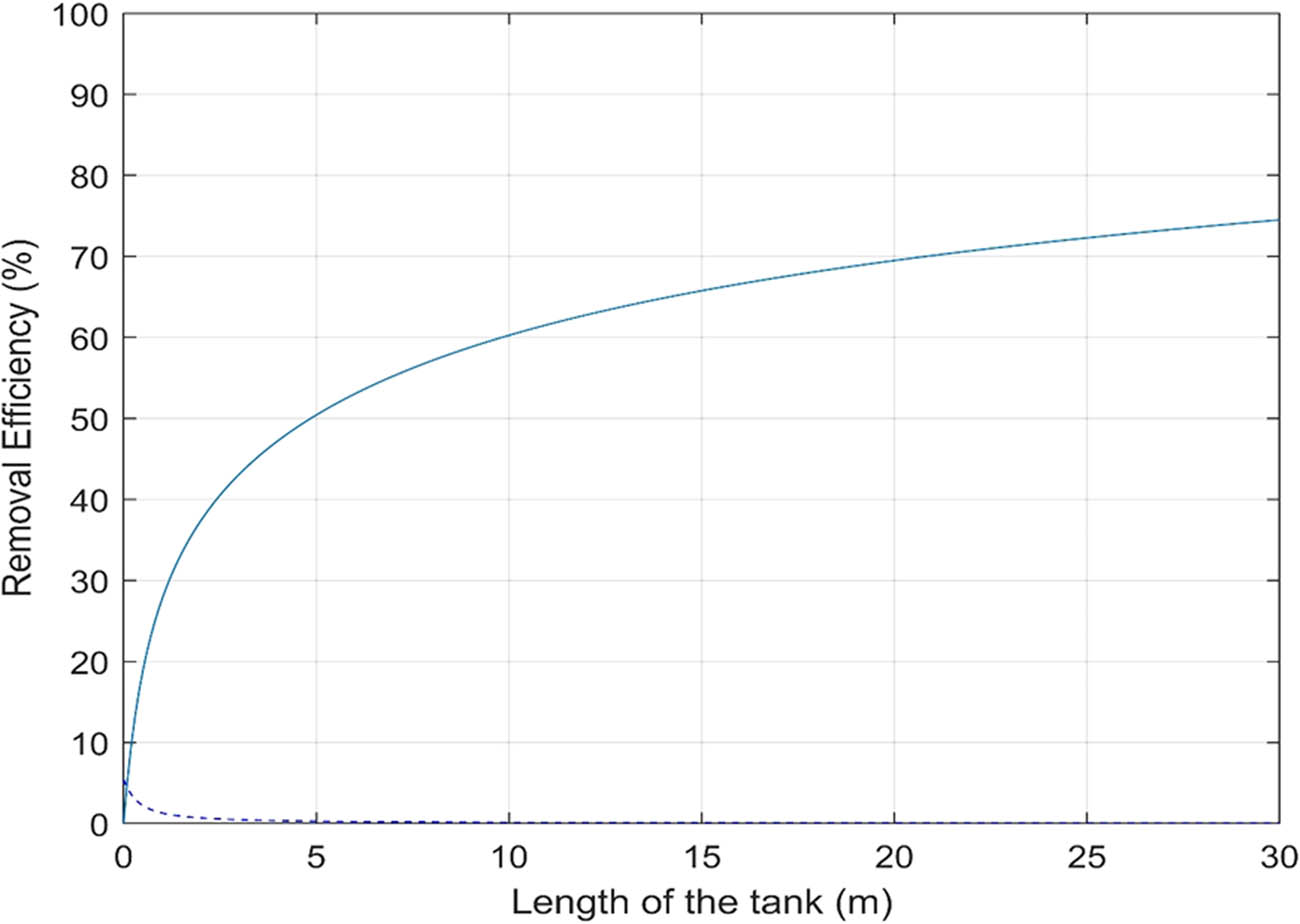
Accumulative removal efficiency with flocculation process for coded model.

Removal efficiency for each particle size with flocculation process for coded model.
Accumulative removal efficiency without flocculation process for coded model.

Removal efficiency for each particle size without flocculation process for coded model.
Table 3 and Figures 6 and 7 list the removal rate of each particle size and accumulative removal efficiency of AL-Muthana WTP sedimentation basin with two scenario: First, the flocculation unit was on duty, with accumulative rate of 86.28%, and second, the flocculation unit was out of service with accumulative rate of 82.72% in which the influence of flocculation unit on removal efficiency for each dataset of particle size of 0.005–0.01 mm was very effective. So this stage appears the important in the flocculation process to improve settling of the colloidal particles. Therefore, the range of removal efficiency at these diameters was 34.14–47.03% at first approach (flocculation unit on duty) and 2.455–13.14% at second approach (flocculation unit out of service). The flocculation unit improves the sedimentation process by converting colloidal particles that cannot settle naturally to floc that can fall freely due to physical forces [8]. The table also shows that the 0.01 mm diameter represents the critical particle size, which means that most of the particles with diameters greater than 0.01 mm settled due to physical force, while most of the particles with diameters less than .01 mm settled due to the flocculation process.
Two scenarios of AL-Muthana WTP removal efficiency
| Data set | Particle size (mm) | Particle size disruption (%) | Removal efficiency without flocculation unit (%) | Removal efficiency (coded model) with flocculation (%) |
|---|---|---|---|---|
| 1 | <0.005 | 2 | 2.455 | 34.14 |
| 2 | 0.005–0.01 | 8 | 13.14 | 47.03 |
| 3 | 0.01–0.025 | 17 | 54.46 | 55.2 |
| 4 | 0.025–0.05 | 22 | 97.09 | 97.51 |
| 5 | 0.05–0.1 | 20 | 100 | 100 |
| 6 | 0.1–0.25 | 14 | 100 | 100 |
| 7 | 0.25–0.5 | 11 | 100 | 100 |
| 8 | 0.5–1 | 6 | 100 | 100 |
| Total accumulative | 2 | 82.72 | 86.28 |

Removal efficiency for each particle size of AL-Muthana sedimentation unit with flocculation process.

Removal efficiency for each particle size of AL-Muthana sedimentation basin without flocculation process.
Figure 8 depicts the relationship between accumulative removal rate and tank length with and without flocculation process in which the accumulative removal efficiency at 10 m from inlet zone was achieved to be more than 60% of the total accumulative removal rate which means that increasing the basin length is not a cost-effective way to improve the removal efficiency, this was consistent with the researcher’s findings [9].

Difference in accumulative removal efficiency between first and second scenarios.
The figure also shows that the difference between the accumulative removal efficiency for first and second scenarios was +3.56% which represents a small value because the influence of flocculation process appears at dataset of particle size of 0.01 mm in which these data have small percentage (10%) of total particle size disruption of sieve analysis test, therefore the difference in removal rate was small. When the percentage of these particle size disruption rises to 20% as a result of sieve analysis test, the difference in accumulative removal efficiency between the scenarios will be raised [10]. In other words, because the concentration of the suspended materials with diameters of 0.01 mm was very low at influent raw water, the difference in removal efficiency between the scenarios was small; however, when the percentage of these particles in the coming flow is high, the effect of the flocculation process will be visible due to the large difference in removal percentage [11].
4 Conclusion
The difference in accumulative removal efficiency between coded and operational models was very close, with values of +3.01% and +0.74% in cases of flocculation unit on duty and flocculation unit off duty, respectively, indicating that the model can be used to predict removal rate at rectangular sedimentation units.
The accumulative removal efficiency at 10 m from the inlet zone was achieved to be more than 60% of the total accumulative removal rate of AL-Muthana sedimentation basin that means increasing basin length is not a cost-effective way to improve the removal efficiency.
The 0.01 mm diameter represents the critical particle size, which means that most of the particles with diameters greater than 0.01 mm settled due to physical force, while most of the particles with diameters less than 0.01 mm settled due to the flocculation process.
The difference in accumulative removal efficiency between the first and second scenarios of the AL-Muthana WTP sedimentation unit was +3.56% which is a small value because the influence of the flocculation process appears at particle sizes smaller than 0.01 mm, which is a small percentage (10%) of sieve analysis test. When the percentage reaches 20%, the difference in accumulative removal efficiency rises to 11.1%.
-
Funding information: The authors state no funding involved.
-
Author contributions: All authors have accepted responsibility for the entire content of this manuscript and approved its submission.
-
Conflict of interest: Authors state no conflict of interest.
References
[1] Liu YL, Lv B, Zhang P, Wei WL. 2D simulation of flow field of horizontal sedimentation tank. In: Applied mechanics and materials. Trans Tech Publications Ltd; 2013. Vol. 256, p. 2598–601.10.4028/www.scientific.net/AMM.256-259.2598Search in Google Scholar
[2] Heckmann T, Cavalli M, Cerdan O, Foerster S, Javaux M, Lode E, et al. Indices of sediment connectivity: opportunities, challenges and limitations. Earth-Sci Rev. 2018 Dec 1;187:77–108.10.1016/j.earscirev.2018.08.004Search in Google Scholar
[3] Saritha V, Srinivas N, Srikanth Vuppala NV. Analysis and optimization of coagulation and flocculation process. Appl Water Sci. 2017 Mar;7(1):451–60.10.1007/s13201-014-0262-ySearch in Google Scholar
[4] Hidayah EN, Hendriyanto O. Hydrodynamic model of sedimentation and disinfection to predict water quality in water treatment plant. Int J Sci Technol Soc. 2014 Jun 20;2(4):73–7.10.11648/j.ijsts.20140204.13Search in Google Scholar
[5] Saeedi E, Behnamtalab E, Salehi Neyshabouri SA. Numerical simulation of baffle effect on the performance of sedimentation basin. Water Environ J. 2020 May;34(2):212–22.10.1111/wej.12454Search in Google Scholar
[6] Naser G, Karney BW, Salehi AA. Two-dimensional simulation model of sediment removal and flow in rectangular sedimentation basin. J Environ Eng. 2005 Dec;131(12):1740–9.10.1061/(ASCE)0733-9372(2005)131:12(1740)Search in Google Scholar
[7] Jin YC, Guo QC, Viraraghavan T. Modeling of class I settling tanks. J Environ Eng. 2000 Aug;126(8):754–60.10.1061/(ASCE)0733-9372(2000)126:8(754)Search in Google Scholar
[8] Abd Nasier M, Abdulrazzaq KA. Conventional water treatment plant, principles, and important factors influence on the efficiency. Des Eng. 2021 Nov 24;16009–27.Search in Google Scholar
[9] Sarveram H, Rostami F, Shahrokhi M. 1D numerical modeling of sediment pattern in settling basins. Amirkabir J Civ Eng. 2019 Oct 23;51(4):781–92.Search in Google Scholar
[10] Steffler PM, Yee-Chung J. Depth averaged and moment equations for moderately shallow free surface flow. J Hydr Res. 1993 Jan 1;31(1):5–17.10.1080/00221689309498856Search in Google Scholar
[11] Guo QC, Jin YC. Estimating coefficients in one-dimensional depth-averaged sediment transport model. Can J Civ Eng. 2001 Jun 1;28(3):536.10.1139/l00-120Search in Google Scholar
© 2022 Mohammed Abed Naser and Khalid Adel Abdulrazzaq, published by De Gruyter
This work is licensed under the Creative Commons Attribution 4.0 International License.
Articles in the same Issue
- Research Articles
- Calcium carbonate nanoparticles of quail’s egg shells: Synthesis and characterizations
- Effect of welding consumables on shielded metal arc welded ultra high hard armour steel joints
- Stress-strain characteristics and service life of conventional and asphaltic underlayment track under heavy load Babaranjang trains traffic
- Corrigendum to: Statistical mechanics of cell decision-making: the cell migration force distribution
- Prediction of bearing capacity of driven piles for Basrah governatore using SPT and MATLAB
- Investigation on microstructural features and tensile shear fracture properties of resistance spot welded advanced high strength dual phase steel sheets in lap joint configuration for automotive frame applications
- Experimental and numerical investigation of drop weight impact of aramid and UHMWPE reinforced epoxy
- An experimental study and finite element analysis of the parametric of circular honeycomb core
- The study of the particle size effect on the physical properties of TiO2/cellulose acetate composite films
- Hybrid material performance assessment for rocket propulsion
- Design of ER damper for recoil length minimization: A case study on gun recoil system
- Forecasting technical performance and cost estimation of designed rim wheels based on variations of geometrical parameters
- Enhancing the machinability of SKD61 die steel in power-mixed EDM process with TGRA-based multi criteria decision making
- Effect of boron carbide reinforcement on properties of stainless-steel metal matrix composite for nuclear applications
- Energy absorption behaviors of designed metallic square tubes under axial loading: Experiment-based benchmarking and finite element calculation
- Synthesis and study of magnesium complexes derived from polyacrylate and polyvinyl alcohol and their applications as superabsorbent polymers
- Artificial neural network for predicting the mechanical performance of additive manufacturing thermoset carbon fiber composite materials
- Shock and impact reliability of electronic assemblies with perimeter vs full array layouts: A numerical comparative study
- Influences of pre-bending load and corrosion degree of reinforcement on the loading capacity of concrete beams
- Assessment of ballistic impact damage on aluminum and magnesium alloys against high velocity bullets by dynamic FE simulations
- On the applicability of Cu–17Zn–7Al–0.3Ni shape memory alloy particles as reinforcement in aluminium-based composites: Structural and mechanical behaviour considerations
- Mechanical properties of laminated bamboo composite as a sustainable green material for fishing vessel: Correlation of layer configuration in various mechanical tests
- Singularities at interface corners of piezoelectric-brass unimorphs
- Evaluation of the wettability of prepared anti-wetting nanocoating on different construction surfaces
- Review Article
- An overview of cold spray coating in additive manufacturing, component repairing and other engineering applications
- Special Issue: Sustainability and Development in Civil Engineering - Part I
- Risk assessment process for the Iraqi petroleum sector
- Evaluation of a fire safety risk prediction model for an existing building
- The slenderness ratio effect on the response of closed-end pipe piles in liquefied and non-liquefied soil layers under coupled static-seismic loading
- Experimental and numerical study of the bulb's location effect on the behavior of under-reamed pile in expansive soil
- Procurement challenges analysis of Iraqi construction projects
- Deformability of non-prismatic prestressed concrete beams with multiple openings of different configurations
- Response of composite steel-concrete cellular beams of different concrete deck types under harmonic loads
- The effect of using different fibres on the impact-resistance of slurry infiltrated fibrous concrete (SIFCON)
- Effect of microbial-induced calcite precipitation (MICP) on the strength of soil contaminated with lead nitrate
- The effect of using polyolefin fiber on some properties of slurry-infiltrated fibrous concrete
- Typical strength of asphalt mixtures compacted by gyratory compactor
- Modeling and simulation sedimentation process using finite difference method
- Residual strength and strengthening capacity of reinforced concrete columns subjected to fire exposure by numerical analysis
- Effect of magnetization of saline irrigation water of Almasab Alam on some physical properties of soil
- Behavior of reactive powder concrete containing recycled glass powder reinforced by steel fiber
- Reducing settlement of soft clay using different grouting materials
- Sustainability in the design of liquefied petroleum gas systems used in buildings
- Utilization of serial tendering to reduce the value project
- Time and finance optimization model for multiple construction projects using genetic algorithm
- Identification of the main causes of risks in engineering procurement construction projects
- Identifying the selection criteria of design consultant for Iraqi construction projects
- Calibration and analysis of the potable water network in the Al-Yarmouk region employing WaterGEMS and GIS
- Enhancing gypseous soil behavior using casein from milk wastes
- Structural behavior of tree-like steel columns subjected to combined axial and lateral loads
- Prospect of using geotextile reinforcement within flexible pavement layers to reduce the effects of rutting in the middle and southern parts of Iraq
- Ultimate bearing capacity of eccentrically loaded square footing over geogrid-reinforced cohesive soil
- Influence of water-absorbent polymer balls on the structural performance of reinforced concrete beam: An experimental investigation
- A spherical fuzzy AHP model for contractor assessment during project life cycle
- Performance of reinforced concrete non-prismatic beams having multiple openings configurations
- Finite element analysis of the soil and foundations of the Al-Kufa Mosque
- Flexural behavior of concrete beams with horizontal and vertical openings reinforced by glass-fiber-reinforced polymer (GFRP) bars
- Studying the effect of shear stud distribution on the behavior of steel–reactive powder concrete composite beams using ABAQUS software
- The behavior of piled rafts in soft clay: Numerical investigation
- The impact of evaluation and qualification criteria on Iraqi electromechanical power plants in construction contracts
- Performance of concrete thrust block at several burial conditions under the influence of thrust forces generated in the water distribution networks
- Geotechnical characterization of sustainable geopolymer improved soil
- Effect of the covariance matrix type on the CPT based soil stratification utilizing the Gaussian mixture model
- Impact of eccentricity and depth-to-breadth ratio on the behavior of skirt foundation rested on dry gypseous soil
- Concrete strength development by using magnetized water in normal and self-compacted concrete
- The effect of dosage nanosilica and the particle size of porcelanite aggregate concrete on mechanical and microstructure properties
- Comparison of time extension provisions between the Joint Contracts Tribunal and Iraqi Standard Bidding Document
- Numerical modeling of single closed and open-ended pipe pile embedded in dry soil layers under coupled static and dynamic loadings
- Mechanical properties of sustainable reactive powder concrete made with low cement content and high amount of fly ash and silica fume
- Deformation of unsaturated collapsible soils under suction control
- Mitigation of collapse characteristics of gypseous soils by activated carbon, sodium metasilicate, and cement dust: An experimental study
- Behavior of group piles under combined loadings after improvement of liquefiable soil with nanomaterials
- Using papyrus fiber ash as a sustainable filler modifier in preparing low moisture sensitivity HMA mixtures
- Study of some properties of colored geopolymer concrete consisting of slag
- GIS implementation and statistical analysis for significant characteristics of Kirkuk soil
- Improving the flexural behavior of RC beams strengthening by near-surface mounting
- The effect of materials and curing system on the behavior of self-compacting geopolymer concrete
- The temporal rhythm of scenes and the safety in educational space
- Numerical simulation to the effect of applying rationing system on the stability of the Earth canal: Birmana canal in Iraq as a case study
- Assessing the vibration response of foundation embedment in gypseous soil
- Analysis of concrete beams reinforced by GFRP bars with varying parameters
- One dimensional normal consolidation line equation